101


10
0
20
30
40
19.7
0495 96 97 98 99 00 01 02
33.3
35.6
26.2
30.2
3.5
8.7
28.4
38.4
15.4
03
2.0
4.0
6.0
8.0
0
Machinery and equipment
Land, buildings and improvements
04
3.8
95 96 97 98 99 00 01 02
3.6
3.0
4.5
4.0
3.4
6.7
7.3
4.7
03
3.7
1.0
2.0
3.0
5.0
4.0
00495 96 97 98 99 00 01 02
4.8
1.3
2.32.5
3.1
3.93.8
1.8
4.0
03
4.4
9
18
27
36
004
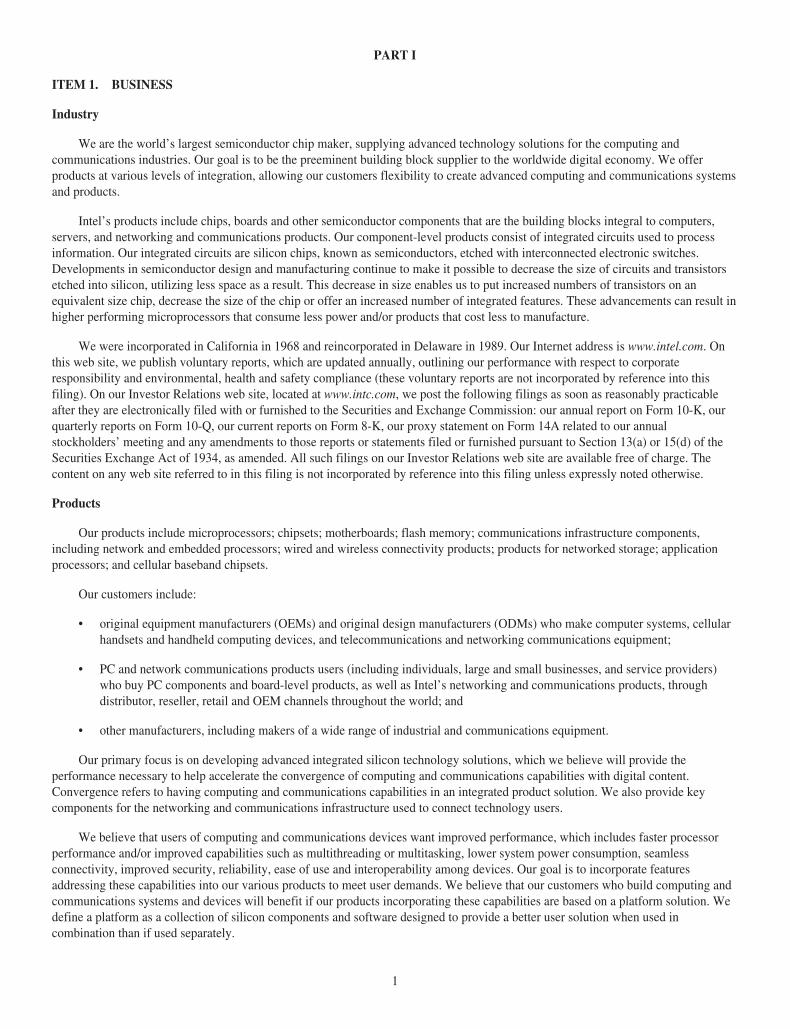
34.2
95 96 97 98 99 00 01 02
16.2
20.8
25.126.3
29.4
33.7
26.5 26.8
03
30.1
0.4
0.8
1.2
1.6
004
1.16
95 96 97 98 99 00 01 02
0.50
0.73
0.97
0.86 0.85
1.05
1.51
0.19
0.46
03
25
50
75
100
0
20%
Americas
Europe
Japan
94 99 04
43%
23%
51%
27% 27%
14%
8%
23%
45%
23%
9%7%
Diluted Earnings per Share†
Dollars, adjusted for stock splitsAmortization of goodwill reduced earnings per share in 2001 by $0.22 ($0.18 in 2000 and $0.05 in 1999). Goodwill is no longer amortized, beginning in 2002.
Geographic Breakdown of RevenuePercent
Net RevenueDollars in billions
Capital Additions to Property, Plant and EquipmentDollars in billions
Research and Development†
Dollars in billionsExcluding purchased in-process research and development
Return on Average Stockholders’ EquityPercent †
†
AsiaPacific
-
We ended 2004 with double-digit revenue gains, and robustdemand for Intel®architecture products across all geographies.
Our new products, global presence and investments in manufacturing capacity allowed us to post
record revenue for 2004 of $34.2 billion, up 13.5% from 2003. Net income for 2004 was $7.5 billion,
up 33% from 2003. During the year, we paid record cash dividends of $1 billion, announced two
doublings of our cash dividend and used $7.5 billion to repurchase 301 million shares of common
stock. We are optimistic going into 2005 and expect continued growth based on the momentum of our
current products and the introduction of dual-core microprocessors across a range of platforms.‡
Past performance does not guarantee future results.
This Annual Report to Stockholders contains forward-looking statements, and actual results could differ materially. Risk factors that could cause actual results todiffer are set forth in the “Business Outlook” section and throughout Intel’s 2004 Form 10-K, which is included in this Annual Report.
On the cover: Silicon technology from Intel is at the heart of a global digital transformation. We are proud that our silicon products are the buildingblocks for innovative products that help improve how people work, play, learn and communicate in our increasingly connected world.
‡
Financial Results


UNITED STATES SECURITIES AND EXCHANGE COMMISSIONWashington, D.C. 20549
FORM 10-K(Mark One)
È Annual Report Pursuant to Section 13 or 15(d) of the Securities Exchange Act of 1934For the fiscal year ended December 25, 2004.
‘ Transition Report Pursuant to Section 13 or 15(d) of the Securities Exchange Act of 1934For the transition period from ____________________ to ____________________.
Commission File Number 0-06217
INTEL CORPORATION(Exact name of registrant as specified in its charter)
Delaware 94-1672743(State or other jurisdiction ofincorporation or organization)
(I.R.S. EmployerIdentification No.)
2200 Mission College Boulevard, Santa Clara, California 95052-8119(Address of principal executive offices) (Zip Code)
Registrant’s telephone number, including area code (408) 765-8080
Securities registered pursuant to Section 12(b) of the Act:None
Securities registered pursuant to Section 12(g) of the Act:Common stock, $0.001 par value
Indicate by check mark whether the registrant: (1) has filed all reports required to be filed by Section 13 or 15(d) of the SecuritiesExchange Act of 1934 during the preceding 12 months (or for such shorter period that the registrant was required to file such reports),and (2) has been subject to such filing requirements for the past 90 days. Yes È No ‘
Indicate by check mark if disclosure of delinquent filers pursuant to Item 405 of Regulation S-K is not contained herein, and willnot be contained, to the best of registrant’s knowledge, in definitive proxy or information statements incorporated by reference in PartIII of this Form 10-K or any amendment to this Form 10-K. ‘
Indicate by check mark whether the registrant is an accelerated filer (as defined in Exchange Act Rule 12b-2). Yes È No ‘
Aggregate market value of voting and non-voting common equity held by non-affiliates of the registrant as of June 25, 2004,based upon the closing price of the common stock as reported by the NASDAQ* National Market on such date, was approximately
$172.9 billion6,227 million shares of common stock outstanding as of January 28, 2005
DOCUMENTS INCORPORATED BY REFERENCE
(1) Portions of the registrant’s Proxy Statement relating to its 2005 Annual Stockholders’ Meeting, to be filed subsequently—Part III.

INTEL CORPORATION
FORM 10-K
FOR THE FISCAL YEAR ENDED DECEMBER 25, 2004
INDEX
Page
PART IItem 1. Business . . . . . . . . . . . . . . . . . . . . . . . . . . . . . . . . . . . . . . . . . . . . . . . . . . . . . . . . . . . . . . . . . . . . . . . . . . . . . . . . . . . . 1Item 2. Properties . . . . . . . . . . . . . . . . . . . . . . . . . . . . . . . . . . . . . . . . . . . . . . . . . . . . . . . . . . . . . . . . . . . . . . . . . . . . . . . . . . . 21Item 3. Legal Proceedings . . . . . . . . . . . . . . . . . . . . . . . . . . . . . . . . . . . . . . . . . . . . . . . . . . . . . . . . . . . . . . . . . . . . . . . . . . . . 22Item 4. Submission of Matters to a Vote of Security Holders . . . . . . . . . . . . . . . . . . . . . . . . . . . . . . . . . . . . . . . . . . . . . . . . . . 23
PART IIItem 5. Market for Registrant’s Common Equity, Related Stockholder Matters and Issuer Purchases of Equity Securities . . . 23Item 6. Selected Financial Data . . . . . . . . . . . . . . . . . . . . . . . . . . . . . . . . . . . . . . . . . . . . . . . . . . . . . . . . . . . . . . . . . . . . . . . . 24Item 7. Management’s Discussion and Analysis of Financial Condition and Results of Operations . . . . . . . . . . . . . . . . . . . . . 25Item 7A. Quantitative and Qualitative Disclosures About Market Risk . . . . . . . . . . . . . . . . . . . . . . . . . . . . . . . . . . . . . . . . . . . . 43Item 8. Financial Statements and Supplementary Data . . . . . . . . . . . . . . . . . . . . . . . . . . . . . . . . . . . . . . . . . . . . . . . . . . . . . . . 45Item 9. Changes in and Disagreements with Accountants on Accounting and Financial Disclosure . . . . . . . . . . . . . . . . . . . . . 81Item 9A. Controls and Procedures . . . . . . . . . . . . . . . . . . . . . . . . . . . . . . . . . . . . . . . . . . . . . . . . . . . . . . . . . . . . . . . . . . . . . . . . 81Item 9B. Other Information . . . . . . . . . . . . . . . . . . . . . . . . . . . . . . . . . . . . . . . . . . . . . . . . . . . . . . . . . . . . . . . . . . . . . . . . . . . . 82
PART IIIItem 10. Directors and Executive Officers of the Registrant . . . . . . . . . . . . . . . . . . . . . . . . . . . . . . . . . . . . . . . . . . . . . . . . . . . . 83Item 11. Executive Compensation . . . . . . . . . . . . . . . . . . . . . . . . . . . . . . . . . . . . . . . . . . . . . . . . . . . . . . . . . . . . . . . . . . . . . . . 83Item 12. Security Ownership of Certain Beneficial Owners and Management and Related Stockholder Matters . . . . . . . . . . . . 83Item 13. Certain Relationships and Related Transactions . . . . . . . . . . . . . . . . . . . . . . . . . . . . . . . . . . . . . . . . . . . . . . . . . . . . . . 83Item 14. Principal Accountant Fees and Services . . . . . . . . . . . . . . . . . . . . . . . . . . . . . . . . . . . . . . . . . . . . . . . . . . . . . . . . . . . . 83
PART IVItem 15. Exhibits and Financial Statement Schedules . . . . . . . . . . . . . . . . . . . . . . . . . . . . . . . . . . . . . . . . . . . . . . . . . . . . . . . . . 84
PART I
ITEM 1. BUSINESS
Industry
We are the world’s largest semiconductor chip maker, supplying advanced technology solutions for the computing andcommunications industries. Our goal is to be the preeminent building block supplier to the worldwide digital economy. We offerproducts at various levels of integration, allowing our customers flexibility to create advanced computing and communications systemsand products.
Intel’s products include chips, boards and other semiconductor components that are the building blocks integral to computers,servers, and networking and communications products. Our component-level products consist of integrated circuits used to processinformation. Our integrated circuits are silicon chips, known as semiconductors, etched with interconnected electronic switches.Developments in semiconductor design and manufacturing continue to make it possible to decrease the size of circuits and transistorsetched into silicon, utilizing less space as a result. This decrease in size enables us to put increased numbers of transistors on anequivalent size chip, decrease the size of the chip or offer an increased number of integrated features. These advancements can result inhigher performing microprocessors that consume less power and/or products that cost less to manufacture.
We were incorporated in California in 1968 and reincorporated in Delaware in 1989. Our Internet address is www.intel.com. Onthis web site, we publish voluntary reports, which are updated annually, outlining our performance with respect to corporateresponsibility and environmental, health and safety compliance (these voluntary reports are not incorporated by reference into thisfiling). On our Investor Relations web site, located at www.intc.com, we post the following filings as soon as reasonably practicableafter they are electronically filed with or furnished to the Securities and Exchange Commission: our annual report on Form 10-K, ourquarterly reports on Form 10-Q, our current reports on Form 8-K, our proxy statement on Form 14A related to our annualstockholders’ meeting and any amendments to those reports or statements filed or furnished pursuant to Section 13(a) or 15(d) of theSecurities Exchange Act of 1934, as amended. All such filings on our Investor Relations web site are available free of charge. Thecontent on any web site referred to in this filing is not incorporated by reference into this filing unless expressly noted otherwise.
Products
Our products include microprocessors; chipsets; motherboards; flash memory; communications infrastructure components,including network and embedded processors; wired and wireless connectivity products; products for networked storage; applicationprocessors; and cellular baseband chipsets.
Our customers include:
• original equipment manufacturers (OEMs) and original design manufacturers (ODMs) who make computer systems, cellularhandsets and handheld computing devices, and telecommunications and networking communications equipment;
• PC and network communications products users (including individuals, large and small businesses, and service providers)who buy PC components and board-level products, as well as Intel’s networking and communications products, throughdistributor, reseller, retail and OEM channels throughout the world; and
• other manufacturers, including makers of a wide range of industrial and communications equipment.
Our primary focus is on developing advanced integrated silicon technology solutions, which we believe will provide theperformance necessary to help accelerate the convergence of computing and communications capabilities with digital content.Convergence refers to having computing and communications capabilities in an integrated product solution. We also provide keycomponents for the networking and communications infrastructure used to connect technology users.
We believe that users of computing and communications devices want improved performance, which includes faster processorperformance and/or improved capabilities such as multithreading or multitasking, lower system power consumption, seamlessconnectivity, improved security, reliability, ease of use and interoperability among devices. Our goal is to incorporate featuresaddressing these capabilities into our various products to meet user demands. We believe that our customers who build computing andcommunications systems and devices will benefit if our products incorporating these capabilities are based on a platform solution. Wedefine a platform as a collection of silicon components and software designed to provide a better user solution when used incombination than if used separately.
1

For 2004, the company consisted of two product-line operating segments, the Intel Architecture business and the IntelCommunications Group (ICG). Both of our operating segments use their core competencies in the design and manufacture ofintegrated circuits, as well as key silicon and platform capabilities, to provide building blocks for technology solutions. The IntelArchitecture business provides advanced technologies to support the desktop, mobile and enterprise computing market segments. ICGoffers products such as flash memory, as well as platform solutions for the wireless handheld computing and communications marketsegments. In addition, ICG offers wired and wireless connectivity products and key networking and communications infrastructurecomponents. In 2004, we combined our communications-related businesses into a single organization, ICG. Previously, thesecommunications businesses were in two separate product-line operating segments: the former Intel Communications Group and theWireless Communications and Computing Group.
In January 2005, we announced a planned reorganization of our business groups to bring all major product groups in line with thecompany’s strategy to drive development of complete technology platforms. These new business units include the Mobility Group, theDigital Enterprise Group, the Digital Home Group, the Digital Health Group and the Channel Platforms Group. We expect thisreorganization to become effective in 2005. Because the reporting period for this Form 10-K is as of December 25, 2004, the businessgroups discussed below and the results of operations for our operating segments in this filing are presented under the organizationalstructure that existed as of December 25, 2004.
Intel Architecture Business
The Intel Architecture business develops platform solutions based on our microprocessors, chipsets and motherboard products,which we optimize for use in the desktop, mobile or server computing market segments. The end-user products into which our productsare ultimately integrated are determined by our customers based on how they choose to meet specific user requirements.
Net revenue for the Intel Architecture operating segment made up approximately 85% of our consolidated net revenue in 2004.Revenue from sales of microprocessors within the Intel Architecture operating segment represented approximately 72% ofconsolidated net revenue in 2004. Our microprocessor business generally has followed a seasonal trend; however, there can be noassurance that this trend will continue. For the past five years, the company’s sales of microprocessors were higher in the second halfof the year than in the first half of the year. Consumer purchases of PCs have been higher in the second half of the year, primarily dueto back-to-school and holiday demand. In addition, technology purchases from businesses have tended to be higher in the second halfof the year.
A microprocessor is the central processing unit (CPU) of a computer system. It processes system data and controls other devicesin the system, acting as the “brains” of the computer. One indicator of microprocessor performance is its clock speed, the rate at whichits internal logic operates, which is measured in units of hertz, or cycles processed per second. One megahertz (MHz) equals onemillion cycles processed per second, and one gigahertz (GHz) equals one billion cycles processed per second. As computers continueto support increased usage models, other factors are becoming increasingly important to overall system performance. Examples includethe amount of memory storage, the speed of memory access, the microarchitecture design of the CPU and the speed of communicationbetween the CPU and the chipset. A faster bus, for example, allows for faster data transfer into and out of the processor, enablingincreased performance. A bus carries data between parts of the system. A common way to categorize microprocessor designarchitectures is by the number of bits (the smallest unit of information on a machine) that the processor can handle at one time.Microprocessors currently are designed to process 32 bits or 64 bits of information at one time. Microprocessors with 64-bit addressingcapability can address significantly more memory than 32-bit microprocessors. The Intel® Pentium®, Intel® Celeron® and Intel®
Xeon™ branded products are based on our 32-bit architecture (IA-32), while Intel® Itanium® branded products are based on 64-bitarchitecture. Another way to provide 64-bit processing capability is for processors based on 32-bit architecture to have 64-bit addressextensions. Certain of our Pentium® 4 and Intel Xeon products have 64-bit address extensions. The memory stored on a chip ismeasured in bytes (8 bits), with 1,024 bytes equaling a kilobyte (KB), 1.049 million bytes equaling a megabyte (MB) and 1.074 billionbytes equaling a gigabyte (GB). Cache is a memory that can be located directly on the microprocessor, permitting quicker access tofrequently used data and instructions. Some of our microprocessors have additional levels of cache, second-level (L2) cache and third-level (L3) cache, to offer higher levels of performance.
2

Other microprocessor capabilities can also enhance system performance or user experience by running software more efficiently.For example, we currently offer microprocessors with Intel’s Hyper-Threading Technology (HT Technology), which allows a singleprocessor to process two sets of instructions simultaneously. This capability can provide benefits in one of two ways: it helps to run“multithreaded” software, which is designed to execute different parts of a program simultaneously, or helps to use multiple softwareprograms simultaneously in a multitasking environment. To take advantage of HT Technology, a computer system must have amicroprocessor that supports the technology, a chipset and BIOS (basic input/output system) that use the technology and an operatingsystem that includes optimizations for the technology. Performance will vary depending on the system hardware and software used.
Intel began using a new naming convention for its desktop and mobile microprocessors in the second quarter of 2004, in an effortto better convey the overall feature set of a processor, beyond just clock speed. Intel desktop and mobile processor brand names arenow accompanied by 3-digit processor numbers that represent the technical features of the product, including design architecture, clockspeed, cache size, bus speed and other technologies. Over time, we expect that these processor numbers will allow end customers tomore easily distinguish among individual processors by taking into account a broader set of features that contribute to the overall userexperience. Currently, the new processor numbers begin with a 3, 5, 6 or 7, according to the processor family to which they belong:those beginning with a 3 belong to the Intel Celeron processor family; those beginning with a 5 or 6 belong to the Intel Pentium 4processor family; and those beginning with a 7 belong to the Intel® Pentium® M processor family. In January 2005, we began shippingour 600 sequence (processor numbers that start with a 6) Pentium 4 processors featuring 2 MB of cache memory.
The chipset operates as the PC’s “nervous system”—sending data from the processor to input, display and storage devices, suchas the keyboard, mouse, monitor, hard drive and CD or DVD drive. Chipsets perform essential logic functions, such as balancing theperformance of the system and removing bottlenecks. Chipsets also extend the graphics, audio, video and other capabilities of manysystems based on our processors. Finally, chipsets control the access between the CPU and main memory. We offer chipsetscompatible with a variety of industry-accepted bus specifications, such as the Accelerated Graphics Port (AGP) specification, thePeripheral Components Interconnect (PCI) local bus specification and the new PCI Express* local bus specification. PCI Expresssignificantly increases the data transfer rate of the original PCI specification, thereby improving the graphics and input/outputbandwidth and enabling an improved multimedia experience for the digital home. Our customers also want memory architecturealternatives, and as a result, we currently offer chipsets supporting Double Data Rate (DDR) and DDR2 (second-generation, fasterDDR memory), Dynamic Random Access Memory (DRAM) and Synchronous DRAM (SDRAM).
A motherboard is the principal board within a system that has connectors for attaching devices to the bus. Typically, themotherboard contains the CPU, memory and the chipset. We offer motherboard products designed for our microprocessors andchipsets, thereby offering a more complete range of solutions for customers looking for Intel architecture-based solutions. Board-levelproducts give our OEM customers flexibility by enabling them to buy at the board level rather than only at the component level.
In 2004, we announced a number of new microprocessor and chipset products tailored to meet the performance, price and form-factor (the physical size and shape of a device) needs of the various computing market segments. Our products, including some keyproduct introductions, are discussed below.
Desktop Market Segment
We develop platform solutions based on our microprocessors, chipsets and motherboard products, which are optimized for use inthe desktop market segment. Our strategy is to introduce microprocessors and chipsets with improved performance, tailored to theneeds of different market segments using a tiered branding approach. Our desktop processors include products such as the IntelPentium 4 processor and the Intel Celeron processor. Additionally, we provide silicon-based products for print imaging and networkedmedia products.
In 2004, the Intel Pentium 4 processor continued to be our highest sales-volume desktop processor. The Pentium 4 processor isoptimized to deliver high performance across a broad range of business and consumer applications.
In February 2004, we introduced the first microprocessors manufactured using our 90-nanometer (a nanometer is one billionth ofa meter) process technology on 300-millimeter (12-inch) wafers. These Intel Pentium 4 processors supporting HT Technology wereinitially available at speeds of up to 3.4 GHz. In June 2004, we added the Pentium 4 processors 520, 530, 540, 550 and 560 supportingHT Technology, with speeds of up to 3.6 GHz. All of these processors feature 1 MB of L2 cache and support an 800-MHz bus.
3

In February 2004, we also launched a 3.4-GHz version of the Intel® Pentium® 4 processor Extreme Edition, targeted at high-endPC game enthusiasts and power users. It comes with 2 MB of L3 cache and supports an 800-MHz bus.
In June 2004, we introduced three desktop chipsets designed to be used in conjunction with Pentium 4 processors with HTTechnology. The Intel® 915G, 915P and 925X Express chipsets have DDR2 memory capability and PCI Express, as well as Intel®
High Definition Audio supporting 7.1-channel surround sound. The Intel 915G Express chipset also has the Intel® Graphics MediaAccelerator 900 for improved graphics capabilities. These chipsets incorporate Intel® Matrix Storage Technology, which enhances dataprotection for users through integrated support for redundant hard drives.
In June 2004, we introduced Intel® Celeron® D processors 320, 325, 330 and 335 for value desktop systems, with speeds of up to2.8 GHz. In September 2004, we launched the Intel® Celeron® D processor 340, with a speed of 2.93 GHz. All of these processorsfeature 256 KB of L2 cache and support a 533-MHz bus.
In September 2004, we announced the Intel® 910GL Express chipset, which includes the PCI Express bus architecture, Intel HighDefinition Audio and the Intel Graphics Media Accelerator 900. The Intel Celeron D processor 340 and the Intel 910GL Expresschipset bring improved performance to value PCs.
In November 2004, we launched a platform based on the 3.46-GHz Pentium 4 processor Extreme Edition supporting HTTechnology and the new Intel® 925XE Express chipset. Designed specifically for high-performance gaming and media enthusiasts, theplatform has a 1066-MHz bus. Like the earlier Intel 915G, 915P and 925X Express chipsets, the Intel 925XE Express chipset includesIntel High Definition Audio, fast DDR2 memory and PCI Express capabilities.
Mobile Market Segment
We develop platform solutions based on our microprocessors and chipsets, which are optimized for use in the mobile marketsegment. Our strategy is to deliver products optimized for some or all of the four mobility vectors: performance, battery life, formfactor and wireless connectivity. Our mobile processors include products such as the Intel Pentium M processor. We also offer theMobile Intel® Pentium® 4 processor, and for the value notebook market segment we offer the Mobile Intel® Celeron® M processor andthe Mobile Intel® Celeron® processor.
We offer mobile processors at a variety of price/performance points, allowing our customers to meet the demands of a wide rangeof notebook PC designs. These notebook designs include transportable notebooks, which provide desktop-like features such as highperformance, full-size keyboards, larger screens and multiple drives; thin-and-light models, including those optimized for wirelessnetworking; and ultra-portable designs. Within the ultra-portable design category, we provide specialized low-voltage processors,which consume as little as one watt of power on average, and ultra-low-voltage processors, which consume as little as half a watt ofpower on average. Low-voltage processors are targeted for the mini-notebook market segment, while ultra-low-voltage processors aretargeted for the sub-notebook and tablet market segments of mobile PCs weighing less than three pounds and measuring one inch orless in height.
For performance mobility users, we offer Intel® Centrino™ mobile technology, designed and optimized specifically for all fourkey vectors of mobility. The initial version of Intel Centrino mobile technology consisted of an Intel Pentium M processor (with a 400-MHz bus) and a chipset from the Intel® 855 chipset family (both offered by the Intel Architecture business) as well as a wirelessnetwork connection (from ICG) that is based on the 802.11 industry standard. Intel Centrino mobile technology enables users to takeadvantage of wireless capabilities at work and at home, with the installation of the appropriate base station equipment, as well as atthousands of wireless “hotspots” installed around the world. Hotspots provide paid or free wireless local area network (WLAN, orWiFi) service in cafés, hotels, restaurants, retail shops, airports, trains and other public meeting areas. The 802.11 communicationstandard refers to a family of specifications developed for WiFi technology. These specifications describe the speed and frequency ofthe over-the-air interface between a wireless client and a base station, or between two wireless clients. 802.11a, 802.11b and 802.11gare three different 802.11 specifications. Compared to products based on 802.11b, products based on 802.11a allow for a fasterexchange of data. Products based on 802.11g allow for even faster exchange of data than both other forms of WiFi.
In January 2005, we introduced our next version of the Intel Centrino mobile technology platform, formerly code-named“Sonoma.” The new platform adds more entertainment and business features to Intel Centrino mobile technology-based notebook PCs,along with enhanced security support and higher graphics performance. The new version of Intel Centrino mobile technology includesa chipset from the Mobile Intel® 915 Express chipset family, the Intel® PRO/Wireless 2915ABG or 2200BG wireless LANcomponents, and the Intel Pentium M processor with model numbers up to 770. These processors support a 533-MHz bus, have 2 MBof cache, and run at speeds ranging from 1.6 GHz to 2.13 GHz. Also available for this platform are the Low Voltage Intel Pentium Mprocessor 758 and the Ultra Low Voltage Pentium M processor 753, both supporting a 400-MHz bus.
4

In May and June 2004, we introduced new Intel Pentium M processors built on our 90-nanometer, 300-millimeter (mm) processtechnology. These Intel Pentium M processors 715, 725, 735, 745 and 755 feature speeds from 1.5 GHz to 2.0 GHz, include 2 MB ofL2 cache and support a 400-MHz bus. In October 2004, we added the Intel Pentium M processor 765 running at 2.1 GHz, which alsofeatures 2 MB of L2 cache and supports a 400-MHz bus.
In July 2004, we launched the Intel® Pentium® M processor Low Voltage 738 running at 1.4 GHz, the Intel® Pentium® Mprocessor Ultra Low Voltage 733 running at 1.1 GHz and the Intel® Pentium® M processor Ultra Low Voltage 723 running at 1.0GHz. These three processors also feature 2 MB of L2 cache and support a 400-MHz bus. In addition, we offer the Intel® Pentium® Mprocessor Low Voltage running at 1.3 GHz and the Intel® Pentium® M processor Ultra Low Voltage running at 1.1 GHz. These twoprocessors support a 400-MHz bus and include 1 MB of L2 cache.
In June 2004, we introduced the Mobile Intel Pentium 4 processors 518, 532 and 538 with speeds of up to 3.2 GHz, designed forportable PC users who want systems with near-desktop features. In September 2004, we launched the Mobile Intel Pentium 4 processor548, with a speed of 3.33 GHz. All of these processors are built using 90-nanometer process technology, support HT Technology,include 1 MB of L2 cache and support a 533-MHz bus.
In addition, for the mobile value market segment, we offer the Intel® Celeron® M processor and the Mobile Intel Celeronprocessor. In 2004, we introduced several versions of the Intel Celeron M processor for mobile PCs with speeds of up to 1.5 GHz. Twoof these, the Intel Celeron M processors 350 and 360, are built using our 90-nanometer process technology. We also introduced Intel®
Celeron® M processors Ultra Low Voltage at speeds of up to 900 MHz. All of these versions of the Intel Celeron M processor supporta 400-MHz bus, have 512 KB of L2 cache and offer power management features designed to lengthen battery life.
Enterprise Market Segment
We develop platform solutions based on our microprocessors, chipsets and motherboard products that are optimized for use in theenterprise market segment. Our strategy is to provide processors and chipsets with improved performance, which includes advancedtechnology features, as well as competitive price for performance for entry-level to high-end servers and workstations. Servers aresystems, often with multiple microprocessors working together, that manage large amounts of data, direct traffic, perform complextransactions and control central functions in local and wide area networks and on the Internet. Workstations typically offer higherperformance than standard desktop PCs, and are used for applications such as engineering design, digital content creation and high-performance computing, among other applications. Our Intel Xeon processor family of products supports a wide range of entry-level tohigh-end technical and commercial computing applications for both the workstation and server market segments.
The Intel Xeon processor is designed for two-way servers, also known as dual-processing (DP) servers, and workstations. Thisproduct line, based on our IA-32 architecture, was enhanced in 2004 with Intel® Extended Memory 64 Technology. This technologyenables support of both 32-bit and 64-bit operating systems and applications. These processors are available for both workstations andDP servers. For servers based on four or more processors, also known as multiprocessing (MP) servers, we offer the Intel® Xeon™
processor MP with HT Technology. Our Intel® Itanium® processor family, which is based on 64-bit architecture and includes theIntel® Itanium® 2 processor, generally supports an even higher level of computing performance for data processing, the handling ofhigh transaction volumes and other compute-intensive applications for enterprise-class servers, as well as supercomputing solutions.
In March 2004, we introduced the Intel Xeon processor MP at 3.0 GHz. It features 4 MB of L3 cache and is designed for mid-tierand back-end servers based on four or more processors. We also introduced the Intel Xeon processor MP running at 2.2 GHz and 2.7GHz with 2 MB of L3 cache.
In June 2004, we introduced several new Intel Xeon processors that incorporate Intel Extended Memory 64 Technology and aremanufactured on our 90-nanometer, 300mm process technology. These processors are available for both workstations and DP servers,and feature enhanced HT Technology to improve the performance of multithreaded applications. These processors also supportDemand-Based Switching technology to reduce overall power consumption within data centers. These processors are available inspeeds ranging from 2.8 GHz to 3.6 GHz.
Also in 2004, we introduced the Intel® E7525 chipset for Intel Xeon processor-based workstation platforms. The new chipset hasan 800-MHz bus, supports DDR2 memory technology, and integrates several new technologies, including PCI Express, that helpeliminate system bottlenecks by balancing performance between the processor, input/output and memory. Workstation platforms basedon Intel Xeon processors and the new Intel E7525 chipset feature higher performance and lower power consumption than previousgenerations of Intel Xeon processor-based workstation platforms.
5

In August 2004, we launched new server platforms based on the 64-bit Intel Xeon processor at 3.6 GHz. These DP-capableplatforms include the new Intel® E7520 and Intel® E7320 chipsets, which support DDR2 memory capability and feature an 800-MHzbus and PCI Express, as well as the new Intel® 332 Storage I/O Processor, which improves storage performance over previousgenerations.
In October 2004, we unveiled the Low Voltage Intel Xeon processor 2.8 GHz, supporting an 800-MHz bus. Featuring IntelExtended Memory 64 Technology, this processor is aimed specifically at storage applications, such as controllers for storage networks.
In April 2004, we broadened the Itanium 2 processor family with a 1.4-GHz processor, followed by a 1.6-GHz version in May2004. Both processors feature 3 MB of L3 cache and are designed to enable affordable DP systems.
In November 2004, we further enhanced the Itanium 2 processor lineup with six new processors for MP, DP and low-voltage(LV) systems. The 1.6-GHz Itanium 2 processor MP features 9 MB or 6 MB of L3 cache. The 1.5-GHz Itanium 2 processor MP has 4MB of L3 cache, and the Itanium 2 processor DP at 1.6 GHz has 3 MB of L3 cache and is available with support for a 400- or533-MHz bus. Finally, the Itanium 2 processor LV at 1.3 GHz features 3 MB of L3 cache and is optimized for low-cost systems withdense form factors.
Intel Communications Group
Within ICG, we are focused on developing component-level products for the wireless handheld computing and communicationsmarket segments. These products include flash memory, applications processors and cellular baseband chipsets. We also aredeveloping products that we believe will help continue to build out the Internet. These products include communications infrastructurecomponents, including network and embedded processors; wired and wireless connectivity products; and networked storagecomponents.
Net revenue for ICG made up approximately 15% of our consolidated net revenue in 2004. Revenue from sales of flash memorywithin ICG represented approximately 7% of consolidated net revenue in 2004.
Flash Memory
Flash memory is a specialized type of memory component used to store user data and program code; it retains this informationeven when the power is off. Flash memory is based on either NOR or NAND architectures. Our flash memory is based on the NORarchitecture. NOR flash memory, with its fast “read” capabilities, has traditionally been used to store executable code. NAND flashmemory, which is slower in reading data but faster in writing data, has traditionally been used in products that either required largestorage capacity or fast write applications, such as MP3 music players, memory cards and digital cameras. In addition to havingofferings that meet the needs of cellular customers, we offer flash memory products that meet the needs of other market segments, suchas the broad market segment. The broad market segment includes flash memory products found in various applications, including set-top boxes, networking products and other devices such as DVD players and DSL cable modems.
Intel StrataFlash® Wireless Memory technology allows two bits of data to be stored in each memory cell, for higher storagecapacity and lower cost. It is available in Intel stacked chip-scale packaging and is being developed in Intel ultra-thin stacked chip-scale packaging. This technology allows up to five ultra-thin memory chips to be stacked in one package, delivering greater memorycapacity and lower power consumption in a smaller package. With heights as low as 1.0mm, the package allows manufacturers toincrease memory density and provide features such as camera capabilities, games and e-mail in relatively thin cell phones. Our higherdensity flash products generally incorporate stacked Static Random Access Memory (SRAM), which we purchase from third-partyvendors.
Application Processors and Components for Handheld Computing and Communications Devices
In application processing, products based on Intel XScale® technology provide the processing capability in data-enabled mobilephones and PDAs.
In April 2004, we introduced the Intel® PXA27x family of application processors. Designed for advanced cell phones and PDAs,the processors integrate Intel® Wireless MMX™ technology for advanced 3D gaming and video, along with Wireless Intel SpeedStep®
Power Manager technology for longer battery life. This processor family is available in a range of clock speeds, from 312 MHz to 624MHz, and with as much as 64 MB of stacked Intel StrataFlash memory. The Intel® 2700G multimedia accelerator, optimized tocomplement the Intel PXA27x processor family, is designed to deliver advanced video and graphics capabilities to enable full-screenvideo at full frame rates without sacrificing battery life.
6

We are working toward the convergence of computing and communications in the mobile handheld computing market segmentby developing technology that combines baseband communications features with memory and application processing functionality.Our “system-in-a-package” processors, which are designed for PDAs, feature an Intel XScale technology-based processor stackeddirectly on top of Intel StrataFlash memory chips in a single package. With stacked packaging, manufacturers of handheld devices candecrease the size of the form factor, as well as help reduce their time-to-market.
We offer baseband chipsets for multi-mode, multi-band wireless handsets. These chipsets support multiple wireless standards anddeliver enhanced voice quality and high-integration capability, with optimized power consumption.
Communications Infrastructure Products
Our communications infrastructure components include products such as network and embedded processors, as well as opticalcomponents. In network processing, we deliver products that are basic building blocks for modular communications platforms. Theseproducts include advanced, programmable processors used in networking equipment to rapidly manage and direct data moving acrossthe Internet and corporate networks. We also offer embedded processors that can be used for modular communications platformapplications as well as for industrial equipment and point-of-sale systems.
Unlike proprietary system platforms, modular communications platforms are standards-based solutions that offer networkinfrastructure builders flexible, low-cost, faster time-to-market options for designing their networks. Our network processor productsare based on the Intel® Internet Exchange Architecture (Intel® IXA). At the core of Intel IXA is the Intel XScale microarchitecture,which offers low power consumption and high-performance processing for a wide range of Internet devices.
In October 2004, we announced the Intel® IXP460, Intel® IXP465, Intel® IXP2325 and Intel® IXP2350 network processors.These products are designed for traditional communications applications and for the emerging embedded networking segment. TheIntel IXP2325 and Intel IXP2350 processors are Intel’s first network processors built using our 90-nanometer process technology.
For embedded processors, our product families include the Intel Celeron and Intel® Pentium® III processors, the Intel Pentium Mprocessor, the Mobile Intel® Pentium® 4 Processor-M and the Intel Pentium 4 processor. We also offer Intel Xeon processors with HTTechnology, providing increased performance for wireless infrastructure equipment.
In June 2004, we introduced the Intel Pentium M processor 745 for the communications infrastructure, designed for a range ofwireline and wireless infrastructure solutions, as well as Advanced Telecommunications Architecture* (ATCA*) board designs. ATCAis a modular communications platform solution for building standards-based wireless base station equipment and high-speedinterconnect technologies such as PCI Express and Advanced Switching.
Wired and Wireless Connectivity Products
Ethernet is an industry-standard technology used to translate and transmit data in packets across networks. As Ethernet hasexpanded from the traditional local area network (LAN) environment into the wireless LAN (WLAN), metropolitan area network(MAN) and networked storage market segments, we have expanded our product portfolio to address these other market segments. Forthe MAN market segment, we offer products at multiple levels of integration to provide a low-cost solution with increased speed andsignal transmission distance (commonly referred to as “reach”). Gigabit Ethernet networks allow the transmission of one billionindividual bits of information per second, and 10-Gigabit Ethernet networks transmit 10 billion bits of information per second. Bycontrast, Fast Ethernet networks transmit 100 million bits of information per second (Mbps, or megabits per second).
In May 2004, we introduced a 10-Gigabit Ethernet adapter for servers, the Intel® PRO/10GbE SR Server Adapter, designed tolower the costs of setting up a scalable, networked data center.
In January 2004, we introduced the Intel PRO/Wireless 2200BG Network Connection, a dual-mode product supporting the802.11b and 802.11g forms of WiFi. In August 2004, we introduced the Intel® PRO/Wireless 2915ABG Network Connection, whichsupports all three current forms of WiFi: 802.11a, b and g. Support for these three wireless technologies enables notebook PCs basedon Intel Centrino mobile technology to establish wireless connections with all currently available WiFi network types.
Networked Storage
In the networked storage market segment, we offer products that allow storage resources to be added in either of the two mostprevalent types of storage networks: Ethernet or Fibre Channel.
7

Manufacturing and Assembly and Test
As of year-end 2004, nearly 70% of our wafer manufacturing, including microprocessor, chipset, flash memory andcommunications silicon fabrication, was conducted within the U.S. at our facilities in New Mexico, Oregon, Arizona, Massachusetts,California and Colorado. Outside the U.S., more than 30% of our wafer manufacturing, including wafer fabrication formicroprocessors, chipsets, flash memory and networking silicon, was conducted at our facilities in Ireland and Israel.
As of December 2004, we manufactured our products in the wafer fabrication facilities described in the following table:
Products Wafer Size Process Technology Locations
Microprocessors . . . . . . . . . . . . . . . 300mm 90nm New Mexico, Oregon, IrelandMicroprocessors and chipsets . . . . . 200mm 130nm Oregon, Arizona, Massachusetts, CaliforniaFlash memory . . . . . . . . . . . . . . . . . 200mm 130nm New Mexico, IrelandChipsets, flash memory and other
products . . . . . . . . . . . . . . . . . . . 200mm 180nm, 250nm, 350nm New Mexico, Israel, Colorado, Ireland
In 2004, we continued to transition our microprocessor manufacturing from 200mm (8-inch) wafers to 300mm (12-inch) wafers.As of year-end 2004, the majority of our microprocessors were manufactured on 300mm wafers. The conversion to 300mm wafersallows for more efficient use of our capital investment in equipment by providing more than twice as many equivalent chips per waferas 200mm wafers. We currently expect two additional facilities to begin wafer fabrication on 300mm wafers in the second half of 2005or the first half of 2006.
As of year-end 2004, the majority of our microprocessors were manufactured using our 90-nanometer process technology. The90-nanometer process technology is our most advanced high-volume production process featuring structures smaller than the size of avirus, the world’s smallest microorganism. As we move to each succeeding generation of manufacturing process technology, we incursignificant start-up costs to get each factory ready for high-volume manufacturing. However, continuing to advance our processtechnology provides added benefits that we believe justify these costs. These benefits can include utilizing less space per transistor,which enables us to put more transistors on an equivalent size chip, decreasing the size of the chip or allowing us to offer an increasednumber of integrated features. These advancements can result in higher performing microprocessors, products that consume less powerand/or products that cost less to manufacture. To augment capacity in the U.S. and internationally, we use subcontractors (foundries) tomanufacture wafers for certain components, including networking and communications products.
We primarily use subcontractors to manufacture board-level products and systems, and purchase certain communicationsnetworking products from external vendors, primarily in the Asia-Pacific region. We also manufacture microprocessor- andnetworking-related board-level products, primarily in Malaysia.
Following manufacture, the majority of our components are subject to assembly in several types of packaging, and to testing. Weperform a substantial majority of our components assembly and test at facilities in Malaysia, the Philippines, China and Costa Rica.We plan to continue to invest in new assembly and test technologies and facilities to keep pace with our microprocessor, chipset, flashmemory and communications technology improvements. To augment capacity, we use subcontractors to perform assembly of certainproducts, primarily flash memory, chipsets and networking and communications products. Our performance expectations for businessintegrity, ethics, and environmental, health and safety compliance are the same regardless of whether our supplier and subcontractoroperations are based in the U.S. or elsewhere. Our employment practices are consistent with, and we expect our suppliers andsubcontractors to abide by, local country law. In addition, we impose a minimum employee age requirement regardless of local law.
We have thousands of suppliers, including subcontractors, providing our various materials and service needs. We set expectationsfor supplier performance and reinforce those expectations with periodic assessments. We communicate those expectations to oursuppliers regularly and work with them to implement improvements when necessary. We seek, where possible, to have several sourcesof supply for all of these materials and resources, but we may rely on a single or limited number of suppliers, or upon suppliers in asingle country. In those cases, we develop and implement plans and actions to reduce the exposure that would result from a disruptionin supply.
Our products typically are produced at multiple Intel facilities at various sites around the world, or by subcontractors who havemultiple facilities. However, some products are produced in only one Intel or subcontractor facility, and we seek to implement actionsand plans to reduce the exposure that would result from a disruption at any such facility.
8

Manufacturing and assembly and test of integrated circuits is a complex process. Normal risks include errors and interruptions inthe production process, defects in raw materials and disruptions at supplier locations, as well as other risks, all of which can affect thetiming of the production ramps and yields. A substantial decrease in yields would result in higher costs and the possibility of not beingable to produce sufficient volume to meet specific product demand. A substantial increase in yields could result in higher inventorylevels and the possibility of resulting excess capacity charges as we slow production to reduce inventory levels. In addition, higheryields, as well as other factors, can decrease overall unit costs and may cause us to revalue our existing inventory on certain products totheir lower replacement cost, which would impact our gross margin in the quarters in which this revaluation occurs.
We operate globally, with sales offices and research and development, manufacturing and assembly and test facilities in manycountries, and, as a result, we are subject to risks and factors associated with doing business outside the U.S. Global operations involveinherent risks that include currency controls and fluctuations, tariff and import regulations, and regulatory requirements that may limitour or our customers’ ability to manufacture, assemble and test, design, develop or sell products in particular countries. As part of oursite-selection due diligence processes, we assess several criteria, which include the property’s physical characteristics orconstructability, local utility infrastructure, transportation capability, availability of technical workforce, construction and suppliercapabilities, permitting requirements and investment conditions. Employment practices and labor rights issues are incorporated in thediligence. Evaluations also include ratings for security concerns, which include corruption, terrorism, crime and political instability.Security concerns alone are sufficient to remove projects from consideration. Regardless of these efforts, if terrorist activity, armedconflict, civil or military unrest, or political instability occurs in the U.S., Israel or other locations, such events may disrupt production,logistics, security and communications, and could also result in reduced demand for Intel’s products. The impacts of major healthconcerns or possible infrastructure disruptions, such as large-scale outages or interruptions of service from utilities ortelecommunications providers, on Intel, its suppliers, customers or other third parties, could also adversely affect our business andimpact customer order patterns. Business continuity could also be affected if labor issues disrupt our transportation arrangements orthose of our customers or suppliers. On a worldwide basis, we regularly review our key infrastructure, systems, services and suppliers,both internally and externally, to seek to identify significant vulnerabilities as well as areas of potential business impact if a disruptiveevent were to occur. Once identified, we assess the risks, and as we consider them to be appropriate, we initiate actions intended toreduce the risks and their potential impact. However, there can be no assurance that we have identified all significant risks or that wecan mitigate all identified risks with reasonable effort.
We maintain a program of insurance coverage for various types of property, casualty and other risks. We place our insurancecoverage with various carriers in numerous jurisdictions. The policies are subject to deductibles and exclusions that result in ourretention of a level of risk on a self-insurance basis. The types and amounts of insurance obtained vary from time to time and fromlocation to location depending on availability, cost and our decisions with respect to risk retention. Our worldwide risk and insuranceprograms are regularly evaluated to seek to obtain the most favorable terms and conditions.
For information regarding environmental matters and proceedings related to certain facilities, see “Compliance withEnvironmental, Health and Safety Regulations” below in this Item and “Legal Proceedings” in Part I, Item 3 of this Form 10-K.
Research and Development
We remain committed to investing in world-class technology development, particularly in the area of the design and manufactureof integrated circuits. Our research and development (R&D) activities are directed toward developing the technology innovations,primarily at the silicon level, that we believe will deliver the next generation of usage models and products. In particular, we arefocused on advanced computing, communications and wireless technologies. Our R&D activities in these areas are increasinglycentered around platforms. In addition, we continue to invest in new manufacturing, packaging and testing processes, as well asimproving existing products and reducing costs. We believe that we are well positioned in the technology industry to help driveinnovation, foster collaboration and promote industry standards that will yield innovative and improved technologies for users.
Our R&D model is based on a global, decentralized organization that emphasizes a collaborative approach in identifying anddeveloping new technologies, leading standards initiatives and influencing regulatory policy to accelerate the adoption of newtechnologies. Our R&D initiatives are performed by various business groups within the company, and we align and prioritize theseinitiatives across these business groups. We also work with a worldwide network of academic and industry researchers, scientists andengineers in the computing and communications fields. A decentralized network of technology professionals allows us, as well asothers in our industry, to benefit from development initiatives in a variety of areas, eventually leading to innovative technologies forusers.
9

We perform a substantial majority of our design and development of semiconductor components and other products in the U.S.Outside the U.S., we have been increasing our product development, and we have activities at various locations, including Israel, India,Malaysia, China and Russia. We also maintain R&D facilities in the U.S. that are focused on developing and improving manufacturingprocesses, as well as facilities in the U.S., Malaysia and the Philippines that are dedicated to improvements in assembly and testprocesses.
We are focusing our R&D efforts on delivering the next generation of microprocessors and on the advancement of ourmanufacturing process technology. Future generations of our microprocessors are expected to feature two or more processor cores on asingle chip, rather than just one microprocessor core. These dual- and multi-core processors are expected to complement our efforts toenable more capabilities, performance and flexibility for users beyond processor speed. Our leadership in silicon technology hasallowed us to continue to deliver on the promise of “Moore’s Law” (doubling the number of transistors on a chip every couple ofyears), and also to help expand Moore’s Law, by bringing new capabilities into silicon and producing new products optimized for awider variety of applications. We are currently manufacturing the majority of our microprocessors using 90-nanometer processtechnology. Our 65-nanometer process technology is currently in development, and we expect to begin manufacturing products using65-nanometer process technology in 2005. We are also working to increase the size of the cache memory in our microprocessorproducts. Larger cache memory allows for faster system performance at equivalent processor speeds by allowing faster data retrievalfor applications that can effectively use additional cache memory.
In addition, we believe that system security and reliability features at the hardware level will facilitate an enhanced computingexperience for users, and we are working to provide these capabilities in future products. In line with these efforts, in January 2005, weannounced that we are accelerating the introduction of our technology code-named “Vanderpool” for desktop platforms. Vanderpool isa virtualization technology that allows a platform to run multiple operating systems and applications in independent partitions, and willcomplement our upcoming introduction of dual-core processors later in 2005. To take advantage of the benefits of Vanderpool, acomputer system must have a microprocessor that supports the technology, a chipset and BIOS that use the technology, an operatingsystem that includes optimizations for the technology and software applications enabled for the technology. Some of these otherfeatures and applications are currently being developed by third parties.
We also have R&D initiatives in the wireless, networking and communications product areas. Our communications initiatives arefocused on delivering the technologies that will enable an advanced wireless platform, including 802.16 products (WiMax). WiMax isa wireless broadband access technology that is expected to enable broadband wireless access as an alternative to existing “last mile”methods such as cable and digital subscriber lines (DSL).
We do not expect that all of our product development projects will result in products that are ultimately released for sale. We mayterminate product development before completion or decide not to manufacture and sell a developed product for a variety of reasons.For example, we may decide that a product might not be sufficiently competitive in the relevant market segment, or for technologicalor marketing reasons, we may decide to offer a different product instead.
Our expenditures for R&D were $4.8 billion in fiscal 2004, $4.4 billion in fiscal 2003 and $4.0 billion in fiscal 2002. Weincreased the number of our employees engaged in R&D to approximately 25,000 in December 2004 compared to approximately23,000 in December 2003.
Employees
As of December 25, 2004, we employed approximately 85,000 people worldwide, with approximately 60% of these employeeslocated in the U.S.
10

Sales and Marketing
Most of our products are sold or licensed through sales offices located near major concentrations of users, throughout theAmericas, Europe, Asia-Pacific and Japan. Our business relies on continued sales growth in emerging markets and continued businessand consumer investment in technologies that use our products in mature markets.
Sales agreements typically contain standard terms and conditions covering matters such as pricing, payment terms and warranties,as well as indemnities for issues specific to our products, such as patent and copyright indemnities. From time to time, we may enterinto additional agreements with customers covering, for example, changes from our standard terms and conditions, new productdevelopment and marketing, private-label branding and other matters. Sales of particular products are generally conducted withpurchase orders issued under the sales agreements. Most of Intel’s sales are made using electronic and web-based processes that allowthe customer to review inventory availability and to track the progress of specific goods under order. Pricing on particular productsmay vary based on volumes ordered and other factors.
We sell our products to OEMs and ODMs. ODMs provide design and/or manufacturing services to branded and unbranded private-label resellers. We also sell our products to industrial and retail distributors. In 2004, Dell Inc. accounted for approximately 19% of ourtotal sales, and Hewlett-Packard Company accounted for approximately 16% of our total sales. A substantial majority of the sales to thesecustomers consisted of products from our Intel Architecture business. No other customer accounted for more than 10% of our totalrevenue. For information about revenue and operating profit by operating segments and revenue from unaffiliated customers bygeographic region/country, see “Note 19: Operating Segment and Geographic Information” in Part II, Item 8 of this Form 10-K and“Management’s Discussion and Analysis of Financial Condition and Results of Operations” in Part II, Item 7 of this Form 10-K.
Typically, distributors handle a wide variety of products, including those that compete with our products, and fill orders for manycustomers. Most of our sales to distributors are made under agreements allowing for price protection on unsold merchandise and a rightof return on stipulated quantities of unsold merchandise. We also utilize third-party sales representatives who generally do not offerdirectly competitive products but may carry complementary items manufactured by others. Sales representatives do not maintain aproduct inventory; instead, their customers place orders directly with us or through distributors.
Our worldwide reseller sales channel consists of thousands of indirect customers who are systems builders and purchase Intelmicroprocessors and other products from our distributors. These systems builders receive various levels of technical and marketingservices and support directly from Intel. We have a “boxed processor program” that allows distributors to sell Intel microprocessors insmall quantities to these systems-builder customers; boxed processors are also made available in direct retail outlets.
Our global marketing strategy is designed to associate our brands with advanced technology and innovation. The Intel® brand isintended to represent technology leadership, innovation, quality and reliability. Our product brands include Itanium, Intel Xeon,Pentium, Celeron and Intel Centrino, which are all part of our ingredient brand family. We promote brand awareness and generatedemand through our own direct marketing as well as co-marketing programs. Our direct marketing activities include television, printand web-based advertising, as well as press relations, consumer and trade events, and industry and consumer communications.Currently, our direct marketing to the consumer focuses on the digital home and building awareness and demand for new usage modelsand capabilities. Our marketing directed toward businesses focuses on our continuing to deliver technologies designed for performanceand reliability to enterprise and small to midsize businesses.
Purchases by customers often allow them to participate in cooperative advertising and marketing programs such as the IntelInside® program. Through the Intel Inside program, certain customers are licensed to place Intel Inside logos on computers containingour microprocessors and our other technology, and to use our brands in advertisements. The program includes a market developmentcomponent that accrues funds based on purchases and partially reimburses the OEMs for advertisements for products featuring theIntel Inside brand, subject to the OEMs meeting defined criteria. This program broadens the reach of our brands beyond the scope ofour own direct advertising. Additionally, our reseller sales channel marketing programs are intended to extend the Intel Inside brandreach to channel customers and the businesses and individuals that purchase computer systems from them.
Our products are typically shipped under terms that transfer title to the customer, even in arrangements for which the recognitionof revenue on the sale is deferred. The sales agreements typically provide that payment is due at a later date, generally 30 days aftershipment, delivery or the customer’s use of the product. Our credit department sets accounts receivable and shipping limits forindividual customers for the purpose of controlling credit risk to Intel arising from outstanding account balances. We assess credit riskthrough quantitative and qualitative analysis, and from this analysis, we establish credit limits and determine whether we will seek touse one or more credit support devices, such as obtaining some form of third-party guaranty or standby letter of credit, or obtainingcredit insurance for all or a portion of the account balance. Credit losses may still be incurred due to bankruptcy, fraud or other failure
11

of the customer to pay. See “Schedule II—Valuation and Qualifying Accounts” on page 85 of this Form 10-K for information aboutour allowance for doubtful receivables.
Backlog
We do not believe that a backlog as of any particular date is indicative of future results. Our sales are made primarily pursuant tostandard purchase orders for delivery of standard products. We have some agreements that give a customer the right to purchase aspecific number of products during a specified time period. Although these agreements do not generally obligate the customer topurchase any particular number of such products, some of these agreements do contain billback clauses. Under these clauses,customers who do not purchase the full volume agreed upon are liable for billback on previous shipments up to the price appropriatefor the quantity actually purchased. As a matter of industry practice, billback clauses are difficult to enforce. The quantities actuallypurchased by the customer, as well as the shipment schedules, are frequently revised during the agreement term to reflect changes inthe customer’s needs. In light of industry practice and our experience, we do not believe that such agreements are meaningful fordetermining backlog amounts. We believe that only a small portion of our order backlog is non-cancelable and that the dollar amountassociated with the non-cancelable portion is not significant.
Competition
As part of our overall strategy to compete in each relevant market segment, we use our core competencies in the design andmanufacture of integrated circuits and our financial resources, global presence and brand recognition. Also, under our Intel Capitalprogram, we make equity investments in companies around the world to further our strategic objectives and support our key businessinitiatives. Our products compete, to varying degrees, on the basis of performance (which includes features that can enhance the userexperience), quality, brand recognition, price and availability. Our ability to compete also depends on our ability to provide innovativeplatform solutions and worldwide support for our customers.
The semiconductor industry is characterized by rapid advances in technology and new product introductions. As unit volumesgrow, production experience is accumulated and costs decrease, further competition develops, and as a result, prices decline. The lifecycle of our products is very short, sometimes less than a year. Our ability to compete depends on our ability to improve our productsand processes faster than our competitors, anticipate changing customer requirements, and develop and launch new products, whilereducing our costs. When we believe it is appropriate, we will take various steps, including introducing new products and platformsolutions, discontinuing older products, reducing prices, and offering rebates and other incentives, to increase acceptance of our latestproducts and to be competitive within each relevant market segment. Our products compete with products developed for similar orrival architectures and with products based on the same or rival technology standards. We cannot predict which competing technologystandards will become the prevailing standards in the market segments in which we compete.
Many companies compete with us in the various computing, networking and communications market segments, and are engagedin the same basic fields of activity, including research and development. Worldwide, these competitors range in size from large,established, multinational companies with multiple product lines to smaller companies and new entrants to the marketplace thatcompete in specialized market segments. In some cases, our competitors are also our customers and/or suppliers. With the convergencein computing and communications products, product offerings will continue to cross over into multiple categories, offering us newopportunities but also resulting in more competition. In markets where our competitors have established products and brandrecognition, it may be inherently difficult for us to compete against them.
Most of our products, including all of our Intel architecture microprocessors and chipsets, as well as our flash memory andembedded processors within ICG, are built in our own manufacturing facilities. We believe that our network of manufacturing facilitiesand assembly and test facilities gives us a competitive advantage. This network enables us to have more direct control over ourprocesses, quality control, product cost, volume and timing of production, and other factors. These types of facilities are veryexpensive, and many of our competitors do not own such facilities because they cannot afford to do so or because their businessmodels involve the use of third-party facilities for manufacturing and assembly and test. These “fabless semiconductor companies”include Broadcom Corporation, NVIDIA Corporation, QUALCOMM Incorporated and VIA Technologies, Inc. Some of ourcompetitors own portions of such facilities through investment or joint-venture arrangements with other companies. There is a group ofthird-party manufacturing companies (foundries) and assembly and test subcontractors that offer their services to companies withoutowned facilities or companies needing additional capacity. These foundries and subcontractors may also offer to our competitorsintellectual property, design services, and other goods and services. Competitors who outsource their manufacturing and assembly andtest operations can significantly reduce their capital expenditures.
12

We plan to continue to cultivate new businesses and work with the computing and communications industries through standardsbodies, trade associations, OEMs, ODMs, and independent software and operating system vendors to align the industry to offerproducts that take advantage of the latest market trends and usage models. These efforts include helping to create the infrastructure forwireless network connectivity. We are also working with these industries to develop software applications and operating systems thattake advantage of our microprocessors, chipsets and other next-generation semiconductor devices with higher performance. Wefrequently participate in industry initiatives designed to discuss and agree upon technical specifications and other aspects oftechnologies that could be adopted as standards by standards-setting organizations. Our competitors may also participate in the sameinitiatives, and our participation does not ensure that any standards or specifications adopted by these organizations will be consistentwith our product planning.
Companies in the semiconductor industry often rely on the ability to license patents from each other in order to compete intoday’s markets. Many of our competitors have broad cross-licenses or licenses with us, and under current case law, some such licensesmay permit these competitors to pass our patent rights on to others. If one of these licensees becomes a foundry, our competitors mightbe able to avoid our patent rights in manufacturing competing products. In addition to licensing our patents to competitors, ourparticipation in industry initiatives may require us to license our patents to other companies that adopt certain industry standards orspecifications, even when such organizations do not adopt standards or specifications proposed by Intel. Any Intel patents implicatedby our participation in such initiatives might not, in some situations, be available for us to enforce against others who might beinfringing those patents. We cannot be assured that the patents and licenses on our products will be honored in all regions in which wecompete. In various geographies where our business is growing, we have no assurance about the scope of rights that we can enforceagainst others, or that others may assert against us. In addition, in certain regions, governments may adopt regulations or courts mayrender decisions requiring compulsory licensing of intellectual property to others, or requiring that products meet specified standardsthat serve to favor local companies, negatively impacting Intel’s ability to achieve an economic return for its innovation andinvestment.
Intel Architecture Business
We continue to be largely dependent on the success of our microprocessor business. Many of our competitors, includingAdvanced Micro Devices, Inc. (AMD), our primary microprocessor competitor, market software-compatible products that are intendedto compete with Intel architecture-based processors. We also face competition from companies offering rival microprocessor designs,such as International Business Machines Corporation (IBM), which supplies microprocessors to Apple Computer, Inc. IBM is alsojointly developing a rival architecture design with Sony Corporation and Toshiba Corporation. We currently offer desktop, mobile andserver microprocessor products based on our 32-bit architecture; enterprise-class servers and supercomputing product offerings basedon 64-bit architecture; and workstation and server solutions based on the IA-32 architecture with 64-bit extension technology that areable to run both 32-bit and 64-bit software applications. AMD offers competing microprocessor product offerings for servers,workstations and desktops that are able to run existing 32-bit and 64-bit software applications. We continuously evaluate all of ourproduct offerings and the timing of their introduction, taking into account factors such as customer requirements, availability ofinfrastructure to take advantage of product performance, and maturity of applications software for each type of processor in therelevant market segments.
Our desktop processors compete with products offered by AMD, IBM and VIA, among others. Our mobile microprocessorproducts compete with products offered by AMD, IBM, Transmeta Corporation and VIA, among others. Our server processorscompete with software-compatible products offered by AMD and with products based on rival architectures, including those offered byHewlett-Packard Company, IBM and Sun Microsystems, Inc. Our chipsets compete in the various market segments against differenttypes of chipsets that support either our microprocessor products or rival microprocessor products. Competing chipsets are produced bycompanies such as ATI Technologies, Inc., Broadcom, NVIDIA, Silicon Integrated Systems Corporation (SIS) and VIA. We alsocompete with companies offering graphics components and other special-purpose products used in the desktop, mobile and servermarket segments. One aspect of our business model is to incorporate higher performance and advanced properties into themicroprocessor and chipset, the demand for which may increasingly be affected by competition from companies, such as ATI andNVIDIA, whose business models are based on incorporating performance into chipsets and other components, such as graphicscontrollers.
13

Intel Communications Group
Within ICG, we are focused on developing component-level products for the wireless handheld computing and communicationsmarket segments. We also are developing products that we believe will help continue to build out the Internet.
Component-level products for the wireless handheld computing and communications market segments include flash memoryproducts, application processors and cellular baseband chipsets. In our various market segments, our products currently compete withthe products of other companies, such as QUALCOMM, Samsung Electronics Co., Ltd., Spansion LLC (a subsidiary of AMD),STMicroelectronics NV and Texas Instruments Incorporated. The megabit demand of the products that make use of flash memory isincreasing, and our NOR flash memory products face increased competition from companies that manufacture NAND flash memoryproducts, as OEMs look for opportunities to use NAND flash memory products with additional random access memory or incombination with NOR flash memory for executable-code applications. Various digital cellular technologies are used throughout thecellular communications industry, including but not limited to GSM (Global System for Mobile Communications), GPRS (GeneralPacket Radio Service), CDMA (Code Division Multiple Access) and WCDMA (Wideband CDMA). Our ability to competesuccessfully with our cellular baseband chipsets is dependent on having products available for the most prevalent or widely adopteddigital cellular technology. Our current product offerings are for use in cell phones and PDAs that incorporate the GSM/GPRS cellulartechnologies. Our products planned for release in 2005 will be targeted for the WCDMA as well as GSM/GPRS cellular technologies.
In support of the build-out of the Internet, we offer products designed for wired and wireless connectivity; for thecommunications infrastructure, including network and embedded processors; and for networked storage. In these areas, we facecompetition from both established and emerging companies. Our products currently compete against offerings from companies such asApplied Micro Circuits Corporation, Atheros Communications, Broadcom, Freescale Semiconductor, Inc., IBM, MarvellTechnology Group Ltd. and Texas Instruments. We cannot predict whether our networking and communications products will continueto compete successfully with those of our existing competitors or new market entrants.
Acquisitions and Strategic Investments
Our level of new acquisition and strategic investment activity for 2004 and 2003 was substantially lower than in prior years.During 2004, we completed one acquisition for net cash consideration of approximately $33 million, plus certain liabilities. In addition,we entered into certain arrangements in 2004 related to the hiring of a group of employees that resulted in the recording of workforce-in-place of $28 million in other acquisition-related intangibles within other assets on our balance sheet.
Under our Intel Capital program, we make equity investments in companies around the world to further our strategic objectivesand support our key business initiatives. The Intel Capital program generally focuses on investing in companies and initiatives tostimulate growth in the digital economy, create new business opportunities for Intel and expand global markets for our products. Theinvestments may support, among other things, Intel product initiatives, emerging trends in the technology industry or worldwideInternet deployment. This strategic investment program helps advance our overall mission to be the preeminent supplier of buildingblocks to the worldwide digital economy. Many of our investments are in private companies, including development-stage companieswith little or no revenue from current product offerings.
We invest in companies that develop software, hardware or services supporting our technologies. Our current investment focusareas include enabling mobile wireless devices, helping to advance the digital home, enhancing the digital enterprise, advancing high-performance communications infrastructures and developing the next generation of silicon production technologies. Our focus areastend to develop and change over time due to rapid advancements in technology.
Intellectual Property and Licensing
Intellectual property rights that apply to our various products and services include patents, copyrights, trade secrets, trademarksand maskwork rights. We maintain an active program to protect our investment in technology by attempting to ensure respect for ourintellectual property rights. The extent of the legal protection given to different types of intellectual property rights varies underdifferent countries’ legal systems. We intend to license our intellectual property rights where we can obtain adequate consideration.See “Competition” in Part I, Item 1 of this Form 10-K.
14

We have filed and obtained a number of patents in the U.S. and abroad. While our patents are an important element of oursuccess, our business as a whole is not materially dependent on any one patent. We and other companies in the computing,telecommunications and related high-technology fields typically apply for and receive, in the aggregate, tens of thousands of patentsannually in the U.S. and other countries. We believe that the duration of the applicable patents we are granted is adequate relative tothe expected lives of our products. Because of the fast pace of innovation and product development, our products are often obsoletebefore the patents related to them expire, and sometimes are obsolete before the patents related to them are even granted. As we expandour product offerings into new industries, such as consumer electronics, we also seek to extend our patent development efforts to patentsuch product offerings. Established competitors in these industries, and companies that purchase and enforce patents and otherintellectual property, may already have patents covering similar products. There is no assurance that we will be able to obtain patentscovering our own products, or that we will be able to obtain licenses from such companies on favorable terms or at all.
Much of the software we distribute, including software embedded in our component and system-level products, is entitled tocopyright protection. Under some circumstances, we may require our customers to obtain a software license before we provide themwith that software.
To distinguish genuine Intel products from our competitors’ products, we have obtained certain trademarks and trade names forour products, and we maintain cooperative advertising programs with certain customers to promote our brands and identify productscontaining genuine Intel components.
We also protect certain details about our processes, products and strategies as trade secrets, keeping confidential the informationthat we believe provides us with a competitive advantage. We have ongoing programs designed to maintain the confidentiality of suchinformation.
Our ability to enforce our patents, copyrights, software licenses and other intellectual property is subject to general litigation risks,as well as uncertainty as to the enforceability of various intellectual property rights in various countries. When we seek to enforce ourrights, we are often subject to claims that the intellectual property right is invalid, is otherwise not enforceable or is licensed to theparty against whom we are asserting a claim. In addition, our assertion of intellectual property rights often results in the other partyseeking to assert alleged intellectual property rights of its own against us. Like many companies in the semiconductor and other high-technology industries, we receive claims that we may be infringing others’ intellectual property rights from competitors and companiesthat purchase and enforce patents and other intellectual property. In addition, our sales agreements often include intellectual propertyindemnities, such as patent and copyright indemnities, and our customers may assert claims against us for indemnity when they receiveclaims alleging that our customers’ products infringe others’ intellectual property rights. When we receive such claims, we refer themto our legal counsel, and current claims are in various stages of evaluation and negotiation. If we determine that it is necessary ordesirable, we may seek licenses for certain intellectual property rights. However, we can give no assurance that we will be able toobtain licenses from any claimant, or that we can accept the terms of any offered licenses. Further, we are not able to resolve everydispute without litigation, which is typically time-consuming and expensive. If we are not ultimately successful in defending ourselvesagainst these claims in litigation, we may not be able to sell a particular product or family of products due to an injunction, or we mayhave to pay material amounts of damages. See “Legal Proceedings” in Part I, Item 3 of this Form 10-K.
Compliance with Environmental, Health and Safety Regulations
Intel is committed to achieving high standards of environmental quality and product safety, and strives to provide a safe andhealthy workplace for our employees, our contractors and the communities in which we do business. We have environmental, healthand safety (EHS) policies and expectations that are applied to our global operations. Each of Intel’s worldwide manufacturing andassembly and test sites is certified to the International Organization for Standardization (ISO) 14001 environmental managementsystem standard, which requires that a broad range of environmental processes and policies be in place to minimize environmentalimpact, maintain compliance with environmental regulations and communicate effectively with interested stakeholders. Intel’s internalenvironmental auditing program includes not only compliance components, but also modules on business risk, environmentalexcellence and management systems. We have internal processes that focus on minimizing and properly managing hazardous materialsused in our facilities and products. We monitor regulatory and resource trends and set company-wide short- and long-term performancetargets for key resources and emissions. These targets address several parameters, including energy and water use, climate change,waste recycling and emissions. Intel remains on track to achieve our voluntary commitment to reduce emissions of certain globalwarming gases by 10% from 1995 levels by 2010. Due to Intel’s increase in manufacturing since 1995, this equates to an actualreduction in 2004 of more than 90% from what Intel would have emitted without the voluntary reduction. In 2004, the company tookseveral actions to further its global energy reduction goal, including investing in energy conservation projects that we expect will resultin energy cost savings and reductions in electricity, natural gas and water use.
15

All Intel desktop processors produced in 2004 were capable of taking advantage of the advanced energy-saving features of theInstantly Available PC platform, which makes it possible to have a high-performance, feature-rich PC that is power efficient when bothactive and idle, and remains connected to a network even when powered off. Similarly, the Intel Pentium M processor and IntelCentrino mobile technology processors were designed specifically for notebook performance and include a variety of energy-savingfeatures such as:
• Enhanced Intel SpeedStep technology, which enables the processor to step down to a lower voltage and frequency as theworkload drops, conserving battery power;
• the ability to turn off parts of the processor’s high-speed memory when not needed, resulting in an overall reduction inplatform power consumption; and
• lower power consumption in the LCD panel and voltage regulator, which together consume 40% to 50% of platform power.
Intel has also moved to improve the energy efficiency of desktop system power supplies by issuing new energy-efficiency targetsas part of our Power Supply Design Guidelines. Power supply efficiencies for desktop computers improved in 2004. We worked withindustry peers and the U.S. Environmental Protection Agency’s Energy Star* program to integrate Intel power supply efficiencyrequirements into new Energy Star specifications for desktop computers. Intel also is working with other vendors, industry groups andresearch institutions to develop energy-efficient power supplies.
The manufacture, assembly and testing of Intel products require the use of hazardous materials that are subject to a broad array ofEHS laws and regulations. Intel actively reviews what hazardous materials are used in the manufacture, assembly and testing of ourproducts, particularly materials that end up in the final product. Intel has developed specific restrictions for the use of hazardousmaterials in our products, as well as those of our suppliers and outsourced manufacturers and subcontractors. Intel’s proactive efforts toreduce the use of hazardous substances have positioned us well to meet environmental restrictions on product content throughout theworld, such as the Restriction on Hazardous Substances (RoHS) directive in the European Union. The RoHS directive eliminates mostuses of lead, cadmium, hexavalent-chromium, mercury and certain fire retardants in electronics placed on the market after July 1, 2006.If this directive were in effect today, it would impact about 85% of Intel products due to the current use of tin-lead solders. Intelpublished its lead-free product road map in April 2004, and we already manufacture and ship some products that are RoHS compliant.By the end of 2004, the company shipped several million RoHS-compliant flash products as well as our first RoHS-compliant CPUs.
As Intel continues to advance process technology, the materials, technologies and products themselves become increasinglycomplex. Our evaluations of new materials for use in R&D, manufacturing, and assembly and test take into account EHSconsiderations and are a component of Intel’s design for EHS processes. Many new materials being evaluated for use may be subject toregulation under existing or future laws and regulations. Failure to comply with any of the applicable laws or regulations could result infines, suspension of production, alteration of fabrication and assembly processes, curtailment of operations or sales, and legal liability.Intel’s failure to properly manage the use, transportation, emission, discharge, storage, recycling or disposal of hazardous materialscould subject the company to future liabilities. Existing or future laws and regulations could require Intel to procure pollutionabatement or remediation equipment, modify product designs, or incur other expenses associated with the laws and regulations. Inaddition, restrictions on the use of certain materials in our facilities or products in the future could have a material adverse effect on ouroperations. Compliance with these complex laws and regulations, as well as internal voluntary programs, is integrated into ourmanufacturing and assembly and test processes. To our knowledge, compliance with these laws and regulations has had no materialeffect on our operations. We also refer to the information under the heading “Legal Proceedings” in Part I, Item 3 of this Form 10-K.
16

Executive Officers of the Registrant
The following sets forth certain information with regard to the executive officers of Intel as of February 18, 2005 (ages are as ofDecember 25, 2004):
Andrew S. Grove (age 68) has been a director of Intel since 1974 and Chairman of the Board since 1997. Dr. Grove was ChiefExecutive Officer from 1987 to 1998, President from 1979 to 1997 and Chief Operating Officer from 1976 to 1987.
Craig R. Barrett (age 65) has been a director of Intel since 1992 and Chief Executive Officer since 1998. Prior to that, Dr. Barrettwas President from 1997 to 2002, Chief Operating Officer from 1993 to 1997 and Executive Vice President from 1990 to 1997.
Paul S. Otellini (age 54) has been a director of Intel and President and Chief Operating Officer since 2002. Prior to that, Mr.Otellini was Executive Vice President and General Manager, Intel Architecture Group, from 1998 to 2002; Executive Vice Presidentand General Manager, Sales and Marketing Group, from 1996 to 1998; and Senior Vice President and General Manager, Sales andMarketing Group, from 1994 to 1996.
Andy D. Bryant (age 54) has been Executive Vice President and Chief Financial and Enterprise Services Officer since 2001, andwas Senior Vice President and Chief Financial and Enterprise Services Officer from 1999 to 2001. Prior to that, Mr. Bryant was SeniorVice President and Chief Financial Officer in 1999, and Vice President and Chief Financial Officer from 1994 to 1999.
Sean M. Maloney (age 48) has been Executive Vice President and General Manager, Mobility Group, since January 2005. Prior tothat, Mr. Maloney was Executive Vice President and General Manager, Intel Communications Group, from 2001 to January 2005;Executive Vice President and Director, Sales and Marketing Group, in 2001; Senior Vice President and Director, Sales and MarketingGroup, from 1999 to 2001; Vice President and Director, Sales and Marketing Group, from 1998 to 1999; and Vice President, Sales,and General Manager, Asia-Pacific Operations, from 1995 to 1998.
Robert J. Baker (age 49) has been Senior Vice President and General Manager, Technology and Manufacturing Group, since2001, and was Vice President and General Manager, Components Manufacturing, from 2000 to 2001. Prior to that, Mr. Baker managedFab Sort Manufacturing from 1999 to 2000 and Microprocessor Components Manufacturing from 1996 to 1999.
Sunlin Chou (age 58) has been Senior Vice President and General Manager, Technology and Manufacturing Group, since 1998.Mr. Chou was Vice President, Technology and Manufacturing Group, from 1988 to 1998.
Patrick P. Gelsinger (age 43) has been Senior Vice President and General Manager, Digital Enterprise Group, since January 2005.Prior to that, Mr. Gelsinger was Chief Technology Officer from 2001 to January 2005; Chief Technology Officer, Computing Group,from 2000 to 2001; and Vice President and General Manager, Desktop Products Group, from 1996 to 2000.
Arvind Sodhani (age 50) has been Senior Vice President and Treasurer since February 2005, and was Vice President andTreasurer from 1990 to February 2005.
Anand Chandrasekher (age 41) has been Vice President and Director, Sales and Marketing Group, since January 2005. Prior tothat, Mr. Chandrasekher was Vice President and General Manager, Mobile Platforms Group, from 2001 to January 2005; VicePresident and General Manager, Intel Architecture Marketing Group, from 2000 to 2001; and Vice President and General Manager,Workstation Platforms Group, from 1997 to 2000.
John H. F. Miner (age 49) has been a Vice President of Intel Corporation and President of Intel Capital since 2003, and was VicePresident and General Manager of Intel Capital from 2002 to 2003. Prior to that, Mr. Miner was Vice President, New Business Group,from 2001 to 2003; and Vice President and General Manager, Communications Products Group, from 1999 to 2001.
David Perlmutter (age 51) has been Vice President and General Manager, Mobility Group, since January 2005. Prior to that, Mr.Perlmutter was Vice President and General Manager, Mobile Platforms Group, from 2000 to January 2005; and Vice President,Microprocessor Group, and General Manager, Basic Microprocessor Division and Intel Israel Development Center, from 1996 to 2000.
D. Bruce Sewell (age 45) has been Vice President and General Counsel since November 2004, and was Vice President, Legal andGovernment Affairs and Deputy General Counsel from 2001 to November 2004. Prior to that, Mr. Sewell served in a variety of seniorlegal positions at Intel from 1995 to 2001.
Abhijit Y. Talwalkar (age 40) has been Vice President and General Manager, Digital Enterprise Group, since January 2005. Priorto that, Mr. Talwalkar was Vice President and General Manager, Enterprise Platforms Group, from 2004 to January 2005; VicePresident and General Manager, Platform Products Group, from 2002 to 2004; Assistant Vice President, Enterprise Platforms Group,from 2001 to 2002; and Vice President and General Manager, Enterprise Platforms and Solutions Division, from 1999 to 2001.
17

On November 11, 2004, the company announced that the Board of Directors elected Paul S. Otellini as President and ChiefExecutive Officer, and Craig R. Barrett as Chairman of the Board, effective as of completion of the Annual Stockholders’ Meetingscheduled for May 2005. Andrew S. Grove will not stand for reelection as a director at the May Annual Stockholders’ Meeting.
Corporate Governance
Corporate governance is typically defined as the system that allocates duties and authority among a company’s stockholders,board of directors and management. The stockholders elect the board and vote on extraordinary matters; the board is the company’sgoverning body, responsible for hiring, overseeing and evaluating management, particularly the Chief Executive Officer (CEO); andmanagement runs the company’s day-to-day operations. The Board believes that there should be a substantial majority of independentdirectors on the Board. The Board also believes that it is useful and appropriate to have members of management, including the ChiefExecutive Officer, as directors.
The Board’s general policy, based on experience, is that the positions of Chairman of the Board and Chief Executive Officershould be held by separate persons to aid in the Board’s oversight of management. In addition, the Board has an independent directordesignated as the Lead Independent Director, who is responsible for coordinating the activities of the other independent directors andperforms various other duties. The general authority and responsibilities of the Lead Independent Director are established in a writtencharter adopted by the Board.
The current Board members include eight independent directors and three members of Intel’s senior management. The Boardmembers are Craig R. Barrett, Intel’s Chief Executive Officer; Ambassador Charlene Barshefsky, Senior International Partner at theWilmer Cutler Pickering Hale and Dorr LLP law firm; E. John P. Browne, Group Chief Executive of BP plc; Andrew S. Grove, Intel’sChairman of the Board; D. James Guzy, Chairman of Arbor Company; Reed E. Hundt, Principal, Charles Ross Partners; Paul S.Otellini, Intel’s President and Chief Operating Officer; David S. Pottruck, Managing Director, The Pottruck Group; Jane E. Shaw,Chairman and Chief Executive Officer of Aerogen, Inc.; John L. Thornton, Professor and Director of Global Leadership at TsinghuaUniversity, Beijing, China; and David B. Yoffie, Professor of International Business Administration, Harvard Business School. TheBoard also has one Director Emeritus, Gordon E. Moore, who may participate in Board meetings but does not vote.
Director Vacancy in 2005. In November 2004, Intel announced that Andrew S. Grove, Chairman of the Board, would not standfor reelection in May 2005; that Craig R. Barrett would succeed Dr. Grove as Chairman effective following the 2005 Annual Meeting;and that Paul S. Otellini would succeed Dr. Barrett as Chief Executive Officer at the same time. The Board presently expects to keepthe total number of directors at 11, and the Board’s Corporate Governance and Nominating Committee is considering possiblecandidates for the Board seat to be vacated by Dr. Grove. The Board has not yet chosen a candidate, and if it has not done so prior todistribution of the Proxy Statement for Intel’s 2005 Annual Stockholders’ Meeting, the Board may act to temporarily reduce the size ofthe Board to 10 directors effective with the Annual Meeting. In that circumstance, it is the expectation of the Board that it will identifya director candidate later in 2005 and that the Board will act to expand the Board again to 11 directors at that time and to elect thatperson to the Board. The company will make a public announcement if and when that event occurs.
“Independent” Directors. Each of the company’s directors other than Messrs. Grove, Barrett and Otellini qualify as“independent” in accordance with the published listing requirements of The NASDAQ Stock Market (NASDAQ)*. The NASDAQindependence definition includes a series of objective tests, such as that the director is not an employee of the company and has notengaged in various types of business dealings with the company. In addition, as further required by the NASDAQ rules, the Board ofDirectors has made an affirmative determination as to each independent director that no relationships exist which, in the opinion of theBoard, would interfere with the exercise of independent judgment in carrying out the responsibilities of a director. In making thesedeterminations, the Board reviewed and discussed information provided by the directors and the company with regard to eachdirector’s business and personal activities as they may relate to Intel and Intel’s management.
In addition, the members of the Audit Committee of the Board also each qualify as “independent” under special standardsestablished by the U.S. Securities and Exchange Commission (SEC) for members of audit committees, and the Audit Committeeincludes at least one member who is determined by the Board to meet the qualifications of an “audit committee financial expert” inaccordance with SEC rules, including that the person meets the relevant definition of an “independent” director. E. John P. Browne isthe independent director who has been determined to be an audit committee financial expert. Stockholders should understand that thisdesignation is a disclosure requirement of the SEC related to Mr. Browne’s experience and understanding with respect to certainaccounting and auditing matters. The designation does not impose on Mr. Browne any duties, obligations or liability that are greaterthan are generally imposed on him as a member of the Audit Committee and Board of Directors, and his designation as an auditcommittee financial expert pursuant to this SEC requirement does not affect the duties, obligations or liability of any other member ofthe Audit Committee or Board of Directors.
18

Board Responsibilities and Structure. The primary responsibilities of the Board of Directors are oversight, counseling anddirection to Intel’s management in the long-term interests of Intel and its stockholders. The Board’s detailed responsibilities include:(a) selecting, regularly evaluating the performance of, and determining the compensation of the Chief Executive Officer and othersenior executives; (b) planning for succession with respect to the position of Chief Executive Officer and monitoring management’ssuccession planning for other senior executives; (c) reviewing and, where appropriate, approving Intel’s major financial objectives,strategic and operating plans and actions; (d) overseeing the conduct of Intel’s business to evaluate whether the business is beingproperly managed; and (e) overseeing the processes for maintaining Intel’s integrity with regard to its financial statements and otherpublic disclosures and compliance with law and ethics. The Chief Executive Officer, working with Intel’s other executive officers, hasthe authority and responsibility for managing Intel’s business in a manner consistent with Intel’s standards and practices, and inaccordance with any specific plans, instructions or directions of the Board. The Chief Executive Officer and management areresponsible for seeking the advice and, in appropriate situations, the approval of the Board with respect to extraordinary actions to beundertaken by Intel.
The Board and its committees meet throughout the year on a set schedule, and also hold special meetings and act by writtenconsent from time to time as appropriate. Board agendas include regularly scheduled sessions for the independent directors to meetwithout management present, and the Board’s Lead Independent Director leads those sessions. The Board has delegated variousresponsibilities and authority to different Board committees as generally described below. Committees regularly report on theiractivities and actions to the full Board. Board members have access to all Intel employees outside of Board meetings, and the Boardhas a program that encourages each director to visit different Intel sites and events worldwide on a regular basis and meet with localmanagement at those sites and events.
Board Committees and Charters. The Board currently has, and appoints the members of, standing Audit, Compensation,Corporate Governance and Nominating, Executive and Finance Committees. Each member of the Audit, Compensation, and CorporateGovernance and Nominating Committees is an independent director in accordance with NASDAQ standards described above. Each ofthe Board committees has a written charter approved by the Board. Copies of each charter, as well as the charter describing the positionof Lead Independent Director, are posted on the company’s web site at www.intc.com under the “Corporate Governance and SocialResponsibility” section.
The Audit Committee assists the Board in its general oversight of Intel’s financial reporting, internal controls and audit functions,and is directly responsible for the appointment, retention, compensation and oversight of the work of Intel’s independent auditors.
The Compensation Committee reviews and determines salaries, equity incentives and other matters relating to executivecompensation, and administers Intel’s stock option plans, including reviewing and granting stock options to executive officers. TheCompensation Committee also reviews and approves various other company compensation policies and matters.
The Corporate Governance and Nominating Committee reviews and reports to the Board on a periodic basis with regard tomatters of corporate governance, and determines the compensation to be paid to non-employee directors. The Board has adopted a setof Guidelines on Significant Corporate Governance Issues, which are posted on the company’s web site at www.intc.com under the“Corporate Governance and Social Responsibility” section. The Corporate Governance and Nominating Committee reviews andassesses the effectiveness of the Guidelines, makes recommendations to the Board regarding proposed revisions to the Guidelines, andmakes recommendations to the Board regarding the size and composition of the Board. In addition, the Corporate Governance andNominating Committee makes recommendations to the Board regarding the agenda for Intel’s annual stockholders’ meetings, reviewsstockholder proposals and makes recommendations to the Board for action on such proposals.
The Corporate Governance and Nominating Committee is also responsible for reviewing with the Board, from time to time, theappropriate skills and characteristics required of Board members in the context of the current makeup of the Board. This assessmentincludes issues of diversity in numerous factors such as age; understanding of and experience in manufacturing, technology, financeand marketing; and international experience and culture. These factors, and others as considered useful by the Committee, are reviewedin the context of an assessment of the perceived needs of the Board at a particular point in time. As a result, the priorities and emphasisof the Committee and of the Board may change from time to time to take into account changes in business and other trends, and theportfolio of skills and experience of current and prospective Board members. The Corporate Governance and Nominating Committeeestablishes procedures for the nomination process, recommends candidates for election to the Board and also nominates officers forelection by the Board. Consideration of new Board nominee candidates typically involves a series of internal discussions, review ofinformation concerning candidates and interviews with selected candidates. Candidates for nomination to the Board typically aresuggested by Board members or employees. In 2004, the company did not employ a search firm or pay fees to other third parties inconnection with seeking or evaluating Board nominee candidates. The Corporate Governance and Nominating Committee will
19

consider a candidate proposed by stockholders, and has from time to time received unsolicited candidate proposals from stockholders.Candidates proposed by stockholders are evaluated by the Committee using the same criteria as for other candidates. As describedabove, the Corporate Governance and Nominating Committee is currently engaged in the consideration of candidates for the Board tosucceed to the seat currently held by Dr. Grove.
The Corporate Governance and Nominating Committee also reviews and reports to the Board on a periodic basis with regard tomatters of corporate social responsibility performance, such as environmental, workplace or stakeholder issues, as appropriate, and thecompany’s public reporting with regard to these topics. We view our reputation and standing as a socially responsible corporate citizenas important and employ processes and management systems to seek to maintain that standing. We direct corporate responsibilityefforts across a global network of Intel organizations. We maintain community advisory panels at many of our operating sites andmonitor external trends. We proactively engage with other stakeholders, including socially responsible investors, policy-setting bodiesand non-governmental organizations, to communicate Intel’s views and understand their priorities. Intel voluntarily publishes anannual Global Citizenship Report in accordance with the Global Reporting Initiative’s (GRI) Sustainability Reporting Guidelines. Thatreport, in addition to other voluntary disclosures, can be found on the company’s web site at www.intc.com under the “CorporateGovernance and Social Responsibility” section.
The Executive Committee may exercise the authority of the Board between Board meetings, except to the extent that the Boardhas delegated authority to another committee or to other persons, and except as limited by Delaware law.
The Finance Committee reviews and recommends matters related to Intel’s capital structure, including the issuance of debt andequity securities; Intel’s dividend policy and dividend declarations; banking arrangements, including investment of corporate cash; andmanagement of the corporate debt structure. In addition, the Finance Committee reviews and approves structured finance and othercash management transactions whose authorization is not otherwise approved by the Board or delegated to Intel’s management.
Board members also sit on the Investment Policy Committee for Intel’s U.S. employee retirement plans. This committee includesIntel management representatives, and is responsible for adopting and amending investment policies as well as selecting andmonitoring service providers for the plans. The committee also selects the investment alternatives offered under Intel’s 401(k) SavingsPlan.
Attendance at Board, Committee and Annual Stockholders’ Meetings. All directors are expected to attend each meeting of theBoard and the committees on which he or she serves, and are also expected to attend the Annual Stockholders’ Meeting. A list ofBoard committees and Board committee members will be available in Intel’s Proxy Statement relating to its 2005 AnnualStockholders’ Meeting.
The Board does not have a formal policy that limits the number of board seats held by an independent director, but the Board’sguideline of 100% attendance at meetings reflects the Board’s expectation that each director will meet his or her commitments to theposition. The time commitments of directors vary substantially with regard to their individual involvement with their primary positionsand commercial, charitable and other organizations. The Board believes that a limitation on board seats held by a director will notadequately express the key functional point about the director’s time commitment to Intel.
Intel has a policy, and an approval process, that generally limits each employee to serving on no more than one company board asa personal, non-Intel activity. The approval process considers both the time commitment involved and the potential for businessconflicts between Intel and the other company. This policy is applicable to Intel’s three management directors and its other officers.
Stock Ownership Guidelines. Directors and officers are encouraged to be stockholders of the company through their participationin the company’s stock option and employee stock participation plans. Stock ownership guidelines have been established by the Boardof Directors for independent directors and corporate officers to better ensure that they each maintain an equity stake in the company,and by doing so appropriately link their interests with those of the other stockholders. These guidelines provide that, within a five-yearperiod following appointment or election, the covered individuals should attain and hold an investment position (not includingunexercised stock options) of no less than a specified number of shares of Intel stock (for officers, approximating three to five times thesum of their base salary and annual incentive target, depending on the individual’s scope of responsibilities, and a similar guideline forindependent directors). Directors and officers may not invest in (purchase or otherwise receive, or write) derivatives of Intel securities,e.g., puts and calls on Intel securities (with limited exceptions) or enter into any “short sales” or “short positions” with respect to Intelsecurities. A short position is one in which the person will profit if the market price of Intel securities either remains the same ordecreases. Intel considers it inappropriate and contrary to the interests of Intel and its stockholders for directors and officers to takeinvestment positions when the person would obtain a personal benefit in such a case.
20

ITEM 2. PROPERTIES
At December 25, 2004, we owned the major facilities described below (square feet in millions):
No. ofBldgs. Location Total Sq. Ft. Use
123 United States(A) 27.2 Executive and administrative offices, wafer fabrication, research and development, sales andmarketing, computer and service functions, and warehousing.
9 Ireland 3.1 Wafer fabrication, warehousing and administrative offices.12 Malaysia(B) 2.3 Components assembly and testing, boards and systems manufacturing, research and
development, warehousing and administrative offices.16 Israel(C) 2.0 Wafer fabrication, research and development, warehousing and administrative offices.5 Philippines(D) 1.4 Components assembly and testing, warehousing, administrative offices, and research and
development.5 China(E) 0.9 Components assembly and testing, research and development, and administrative offices.4 Costa Rica 0.9 Components assembly and testing, warehousing and administrative offices.2 India(F) 0.5 Sales and marketing, research and development, and administrative offices.1 United Kingdom 0.2 Sales and marketing and administrative offices.3 Japan 0.2 Sales and marketing and administrative offices.1 Germany 0.1 Sales and marketing and administrative offices.
(A) Lease on portion of the land used for these facilities expires in 2023.
(B) Leases on portions of the land used for these facilities expire in 2033 through 2059.
(C) Leases on portions of the land used for these facilities expire in 2039 through 2045.
(D) Leases on portions of the land used for these facilities expire in 2046.
(E) Leases on portions of the land used for these facilities expire in 2046 through 2053.
(F) Lease on portion of the land used for these facilities expires in 2009.
As of December 25, 2004, we also leased 57 major facilities in the U.S. totaling approximately 2.4 million square feet and 61facilities in other countries totaling approximately 2.8 million square feet. These leases expire at varying dates through 2021 andinclude renewals at our option. Leased facilities in the U.S. decreased during 2004, primarily due to the expiration or termination ofleases on facilities no longer needed, while leased facilities in other countries increased due to expanded operations in certain locations.We are seeking to sublease approximately 0.5 million square feet of building space. We believe that our existing facilities are suitableand adequate for our present purposes, and that, except as we have discussed above, the productive capacity in such facilities issubstantially being utilized or we have plans to utilize it. We also have approximately 0.7 million square feet of building space invarious international sites under construction for assembly and testing and research and development purposes. For informationregarding environmental proceedings related to certain facilities, see “Legal Proceedings” in Part I, Item 3 of this Form 10-K.
We do not identify or allocate assets or depreciation by operating segment. For information on net property, plant and equipmentby country, see “Note 19: Operating Segment and Geographic Information” in Part II, Item 8 of this Form 10-K.
21

ITEM 3. LEGAL PROCEEDINGS
A. Tax Matters
In August 2003, in connection with the U.S. Internal Revenue Service’s (IRS’s) regular examination of Intel’s tax returns for theyears 1999 and 2000, the IRS proposed certain adjustments primarily related to the amounts reflected by Intel on these returns as a taxbenefit for its export sales. In January 2005, the IRS issued formal assessments for these adjustments. The company does not agreewith these adjustments and intends to appeal these assessments. If the IRS prevails in its position, Intel’s federal income tax due forthese years would increase by approximately $600 million, plus interest. The IRS may make similar claims for years subsequent to2000 in future audits.
Although the final resolution of the adjustments is uncertain, based on currently available information, management believes thatthe ultimate outcome will not have a material adverse effect on the company’s financial position, cash flows or overall trends in resultsof operations. There is the possibility of a material adverse impact on the results of operations of the period in which the matter isultimately resolved, if it is resolved unfavorably, or in the period in which an unfavorable outcome becomes probable and reasonablyestimable.
B. Litigation
Intel currently is a party to various legal proceedings, including those noted below. While management presently believes that theultimate outcome of these proceedings, individually and in the aggregate, will not have a material adverse effect on our financialposition, cash flows or overall trends in results of operations, litigation is subject to inherent uncertainties, and unfavorable rulingscould occur. An unfavorable ruling could include money damages or, in cases for which injunctive relief is sought, an injunctionprohibiting Intel from selling one or more products. Were an unfavorable ruling to occur, there exists the possibility of a materialadverse impact on the net income of the period in which the ruling occurs or future periods.
MicroUnity, Inc. v. Intel Corporation, et al.U.S. District Court, Eastern District of Texas
In March 2004, MicroUnity, Inc. filed suit against Intel and Dell Inc. in the Eastern District of Texas. MicroUnity claims thatIntel® Pentium® III, Pentium® 4, Pentium® M and Itanium® 2 microprocessors infringe seven MicroUnity patents, and that certainIntel chipsets infringe one MicroUnity patent. MicroUnity also alleges that Dell products that contain these Intel products infringe thesame patents. At Dell’s request, Intel agreed to indemnify Dell with respect to MicroUnity’s claims against Dell, subject to the terms ofa prior agreement between Intel and Dell. MicroUnity seeks an injunction, unspecified damages and attorneys’ fees against both Inteland Dell. Intel disputes MicroUnity’s claims and intends to defend the lawsuit vigorously.
Barbara Sales, et al. v. Intel Corporation, Gateway Inc., Hewlett-Packard Co. and HPDirect, Inc.(formerly Deanna Neubauer, et al. v. Intel Corporation, Gateway Inc., Hewlett-Packard Co. and HPDirect, Inc.)
Third Judicial Circuit Court, Madison County, Illinois
In June 2002, various plaintiffs filed a lawsuit in the Third Judicial Circuit Court, Madison County, Illinois, against Intel,Gateway Inc., Hewlett-Packard Company and HPDirect, Inc., alleging that the defendants’ advertisements and statements misled thepublic by suppressing and concealing the alleged material fact that systems containing Intel Pentium 4 microprocessors are lesspowerful and slower than systems containing Intel Pentium III microprocessors and a competitor’s microprocessors. In July 2004, theCourt certified against Intel an Illinois-only class of certain end use purchasers of certain Pentium 4 microprocessors or computerscontaining such microprocessors. The Court denied plaintiffs’ motion for reconsideration of this ruling. In January 2005, the Courtgranted a motion filed jointly by the plaintiffs and Intel that stayed the proceedings in the trial court pending discretionary appellatereview of the Court’s class certification order. The plaintiffs and Intel thereafter filed a joint application for discretionary appeal of thetrial court’s class certification ruling. The plaintiffs seek unspecified damages, and attorneys’ fees and costs. Intel disputes theplaintiffs’ claims and intends to defend the lawsuit vigorously.
Japan Fair Trade Commission Investigation
In April 2004, the Japanese Fair Trade Commission (JFTC) commenced an investigation into the sales and marketing activities ofIntel’s Japanese subsidiary, including whether Intel’s Japanese subsidiary unfairly influenced Japanese computer makers to use Intelmicroprocessors instead of microprocessors sold by competitors. The JFTC is reviewing documents and information from Intel andothers and has been conducting interviews. Intel understands that the JFTC may make a decision regarding whether, and how, toproceed during the first quarter of 2005. Intel is cooperating with the JFTC in the investigation.
22

C. Environmental Proceedings
Intel has been named to the California and U.S. Superfund lists for three of our sites and has completed, along with two othercompanies, a Remedial Investigation/Feasibility study with the U.S. Environmental Protection Agency (EPA) to evaluate thegroundwater in areas adjacent to one of our former sites. The EPA has issued a Record of Decision with respect to a groundwatercleanup plan at that site, including expected costs of completion. Under the California and U.S. Superfund statutes, liability for cleanupof this site and the adjacent area is joint and several. Intel, however, has reached agreement with those same two companies thatsignificantly limits Intel’s liabilities under the proposed cleanup plan. Also, we have completed extensive studies at our other sites, andwe are engaged in cleanup at several of these sites. In the opinion of management, the potential losses to the company in excess ofamounts already accrued arising out of these matters would not have a material adverse effect on the company’s financial position oroverall trends in results of operations, even if joint and several liability were to be assessed.
The estimate of the potential impact on the financial position, cash flows or overall results of operations for the above tax mattersand legal and environmental proceedings could change in the future.
ITEM 4. SUBMISSION OF MATTERS TO A VOTE OF SECURITY HOLDERS
None.
PART II
ITEM 5. MARKET FOR REGISTRANT’S COMMON EQUITY, RELATED STOCKHOLDER MATTERS AND ISSUERPURCHASES OF EQUITY SECURITIES
Information regarding the market price range of Intel common stock and dividend information may be found in “FinancialInformation by Quarter (Unaudited)” in Part II, Item 8 on page 80 of this Form 10-K. Additional information concerning dividendsmay be found in the following sections of this Form 10-K: “Selected Financial Data” in Part II, Item 6 and “Consolidated Statementsof Cash Flows” and “Consolidated Statements of Stockholders’ Equity” in Part II, Item 8.
In each quarter during 2004, we paid a cash dividend of $0.04 per common share, for a total of $0.16 for the year ($0.02 eachquarter during 2003 for a total of $0.08 for the year). We have paid a cash dividend in each of the past 49 quarters. On February 2,2005, our Board of Directors declared a cash dividend of $0.08 per common share for the first quarter of 2005. The dividend is payableon March 1, 2005 to stockholders of record on February 7, 2005.
As of January 28, 2005, there were approximately 230,000 registered holders of record of Intel’s common stock. A substantiallygreater number of holders of Intel common stock are “street name” or beneficial holders, whose shares are held of record by banks,brokers and other financial institutions.
Issuer Purchases of Equity Securities
Period(Shares in Millions)
TotalNumberof Shares
Purchased
AveragePricePaidper
Share
TotalNumber of
SharesPurchasedas Part ofPublicly
AnnouncedPlans
MaximumNumberof SharesThat May
Yet BePurchasedUnder the
Plans
September 26, 2004–October 23, 2004 . . . . . . . . . . . . . . . . . . . . . . . . . . . 13.3 $20.73 13.3 189.2October 24, 2004–November 20, 2004 . . . . . . . . . . . . . . . . . . . . . . . . . . . 58.4 $22.41 58.4 630.8November 21, 2004–December 25, 2004 . . . . . . . . . . . . . . . . . . . . . . . . . . 17.3 $24.10 17.3 613.5
Total . . . . . . . . . . . . . . . . . . . . . . . . . . . . . . . . . . . . . . . . . . . . . . . . . . . . . 89.0 $22.48 89.0
The company has an ongoing authorization, as amended, from the Board of Directors to repurchase shares of Intel’s commonstock in the open market or in negotiated transactions. The company’s authorization is for up to 2.8 billion shares, which includes themost recent authorization in November 2004 to purchase an additional 500 million shares. We generally do not purchase stock duringthe “quiet periods” we have established in advance of the publication of our quarterly Earnings Release and Business Update release.For a discussion of our quiet periods, see “Status of Business Outlook and Related Risk Factor Statements” in Part II, Item 7 onpage 42 of this Form 10-K.
23

ITEM 6. SELECTED FINANCIAL DATA
Ten Years Ended December 25, 2004
(In Millions) Net Revenue Gross MarginResearch &
DevelopmentOperating
Income Net Income
2004 . . . . . . . . . . . . . . . . . . . . . . . . . . . . . . . . . . . . . . . . . . . . . . . . $ 34,209 $ 19,746 $ 4,778 $ 10,130 $ 7,5162003 . . . . . . . . . . . . . . . . . . . . . . . . . . . . . . . . . . . . . . . . . . . . . . . . $ 30,141 $ 17,094 $ 4,360 $ 7,533 $ 5,6412002 . . . . . . . . . . . . . . . . . . . . . . . . . . . . . . . . . . . . . . . . . . . . . . . . $ 26,764 $ 13,318 $ 4,034 $ 4,382 $ 3,1172001 . . . . . . . . . . . . . . . . . . . . . . . . . . . . . . . . . . . . . . . . . . . . . . . . $ 26,539 $ 13,052 $ 3,796 $ 2,256 $ 1,2912000 . . . . . . . . . . . . . . . . . . . . . . . . . . . . . . . . . . . . . . . . . . . . . . . . $ 33,726 $ 21,076 $ 3,897 $ 10,395 $ 10,5351999 . . . . . . . . . . . . . . . . . . . . . . . . . . . . . . . . . . . . . . . . . . . . . . . . $ 29,389 $ 17,553 $ 3,111 $ 9,767 $ 7,3141998 . . . . . . . . . . . . . . . . . . . . . . . . . . . . . . . . . . . . . . . . . . . . . . . . $ 26,273 $ 14,185 $ 2,509 $ 8,379 $ 6,0681997 . . . . . . . . . . . . . . . . . . . . . . . . . . . . . . . . . . . . . . . . . . . . . . . . $ 25,070 $ 15,125 $ 2,347 $ 9,887 $ 6,9451996 . . . . . . . . . . . . . . . . . . . . . . . . . . . . . . . . . . . . . . . . . . . . . . . . $ 20,847 $ 11,683 $ 1,808 $ 7,553 $ 5,1571995 . . . . . . . . . . . . . . . . . . . . . . . . . . . . . . . . . . . . . . . . . . . . . . . . $ 16,202 $ 8,391 $ 1,296 $ 5,252 $ 3,566
(In Millions—Except Per Share Amounts)
BasicEarnings
Per Share†
DilutedEarnings
Per Share†
Weighted AverageDiluted SharesOutstanding
DividendsDeclaredPer Share
DividendsPaid Per
Share
Net Investment inProperty, Plant& Equipment
2004 . . . . . . . . . . . . . . . . . . . . . . . . . . . . . . . . . . . . . $ 1.17 $ 1.16 6,494 $ .160 $ .160 $ 15,7682003 . . . . . . . . . . . . . . . . . . . . . . . . . . . . . . . . . . . . . $ 0.86 $ 0.85 6,621 $ .080 $ .080 $ 16,6612002 . . . . . . . . . . . . . . . . . . . . . . . . . . . . . . . . . . . . . $ 0.47 $ 0.46 6,759 $ .080 $ .080 $ 17,8472001 . . . . . . . . . . . . . . . . . . . . . . . . . . . . . . . . . . . . . $ 0.19 $ 0.19 6,879 $ .080 $ .080 $ 18,1212000 . . . . . . . . . . . . . . . . . . . . . . . . . . . . . . . . . . . . . $ 1.57 $ 1.51 6,986 $ .070 $ .070 $ 15,0131999 . . . . . . . . . . . . . . . . . . . . . . . . . . . . . . . . . . . . . $ 1.10 $ 1.05 6,940 $ .055 $ .055 $ 11,7151998 . . . . . . . . . . . . . . . . . . . . . . . . . . . . . . . . . . . . . $ 0.91 $ 0.86 7,035 $ .025 $ .033 $ 11,6091997 . . . . . . . . . . . . . . . . . . . . . . . . . . . . . . . . . . . . . $ 1.06 $ 0.97 7,179 $ .029 $ .028 $ 10,6661996 . . . . . . . . . . . . . . . . . . . . . . . . . . . . . . . . . . . . . $ 0.78 $ 0.73 7,101 $ .024 $ .023 $ 8,4871995 . . . . . . . . . . . . . . . . . . . . . . . . . . . . . . . . . . . . . $ 0.54 $ 0.50 7,072 $ .019 $ .018 $ 7,471
(In Millions—Except Employees) Total Assets
Long-TermDebt & PutWarrants
Stockholders’Equity
Additions toProperty, Plant& Equipment
Employeesat Year-End
(In Thousands)
2004 . . . . . . . . . . . . . . . . . . . . . . . . . . . . . . . . . . . . . . . . . . . . . $ 48,143 $ 703 $ 38,579 $ 3,843 85.02003 . . . . . . . . . . . . . . . . . . . . . . . . . . . . . . . . . . . . . . . . . . . . . $ 47,143 $ 936 $ 37,846 $ 3,656 79.72002 . . . . . . . . . . . . . . . . . . . . . . . . . . . . . . . . . . . . . . . . . . . . . $ 44,224 $ 929 $ 35,468 $ 4,703 78.72001 . . . . . . . . . . . . . . . . . . . . . . . . . . . . . . . . . . . . . . . . . . . . . $ 44,395 $ 1,050 $ 35,830 $ 7,309 83.42000 . . . . . . . . . . . . . . . . . . . . . . . . . . . . . . . . . . . . . . . . . . . . . $ 47,945 $ 707 $ 37,322 $ 6,674 86.11999 . . . . . . . . . . . . . . . . . . . . . . . . . . . . . . . . . . . . . . . . . . . . . $ 43,849 $ 1,085 $ 32,535 $ 3,403 70.21998 . . . . . . . . . . . . . . . . . . . . . . . . . . . . . . . . . . . . . . . . . . . . . $ 31,471 $ 903 $ 23,377 $ 4,032 64.51997 . . . . . . . . . . . . . . . . . . . . . . . . . . . . . . . . . . . . . . . . . . . . . $ 28,880 $ 2,489 $ 19,295 $ 4,501 63.71996 . . . . . . . . . . . . . . . . . . . . . . . . . . . . . . . . . . . . . . . . . . . . . $ 23,735 $ 1,003 $ 16,872 $ 3,024 48.51995 . . . . . . . . . . . . . . . . . . . . . . . . . . . . . . . . . . . . . . . . . . . . . $ 17,504 $ 1,125 $ 12,140 $ 3,550 41.6
† Amortization of goodwill reduced basic earnings per share by $0.23 in 2001, $0.19 in 2000 and $0.05 in 1999, and reduced dilutedearnings per share by $0.22 in 2001, $0.18 in 2000 and $0.05 in 1999. Goodwill is no longer amortized, beginning in 2002.
In addition, the ratio of earnings to fixed charges for each of the five years in the period ended December 25, 2004 was asfollows:
2004 2003 2002 2001 2000
107x 72x 32x 18x 171x
Fixed charges consist of interest expense and the estimated interest component of rent expense.
24

ITEM 7. MANAGEMENT’S DISCUSSION AND ANALYSIS OF FINANCIAL CONDITION AND RESULTS OFOPERATIONS
We begin Management’s Discussion and Analysis of Financial Condition and Results of Operations (MD&A) with Intel’s overallstrategy and the strategy for our major business units, to give the reader an overview of the goals of our business and the direction inwhich our business and products are moving. The strategy section is followed by a discussion of the Critical Accounting Estimates thatwe believe are important to understanding the assumptions and judgments incorporated in our reported financial results. Beginning onpage 30, we discuss our Results of Operations for 2004 compared to 2003, and for 2003 compared to 2002, beginning with anOverview. We then provide an analysis of changes in our balance sheet and cash flows, and discuss our financial commitments in thesections entitled “Financial Condition,” “Contractual Obligations” and “Off-Balance-Sheet Arrangements.” On page 40, we concludethis MD&A with our “Business Outlook” section, discussing our outlook for 2005.
This MD&A should be read in conjunction with the other sections of this annual report on Form 10-K, including Part I, “Item 1:Business”; Part II, “Item 6: Selected Financial Data”; and Part II, “Item 8: Financial Statements and Supplementary Data.” The varioussections of this MD&A contain a number of forward-looking statements, all of which are based on our current expectations and couldbe affected by the uncertainties and risk factors described throughout this filing and particularly in the “Business Outlook” section. Ouractual results may differ materially, and these forward-looking statements do not reflect the potential impact of any divestitures,mergers, acquisitions or other business combinations that had not been completed as of February 16, 2005.
Strategy
Our goal is to be the preeminent building block supplier to the worldwide digital economy. As part of our overall strategy tocompete in each relevant market segment, we use our core competencies in the design and manufacture of integrated circuits and ourfinancial resources, as well as our global presence and brand recognition. Our global marketing strategy is designed to associate ourbrands with advanced technology and innovation. In addition, under our Intel Capital program, we make equity investments incompanies around the world to further our strategic objectives and support our key business initiatives.
Our primary focus is on developing advanced integrated silicon technology solutions, which we believe will provide theperformance necessary to help accelerate the convergence of computing and communications capabilities with digital content.Convergence refers to combining computing and communications capabilities in an integrated product solution. We believe thatconvergence is occurring primarily in three areas: the digital home, the digital enterprise and with mobile Internet users. We alsoprovide key components for networking and communications infrastructures used to connect technology users.
We believe that users of computing and communications devices want improved performance, which includes faster processingperformance and/or improved capabilities such as multithreading or multitasking, lower system power consumption, seamlessconnectivity, improved security, reliability, ease of use and interoperability among devices. It is our goal to incorporate featuresaddressing these capabilities in our various products to meet user demands. We also believe that our customers who build computingand communications systems and devices will benefit if our products incorporating these capabilities are based on a platform solution.We define a platform as a collection of silicon components and software designed to provide a better user solution when used incombination than if used separately. The success of our strategies to add more features to our microprocessors and offer platformsolutions is dependent on our ability to select and incorporate features that customers value, and to market those features effectively.
We view technology standards as an important way to advance new technologies and foster industry infrastructures orecosystems. We work with the industry in various areas to help establish technology standards, ultimately incorporating many of thesestandards into our own product offerings.
As we move to each succeeding generation of manufacturing process technology, we use less space per transistor, which enablesus to fit more transistors on an equivalent size chip, decrease the size of the chip or offer an increased number of integrated features.This decrease in size can also result in faster microprocessors and semiconductor products that consume less power and/or productsthat cost less to manufacture.
Under our Intel Capital program, we make equity investments in companies around the world to further our strategic objectivesand support our key business initiatives. The Intel Capital program generally focuses on investing in companies and initiatives tostimulate growth in the digital economy, create new business opportunities for Intel and expand global markets for our products. Theinvestments may support, among other things, Intel product initiatives, emerging trends in the technology industry or worldwideInternet deployment. We invest in companies that develop software, hardware or services supporting our technologies. Our currentinvestment focus areas include enabling mobile wireless devices, helping to advance the digital home, enhancing the digital enterprise,advancing high-performance communications infrastructures and developing the next generation of silicon production technologies.Our focus areas tend to develop and change over time due to rapid advancements in technology.
25

MANAGEMENT’S DISCUSSION AND ANALYSIS OF FINANCIAL CONDITION AND RESULTS OF OPERATIONS(Continued)
Both of our operating segments use their core competencies in the design and manufacture of integrated circuits, as well as keysilicon and platform capabilities, to provide building blocks for technology solutions. The Intel Architecture business providesadvanced technologies to support the desktop, mobile and enterprise computing market segments. The Intel Communications Group(ICG) focuses on flash memory products, wired and wireless connectivity products, application processors, cellular baseband chipsets,and key components for networking and communications infrastructure devices. In 2004, the company combined its communications-related businesses into a single organization, ICG. Previously, these communications businesses were in two separate product-lineoperating segments: the former Intel Communications Group and the Wireless Communications and Computing Group (WCCG).
In January 2005, we announced a planned reorganization of our business groups to bring all major product groups in line with thecompany’s strategy to drive development of complete technology platforms. These new business units include the Mobility Group, theDigital Enterprise Group, the Digital Home Group, the Digital Health Group and the Channel Platforms Group. We expect thisreorganization to become effective in 2005. Because the reporting period for this Form 10-K is as of December 25, 2004, the operatingsegments discussed in this MD&A are presented under the organizational structure that existed as of December 25, 2004. Our strategydiscussed in this Form 10-K may undergo some changes as the reorganization takes effect.
Intel Architecture Business
The Intel Architecture business develops platform solutions based on our microprocessors, chipsets and board-level products,which are optimized for use in the desktop, mobile and server computing market segments. As devices continue to be developed thattake advantage of converged computing and communications capabilities and digital content, our goal is to continue to deliverprocessors with improved performance. Intel’s Hyper-Threading Technology (HT Technology), which can enable an improvedmultitasking user environment, and Intel® Centrino™ mobile technology, which can enhance the mobile computing experience, areexamples of the features we offer in our products that can improve performance. In addition, we believe that system security andreliability features at the hardware level will facilitate an enhanced computing experience for users, and we are working to providethese capabilities in future products.
To deliver processors with the next level of performance, we have focused our efforts on providing dual- and multi-coremicroprocessors in the future. Dual- and multi-core microprocessors will incorporate two or more processor cores on a single chip,rather than just one microprocessor core. These products are expected to complement our effort to enable more capabilities,performance and flexibility for users beyond processor speed. To deliver processors with the next level of performance in the nearterm, we are working to increase the size of the built-in data-storage capacity on the chip, known as cache memory. Larger amounts ofcache memory allow for faster performance at equivalent processor speeds by allowing faster data retrieval for applications that caneffectively use additional cache memory.
For the desktop market segment, our strategy is to introduce microprocessors and chipsets with improved performance tailored tothe needs of different market segments using a tiered branding approach. For the performance desktop market segment, we offer theIntel® Pentium® 4 processor family of products. For the desktop value market segment, we offer the Intel® Celeron® processor familyof products. Each of these families of products has complementary chipset products.
For the mobile market segment, our strategy is to deliver products optimized for some or all of the four mobility vectors:performance, battery life, form factor (the physical size and shape of a device) and wireless connectivity. For performance mobilityusers, we offer Intel Centrino mobile technology, designed and optimized specifically for the four key vectors of mobility. The newestversion of Intel Centrino mobile technology, formerly code-named “Sonoma,” consists of an Intel® Pentium® M processor and achipset from the Mobile Intel® 915 Express chipset family (both offered by the Intel Architecture business) as well as a wirelessconnection (from ICG) that is based on the 802.11 industry standard. For portable PC users who want systems with near-desktopfeatures, including improved performance, larger screens, full-size keyboards and multiple hard drives, we offer the Mobile Intel®
Pentium® 4 processor. In addition, for the mobile value market segment, we offer the Intel® Celeron® M processor and the MobileIntel® Celeron® processor.
Our strategy for the enterprise market segment is to provide processors and chipsets with improved performance as well ascompetitive price for performance for entry-level to high-end servers and workstations. These products address the needs of variouslevels of data processing and compute-intensive applications. Our Intel® Xeon™ processor family of products supports a range ofentry-level to high-end technical and commercial computing applications for the workstation and server market segments. Our Intel®
Itanium® processor family, which includes the Intel® Itanium® 2 processor, generally supports an even higher level of computingperformance for data processing, the handling of high transaction volumes and other compute-intensive applications for enterprise-class servers, as well as supercomputing solutions.
26

MANAGEMENT’S DISCUSSION AND ANALYSIS OF FINANCIAL CONDITION AND RESULTS OF OPERATIONS(Continued)
Intel Communications Group
Within ICG, our strategy is to be the leading supplier of silicon and other component-level communications building blocks forOEMs and other systems builders. We are focused on developing products for the wireless handheld computing and communicationsmarket segments as well as products that we believe will help continue to build out the Internet.
Component-level products for the wireless handheld computing and communications market segments include flash memoryproducts, application processors and cellular baseband chipsets. Our strategy for our flash memory products is to offer a broad range ofmemory densities, leading-edge packaging technology and high-performance functionality. In addition to having offerings that meetthe needs of cellular customers, we offer flash memory products that meet the needs of other market segments, such as the broadmarket segment. The broad market segment includes flash memory products found in various applications, including set-top boxes,networking products, and other devices such as DVD players and DSL cable modems. In our flash memory product portfolio, wecurrently offer NOR flash memory products such as Intel StrataFlash® Wireless Memory, which uses two-bits-per-cell technology toprovide a single-chip solution for fast code execution, with higher storage densities and 1.8-volt operation optimized for advancedmobile phone designs. In application processing, Intel XScale® technology provides the processing capability in data-enabled mobilephones and PDAs. Addressing the trend toward convergence in computing and communications, we offer stacked packaging solutions(stacking an application processor on top of memory) as well as packaging that stacks several memory chips together.
In support of the build-out of the Internet, we offer products designed for wired and wireless connectivity; for thecommunications infrastructure, including network and embedded processors; and for networked storage. Our strategy for connectivityproducts is to expand our product portfolio in the local area network (LAN) market segment and to address the metropolitan areanetwork (MAN) and networked storage market segments. Within the LAN and MAN market segments, we are investing in GigabitEthernet and 10-Gigabit Ethernet, as well as wireless technologies based on industry standards for wireless 802.11 (WLAN, or WiFi)mobile applications and the emerging standard supporting 802.16 (or WiMAX) for broadband connectivity. We currently offer avariety of wireless connectivity products based on the 802.11 standard for notebook PCs as part of Intel Centrino mobile technology.For the communications infrastructure, we deliver network processing-related products that are basic building blocks for modularcommunications platforms. These products include advanced, programmable processors used to manage and direct data moving acrossthe Internet and corporate networks. We also offer embedded processors that can be used for modular communications platformapplications as well as for industrial equipment and point-of-sale systems. In the networked storage market segment, we offer productsthat allow storage resources to be added in either of the two most prevalent types of storage networks: Ethernet or Fibre Channel.
Critical Accounting Estimates
The methods, estimates and judgments we use in applying our accounting policies have a significant impact on the results wereport in our financial statements, which we discuss under the heading “Results of Operations” following this section of our MD&A.Some of our accounting policies require us to make difficult and subjective judgments, often as a result of the need to make estimatesof matters that are inherently uncertain. Our most critical accounting estimates include the assessment of recoverability of goodwill,which impacts goodwill impairments; valuation of non-marketable equity securities, which impacts net gains (losses) on equitysecurities when we record impairments; valuation of inventory, which impacts gross margin; assessment of recoverability of long-livedassets, which primarily impacts gross margin when we impair manufacturing assets or accelerate their depreciation; and recognitionand measurement of current and deferred income tax assets and liabilities, which impact our tax provision. Below, we discuss thesepolicies further, as well as the estimates and judgments involved. We also have other policies that we consider key accounting policies,such as for revenue recognition, including the deferral of revenue on sales to distributors; however, these policies do not require us tomake estimates or judgments that are difficult or subjective.
27

MANAGEMENT’S DISCUSSION AND ANALYSIS OF FINANCIAL CONDITION AND RESULTS OF OPERATIONS(Continued)
Goodwill. Goodwill is recorded when the purchase price paid for an acquisition exceeds the estimated fair value of the netidentified tangible and intangible assets acquired. We perform an annual review in the fourth quarter of each year, or more frequently ifindicators of potential impairment exist, to determine if the carrying value of the recorded goodwill is impaired. Our impairmentreview process compares the fair value of the reporting unit in which goodwill resides to its carrying value. Reporting units may beoperating segments as a whole or an operation one level below an operating segment, referred to as a component. Components aredefined as operations for which discrete financial information is available and reviewed by segment management. The ICG operatingsegment is made up of two reporting units: the flash memory reporting unit and the ICG reporting unit. All of the ICG operatingsegment goodwill is included in the ICG reporting unit. Our review process uses the income method to estimate the reporting unit’s fairvalue and is based on a discounted future cash flow approach that uses the following reporting unit estimates: revenue, based onassumed market segment growth rates and Intel’s assumed market segment share; estimated costs; and appropriate discount rates basedon the reporting units’ weighted average cost of capital as determined by considering the observable weighted average cost of capitalof comparable companies. Our estimates of market segment growth, our market segment share and costs are based on historical data,various internal estimates and a variety of external sources, and are developed as part of our routine long-range planning process. Thesame estimates are also used in planning for our long-term manufacturing and assembly and test capacity needs as part of our capitalbudgeting process and for both long-term and short-term business planning and forecasting. We test the reasonableness of the inputsand outcomes of our discounted cash flow analysis against available comparable market data. In determining the carrying value of thereporting unit, we must include an allocation of our manufacturing and assembly and test assets because of the interchangeable natureof our manufacturing and assembly and test capacity. This allocation is based on each reporting unit’s relative percentage utilization ofour manufacturing and assembly and test assets. During the fourth quarter of 2004, we completed our most recent review anddetermined that the fair value of the ICG reporting unit was in excess of its carrying value; therefore, goodwill was not impaired. Ourreview of goodwill in 2003 resulted in a $611 million non-cash impairment charge related to the then-existing WirelessCommunications and Computing Group reporting unit. A substantial majority of our remaining recorded goodwill is related to the ICGreporting unit. The estimates we used in our most recent annual review for the ICG reporting unit assume that we will gain marketsegment share in the future and that the communications business will experience a gradual recovery and return to growth from thecurrent trends. Prior to the combination of our communications-related businesses, our consumer electronics business, which waspreviously part of our former ICG operating segment, was moved to our Intel Architecture business. Based on the estimated fair valueof the consumer electronics business relative to the former ICG reporting unit, goodwill of $466 million was transferred to our IntelArchitecture business. In January 2005, we announced a planned reorganization of our business groups that will change the operatingsegments where the goodwill resides as well as the reporting units that are used to evaluate goodwill for impairment.
Non-Marketable Equity Securities. Under our Intel Capital program, we typically invest in non-marketable equity securities ofprivate companies, which range from early-stage companies that are often still defining their strategic direction to more maturecompanies whose products or technologies may directly support an Intel product or initiative. At December 25, 2004, the carryingvalue of our portfolio of strategic investments in non-marketable equity securities, excluding equity derivatives, totaled $507 million($665 million at December 27, 2003).
Investments in non-marketable equity securities are inherently risky, and a number of these companies are likely to fail. Theirsuccess (or lack thereof) is dependent on product development, market acceptance, operational efficiency and other key businesssuccess factors. In addition, depending on their future prospects, they may not be able to raise additional funds when needed or theymay receive lower valuations, with less favorable investment terms than in previous financings, and the investments would likelybecome impaired. In the current equity market environment, while the availability of additional funding from venture capital sourceshas improved, the companies’ ability to take advantage of liquidity events, such as initial public offerings, mergers and private sales,remains constrained.
We review all of our investments quarterly for indicators of impairment; however, for non-marketable equity securities, theimpairment analysis requires significant judgment to identify events or circumstances that would likely have a significant adverseeffect on the fair value of the investment. The indicators that we use to identify those events or circumstances include (a) the investee’srevenue and earnings trends relative to predefined milestones and overall business prospects, (b) the technological feasibility of theinvestee’s products and technologies, (c) the general market conditions in the investee’s industry or geographic area, including adverseregulatory or economic changes, (d) factors related to the investee’s ability to remain in business, such as the investee’s liquidity, debtratios and the rate at which the investee is using its cash, and (e) the investee’s receipt of additional funding at a lower valuation.
28

MANAGEMENT’S DISCUSSION AND ANALYSIS OF FINANCIAL CONDITION AND RESULTS OF OPERATIONS(Continued)
Investments identified as having an indicator of impairment are subject to further analysis to determine if the investment is otherthan temporarily impaired, in which case we write the investment down to its impaired value. When an investee is not consideredviable from a financial or technological point of view, we write down the entire investment since we consider the estimated fair marketvalue to be nominal. If an investee obtains additional funding at a valuation lower than our carrying amount or requires a new round ofequity funding to stay in operation and the new funding does not appear imminent, we presume that the investment is other thantemporarily impaired, unless specific facts and circumstances indicate otherwise. Impairments of investments in our portfolio,primarily impairments of non-marketable equity securities, were approximately $117 million in 2004 ($319 million in 2003 and $524million in 2002).
Inventory. The valuation of inventory requires us to estimate obsolete or excess inventory as well as inventory that is not ofsaleable quality. The determination of obsolete or excess inventory requires us to estimate the future demand for our products withinspecific time horizons, generally six months or less. The estimates of future demand that we use in the valuation of inventory are thebasis for our published revenue forecasts, which are also consistent with our short-term manufacturing plans. If our demand forecastfor specific products is greater than actual demand and we fail to reduce manufacturing output accordingly, we could be required towrite down additional inventory, which would have a negative impact on our gross margin.
Long-Lived Assets. We assess the impairment of long-lived assets when events or changes in circumstances indicate that thecarrying value of the assets or the asset grouping may not be recoverable. Factors that we consider in deciding when to perform animpairment review include significant under-performance of a business or product line in relation to expectations, significant negativeindustry or economic trends, and significant changes or planned changes in our use of the assets. Recoverability of assets that willcontinue to be used in our operations is measured by comparing the carrying amount of the asset grouping to our estimate of the relatedtotal future net cash flows. If an asset grouping’s carrying value is not recoverable through the related cash flows, the asset grouping isconsidered to be impaired. The impairment is measured by the difference between the asset grouping’s carrying amount and its fairvalue, based on the best information available, including market prices or discounted cash flow analysis.
Impairments of long-lived assets are determined for groups of assets related to the lowest level of identifiable independent cashflows. Due to our asset usage model and the interchangeable nature of our semiconductor manufacturing capacity, we must makesubjective judgments in determining the independent cash flows that can be related to specific asset groupings. In addition, as we makemanufacturing process conversions and other factory planning decisions, we must make subjective judgments regarding the remaininguseful lives of assets, primarily process-specific semiconductor manufacturing tools and building improvements. When we determinethat the useful lives of assets are shorter than we had originally estimated, and there are sufficient cash flows to support the carryingvalue of the assets, we accelerate the rate of depreciation charges in order to fully depreciate the assets over their new shorter usefullives.
Income Taxes. We must make certain estimates and judgments in determining income tax expense for financial statementpurposes. These estimates and judgments occur in the calculation of tax credits, tax benefits and deductions, such as the tax benefit forexport sales, and in the calculation of certain tax assets and liabilities, which arise from differences in the timing of recognition ofrevenue and expense for tax and financial statement purposes. Significant changes to these estimates may result in an increase ordecrease to our tax provision in a subsequent period.
We must assess the likelihood that we will be able to recover our deferred tax assets. If recovery is not likely, we must increaseour provision for taxes by recording a valuation allowance against the deferred tax assets that we estimate will not ultimately berecoverable. We believe that a substantial majority of the deferred tax assets recorded on our balance sheet will ultimately berecovered. However, should there be a change in our ability to recover our deferred tax assets, our tax provision would increase in theperiod in which we determined that the recovery was not likely.
In addition, the calculation of our tax liabilities involves dealing with uncertainties in the application of complex tax regulations.We recognize liabilities for anticipated tax audit issues in the U.S. and other tax jurisdictions based on our estimate of whether, and theextent to which, additional tax payments are probable. If we ultimately determine that payment of these amounts is unnecessary, wereverse the liability and recognize a tax benefit during the period in which we determine that the liability is no longer necessary. Werecord an additional charge in our provision for taxes in the period in which we determine that the recorded tax liability is less than weexpect the ultimate assessment to be. For a discussion of current tax matters, see “Note 10: Provision for Taxes” and “Note 18:Contingencies” in Part II, Item 8 of this Form 10-K.
29

MANAGEMENT’S DISCUSSION AND ANALYSIS OF FINANCIAL CONDITION AND RESULTS OF OPERATIONS(Continued)
Results of Operations
Overview
In 2004, we experienced another year of double-digit growth in annual revenue and gross margin dollars. Our Intel Architecturebusiness contributed most of this growth, largely from higher unit sales of microprocessors. The Intel Architecture business continuesto represent a large percentage of our business, accounting for 85% of our 2004 consolidated net revenue. Within ICG, we saw 28%growth in revenue, mostly driven by higher unit sales of our flash memory products. In 2004, we also ramped the production of our90-nanometer process technology on 300-millimeter (mm) wafers, and exited the year with the majority of our processor shipments tothe computing industry based on this technology. We continue to see strength in both our emerging and mature markets. For 2004, weincreased the operating profit in our Intel Architecture business by 17% and reduced the losses slightly in our communicationsbusiness. In addition, our business continued to generate significant cash, and we were able to use $7.5 billion to buy back our stockand pay $1.0 billion in dividends while maintaining our strong financial position.
In 2005, we are planning for further growth in both annual revenue and gross margin dollars, with higher unit sales formicroprocessors. However, we are also expecting higher manufacturing start-up costs related to the ramp of our 65-nanometer processtechnology, particularly in the first half of 2005. Growth in sales and profitability depends on our ability to successfully ramp newproducts, and to obtain continuing benefits from the productive use of our manufacturing assets. We expect to introduce our first dual-core processors in 2005, as we continue to focus on enabling more capabilities, performance and flexibility for users beyond processorspeed. We also plan to design our products around entire platforms. In line with this platform focus, in January 2005, we announced areorganization to align our business groups across our major platform initiatives. Because the reporting period for this Form 10-K is asof December 25, 2004, the results of operations for all comparative periods, including the comparison of the 2003 to 2002 results, arepresented under the organizational structure that existed as of December 25, 2004.
The following table sets forth certain consolidated statements of income data as a percentage of net revenue for the periodsindicated:
2004 2003 2002
Net revenue . . . . . . . . . . . . . . . . . . . . . . . . . . . . . . . . . . . . . . . . . . . . . . . . . . . . . . . . . . . . . . . . 100.0% 100.0% 100.0%Cost of sales . . . . . . . . . . . . . . . . . . . . . . . . . . . . . . . . . . . . . . . . . . . . . . . . . . . . . . . . . . . . . . . . 42.3% 43.3% 50.2%
Gross margin . . . . . . . . . . . . . . . . . . . . . . . . . . . . . . . . . . . . . . . . . . . . . . . . . . . . . . . . . . . . . . . 57.7% 56.7% 49.8%Research and development . . . . . . . . . . . . . . . . . . . . . . . . . . . . . . . . . . . . . . . . . . . . . . . . . . . . . 14.0% 14.5% 15.1%Marketing, general and administrative . . . . . . . . . . . . . . . . . . . . . . . . . . . . . . . . . . . . . . . . . . . . . 13.6% 14.2% 16.2%Impairment of goodwill . . . . . . . . . . . . . . . . . . . . . . . . . . . . . . . . . . . . . . . . . . . . . . . . . . . . . . . . — 2.0% —Amortization and impairment of acquisition-related intangibles and costs . . . . . . . . . . . . . . . . . . 0.5% 1.0% 2.0%Purchased in-process research and development . . . . . . . . . . . . . . . . . . . . . . . . . . . . . . . . . . . . . — — 0.1%
Operating income . . . . . . . . . . . . . . . . . . . . . . . . . . . . . . . . . . . . . . . . . . . . . . . . . . . . . . . . . . . 29.6% 25.0% 16.4%
The following table sets forth information on our geographic regions for the periods indicated:
2004 2003 2002
(Dollars in Millions) Revenue% ofTotal Revenue
% ofTotal Revenue
% ofTotal
Americas . . . . . . . . . . . . . . . . . . . . . . . . . . . . . . . . . . . . . . . . . $ 7,965 23% $ 8,403 28% $ 8,648 32%Asia-Pacific . . . . . . . . . . . . . . . . . . . . . . . . . . . . . . . . . . . . . . . 15,380 45% 12,161 40% 10,073 38%Europe . . . . . . . . . . . . . . . . . . . . . . . . . . . . . . . . . . . . . . . . . . . 7,755 23% 6,868 23% 6,139 23%Japan . . . . . . . . . . . . . . . . . . . . . . . . . . . . . . . . . . . . . . . . . . . . 3,109 9% 2,709 9% 1,904 7%
Total . . . . . . . . . . . . . . . . . . . . . . . . . . . . . . . . . . . . . . . . . . . . $34,209 100% $30,141 100% $26,764 100%
30

MANAGEMENT’S DISCUSSION AND ANALYSIS OF FINANCIAL CONDITION AND RESULTS OF OPERATIONS(Continued)
Our net revenue for 2004 was $34.2 billion, an increase of $4.1 billion, or 13.5%, compared to 2003. This increase was primarilydue to higher net revenue from sales of microprocessors in our Intel Architecture business accompanied by higher net revenue for ICG.
Our Asia-Pacific region’s revenue made up the largest portion of our total revenue during 2004 and increased 26%, reflectingboth growth in local consumption and movement of more of the production for our customers’ PC supply chain to Asia. Thismovement in the supply chain negatively affected the Americas region, with a decrease in revenue of 5% in 2004 compared to 2003.Japan revenue increased 15%, and the Europe region’s revenue increased 13% in 2004 compared to 2003.
Overall gross margin dollars were $19.7 billion, an increase of $2.7 billion, or 16%, compared to 2003. Our overall gross marginpercentage increased to 57.7% in 2004 from 56.7% in 2003. The gross margin percentage for the Intel Architecture business washigher than in 2003, and the gross margin percentage in our communications business was lower than in 2003. See “Business Outlook”on page 40 of this section for a discussion of gross margin expectations.
Our net revenue for 2003 was $30.1 billion, an increase of 13% compared to 2002. This increase in net revenue was primarilyfrom our Intel Architecture business, which had increased sales of microprocessors and chipsets. This increase was partially offset bylower net revenue for ICG.
In 2003, our Asia-Pacific region’s revenue made up the largest portion of our total revenue and increased 21% compared to 2002,reflecting growth in local consumption and movement of more of the production for our customers’ PC supply chain to Asia. Revenuein Europe improved, increasing 12%, in 2003 compared to 2002. Japan experienced substantial improvement with increased revenue of42%, primarily driven by retail sales as well as higher notebook exports by Japanese manufacturers. Revenue from the Americas regioncontinued to decrease as a percent of our total revenue and declined 3% in 2003 compared to 2002. In 2003, we continued toexperience growth in emerging markets in Asia and Europe, and began to see some evidence of higher technology infrastructurespending in mature markets in Europe and the U.S.
Our overall gross margin percentage increased to 56.7% for 2003 from 49.8% in 2002. Improved gross margin within the IntelArchitecture business as well as a shift in the total company revenue mix to the higher margin Intel Architecture business contributedto our improved total gross margin. Improvement in the Intel Architecture gross margin was partially offset by a decline in the grossmargin percentage for ICG.
Intel Architecture Business
The revenue and operating income for the Intel Architecture operating segment for the three years ended December 25, 2004 wereas follows:
(In Millions) 2004 2003 2002
Microprocessor revenue . . . . . . . . . . . . . . . . . . . . . . . . . . . . . . . . . . . . . . . . . . . . . . . . . . $24,463 $21,937 $18,676Chipset, motherboard and other revenue . . . . . . . . . . . . . . . . . . . . . . . . . . . . . . . . . . . . . 4,704 4,241 3,671
Total revenue . . . . . . . . . . . . . . . . . . . . . . . . . . . . . . . . . . . . . . . . . . . . . . . . . . . . . . . . . . $29,167 $26,178 $22,347Operating income . . . . . . . . . . . . . . . . . . . . . . . . . . . . . . . . . . . . . . . . . . . . . . . . . . . . . . . $12,067 $10,354 $ 6,498
Revenue for the Intel Architecture operating segment increased by $3.0 billion, or 11%, in 2004 compared to 2003. Revenue fromsales of microprocessors increased 12% while revenue from sales of chipsets and motherboards increased 11%. The increase in IntelArchitecture revenue was primarily due to higher unit sales for microprocessors in the computing market segment. Sales ofmicroprocessors designed for the desktop, mobile and server market segments all increased substantially in 2004. Consistent with thisincrease in sales of microprocessors, we also experienced higher unit sales of our chipsets and motherboards in 2004 compared to2003. We ramped our 90-nanometer process technology in 2004, and exited the year with the majority of our microprocessors shippedbeing manufactured on this technology.
Operating income increased to $12.1 billion in 2004 compared to $10.4 billion in 2003. The 17% increase was primarily due tothe impact of higher revenue and lower unit costs for microprocessors, as well as approximately $160 million of lower manufacturingstart-up costs. These increases in operating income were partially offset by higher operating expenses and a $162 million charge in Q12004 relating to a settlement agreement with Intergraph Corporation.
31

MANAGEMENT’S DISCUSSION AND ANALYSIS OF FINANCIAL CONDITION AND RESULTS OF OPERATIONS(Continued)
For 2003, revenue for the Intel Architecture operating segment increased by $3.8 billion, or 17%, compared to 2002. Revenuefrom sales of microprocessors increased 17% while revenue from sales of chipsets and motherboards increased 16%. The increase inIntel Architecture revenue was primarily due to significantly higher unit sales and to a lesser extent due to a slightly higher averageselling price for microprocessors, as well as significantly higher unit sales of chipsets in 2003. During 2003, we rapidly ramped theIntel Centrino mobile technology and the Pentium M processor for mobile computers. We also saw increased sales of Pentium 4processors with HT Technology and higher sales of Intel Xeon processors in the server market segment.
Operating income increased by $3.9 billion, or 59%, in 2003 compared to 2002. The increase was primarily due to the impact ofhigher revenue, lower unit costs for microprocessors and chipsets, and charges for under-utilized factory capacity that were lower thanin 2002 by approximately $150 million. These improvements were partially offset by approximately $390 million of higher start-upcosts in 2003 related to the ramp of 90-nanometer technology on 300mm wafer manufacturing.
Intel Communications Group
The revenue and operating loss for the ICG operating segment for the three years ended December 25, 2004 were as follows:
(In Millions) 2004 2003 2002
Revenue . . . . . . . . . . . . . . . . . . . . . . . . . . . . . . . . . . . . . . . . . . . . . . . . . . . . . . . . . . . . . . . . . $5,027 $3,928 $4,288Operating loss . . . . . . . . . . . . . . . . . . . . . . . . . . . . . . . . . . . . . . . . . . . . . . . . . . . . . . . . . . . . $ (791) $ (824) $ (817)
Revenue increased by $1.1 billion, or 28%, in 2004 compared to 2003, primarily due to higher revenue from higher unit sales offlash memory products, embedded processing components and wireless connectivity products. Revenue from flash memory productsincreased to $2.3 billion in 2004 from $1.6 billion in 2003.
The operating loss decreased to $791 million in 2004 from a loss of $824 million in 2003. Contributing to the lower operatingloss were higher revenue, as well as approximately $100 million from lower inventory write-offs for flash memory products due toimproved demand and sales of flash memory product inventory that had been previously written down. These improvements werepartially offset by higher unit costs for flash memory products as we sold higher density products, as well as the negative impact ofreducing the carrying value of ending inventory to lower current replacement costs. In addition, higher startup costs in 2004 ofapproximately $160 million partially offset the decrease in operating loss.
For 2003, revenue decreased by $360 million, or 8%, compared to 2002. The decrease was primarily due to lower unit sales offlash memory products. Revenue from flash memory products decreased to $1.6 billion in 2003 from $2.1 billion in 2002. In 2003,revenue for flash memory products was negatively affected by lost business as a result of the pricing strategy on certain products. Thisdecrease was partially offset by increases in revenue for wireless connectivity products, increases in revenue from sales of applicationprocessors for data-enabled cellular phones and handheld computing devices, and increases in revenue from sales of embeddedprocessing components.
The operating loss remained relatively flat in 2003 at $824 million, compared to $817 million in 2002. Negative impacts to theoperating results included lower revenue and higher inventory write-offs for flash memory products, and a mix shift to lower marginwired connectivity products. These negative impacts were offset primarily by a decrease in operating expenses of $160 million in 2003as we continued our efforts to streamline operations and refocus on our core strategic areas.
32

MANAGEMENT’S DISCUSSION AND ANALYSIS OF FINANCIAL CONDITION AND RESULTS OF OPERATIONS(Continued)
Operating Expenses
Operating expenses for the three years ended December 25, 2004 were as follows:
(In Millions) 2004 2003 2002
Research and development . . . . . . . . . . . . . . . . . . . . . . . . . . . . . . . . . . . . . . . . . . . . . . . . . . . $4,778 $4,360 $4,034Marketing, general and administrative . . . . . . . . . . . . . . . . . . . . . . . . . . . . . . . . . . . . . . . . . . $4,659 $4,278 $4,334Impairment of goodwill . . . . . . . . . . . . . . . . . . . . . . . . . . . . . . . . . . . . . . . . . . . . . . . . . . . . . $ — $ 617 $ —Amortization and impairment of acquisition-related intangibles and costs . . . . . . . . . . . . . . . $ 179 $ 301 $ 548Purchased in-process research and development . . . . . . . . . . . . . . . . . . . . . . . . . . . . . . . . . . $ — $ 5 $ 20
Research and development spending increased $418 million, or 10%, in 2004 compared to 2003, and increased $326 million, or8%, in 2003 compared to 2002. This increase in 2004 compared to 2003 was primarily due to higher expenses related to developmentfor manufacturing process technologies, including the 65-nanometer process on 300mm wafers, and higher expenses for productdevelopment programs in the Intel Architecture business, as well as higher profit-dependent compensation expenses. The increase in2003 compared to 2002 was primarily due to higher expenses for product development programs in the Intel Architecture business andhigher spending on the development of manufacturing process technologies, including the 65-nanometer process technology, as well ashigher profit-dependent compensation expenses.
Marketing, general and administrative expenses increased $381 million, or 9%, in 2004 compared to 2003. The increase in 2004was primarily due to higher cooperative advertising expenses (as a result of higher revenue in our Intel Architecture business andbecause our customers used a higher percentage of their available Intel Inside® program funds) and increased profit-dependentcompensation expenses. In addition, the increase was due to higher marketing expenses from additional marketing programs andincreased advertising expenses. Marketing, general and administrative expenses were flat in 2003 compared to 2002. In 2003, welowered our discretionary spending and other expenses as we reduced headcount and refocused on core strategic areas. This decrease inexpenses was offset by higher marketing expenses due to the launch of the Intel Centrino mobile technology brand in 2003; increasedprofit-dependent compensation expenses; and higher expenses related to the Intel Inside cooperative advertising program, primarilydue to higher microprocessor revenue.
Research and development along with marketing, general and administrative expenses were approximately 28% of net revenue in2004, 29% of net revenue in 2003 and 31% of net revenue in 2002.
Amortization of acquisition-related intangibles and costs was $179 million in 2004, $301 million in 2003 and $548 million in2002. The decreased amortization each year compared to the previous year was primarily due to a portion of the intangibles related toprior acquisitions becoming fully amortized.
During the fourth quarter of 2004, we completed our annual impairment review for goodwill and determined that the fair value ofthe ICG reporting unit was in excess of its carrying value; therefore goodwill was not impaired. In our 2003 goodwill impairmentreview, we found indicators of impairment for the then-existing WCCG reporting unit. At that time, the WCCG business, comprisingprimarily flash memory products and cellular baseband chipsets, had not performed as management had expected. In the fourth quarterof 2003, it became apparent that WCCG was expected to grow more slowly than previously projected. A slower-than-expected rolloutof products and slower-than-expected customer acceptance of our products in the baseband chipset business, as well as a delay in thetransition to next-generation phone networks, had pushed out the forecasts for sales of products for high-end data cell phones. Thesefactors resulted in lower growth expectations for the reporting unit and triggered a $611 million charge for impairment of goodwill.Also during 2003, we recorded a $6 million charge for impairment of the goodwill related to one of our seed businesses. Seedbusinesses support the company’s strategic initiatives.
33

MANAGEMENT’S DISCUSSION AND ANALYSIS OF FINANCIAL CONDITION AND RESULTS OF OPERATIONS(Continued)
Losses on Equity Securities, Interest and Other, and Taxes
Losses on equity securities, net, interest and other, net and taxes for the three years ended December 25, 2004 were as follows:
(In Millions) 2004 2003 2002
Losses on equity securities, net . . . . . . . . . . . . . . . . . . . . . . . . . . . . . . . . . . . . . . . . . . . . . . . $ (2) $ (283) $ (372)Interest and other, net . . . . . . . . . . . . . . . . . . . . . . . . . . . . . . . . . . . . . . . . . . . . . . . . . . . . . . . $ 289 $ 192 $ 194Provision for taxes . . . . . . . . . . . . . . . . . . . . . . . . . . . . . . . . . . . . . . . . . . . . . . . . . . . . . . . . . $2,901 $1,801 $1,087
Losses on equity securities and certain equity derivatives for 2004 were $2 million compared to $283 million for 2003. Theimprovement was primarily driven by lower impairment charges on investments, particularly on non-marketable equity securities(approximately $117 million for 2004 and $319 million for 2003). The decrease in the impairment charges in 2004 reflected thedecrease in the total carrying amount of the non-marketable equity investment portfolio over the past couple of years. The net loss for2003 also included mark-to-market losses on certain equity securities and equity derivatives offset by gains on equity transactionscompleted in 2003.
Losses on equity securities and certain equity derivatives for 2003 decreased to $283 million compared to $372 million for 2002.The lower net loss for 2003 was primarily due to lower impairment charges. For 2002, the impairment charges of $524 million werepartially offset by net gains of approximately $57 million related to equity securities designated as trading assets and $110 million ofnet gains on related equity derivatives. The $57 million in net gains included a gain of approximately $120 million, resulting from thedesignation of formerly restricted equity investments as trading assets as they became marketable. The cumulative difference betweentheir cost and fair market value at the time they became marketable was recorded as a gain in 2002.
Interest and other, net increased to $289 million in 2004 compared to $192 million in 2003, reflecting higher interest income as aresult of higher average investment balances and higher interest rates. Interest and other, net for 2004 also included approximately $60million of gains associated with terminating financing arrangements for manufacturing facilities and equipment in Ireland.
Our effective income tax rate was 27.8% in 2004, 24.2% in 2003 and 25.9% in 2002. The increase in the rate for 2004 wasprimarily due to a higher amount of tax benefits related to divestitures during 2003 partially offset by an increase in the benefit forexport sales. The tax rate for 2004 included a $195 million reduction to the tax provision, primarily from additional benefits for exportsales along with higher than anticipated state tax benefits for divestitures, as well as the reversal of previously accrued taxes of $62million, primarily related to the closing of a state income tax audit. The rate for 2003 included a $758 million reduction to the taxprovision related to divestitures, partially offset by the non-deductible goodwill impairment charge.
The decrease in the effective tax rate in 2003 compared to 2002 was primarily attributed to the tax benefits of $758 million relatedto divestitures that closed during 2003. Although the pre-tax losses on the divestitures for financial statement purposes were notsignificant, the company was able to recognize tax losses because the tax basis in the stock of the companies sold exceeded the bookbasis. The impact of these benefits was partially offset by the non-deductible goodwill impairment charge recorded in 2003 and ahigher percentage of profits in higher tax jurisdictions.
34

MANAGEMENT’S DISCUSSION AND ANALYSIS OF FINANCIAL CONDITION AND RESULTS OF OPERATIONS(Continued)
Financial Condition
Our financial condition remains strong. At December 25, 2004, cash, short-term investments and fixed income debt instrumentsincluded in trading assets totaled $16.8 billion, up from $15.9 billion at December 27, 2003. At December 25, 2004, total short-termand long-term debt was $904 million and represented approximately 2% of stockholders’ equity. At December 27, 2003, total debt was$1.2 billion and represented approximately 3% of stockholders’ equity.
Cash provided by operating activities is net income adjusted for certain non-cash items and changes in assets and liabilities. For2004, cash provided by operating activities was $13.1 billion, compared to $11.5 billion in 2003 and $9.1 billion in 2002. In 2004, themajority of the increase in cash provided by operating activities was due to higher net income. Working capital sources of cashincluded increases in income taxes payable, accrued compensation and benefits, and accounts payable. The increase in income taxespayable was primarily due to the timing of refunds and higher earnings in 2004 compared to 2003, partially offset by higher estimatedtax payments made for 2004. Accrued compensation and benefits increased, primarily due to higher accruals related to employeebonuses. Accounts payable was higher, primarily due to the timing of capital expenditures. Accounts receivable was relatively flat in2004 compared to 2003 and increased in 2003 over 2002 levels, primarily due to higher revenue in 2003. Despite an increase in sales,the days’ sales outstanding decreased to 34 days at December 2004 compared to 36 days at December 2003 and 34 days at December2002. The decrease in 2004 was due to a higher proportion of sales occurring at the beginning of the fourth quarter. For 2004, our threelargest customers accounted for approximately 42% of net revenue, with one of these customers accounting for approximately 19% ofrevenue and another customer accounting for approximately 16%. For 2003, our three largest customers accounted for approximately42% of net revenue (38% of net revenue for 2002). Additionally, these three largest customers accounted for approximately 45% of netaccounts receivable at December 25, 2004 (approximately 43% at December 27, 2003 and 39% at December 28, 2002). Inventorieswere relatively flat in 2004 compared to 2003 levels but represented increases over 2002, primarily due to ramping of new products atthat time. During 2003, working capital uses of cash also included a decrease in income taxes payable.
Investing cash flows consist primarily of capital expenditures and the proceeds of investments sold and payment for investmentsacquired. We used $5.0 billion in net cash for investing activities during 2004, compared to $7.1 billion during 2003 and $5.8 billionduring 2002. The higher cash used in investing activities in 2003 resulted from higher net purchases of available-for-sale investmentsdue to improved corporate credit profiles that facilitated a slight shift in our portfolio of investments in debt securities to longer termmaturities during that year. Capital expenditures were $3.8 billion, $3.7 billion and $4.7 billion in 2004, 2003 and 2002, respectively,reflecting a lower investment in capital equipment and construction, primarily for additional microprocessor manufacturing capacity inrecent years. Capital spending for 2005 is expected to be between $4.9 billion and $5.3 billion, primarily driven by investments in300mm, 65-nanometer production equipment.
Financing cash flows consist primarily of repurchases and retirement of common stock and payment of dividends to stockholders.We used $7.7 billion in net cash for financing activities in 2004 compared to $3.9 billion in 2003 and 2002. During 2004, our Board ofDirectors authorized the repurchase of an additional 500 million shares of common stock under the company’s ongoing stockrepurchase program, and in 2004 we purchased 301 million shares of common stock for $7.5 billion (176 million shares for $4.0 billionin 2003 and 183 million shares for $4.0 billion in 2002). At December 25, 2004, approximately 614 million shares remained availablefor repurchase under existing repurchase authorizations. Payment of dividends was $1.0 billion in 2004 ($524 million in 2003 and$533 million in 2002) due to an increase in the quarterly cash dividend from $0.02 per share to $0.04 per share effective beginning inthe first quarter of 2004. On February 2, 2005, our Board of Directors declared a cash dividend of $0.08 per common share for the firstquarter of 2005. The dividend is payable on March 1, 2005 to stockholders of record on February 7, 2005. Financing sources of cashduring 2004 were primarily $894 million in proceeds from the sale of shares pursuant to employee equity incentive plans ($967 millionin 2003 and $681 million in 2002).
Another potential source of liquidity is authorized borrowings, including commercial paper, of $3.0 billion. Maximumborrowings under our commercial paper program during 2004 were approximately $550 million, although no commercial paper wasoutstanding at the end of the period. We also maintain the ability to issue an aggregate of approximately $1.4 billion in debt, equity andother securities under U.S. Securities and Exchange Commission (SEC) shelf registration statements.
We believe that we have the financial resources needed to meet business requirements for the next 12 months, including capitalexpenditures for the expansion or upgrading of worldwide manufacturing and assembly and test capacity, working capitalrequirements, the dividend program, potential stock repurchases and potential future acquisitions or strategic investments.
35

MANAGEMENT’S DISCUSSION AND ANALYSIS OF FINANCIAL CONDITION AND RESULTS OF OPERATIONS(Continued)
Contractual Obligations
The following table summarizes our significant contractual obligations at December 25, 2004, and the effect such obligations areexpected to have on our liquidity and cash flows in future periods. This table excludes amounts already recorded on our balance sheetas current liabilities at December 25, 2004:
Payments Due by Period
(In Millions) TotalLess than
1 year 1–3 years 3–5 yearsMore than
5 years
Operating lease obligations . . . . . . . . . . . . . . . . . . . . . . . . . $ 563 $ 124 $ 138 $ 79 $ 222Capital purchase obligations1 . . . . . . . . . . . . . . . . . . . . . . . . 2,752 2,532 220 — —Other purchase obligations and commitments2 . . . . . . . . . . 687 264 406 17 —Long-term debt obligations . . . . . . . . . . . . . . . . . . . . . . . . . 736 33 80 171 452
Total3 . . . . . . . . . . . . . . . . . . . . . . . . . . . . . . . . . . . . . . . . . $ 4,738 $ 2,953 $ 844 $ 267 $ 674
1 Capital purchase obligations represent commitments for construction or purchase of property, plant and equipment. They werenot recorded as liabilities on our balance sheet as of December 25, 2004, as we had not yet received the related goods or takentitle to the property. Capital purchase obligations increased from $1.5 billion at December 27, 2003 to $2.8 billion atDecember 25, 2004, primarily due to purchase obligations for capital equipment relating to our next-generation 65-nanometerprocess technology.
2 Other purchase obligations and commitments include payments due under various types of licenses and non-contingent fundingobligations. Funding obligations include, for example, agreements to fund various projects with other companies, such as co-marketing and co-development initiatives.
3 Total does not include contractual obligations recorded on the balance sheet as current liabilities or certain purchaseobligations, as discussed below.
Contractual obligations for purchases of goods or services are defined as agreements that are enforceable and legally binding onIntel and that specify all significant terms, including fixed or minimum quantities to be purchased; fixed, minimum or variable priceprovisions; and the approximate timing of the transaction. Our purchase orders are based on our current manufacturing needs and arefulfilled by our vendors within short time horizons. In addition, some of our purchase orders represent authorizations to purchase ratherthan binding agreements. We do not have significant agreements for the purchase of raw materials or other goods specifying minimumquantities and set prices that exceed our expected requirements for three months. Therefore, agreements for the purchase of rawmaterials and other goods and services are not included in the table above. Agreements for outsourced services generally containclauses allowing for cancellation without significant penalty, and are therefore not included in the table above.
Contractual obligations that are contingent upon the achievement of certain milestones are not included in the table above. Theseobligations include contingent funding obligations, milestone-based equity investment funding, and acquisition-related deferred cashcompensation contingent upon future employment. These arrangements are not considered contractual obligations until the milestone ismet by the third party. As of December 25, 2004, assuming all future milestones were met, additional required payments would beapproximately $23 million.
The expected timing of payments of the obligations above is estimated based on current information. Timing of payments andactual amounts paid may be different, depending on the time of receipt of goods or services, or changes to agreed-upon amounts forsome obligations. Amounts disclosed as contingent or milestone-based obligations are dependent on the achievement of the milestonesor the occurrence of the contingent events and can vary significantly.
Off-Balance-Sheet Arrangements
As of December 25, 2004, we did not have any significant off-balance-sheet arrangements, as defined in Item 303(a)(4)(ii) ofSEC Regulation S-K.
36

MANAGEMENT’S DISCUSSION AND ANALYSIS OF FINANCIAL CONDITION AND RESULTS OF OPERATIONS(Continued)
Employee Equity Incentive Plans
Our stock option program is a broad-based, long-term retention program that is intended to attract and retain talented employeesand align stockholder and employee interests. In May 2004, stockholder approval was obtained for the 2004 Equity Incentive Plan (the2004 Plan). Under the 2004 Plan, 240 million shares of common stock were made available for issuance during the two-year periodending June 30, 2006. Under the 2004 Plan, options to purchase shares may be granted to all employees and non-employee directors.We may also use other types of equity incentive awards, such as restricted stock, stock units and stock appreciation rights. The 2004Plan also allows for performance-based vesting for equity incentive awards. We presently expect to request stockholder approval at ourMay 2005 Annual Stockholders’ Meeting to extend the term of the 2004 Plan by one year, to June 30, 2007, and make additionalcommon shares available for issuance as equity awards to employees and non-employee directors during this period.
We have a goal to keep the potential incremental dilution related to our option program to a long-term average of less than 2%annually. The dilution percentage is calculated using the new option grants for the year, net of options cancelled due to employeesleaving the company and options expired, divided by the total outstanding shares at the beginning of the year.
Options granted to employees, including officers, and non-employee directors from 2000 through 2004 are summarized asfollows:
(Shares in Millions) 2004 2003 2002 2001 2000
Total options granted1 . . . . . . . . . . . . . . . . . . . . . . . . . . . . . . . . . . . . . . . . . . . . . . 115 110 174 238 163Less options cancelled1 . . . . . . . . . . . . . . . . . . . . . . . . . . . . . . . . . . . . . . . . . . . . . (32) (40) (44) (47) (31)Net options granted . . . . . . . . . . . . . . . . . . . . . . . . . . . . . . . . . . . . . . . . . . . . . . . . 83 70 130 191 132Net grants as % of outstanding shares2 . . . . . . . . . . . . . . . . . . . . . . . . . . . . . . . . . . 1.3% 1.1% 1.9% 2.8% 2.0%Grants to listed officers3 as % of total options granted . . . . . . . . . . . . . . . . . . . . . . 1.1% 2.4% 1.7% 0.8% 0.4%Grants to listed officers3 as % of outstanding shares2 . . . . . . . . . . . . . . . . . . . . . . . <0.1% <0.1% <0.1% <0.1% <0.1%Cumulative options held by listed officers3 as % of total options outstanding . . . . 2.1% 2.1% 2.1% 2.0% 2.4%
1 Excluding options assumed in connection with acquisitions.
2 Outstanding shares as of the beginning of each period.
3 For 2004, “listed officers” included our Chief Executive Officer and each of the five other most highly compensated executiveofficers serving at the end of 2004. One of these listed officers retired in January 2005. For 2000 through 2003, “listedofficers” included our Chief Executive Officer and each of the four other most highly compensated executive officers serving atthe end of the years presented.
In accordance with a policy established by the Compensation Committee of the Board of Directors, total options granted to listedofficers may not exceed 5% of total options granted in any year. During 2004, options granted to listed officers amounted to 1.1% ofthe grants made to all employees. All stock option grants to executive officers are made after a review by, and with the approval of, theCompensation Committee. All members of the Compensation Committee are independent directors, as defined in the applicable rulesfor issuers traded on The NASDAQ Stock Market*.
For additional information regarding the equity incentive plans and the activity for the past three years, see “Note 11: EmployeeEquity Incentive Plans” in Part II, Item 8 of this Form 10-K. Information regarding our equity incentive plans should be read inconjunction with the information appearing under the heading “Report of the Compensation Committee on Executive Compensation”in our 2005 Proxy Statement, which is incorporated by reference.
37

MANAGEMENT’S DISCUSSION AND ANALYSIS OF FINANCIAL CONDITION AND RESULTS OF OPERATIONS(Continued)
In-the-money and out-of-the-money† option information as of December 25, 2004 was as follows:
Exercisable Unexercisable Total
(Shares in Millions) Shares
WeightedAverage
Exercise Price Shares
WeightedAverage
Exercise Price Shares
WeightedAverage
Exercise Price
In-the-money . . . . . . . . . . . . . . 240.5 $ 16.01 162.6 $ 19.35 403.1 $ 17.36Out-of-the-money . . . . . . . . . . . 157.0 $ 35.81 323.8 $ 32.73 480.8 $ 33.73
Total options outstanding . . . . 397.5 $ 23.83 486.4 $ 28.25 883.9 $ 26.26
† Out-of-the-money options have an exercise price equal to or above $23.54, the closing price of Intel stock at the end of fiscal2004, as reported on The NASDAQ Stock Market*.
Options granted to listed officers as a group during 2004 were as follows:
Number ofSecurities
UnderlyingOption Grants
Percent of TotalOptions Granted
to EmployeesExercise Price
Per Share Expiration Date
Potential Realizable Values at AssumedAnnual Rates of Stock Price Appreciation
for Option Term†
5% 10%
1,210,000 1.1% $27.00 2014 $20,542,200 $52,057,900
† Represents gains that could accrue for these options, assuming that the market price of Intel common stock appreciates over aperiod of 10 years at annualized rates of 5% and 10% from the date of grant. If the stock price does not increase above theexercise price, the realized value from these options would be zero.
Option exercises during 2004 and option values for listed officers as a group as of December 25, 2004 were as follows:
Shares Acquiredon Exercise Value Realized
Number of Shares Underlying UnexercisedOptions at December 25, 2004
Values of Unexercised In-the-MoneyOptions at December 25, 2004†
Exercisable Unexercisable Exercisable Unexercisable
1,604,000 $31,688,800 7,894,100 10,525,500 $62,308,200 $23,134,800
† These amounts represent the difference between the exercise price and $23.54, the closing price of Intel stock at the end offiscal 2004, for all in-the-money options held by listed officers.
Information as of December 25, 2004 regarding equity compensation plans approved and not approved by stockholders issummarized in the following table (shares in millions):
Plan Category
(A)Number of Shares to
Be Issued UponExercise of
Outstanding Options
(B)Weighted AverageExercise Price of
OutstandingOptions
(C)Number of Shares
Remaining Availablefor Future Issuance
Under EquityIncentive Plans
(Excluding SharesReflected inColumn A)
Equity incentive plans approved by stockholders . . . . . . . . . 154.6 $18.73 287.91
Equity incentive plans not approved by stockholders2 . . . . . 722.8 $27.97 —
Total . . . . . . . . . . . . . . . . . . . . . . . . . . . . . . . . . . . . . . . . . . 877.43 $26.34 287.9
1 Includes 67.5 million shares available under our 1976 Employee Stock Participation Plan.
2 Consists of shares available under our 1997 Stock Option Plan.
3 Total excludes 6.5 million shares issuable under outstanding options, with a weighted average exercise price of $16.26,originally granted under plans we assumed in connection with acquisitions. The 1997 Stock Option Plan was terminated as tofuture grants when the 2004 Equity Incentive Plan was approved by the stockholders in May 2004.
38

MANAGEMENT’S DISCUSSION AND ANALYSIS OF FINANCIAL CONDITION AND RESULTS OF OPERATIONS(Continued)
1997 Stock Option Plan
The 1997 Stock Option Plan (the 1997 Plan) provided for the grant of stock options to employees other than officers anddirectors. This plan, which was not approved by stockholders, was terminated as to future grants when the 2004 Plan was approved bythe stockholders in May 2004. The 1997 Plan is administered by the Compensation Committee of the Board of Directors, which hasthe power to determine matters relating to outstanding option awards under the plan, including conditions of vesting and exercisability.Options granted under the 1997 Plan expire no later than 10 years from the grant date. Options granted under this Plan generally vestwithin five years, with some options granted in 2003 and 2004 vesting in increments over four or five years from the date of grant andcertain grants to key employees having delayed vesting generally beginning six years from the date of grant.
39

MANAGEMENT’S DISCUSSION AND ANALYSIS OF FINANCIAL CONDITION AND RESULTS OF OPERATIONS(Continued)
Business Outlook
In 2005, we are planning for continued growth in annual revenue and increasing gross margin dollars. We also expect to seecontinued growth in the total number of computers using our microprocessors. Further, we expect continued benefit from theproductive use of our 90-nanometer process technology on 300mm wafers. At the same time, we will continue to invest in our nextgeneration 65-nanometer process technology. Revenue for ICG is largely dependent on our continuing to secure design wins for ourcustomers’ new and existing products, on supplying the products for these design wins and on OEMs taking the product designs toproduction. Demand for our flash memory products is uncertain in the highly competitive cellular handset market segment. Revenuegrowth for our flash memory products is largely dependent on customer demand for higher density flash memory and continued useradoption of new leading-edge cellular handsets. The statements below do not include any impact related to the expensing of stockoptions according to Statement of Financial Accounting Standards (SFAS) No. 123R, “Share-Based Payment.” If we had appliedSFAS No. 123R to our results for the year ended December 25, 2004, our gross margin percentage would have been lower byapproximately one percentage point. In addition, the expensing of stock options would increase operating expenses, which include bothR&D expenses and marketing, general and administrative expenses, and would affect the tax rate. See “Note 2: Accounting Policies”in Part II, Item 8 of this Form 10-K.
Our financial results are substantially dependent on sales of microprocessors and related components by the Intel Architectureoperating segment. Revenue is partly a function of the mix of types and performance capabilities of microprocessors sold, as well asthe mix of related chipsets and motherboards, all of which are difficult to forecast. Because of the wide price differences amongdesktop, mobile and server microprocessors, the mix of types and performance levels of microprocessors sold affects the averageselling price that we will realize and has a large impact on our revenue and gross margin. Microprocessor revenue is also dependent onthe availability of other parts of the system platform, including chipsets, motherboards, operating system software and applicationsoftware. Revenue is also affected by our sales of other semiconductor and non-semiconductor products, and is subject to the impact ofeconomic conditions in various geographic regions.
Our gross margin expectation for 2005 is 58% plus or minus a few points. The 58% midpoint is approximately flat compared toour 2004 gross margin of 57.7%. In the first half of 2005, higher unit volumes for microprocessors and higher factory utilization areexpected to be offset by higher start-up costs related to the ramp of our 65-nanometer process technology. In the second half of 2005,these start-up costs should decline, and if our business progresses according to typical seasonal patterns, we expect our gross marginpercentage to be higher than in the first half of 2005.
Our gross margin varies primarily with revenue levels, which are dependent on unit volumes and prices, as well as the mix oftypes and performance levels of processors sold, and the mix of microprocessors, related chipsets and motherboards, and othersemiconductor and non-semiconductor products. Variability of other factors will also continue to affect cost of sales and the grossmargin percentage, including unit costs and yield issues associated with production at our factories, timing and execution of theproduction ramp, excess of manufacturing or assembly and test capacity, the reusability of factory equipment, impairment ofmanufacturing or assembly and test assets, excess inventory, inventory obsolescence and variations in inventory valuation.
We have significantly expanded our semiconductor manufacturing and assembly and test capacity over the last few years, and wecontinue to plan capacity based on the assumed continued success of our overall strategy and the acceptance of our products in specificmarket segments. We currently expect that capital spending will be between $4.9 billion and $5.3 billion in 2005, compared to $3.8billion in 2004. The midpoint of this range, $5.1 billion, is significantly higher than in 2004. Most of the projected increase will bespent to ramp capacity on our 65-nanometer process technology in 300mm factories. In fact, 90% of our fab equipment spending isanticipated to be on 65-nanometer process technology. This capital-spending plan is dependent on expectations regarding productionefficiencies and delivery times of various machinery and equipment, and construction schedules. If the demand for our products doesnot grow and continue to move toward higher performance products in the various market segments, revenue and gross margin wouldbe adversely affected, and manufacturing and/or assembly and test capacity would be under-utilized, and the rate of capital spendingcould be reduced. We could be required to record an impairment of our manufacturing or assembly and test equipment and/or facilities,or factory planning decisions may cause us to record accelerated depreciation. However, in the long term, revenue and gross marginmay also be affected if we do not add capacity fast enough to meet market demand.
Depreciation for 2005 is expected to be approximately $4.4 billion, plus or minus $100 million, compared to $4.6 billion in 2004.
40

MANAGEMENT’S DISCUSSION AND ANALYSIS OF FINANCIAL CONDITION AND RESULTS OF OPERATIONS(Continued)
Our industry is characterized by very short product life cycles, and our continued success is dependent on technologicaladvancement, including developing and implementing new processes and strategic products for specific market segments. Because weconsider it imperative to maintain a strong research and development program, spending for research and development in 2005 isexpected to increase to approximately $5.2 billion from $4.8 billion in 2004.
Based on acquisitions completed through February 16, 2005, we expect amortization of acquisition-related intangibles and coststo be approximately $120 million in 2005.
At the end of 2004, we held non-marketable equity securities with a carrying value of $507 million. A number of these companiesare likely to fail. Their success (or lack thereof) is dependent upon product development, market acceptance, operational efficiency andother key business success factors. In addition, depending on their future prospects, they may not be able to raise additional financingswhen needed, or they may receive lower valuations with less favorable investment terms than in previous financings, and theinvestments would likely become impaired. However, we are not able to determine at the present time which specific investments arelikely to be impaired in the future, or the extent or timing of individual impairments.
Our non-marketable equity securities are part of the Intel Capital program. The program seeks to invest in companies andbusinesses that can succeed and have an impact on their market segment. However, these types of investments involve a great deal ofrisk, and there can be no assurance that any specific company, whether at an early or mature stage, or somewhere in between, will growor will be successful. Consequently, we could lose all or part of our investment. When the strategic objectives of an investment havebeen achieved, or if the investment or business diverges from our strategic objectives, we may decide to dispose of the investment.However, our investments in non-marketable equity securities are not liquid, and there can be no assurance that we will be able todispose of these investments on favorable terms or at all.
We currently expect our tax rate to be approximately 31% for 2005. The estimated effective tax rate is based on tax law in effectat December 25, 2004 and current expected income, and assumes that the company will continue to receive the tax benefit for exportsales. See “Note 10: Provision for Taxes” and “Note 18: Contingencies” in Part II, Item 8 of this Form 10-K. The tax rate expectationfor 2005 does not reflect the impact of any potential repatriation of earnings under the American Jobs Creation Act of 2004 (the JobsAct), as we are currently reviewing the provisions of the Jobs Act. If we were to repatriate earnings, our tax expense would increase.The tax rate may also be affected by the closing of acquisitions or divestitures, the jurisdictions in which profits are determined to beearned and taxed, changes in estimates of credits and deductions, the resolution of issues arising from tax audits with various taxauthorities, the finalization of various tax returns and changes in our ability to realize deferred tax assets.
We are currently a party to various legal proceedings and claims, including legal proceedings and claims related to taxes and toallegations of patent infringement. Management does not believe that the ultimate outcome of these legal proceedings and claims willhave a material adverse effect on our financial position, cash flows or overall trends in results of operations. However, litigation issubject to inherent uncertainties, and unfavorable rulings could occur. An unfavorable ruling could include monetary damages,invalidation of a patent or group of patents, additional taxes owed or, in cases where injunctive relief is sought, an injunctionprohibiting Intel from selling one or more products. If an unfavorable ruling were to occur in any specific period, there exists thepossibility of a material adverse impact on the results of operations of that period or future periods. Management believes that, givenour current liquidity and cash and investment balances, even an adverse judgment would not have a material impact on cash andinvestments or liquidity.
We operate globally, with sales offices and research and development as well as manufacturing and assembly and test facilities inmany countries, and, as a result, we are subject to risks and factors associated with doing business outside the U.S. Global operationsinvolve inherent risks that include currency controls and fluctuations, tariff and import regulations, and regulatory requirements thatmay limit our or our customers’ ability to manufacture, assemble and test, design, develop or sell products in particular countries. Ifterrorist activity, armed conflict, civil or military unrest, or political instability occurs in the U.S., Israel or other locations, such eventsmay disrupt manufacturing, assembly and test, logistics, security and communications, and could also result in reduced demand for ourproducts. The impacts of major health concerns or possible infrastructure disruptions, such as large-scale outages or interruptions ofservice from utilities or telecommunications providers, on Intel, its suppliers, customers or other third parties could also adverselyaffect our business and impact customer order patterns. Business continuity could also be affected if labor issues disrupt ourtransportation arrangements or those of our customers or suppliers. In addition, we may rely on a single or limited number of suppliers,or upon suppliers in a single country. On a worldwide basis, we regularly review our key infrastructure, systems, services andsuppliers, both internally and externally, to seek to identify significant vulnerabilities as well as areas of potential business impact if adisruptive event were to occur. Once identified, we assess the risks, and as we consider it to be appropriate, we initiate actions intendedto reduce the risks and their potential impact. However, there can be no assurance that we have identified all significant risks or that wecan mitigate all identified risks with reasonable effort.
41

MANAGEMENT’S DISCUSSION AND ANALYSIS OF FINANCIAL CONDITION AND RESULTS OF OPERATIONS(Continued)
Our future results of operations and the other forward-looking statements contained in this filing, including this MD&A, involve anumber of risks and uncertainties—in particular, the statements regarding our goals and strategies, new product introductions, plans tocultivate new businesses, market segment share and growth rate assumptions, future economic conditions and recovery in thecommunications businesses, revenue, pricing, gross margin and costs, capital spending, depreciation and amortization, research anddevelopment expenses, potential impairment of investments, the tax rate, and pending tax and legal proceedings. In addition to thevarious important factors discussed above, a number of other factors could cause actual results to differ materially from ourexpectations. Demand for our products, which impacts our revenue and gross margin percentage, is affected by business and economicconditions, as well as computing and communications industry trends and the development and timing of introduction of compellingsoftware applications and operating systems that take advantage of the features of our products. Demand for our products is alsoaffected by changes in customer order patterns, such as changes in the levels of inventory maintained by our customers and the timingof customer purchases. Intel operates in intensely competitive industries, and our revenue and gross margin could be affected by factorssuch as competing chip architectures and manufacturing technologies, competing software-compatible microprocessors, pricingpressures, actions taken by our competitors and other competitive factors, as well as market acceptance of our new products in specificmarket segments, the availability of sufficient inventory to meet demand and the availability of externally purchased components ormaterials. Our future revenue is also dependent on continuing technological advancement, including developing and implementing newprocesses and strategic products, as well as the timing of new product introductions, sustaining and growing new businesses, andintegrating and operating any acquired businesses. Our results could also be affected by adverse effects associated with product defectsand errata (deviations from published specifications), and by litigation or regulatory matters involving intellectual property orstockholder, consumer, antitrust and other issues.
We believe that we have the product offerings, facilities, personnel, and competitive and financial resources for continuedbusiness success, but future revenue, costs, gross margins and profits are all influenced by a number of factors, including thosediscussed above, all of which are inherently difficult to forecast.
Status of Business Outlook and Related Risk Factor Statements
We expect that our corporate representatives will from time to time meet privately with investors, investment analysts, the mediaand others, and may reiterate the forward-looking statements contained in the “Business Outlook” section and elsewhere in thisForm 10-K, including any such statements that are incorporated by reference in this Form 10-K. At the same time, we will keep thisForm 10-K and our then-current Business Outlook publicly available on our Investor Relations web site (www.intc.com). The publiccan continue to rely on the Business Outlook published on the web site as representing our current expectations on matters covered,unless we publish a notice stating otherwise. The statements in the Business Outlook and other forward-looking statements in thisForm 10-K are subject to revision during the course of the year in our quarterly earnings releases and SEC filings, our Mid-QuarterBusiness Updates and at other times.
We intend to publish a Mid-Quarter Business Update on March 10, 2005. From the close of business on March 4, 2005 untilpublication of the Update, we will observe a “quiet period” during which the Business Outlook and other forward-looking statementsfirst published in our earnings press release on January 11, 2005, as reiterated or updated as applicable, in this Form 10-K, should beconsidered historical, speaking as of prior to the quiet period only and not subject to update. During the quiet period, ourrepresentatives will not comment on the Business Outlook or our financial results or expectations.
A quiet period operating in similar fashion with regard to the Business Outlook and our Form 10-K will begin at the close ofbusiness on March 18, 2005 and will extend until the day that our next quarterly earnings release is published, presently scheduled forApril 19, 2005. We typically have quiet periods twice each quarter, in advance of our Earnings Release and Mid-Quarter BusinessUpdate; however, the exact timing and duration of those routine quiet periods, and any others we utilize from time to time, may vary atour discretion.
42

ITEM 7A. QUANTITATIVE AND QUALITATIVE DISCLOSURES ABOUT MARKET RISK
We are exposed to financial market risks, including changes in currency exchange rates, interest rates and marketable equitysecurity prices. To mitigate these risks, we may utilize derivative financial instruments, among other strategies. We do not usederivative financial instruments for speculative purposes. All of the potential changes noted below are based on sensitivity analysesperformed on our financial positions at December 25, 2004. Actual results may differ materially.
Currency Exchange Rates. We generally hedge currency risks of non-U.S.-dollar-denominated investments in debt securitieswith offsetting currency borrowings, currency forward contracts or currency interest rate swaps. Gains and losses on these non-U.S.-currency investments would generally be offset by corresponding losses and gains on the related hedging instruments, resulting innegligible net exposure.
A substantial majority of our revenue, expense and capital purchasing activities are transacted in U.S. dollars. However, we doenter into transactions in other currencies, primarily the Euro and certain other European and Asian currencies. To protect againstreductions in value and the volatility of future cash flows caused by changes in currency exchange rates, we have established balancesheet and forecasted transaction risk management programs. Currency forward contracts and currency options are generally utilized inthese hedging programs. Our hedging programs reduce, but do not always entirely eliminate, the impact of currency exchange ratemovements. We considered the historical trends in currency exchange rates and determined that it was reasonably possible that adversechanges in exchange rates of 20% for all currencies could be experienced in the near term. Such adverse changes, after taking intoaccount hedges and offsetting positions, would have resulted in an adverse impact on income before taxes of less than $30 million and$10 million at the end of 2004 and 2003, respectively.
Interest Rates. The primary objective of our investments in debt securities is to preserve principal while maximizing yields,without significantly increasing risk. To achieve this objective, the returns on our investments in fixed rate debt securities are generallyswapped to U.S. dollar LIBOR-based returns. We considered the historical volatility of the three-month LIBOR rate experienced inprior years and the duration of our investment portfolio, and determined that it was reasonably possible that an adverse change of 80basis points (0.80%), approximately 31% of the rate at the end of 2004, could be experienced in the near term. A hypothetical 0.80%increase in interest rates, after taking into account hedges and offsetting positions, would have resulted in a decrease in the fair value ofour investment securities of approximately $20 million and $10 million as of the end of 2004 and 2003, respectively.
Marketable Equity Security Prices. We have a portfolio of strategic equity investments that includes marketable strategic equitysecurities and derivative equity instruments such as warrants and options, as well as non-marketable equity investments. We invest incompanies that develop software, hardware and other technologies or provide services supporting our technologies. This strategicinvestment program helps advance our overall goal to be the preeminent supplier of building blocks to the worldwide digital economy.Our current investment focus areas include enabling mobile wireless devices, helping to advance the digital home, enhancing thedigital enterprise, advancing high-performance communications infrastructures and developing the next generation of siliconproduction technologies. Our focus areas tend to develop and change over time due to rapid advancements in the technology field.
Included in trading assets is a portfolio of marketable equity securities held to generate returns that generally offset changes inliabilities related to the equity market risk of certain deferred compensation arrangements. Due to the offset, these securities have beenexcluded from the following market price sensitivity analysis.
To the extent that our marketable portfolio of investments continues to have strategic value, we typically do not attempt to reduceor eliminate our market exposure. For those securities that we no longer consider strategic, we evaluate market and economic factors inour decision on the timing of disposal and whether it is possible and appropriate to hedge the equity market risk. As of December 25,2004, the fair value of our portfolio of marketable equity investments and equity derivative instruments, including hedging positions,was $662 million.
43

To assess the market price sensitivity of our marketable portfolio, we analyzed the historical movements over the past severalyears of high-technology stock indices that we considered appropriate. However, our marketable portfolio is substantially concentratedin two companies, which will affect the marketable portfolio’s price volatility. We currently have an investment in Micron Technology,Inc. with a fair value of approximately $400 million, or 60% of the total marketable portfolio value including equity derivativeinstruments at December 25, 2004. In addition, we have an investment in Elpida Memory, Inc. with a fair value of approximately $212million, or 32% of the total marketable portfolio value including equity derivative instruments at December 25, 2004. Prior to Elpida’spublic offering, this investment was included in our non-marketable portfolio and therefore excluded from our 2003 market pricesensitivity analysis. The investments in Micron and Elpida are part of our strategy to support the development and supply of DynamicRandom Access Memory (DRAM) products. Based on the analysis of the high-technology stock indices and the historical volatility ofMicron’s and Elpida’s stock as of December 25, 2004, we estimated that it was reasonably possible that the prices of the stocks in ourportfolio could experience a loss of 45% in the near term (55% as of the end of 2003).
Assuming a loss of 45% in market prices, and after reflecting the impact of hedges and offsetting positions, our portfolio coulddecrease in value by approximately $300 million, based on the value of the portfolio as of December 25, 2004. Assuming a loss of 55%in market prices, and after reflecting the impact of hedges and offsetting positions, our portfolio could decrease in value byapproximately $290 million, based on the value of the portfolio as of December 27, 2003. The assumed loss percentage used in 2004 islower than the assumed loss percentage used in 2003 due to the differences in the concentration of investments during each year. Thisestimate is not necessarily indicative of future performance, and actual results may differ materially.
Non-Marketable Equity Securities. Our strategic investments in non-marketable equity securities would also be affected by anadverse movement of equity market prices, although the impact cannot be directly quantified. Such a movement and the relatedunderlying economic conditions would negatively affect the prospects of the companies we invest in, their ability to raise additionalcapital and the likelihood of our being able to realize our investments through liquidity events such as initial public offerings, mergersand private sales. These types of investments involve a great deal of risk, and there can be no assurance that any specific company willgrow or become successful; consequently, we could lose all or part of our investment. At December 25, 2004, our strategic investmentsin non-marketable equity securities had a carrying amount of $507 million. No individual investment in our non-marketable portfoliowas significant as of December 25, 2004.
44

ITEM 8. FINANCIAL STATEMENTS AND SUPPLEMENTARY DATA
INDEX TO CONSOLIDATED FINANCIAL STATEMENTS
Page
Consolidated Statements of Income . . . . . . . . . . . . . . . . . . . . . . . . . . . . . . . . . . . . . . . . . . . . . . . . . . . . . . . . . . . . . . . . . . . . . . . . 46
Consolidated Balance Sheets . . . . . . . . . . . . . . . . . . . . . . . . . . . . . . . . . . . . . . . . . . . . . . . . . . . . . . . . . . . . . . . . . . . . . . . . . . . . . 47
Consolidated Statements of Cash Flows . . . . . . . . . . . . . . . . . . . . . . . . . . . . . . . . . . . . . . . . . . . . . . . . . . . . . . . . . . . . . . . . . . . . . 48
Consolidated Statements of Stockholders’ Equity . . . . . . . . . . . . . . . . . . . . . . . . . . . . . . . . . . . . . . . . . . . . . . . . . . . . . . . . . . . . . 49
Notes to Consolidated Financial Statements . . . . . . . . . . . . . . . . . . . . . . . . . . . . . . . . . . . . . . . . . . . . . . . . . . . . . . . . . . . . . . . . . . 50
Reports of Ernst & Young LLP, Independent Registered Public Accounting Firm . . . . . . . . . . . . . . . . . . . . . . . . . . . . . . . . . . . . . 78
Supplemental Data: Financial Information by Quarter . . . . . . . . . . . . . . . . . . . . . . . . . . . . . . . . . . . . . . . . . . . . . . . . . . . . . . . . . . 80
45

INTEL CORPORATIONCONSOLIDATED STATEMENTS OF INCOME
Three Years Ended December 25, 2004(In Millions—Except Per Share Amounts) 2004 2003 2002
Net revenue . . . . . . . . . . . . . . . . . . . . . . . . . . . . . . . . . . . . . . . . . . . . . . . . . . . . . . . . . . . . . . . . . . . . . . $34,209 $30,141 $26,764Cost of sales . . . . . . . . . . . . . . . . . . . . . . . . . . . . . . . . . . . . . . . . . . . . . . . . . . . . . . . . . . . . . . . . . . . . . . 14,463 13,047 13,446
Gross margin . . . . . . . . . . . . . . . . . . . . . . . . . . . . . . . . . . . . . . . . . . . . . . . . . . . . . . . . . . . . . . . . . . . . 19,746 17,094 13,318
Research and development . . . . . . . . . . . . . . . . . . . . . . . . . . . . . . . . . . . . . . . . . . . . . . . . . . . . . . . . . . . 4,778 4,360 4,034Marketing, general and administrative . . . . . . . . . . . . . . . . . . . . . . . . . . . . . . . . . . . . . . . . . . . . . . . . . . 4,659 4,278 4,334Impairment of goodwill . . . . . . . . . . . . . . . . . . . . . . . . . . . . . . . . . . . . . . . . . . . . . . . . . . . . . . . . . . . . . — 617 —Amortization and impairment of acquisition-related intangibles and costs . . . . . . . . . . . . . . . . . . . . . . . 179 301 548Purchased in-process research and development . . . . . . . . . . . . . . . . . . . . . . . . . . . . . . . . . . . . . . . . . . . — 5 20
Operating expenses . . . . . . . . . . . . . . . . . . . . . . . . . . . . . . . . . . . . . . . . . . . . . . . . . . . . . . . . . . . . . . . . 9,616 9,561 8,936
Operating income . . . . . . . . . . . . . . . . . . . . . . . . . . . . . . . . . . . . . . . . . . . . . . . . . . . . . . . . . . . . . . . . . 10,130 7,533 4,382Losses on equity securities, net . . . . . . . . . . . . . . . . . . . . . . . . . . . . . . . . . . . . . . . . . . . . . . . . . . . . . . . . (2) (283) (372)Interest and other, net . . . . . . . . . . . . . . . . . . . . . . . . . . . . . . . . . . . . . . . . . . . . . . . . . . . . . . . . . . . . . . . 289 192 194
Income before taxes . . . . . . . . . . . . . . . . . . . . . . . . . . . . . . . . . . . . . . . . . . . . . . . . . . . . . . . . . . . . . . . 10,417 7,442 4,204Provision for taxes . . . . . . . . . . . . . . . . . . . . . . . . . . . . . . . . . . . . . . . . . . . . . . . . . . . . . . . . . . . . . . . . . 2,901 1,801 1,087
Net income . . . . . . . . . . . . . . . . . . . . . . . . . . . . . . . . . . . . . . . . . . . . . . . . . . . . . . . . . . . . . . . . . . . . . . $ 7,516 $ 5,641 $ 3,117
Basic earnings per common share . . . . . . . . . . . . . . . . . . . . . . . . . . . . . . . . . . . . . . . . . . . . . . . . . . . . $ 1.17 $ 0.86 $ 0.47
Diluted earnings per common share . . . . . . . . . . . . . . . . . . . . . . . . . . . . . . . . . . . . . . . . . . . . . . . . . . $ 1.16 $ 0.85 $ 0.46
Weighted average common shares outstanding . . . . . . . . . . . . . . . . . . . . . . . . . . . . . . . . . . . . . . . . . 6,400 6,527 6,651
Weighted average common shares outstanding, assuming dilution . . . . . . . . . . . . . . . . . . . . . . . . . 6,494 6,621 6,759
See accompanying notes.
46

INTEL CORPORATIONCONSOLIDATED BALANCE SHEETS
December 25, 2004 and December 27, 2003(In Millions—Except Par Value) 2004 2003
AssetsCurrent assets:
Cash and cash equivalents . . . . . . . . . . . . . . . . . . . . . . . . . . . . . . . . . . . . . . . . . . . . . . . . . . . . . . . . . . . . . . . . . . $ 8,407 $ 7,971Short-term investments . . . . . . . . . . . . . . . . . . . . . . . . . . . . . . . . . . . . . . . . . . . . . . . . . . . . . . . . . . . . . . . . . . . . 5,654 5,568Trading assets . . . . . . . . . . . . . . . . . . . . . . . . . . . . . . . . . . . . . . . . . . . . . . . . . . . . . . . . . . . . . . . . . . . . . . . . . . . 3,111 2,625Accounts receivable, net of allowance for doubtful accounts of $43 ($55 in 2003) . . . . . . . . . . . . . . . . . . . . . . . 2,999 2,960Inventories . . . . . . . . . . . . . . . . . . . . . . . . . . . . . . . . . . . . . . . . . . . . . . . . . . . . . . . . . . . . . . . . . . . . . . . . . . . . . 2,621 2,519Deferred tax assets . . . . . . . . . . . . . . . . . . . . . . . . . . . . . . . . . . . . . . . . . . . . . . . . . . . . . . . . . . . . . . . . . . . . . . . 979 969Other current assets . . . . . . . . . . . . . . . . . . . . . . . . . . . . . . . . . . . . . . . . . . . . . . . . . . . . . . . . . . . . . . . . . . . . . . . 287 270
Total current assets . . . . . . . . . . . . . . . . . . . . . . . . . . . . . . . . . . . . . . . . . . . . . . . . . . . . . . . . . . . . . . . . . . . . . . . . 24,058 22,882
Property, plant and equipment, net . . . . . . . . . . . . . . . . . . . . . . . . . . . . . . . . . . . . . . . . . . . . . . . . . . . . . . . . . . . 15,768 16,661Marketable strategic equity securities . . . . . . . . . . . . . . . . . . . . . . . . . . . . . . . . . . . . . . . . . . . . . . . . . . . . . . . . . 656 514Other long-term investments . . . . . . . . . . . . . . . . . . . . . . . . . . . . . . . . . . . . . . . . . . . . . . . . . . . . . . . . . . . . . . . . 2,563 1,866Goodwill . . . . . . . . . . . . . . . . . . . . . . . . . . . . . . . . . . . . . . . . . . . . . . . . . . . . . . . . . . . . . . . . . . . . . . . . . . . . . . . . . 3,719 3,705Other assets . . . . . . . . . . . . . . . . . . . . . . . . . . . . . . . . . . . . . . . . . . . . . . . . . . . . . . . . . . . . . . . . . . . . . . . . . . . . . . 1,379 1,515
Total assets . . . . . . . . . . . . . . . . . . . . . . . . . . . . . . . . . . . . . . . . . . . . . . . . . . . . . . . . . . . . . . . . . . . . . . . . . . . . $48,143 $47,143
Liabilities and stockholders’ equityCurrent liabilities:
Short-term debt . . . . . . . . . . . . . . . . . . . . . . . . . . . . . . . . . . . . . . . . . . . . . . . . . . . . . . . . . . . . . . . . . . . . . . . . . . $ 201 $ 224Accounts payable . . . . . . . . . . . . . . . . . . . . . . . . . . . . . . . . . . . . . . . . . . . . . . . . . . . . . . . . . . . . . . . . . . . . . . . . 1,943 1,660Accrued compensation and benefits . . . . . . . . . . . . . . . . . . . . . . . . . . . . . . . . . . . . . . . . . . . . . . . . . . . . . . . . . . 1,858 1,559Accrued advertising . . . . . . . . . . . . . . . . . . . . . . . . . . . . . . . . . . . . . . . . . . . . . . . . . . . . . . . . . . . . . . . . . . . . . . 894 716Deferred income on shipments to distributors . . . . . . . . . . . . . . . . . . . . . . . . . . . . . . . . . . . . . . . . . . . . . . . . . . . 592 633Other accrued liabilities . . . . . . . . . . . . . . . . . . . . . . . . . . . . . . . . . . . . . . . . . . . . . . . . . . . . . . . . . . . . . . . . . . . 1,355 1,302Income taxes payable . . . . . . . . . . . . . . . . . . . . . . . . . . . . . . . . . . . . . . . . . . . . . . . . . . . . . . . . . . . . . . . . . . . . . 1,163 785
Total current liabilities . . . . . . . . . . . . . . . . . . . . . . . . . . . . . . . . . . . . . . . . . . . . . . . . . . . . . . . . . . . . . . . . . . . . . 8,006 6,879
Long-term debt . . . . . . . . . . . . . . . . . . . . . . . . . . . . . . . . . . . . . . . . . . . . . . . . . . . . . . . . . . . . . . . . . . . . . . . . . . . 703 936Deferred tax liabilities . . . . . . . . . . . . . . . . . . . . . . . . . . . . . . . . . . . . . . . . . . . . . . . . . . . . . . . . . . . . . . . . . . . . . . 855 1,482Commitments and contingencies (Notes 17 and 18)Stockholders’ equity:
Preferred stock, $0.001 par value, 50 shares authorized; none issued . . . . . . . . . . . . . . . . . . . . . . . . . . . . . . . . . — —Common stock, $0.001 par value, 10,000 shares authorized; 6,253 issued and outstanding (6,487 in 2003) and
capital in excess of par value . . . . . . . . . . . . . . . . . . . . . . . . . . . . . . . . . . . . . . . . . . . . . . . . . . . . . . . . . . . . . . 6,143 6,754Acquisition-related unearned stock compensation . . . . . . . . . . . . . . . . . . . . . . . . . . . . . . . . . . . . . . . . . . . . . . . . (4) (20)Accumulated other comprehensive income . . . . . . . . . . . . . . . . . . . . . . . . . . . . . . . . . . . . . . . . . . . . . . . . . . . . . 152 96Retained earnings . . . . . . . . . . . . . . . . . . . . . . . . . . . . . . . . . . . . . . . . . . . . . . . . . . . . . . . . . . . . . . . . . . . . . . . . 32,288 31,016
Total stockholders’ equity . . . . . . . . . . . . . . . . . . . . . . . . . . . . . . . . . . . . . . . . . . . . . . . . . . . . . . . . . . . . . . . . . . 38,579 37,846
Total liabilities and stockholders’ equity . . . . . . . . . . . . . . . . . . . . . . . . . . . . . . . . . . . . . . . . . . . . . . . . . . . . . $48,143 $47,143
See accompanying notes.
47

INTEL CORPORATIONCONSOLIDATED STATEMENTS OF CASH FLOWS
Three Years Ended December 25, 2004(In Millions) 2004 2003 2002
Cash and cash equivalents, beginning of year . . . . . . . . . . . . . . . . . . . . . . . . . . . . . . . . . . . . . . . . . $ 7,971 $ 7,404 $ 7,970
Cash flows provided by (used for) operating activities:Net income . . . . . . . . . . . . . . . . . . . . . . . . . . . . . . . . . . . . . . . . . . . . . . . . . . . . . . . . . . . . . . . . . . . 7,516 5,641 3,117Adjustments to reconcile net income to net cash provided by operating activities:
Depreciation . . . . . . . . . . . . . . . . . . . . . . . . . . . . . . . . . . . . . . . . . . . . . . . . . . . . . . . . . . . . . . . . 4,590 4,651 4,676Impairment of goodwill . . . . . . . . . . . . . . . . . . . . . . . . . . . . . . . . . . . . . . . . . . . . . . . . . . . . . . . . — 617 —Amortization and impairment of intangibles and other acquisition-related costs . . . . . . . . . . . . . 299 419 668Purchased in-process research and development . . . . . . . . . . . . . . . . . . . . . . . . . . . . . . . . . . . . . — 5 20Losses on equity securities, net . . . . . . . . . . . . . . . . . . . . . . . . . . . . . . . . . . . . . . . . . . . . . . . . . . 2 283 372Net loss on retirements and impairments of property, plant and equipment . . . . . . . . . . . . . . . . . 91 217 301Deferred taxes . . . . . . . . . . . . . . . . . . . . . . . . . . . . . . . . . . . . . . . . . . . . . . . . . . . . . . . . . . . . . . . (207) 391 110Tax benefit from employee equity incentive plans . . . . . . . . . . . . . . . . . . . . . . . . . . . . . . . . . . . . 344 216 270Changes in assets and liabilities:
Trading assets . . . . . . . . . . . . . . . . . . . . . . . . . . . . . . . . . . . . . . . . . . . . . . . . . . . . . . . . . . . . . (468) (698) (465)Accounts receivable . . . . . . . . . . . . . . . . . . . . . . . . . . . . . . . . . . . . . . . . . . . . . . . . . . . . . . . . . (39) (430) 30Inventories . . . . . . . . . . . . . . . . . . . . . . . . . . . . . . . . . . . . . . . . . . . . . . . . . . . . . . . . . . . . . . . . (101) (245) (26)Accounts payable . . . . . . . . . . . . . . . . . . . . . . . . . . . . . . . . . . . . . . . . . . . . . . . . . . . . . . . . . . . 283 116 (226)Accrued compensation and benefits . . . . . . . . . . . . . . . . . . . . . . . . . . . . . . . . . . . . . . . . . . . . . 295 276 107Income taxes payable . . . . . . . . . . . . . . . . . . . . . . . . . . . . . . . . . . . . . . . . . . . . . . . . . . . . . . . . 378 (361) 175Other assets and liabilities . . . . . . . . . . . . . . . . . . . . . . . . . . . . . . . . . . . . . . . . . . . . . . . . . . . . 136 417 —
Total adjustments . . . . . . . . . . . . . . . . . . . . . . . . . . . . . . . . . . . . . . . . . . . . . . . . . . . . . . . . 5,603 5,874 6,012
Net cash provided by operating activities . . . . . . . . . . . . . . . . . . . . . . . . . . . . . . . . . . . . . . . . . . . . . 13,119 11,515 9,129
Cash flows provided by (used for) investing activities:Additions to property, plant and equipment . . . . . . . . . . . . . . . . . . . . . . . . . . . . . . . . . . . . . . . . . . . (3,843) (3,656) (4,703)Acquisitions, net of cash acquired . . . . . . . . . . . . . . . . . . . . . . . . . . . . . . . . . . . . . . . . . . . . . . . . . . (53) (61) (57)Purchases of available-for-sale investments . . . . . . . . . . . . . . . . . . . . . . . . . . . . . . . . . . . . . . . . . . . (16,618) (11,662) (6,309)Maturities and sales of available-for-sale investments . . . . . . . . . . . . . . . . . . . . . . . . . . . . . . . . . . . 15,633 8,488 5,634Other investing activities . . . . . . . . . . . . . . . . . . . . . . . . . . . . . . . . . . . . . . . . . . . . . . . . . . . . . . . . . (151) (199) (330)
Net cash used for investing activities . . . . . . . . . . . . . . . . . . . . . . . . . . . . . . . . . . . . . . . . . . . . . . . . (5,032) (7,090) (5,765)
Cash flows provided by (used for) financing activities:Increase (decrease) in short-term debt, net . . . . . . . . . . . . . . . . . . . . . . . . . . . . . . . . . . . . . . . . . . . . 24 (152) (101)Additions to long-term debt . . . . . . . . . . . . . . . . . . . . . . . . . . . . . . . . . . . . . . . . . . . . . . . . . . . . . . . — — 55Repayments and retirement of debt . . . . . . . . . . . . . . . . . . . . . . . . . . . . . . . . . . . . . . . . . . . . . . . . . (31) (137) (18)Proceeds from sales of shares through employee equity incentive plans . . . . . . . . . . . . . . . . . . . . . 894 967 681Repurchase and retirement of common stock . . . . . . . . . . . . . . . . . . . . . . . . . . . . . . . . . . . . . . . . . . (7,516) (4,012) (4,014)Payment of dividends to stockholders . . . . . . . . . . . . . . . . . . . . . . . . . . . . . . . . . . . . . . . . . . . . . . . (1,022) (524) (533)
Net cash used for financing activities . . . . . . . . . . . . . . . . . . . . . . . . . . . . . . . . . . . . . . . . . . . . . . . . (7,651) (3,858) (3,930)
Net increase (decrease) in cash and cash equivalents . . . . . . . . . . . . . . . . . . . . . . . . . . . . . . . . . . . . 436 567 (566)
Cash and cash equivalents, end of year . . . . . . . . . . . . . . . . . . . . . . . . . . . . . . . . . . . . . . . . . . . . . . $ 8,407 $ 7,971 $ 7,404
Supplemental disclosures of cash flow information:Cash paid during the year for:
Interest . . . . . . . . . . . . . . . . . . . . . . . . . . . . . . . . . . . . . . . . . . . . . . . . . . . . . . . . . . . . . . . . . . . . . $ 52 $ 59 $ 66Income taxes, net of refunds . . . . . . . . . . . . . . . . . . . . . . . . . . . . . . . . . . . . . . . . . . . . . . . . . . . . $ 2,392 $ 1,567 $ 475
See accompanying notes.
48

INTEL CORPORATIONCONSOLIDATED STATEMENTS OF STOCKHOLDERS’ EQUITY
Common Stockand Capital
in Excess of Par Value
Acquisition-Related
UnearnedStock
Compen-sation
AccumulatedOther
Compre-hensiveIncome
RetainedEarnings Total
Three Years Ended December 25, 2004(In Millions—Except Per Share Amounts)
Number ofShares Amount
Balance at December 29, 2001 . . . . . . . . . . . . . . . . . 6,690 $ 8,833 $ (178) $ 25 $ 27,150 $ 35,830Components of comprehensive income, net of tax:
Net income . . . . . . . . . . . . . . . . . . . . . . . . . . . . . . . — — — — 3,117 3,117Other comprehensive income . . . . . . . . . . . . . . . . . — — — 18 — 18
Total comprehensive income . . . . . . . . . . . . . . . . 3,135
Proceeds from sales of shares through employeeequity incentive plans, tax benefit of $270 andother . . . . . . . . . . . . . . . . . . . . . . . . . . . . . . . . . . . . 68 951 — — — 951
Amortization of acquisition-related unearned stockcompensation, net of adjustments . . . . . . . . . . . . . . — (16) 115 — — 99
Repurchase and retirement of common stock . . . . . . . . (183) (2,127) — — (1,887) (4,014)Cash dividends declared ($0.08 per share) . . . . . . . . . . — — — — (533) (533)
Balance at December 28, 2002 . . . . . . . . . . . . . . . . . 6,575 7,641 (63) 43 27,847 35,468Components of comprehensive income, net of tax:
Net income . . . . . . . . . . . . . . . . . . . . . . . . . . . . . . . — — — — 5,641 5,641Other comprehensive income . . . . . . . . . . . . . . . . . — — — 53 — 53
Total comprehensive income . . . . . . . . . . . . . . . . 5,694
Proceeds from sales of shares through employeeequity incentive plans, tax benefit of $216 andother . . . . . . . . . . . . . . . . . . . . . . . . . . . . . . . . . . . . 88 1,183 — — — 1,183
Amortization of acquisition-related unearned stockcompensation, net of adjustments . . . . . . . . . . . . . . — (6) 43 — — 37
Repurchase and retirement of common stock . . . . . . . . (176) (2,064) — — (1,948) (4,012)Cash dividends declared ($0.08 per share) . . . . . . . . . . — — — — (524) (524)
Balance at December 27, 2003 . . . . . . . . . . . . . . . . . 6,487 6,754 (20) 96 31,016 37,846Components of comprehensive income, net of tax:
Net income . . . . . . . . . . . . . . . . . . . . . . . . . . . . . . . — — — — 7,516 7,516Other comprehensive income . . . . . . . . . . . . . . . . . — — — 56 — 56
Total comprehensive income . . . . . . . . . . . . . . . . 7,572
Proceeds from sales of shares through employeeequity incentive plans, tax benefit of $789(including reclassification of $445 related to prioryears) and other . . . . . . . . . . . . . . . . . . . . . . . . . . . . 67 1,683 — — — 1,683
Amortization of acquisition-related unearned stockcompensation, net of adjustments . . . . . . . . . . . . . . — — 16 — — 16
Repurchase and retirement of common stock . . . . . . . . (301) (2,294) — — (5,222) (7,516)Cash dividends declared ($0.16 per share) . . . . . . . . . . — — — — (1,022) (1,022)
Balance at December 25, 2004 . . . . . . . . . . . . . . . . . 6,253 $ 6,143 $ (4) $ 152 $ 32,288 $ 38,579
See accompanying notes.
49

INTEL CORPORATIONNOTES TO CONSOLIDATED FINANCIAL STATEMENTS
Note 1: Basis of Presentation
Intel Corporation has a 52- or 53-week fiscal year that ends on the last Saturday in December. Fiscal year 2004, a 52-week year,ended on December 25, 2004. Fiscal year 2003 was a 52-week year that ended on December 27, and fiscal year 2002, also a 52-weekyear, ended on December 28. The next 53-week year will end on December 31, 2005.
The consolidated financial statements include the accounts of Intel and its wholly owned subsidiaries. Intel is not involved withany variable interest entities, as defined by the Financial Accounting Standards Board (FASB) Interpretation No. 46, having asignificant effect on the financial statements. Intercompany accounts and transactions have been eliminated. Partially owned, non-controlled equity affiliates are accounted for under the equity method. Accounts denominated in non-United States currencies havebeen remeasured using the United States (U.S.) dollar as the functional currency. Certain amounts reported in previous years have beenreclassified to conform to the 2004 presentation. During 2004, the company reclassified $445 million from deferred tax liabilities tocommon stock and capital stock in excess of par value (see “Note 10: Provision for Taxes”). No amounts related to deferred taxliabilities were reclassified in the prior-period financial statements.
Note 2: Accounting Policies
Use of Estimates
The preparation of financial statements in conformity with accounting principles generally accepted in the U.S. requiresmanagement to make estimates and judgments that affect the amounts reported in the financial statements and accompanying notes.The accounting estimates that require management’s most difficult and subjective judgments include the assessment of recoverabilityof property, plant, and equipment and goodwill; the valuation of non-marketable equity securities and inventory; and the recognitionand measurement of income tax assets and liabilities. The actual results experienced by the company may differ from management’sestimates.
Cash and Cash Equivalents
Highly liquid debt securities with insignificant interest rate risk and with original maturities from the date of purchase of threemonths or less are classified as cash and cash equivalents.
Investments
Trading Assets. Trading assets are stated at fair value, with gains or losses resulting from changes in fair value recognizedcurrently in earnings. The company may elect to classify a portion of its marketable debt securities as trading assets. For these debtinstruments, gains or losses from changes in fair value due to interest rate and currency market fluctuations, offset by losses or gains onrelated derivatives, are included in interest and other, net. Also included in trading assets is a marketable equity portfolio held togenerate returns that seek to offset changes in liabilities related to the equity market risk of certain deferred compensationarrangements. Gains or losses from changes in fair value of these equity securities, offset by losses or gains on the related liabilities,are included in interest and other, net. The company also uses fixed income investments and derivative instruments to seek to offset theremaining portion of the changes in the compensation liabilities. In addition, a portion of the company’s marketable equity securitiesmay from time to time be classified as trading assets, if the company no longer deems the investments to be strategic in nature at thetime of trading asset designation, and has the ability and intent to mitigate equity market risk through sale or the use of derivativeinstruments. For these marketable equity securities, gains or losses from changes in fair value, primarily offset by losses or gains onrelated derivative instruments, are included in gains (losses) on equity securities, net.
Available-for-Sale Investments. Investments designated as available-for-sale include marketable debt and equity securities.Investments that are designated as available-for-sale are reported at fair value, with unrealized gains and losses, net of tax, recorded instockholders’ equity. The cost of securities sold is based on the specific identification method. Realized gains and losses on the sale ofdebt securities are recorded in interest and other, net. Realized gains or losses on the sale or exchange of equity securities and declinesin value judged to be other than temporary are recorded in gains (losses) on equity securities, net. Marketable equity securities arepresumed to be impaired if the fair value is less than the cost basis continuously for at least six months, absent evidence to the contrary.
Debt securities with original maturities greater than three months and remaining maturities less than one year are classified asshort-term investments. Debt securities with remaining maturities greater than one year are classified as long-term investments.
50

INTEL CORPORATIONNOTES TO CONSOLIDATED FINANCIAL STATEMENTS (Continued)
The company acquires certain equity investments for the promotion of business and strategic objectives, and to the extent thatthese investments continue to have strategic value, the company typically does not attempt to reduce or eliminate the inherent equitymarket risks through hedging activities. The marketable portion of these investments is included in marketable strategic equitysecurities.
Non-Marketable Equity Securities and Other Investments. Non-marketable equity securities and other investments are accountedfor at historical cost or, if Intel has significant influence over the investee, using the equity method of accounting. Intel’s proportionateshare of income or losses from investments accounted for under the equity method, and any gain or loss on disposal, are recorded ininterest and other, net. Non-marketable equity securities, equity-method investments and certain other investments are included in otherassets. Cost-basis loan participation notes are classified as short-term investments or other long-term investments.
All of the company’s investments are subject to a periodic impairment review; however, for non-marketable equity securities, theimpairment analysis requires significant judgment to identify events or circumstances that would likely have a significant adverseeffect on the fair value of the investment. The indicators Intel uses to identify those events and circumstances include the investee’srevenue and earnings trends relative to predefined milestones and overall business prospects; the technological feasibility of theinvestee’s products and technologies; the general market conditions in the investee’s industry or geographic area, including adverseregulatory or economic changes; factors about the investee’s ability to remain in business, such as the investee’s liquidity, debt ratiosand the rate at which the investee is using cash; and the investee’s receipt of additional funding at a lower valuation. Investmentsidentified as having an indicator of impairment are subject to further analysis to determine if the investment is other than temporarilyimpaired, in which case the investment is written down to its estimated fair value. When an investee is not considered viable from afinancial or technological point of view, the entire investment is written down, since the estimated fair market value is considered to benominal. If an investee obtains additional funding at a valuation lower than Intel’s carrying amount or requires a new round of equityfunding to stay in operation, and the new funding does not appear imminent, it is presumed that the investment is other thantemporarily impaired, unless specific facts and circumstances indicate otherwise. Impairment of non-marketable equity securities isrecorded in gains (losses) on equity securities, net.
Securities Lending
From time to time, the company enters into securities lending agreements with financial institutions, generally to facilitatehedging transactions. Selected securities may be loaned, secured by collateral in the form of cash or securities. The loaned securitiescontinue to be carried as investment assets on the balance sheet. Cash collateral is recorded as an asset with a corresponding liability.For lending agreements collateralized by securities, the collateral is not recorded as an asset or a liability, unless the collateral isrepledged.
Fair Values of Financial Instruments
The carrying value of cash equivalents approximates fair value due to the short period of time to maturity. Fair values ofshort-term investments, trading assets, long-term investments, marketable strategic equity securities, certain non-marketableinvestments, short-term debt, long-term debt, swaps, currency forward contracts, currency options, equity options and warrants arebased on quoted market prices or pricing models using current market data. Debt securities are generally valued using discounted cashflows in a yield-curve model based on LIBOR. Equity options and warrants are priced using a Black-Scholes option pricing model. Forthe company’s portfolio of non-marketable equity securities, management believes that the carrying value of the portfolio approximatesthe fair value at December 25, 2004 and December 27, 2003. This estimate takes into account the market movements of the equity andventure capital markets over the last few years, the impairment analyses performed and the related impairments recorded during 2004and 2003. All of the company’s financial instruments are recorded at fair value except for non-marketable investments, including cost-basis loan participation notes and debt. Management believes that the differences between the estimated fair values and carrying valuesof these financial instruments were not significant at December 25, 2004 and December 27, 2003. Estimated fair values aremanagement’s estimates; however, when there is no readily available market, the estimated fair values may not necessarily representthe amounts that could be realized in a current transaction, and these fair values could change significantly.
51

INTEL CORPORATIONNOTES TO CONSOLIDATED FINANCIAL STATEMENTS (Continued)
Derivative Financial Instruments
The company’s primary objective for holding derivative financial instruments is to manage currency, interest rate and someequity market risks. The company’s derivative instruments are recorded at fair value and are included in other current assets, otherassets, other accrued liabilities or debt. Derivative instruments recorded as assets totaled $117 million at December 25, 2004 and $134million at December 27, 2003. Derivative instruments recorded as liabilities totaled $179 million at December 25, 2004 and $178million at December 27, 2003. The company’s accounting policies for these instruments are based on whether they meet the company’scriteria for designation as hedging transactions, either as cash flow or fair value hedges. A hedge of the exposure to variability in thecash flows of an asset or a liability, or of a forecasted transaction, is referred to as a cash flow hedge. A hedge of the exposure tochanges in fair value of an asset or a liability, or of an unrecognized firm commitment, is referred to as a fair value hedge. The criteriafor designating a derivative as a hedge include the instrument’s effectiveness in risk reduction and, in most cases, a one-to-onematching of the derivative instrument to its underlying transaction. Gains and losses from changes in fair values of derivatives that arenot designated as hedges for accounting purposes are recognized currently in earnings, and generally offset changes in the values ofrelated assets, liabilities or debt.
As part of its strategic investment program, the company also acquires equity derivative instruments, such as warrants and equityconversion rights associated with debt instruments, that are not designated as hedging instruments. The gains or losses from changes infair values of these equity derivatives are recognized in gains (losses) on equity securities, net.
Currency Risk. The company transacts business in various currencies other than the U.S. dollar, primarily the Euro and certainother European and Asian currencies. The company has established balance sheet and forecasted transaction risk managementprograms to protect against fluctuations in fair value and volatility of future cash flows caused by changes in exchange rates. Theforecasted transaction risk management program includes anticipated transactions such as operating costs and capital purchases. Thecompany may use currency forward contracts, currency options, currency interest rate swaps, and currency investments and borrowingsin these risk management programs. These programs reduce, but do not always entirely eliminate, the impact of currency exchangemovements.
Currency forward contracts and currency options that are used to hedge exposures to variability in anticipated non-U.S.-dollar-denominated cash flows are designated as cash flow hedges. The maturities of these instruments are generally less than 12 months. Forthese derivatives, the gain or loss from the effective portion of the hedge is reported as a component of other comprehensive income instockholders’ equity and is reclassified into earnings in the same period or periods in which the hedged transaction affects earnings,and within the same income statement line item as the impact of the hedged transaction. The gain or loss from the ineffective portion ofthe hedge in excess of the cumulative change in the present value of future cash flows of the hedged item, if any, is recognized ininterest and other, net during the period of change.
Currency interest rate swaps and currency forward contracts are used to offset the currency risk of non-U.S.-dollar-denominateddebt securities classified as trading assets, as well as other assets and liabilities denominated in various currencies. The maturities ofthese instruments are generally less than 12 months, except for derivatives hedging equity investments, which are generally five yearsor less. Changes in fair value of the underlying assets and liabilities are generally offset by the changes in fair value of the relatedderivatives, with the resulting net gain or loss, if any, recorded in interest and other, net.
Interest Rate Risk. The company’s primary objective for holding investments in debt securities is to preserve principal whilemaximizing yields, without significantly increasing risk. To achieve this objective, the returns on the company’s investments infixed-rate debt securities are generally swapped to U.S. dollar LIBOR-based returns, using interest rate swaps and currency interest rateswaps in transactions that are not designated as hedges for accounting purposes. The floating interest rates on the swaps are reset on amonthly, quarterly or semiannual basis. Changes in fair value of the debt securities classified as trading assets are generally offset bychanges in fair value of the related derivatives, resulting in negligible net impact recorded in interest and other, net.
The company may also enter into interest rate swap agreements to modify the interest characteristics of a portion of itsoutstanding long-term debt. These transactions would likely be designated as fair value hedges. The gains or losses from the changes infair value of the interest rate swaps, as well as the offsetting change in the hedged fair value of the long-term debt, would be recognizedin interest expense.
52

INTEL CORPORATIONNOTES TO CONSOLIDATED FINANCIAL STATEMENTS (Continued)
Equity Market Risk. The company may enter into transactions designated as fair value hedges using equity options, swaps orforward contracts to hedge the equity market risk of marketable securities in its portfolio of strategic equity investments once thesecurities are no longer considered to have strategic value. The gain or loss from the change in fair value of these equity derivatives, aswell as the offsetting change in hedged fair value of the underlying equity securities, are recognized currently in gains (losses) onequity securities, net. The company may use equity derivatives in transactions not designated as hedges to offset the change in fairvalue of certain equity securities classified as trading assets. The company may or may not enter into transactions to reduce oreliminate the market risks of its investments in strategic equity derivatives, including warrants.
Measurement of Effectiveness of Hedge Relationships. For currency forward contracts, effectiveness of the hedge is measuredusing spot rates for hedging strategies related to long-term capital purchases, and using forward rates for all other strategies, to valuethe forward contract and the underlying hedged transaction. For currency options and equity options accounted for as fair value hedges,effectiveness is measured by comparing the change in the option’s intrinsic value (the difference between the spot price of theunderlying hedged transaction and the option’s strike price) to the value of the underlying hedged transaction determined based on spotrates. Changes in time value of these options are not included in the assessment of effectiveness. For currency options and equityoptions accounted for as cash flow hedges, effectiveness is measured by comparing the change in the fair market value of the option tothe change in the fair value of the underlying hedged transaction. For interest rate swaps, effectiveness is measured by offsetting thechange in fair value of the underlying hedged transaction with the change in fair value of the interest rate swap.
Any ineffective portion of the hedges, as well as amounts not included in the assessment of effectiveness, are recognized currentlyin interest and other, net or in gains (losses) on equity securities, net, depending on the nature of the underlying asset or liability. If acash flow hedge were to be discontinued because it is probable that the original hedged transaction will not occur as anticipated, theunrealized gain or loss on the related derivative would be reclassified into earnings. Subsequent gains or losses on the related derivativeinstrument would be recognized in income in each period until the instrument matures, is terminated or is sold.
For all periods presented, the portion of hedging instruments’ gains or losses excluded from the assessment of effectiveness andthe ineffective portions of hedges had an insignificant impact on earnings for both cash flow and fair value hedges. There was nosignificant impact on results of operations from discontinued cash flow hedges as a result of forecasted transactions that did not occur.For all periods presented, less than $15 million of deferred gains or losses were reclassified from accumulated other comprehensiveincome to depreciation expense related to the company’s foreign currency capital purchase hedging program. The company estimatesthat less than $15 million of net derivative gains included in other comprehensive income or capitalized in property, plant andequipment will be reclassified into earnings within the next 12 months.
Inventories
Inventory cost is computed on a currently adjusted standard basis (which approximates actual cost on an average or first-in, first-out basis). Inventory is determined to be saleable based on a demand forecast within a specific time horizon, generally six months orless. Inventory in excess of saleable amounts is not valued, and the remaining inventory is valued at the lower of cost or market.Inventories at fiscal year-ends were as follows:
(In Millions) 2004 2003
Raw materials . . . . . . . . . . . . . . . . . . . . . . . . . . . . . . . . . . . . . . . . . . . . . . . . . . . . . . . . . . . . . . . . . $ 388 $ 333Work in process . . . . . . . . . . . . . . . . . . . . . . . . . . . . . . . . . . . . . . . . . . . . . . . . . . . . . . . . . . . . . . . . 1,418 1,490Finished goods . . . . . . . . . . . . . . . . . . . . . . . . . . . . . . . . . . . . . . . . . . . . . . . . . . . . . . . . . . . . . . . . . 815 696
Total inventories . . . . . . . . . . . . . . . . . . . . . . . . . . . . . . . . . . . . . . . . . . . . . . . . . . . . . . . . . . . . . . . $ 2,621 $ 2,519
Property, Plant and Equipment
Property, plant and equipment, net at fiscal year-ends was as follows:(In Millions) 2004 2003
Land and buildings . . . . . . . . . . . . . . . . . . . . . . . . . . . . . . . . . . . . . . . . . . . . . . . . . . . . . . . . . . . . . . $ 13,277 $ 12,651Machinery and equipment . . . . . . . . . . . . . . . . . . . . . . . . . . . . . . . . . . . . . . . . . . . . . . . . . . . . . . . . 24,561 24,233Construction in progress . . . . . . . . . . . . . . . . . . . . . . . . . . . . . . . . . . . . . . . . . . . . . . . . . . . . . . . . . . 1,995 1,808
39,833 38,692Less accumulated depreciation . . . . . . . . . . . . . . . . . . . . . . . . . . . . . . . . . . . . . . . . . . . . . . . . . . . . . (24,065) (22,031)
Total property, plant and equipment, net . . . . . . . . . . . . . . . . . . . . . . . . . . . . . . . . . . . . . . . . . . . $ 15,768 $ 16,661
53

INTEL CORPORATIONNOTES TO CONSOLIDATED FINANCIAL STATEMENTS (Continued)
Property, plant and equipment is stated at cost. Depreciation is computed for financial reporting purposes principally using thestraight-line method over the following estimated useful lives: machinery and equipment, 2–4 years; buildings, 4–40 years. Reviewsare regularly performed to determine whether facts and circumstances exist which indicate that the carrying amount of assets may notbe recoverable or that the useful life is shorter than originally estimated. The company assesses the recoverability of its assets held foruse by comparing the projected undiscounted net cash flows associated with the related asset or group of assets over their remaininglives against their respective carrying amounts. Impairment, if any, is based on the excess of the carrying amount over the fair value ofthose assets (see “Note 16: Impairment of Long-Lived Assets”). If assets are determined to be recoverable, but the useful lives areshorter than originally estimated, the net book value of the assets is depreciated over the newly determined remaining useful lives.
Goodwill
Goodwill is recorded when the purchase price paid for an acquisition exceeds the estimated fair value of the net identifiedtangible and intangible assets acquired. The company performs an annual review in the fourth quarter of each year, or more frequentlyif indicators of potential impairment exist, to determine if the carrying value of the recorded goodwill is impaired. The impairmentreview process compares the fair value of the reporting unit in which goodwill resides to its carrying value. Reporting units may beoperating segments as a whole or an operation one level below an operating segment, referred to as a component. In determining thecarrying value of the reporting unit, an allocation of the company’s manufacturing and assembly and test assets must be made becauseof the interchangeable nature of the company’s manufacturing and assembly and test capacity. This allocation is based on eachreporting unit’s relative percentage utilization of the manufacturing and assembly and test assets (see “Note 14: Goodwill”).
Identified Intangible Assets
Acquisition-related intangibles include developed technology, trademarks and customer lists, and are amortized on a straight-linebasis over periods ranging from 2–6 years. Also included in acquisition-related intangibles is workforce-in-place related to acquisitionsthat did not qualify as business combinations. Intellectual property assets primarily represent rights acquired under technology licensesand are amortized over the periods of benefit, ranging from 2–10 years, generally on a straight-line basis. All identified intangibleassets are classified within other assets on the balance sheet. In the quarter following the period in which identified intangible assetsbecome fully amortized, the fully amortized balances are removed from the gross asset and accumulated amortization amounts.
The company performs a quarterly review of its identified intangible assets to determine if facts and circumstances exist whichindicate that the useful life is shorter than originally estimated or that the carrying amount of assets may not be recoverable. If suchfacts and circumstances do exist, the company assesses the recoverability of identified intangible assets by comparing the projectedundiscounted net cash flows associated with the related asset or group of assets over their remaining lives against their respectivecarrying amounts. Impairment, if any, is based on the excess of the carrying amount over the fair value of those assets.
Product Warranty
The company generally sells products with a limited warranty of product quality and a limited indemnification of customersagainst intellectual property infringement claims related to the company’s products. The company accrues for known warranty andindemnification issues if a loss is probable and can be reasonably estimated, and accrues for estimated incurred but unidentified issuesbased on historical activity. The accrual and the related expense for known issues were not significant during the periods presented.Due to product testing and the short time between product shipment and the detection and correction of product failures, andconsidering the historical rate of payments on indemnification claims, the accrual and related expense for estimated incurred butunidentified issues were not significant during the periods presented.
Revenue Recognition
The company recognizes net revenue when the earnings process is complete, as evidenced by an agreement with the customer,transfer of title and acceptance, if applicable, as well as fixed pricing and probable collectibility. Because of frequent sales pricereductions and rapid technology obsolescence in the industry, sales made to distributors under agreements allowing price protectionand/or right of return are deferred until the distributors sell the merchandise. Shipping charges billed to customers are included in netrevenue, and the related shipping costs are included in cost of sales.
54

INTEL CORPORATIONNOTES TO CONSOLIDATED FINANCIAL STATEMENTS (Continued)
Advertising
Cooperative advertising obligations are accrued and the costs expensed at the same time the related revenue is recognized. Allother advertising costs are expensed as incurred. Cooperative advertising expenses are recorded as marketing, general andadministrative expense to the extent that an advertising benefit separate from the revenue transaction can be identified and the cashpaid does not exceed the fair value of that advertising benefit received. Any excess of cash paid over the fair value of the advertisingbenefit received is recorded as a reduction in revenue. Advertising expense was $2.1 billion in 2004 ($1.8 billion in 2003 and $1.7billion in 2002).
Employee Equity Incentive Plans
The company has employee equity incentive plans, which are described more fully in “Note 11: Employee Equity IncentivePlans.” Intel accounts for its equity incentive plans under the intrinsic value recognition and measurement principles of APB OpinionNo. 25, “Accounting for Stock Issued to Employees,” and related interpretations. The exercise price of options is equal to the marketprice of Intel common stock (defined as the average of the high and low trading prices reported by The NASDAQ Stock Market*) onthe date of grant. Accordingly, no stock-based compensation, other than acquisition-related compensation, is recognized in net income.The following table illustrates the effect on net income and earnings per share as if the company had applied the fair value recognitionprovisions of Statement of Financial Accounting Standards (SFAS) No. 123, “Accounting for Stock-Based Compensation,” asamended, to options granted under the stock option plans and rights to acquire stock granted under the company’s Stock ParticipationPlan, collectively called “options.” For purposes of this pro-forma disclosure, the value of the options is estimated using aBlack-Scholes option pricing model and amortized ratably to expense over the options’ vesting periods. Because the estimated value isdetermined as of the date of grant, the actual value ultimately realized by the employee may be significantly different.
(In Millions—Except Per Share Amounts) 2004 2003 2002
Net income, as reported . . . . . . . . . . . . . . . . . . . . . . . . . . . . . . . . . . . . . . . . . . . . . . . . . . . . . $7,516 $5,641 $3,117Less: total stock-based employee compensation expense determined under the fair value
method for all awards, net of tax . . . . . . . . . . . . . . . . . . . . . . . . . . . . . . . . . . . . . . . . . . . . 1,271 991 1,170
Pro-forma net income . . . . . . . . . . . . . . . . . . . . . . . . . . . . . . . . . . . . . . . . . . . . . . . . . . . . . . $6,245 $4,650 $1,947
Reported basic earnings per common share . . . . . . . . . . . . . . . . . . . . . . . . . . . . . . . . . . . . . . $ 1.17 $ 0.86 $ 0.47
Pro-forma basic earnings per common share . . . . . . . . . . . . . . . . . . . . . . . . . . . . . . . . . . . . . $ 0.98 $ 0.71 $ 0.29
Reported diluted earnings per common share . . . . . . . . . . . . . . . . . . . . . . . . . . . . . . . . . . . . . $ 1.16 $ 0.85 $ 0.46
Pro-forma diluted earnings per common share . . . . . . . . . . . . . . . . . . . . . . . . . . . . . . . . . . . . $ 0.97 $ 0.71 $ 0.29
It is the company’s policy under SFAS No. 123 to periodically make adjustments to pro-forma compensation expense to reflectforfeitures. Based on recent forfeiture data, the company recognized additional pro-forma compensation expense and related tax effectstotaling $58 million in 2004. The company reversed previously recognized pro-forma compensation expense and related tax effectstotaling $190 million in 2003 and $87 million in 2002.
SFAS No. 123 requires the use of option pricing models that were not developed for use in valuing employee stock options. TheBlack-Scholes option pricing model was developed for use in estimating the fair value of short-lived exchange-traded options that haveno vesting restrictions and are fully transferable. The company’s employee stock options have characteristics significantly differentfrom those of traded options. In addition, option pricing models require the input of highly subjective assumptions, including theoption’s expected life and the price volatility of the underlying stock, and changes in the subjective input assumptions can materiallyaffect the fair value estimate of employee stock options.
55

INTEL CORPORATIONNOTES TO CONSOLIDATED FINANCIAL STATEMENTS (Continued)
The weighted average estimated value of employee stock options granted during 2004 was $10.79 ($9.02 in 2003 and $10.89 in2002). The value of options granted in 2004, 2003 and 2002 was estimated at the date of grant using the following weighted averageassumptions:
2004 2003 2002
Expected life (in years) . . . . . . . . . . . . . . . . . . . . . . . . . . . . . . . . . . . . . . . . . . . . . . . . . . . . . . . . 4.2 4.4 6.0Risk-free interest rate . . . . . . . . . . . . . . . . . . . . . . . . . . . . . . . . . . . . . . . . . . . . . . . . . . . . . . . . . . 3.0% 2.2% 3.7%Volatility . . . . . . . . . . . . . . . . . . . . . . . . . . . . . . . . . . . . . . . . . . . . . . . . . . . . . . . . . . . . . . . . . . . .50 .54 .49Dividend yield . . . . . . . . . . . . . . . . . . . . . . . . . . . . . . . . . . . . . . . . . . . . . . . . . . . . . . . . . . . . . . . .6% .4% .3%
An analysis of historical information is used to determine the company’s assumptions, to the extent that historical information isrelevant based on the terms of the grants being issued in any given period. Options granted in 2004 and 2003 generally vest over fouryears, while options granted during 2002 generally vest five years from the date of grant.
Under the Stock Participation Plan, rights to purchase shares are granted during the first and third quarter of each year only. Theestimated weighted average value of rights granted under the Stock Participation Plan during 2004 was $6.38 ($5.65 during 2003 and$7.23 in 2002). The value of rights granted during 2004, 2003 and 2002 was estimated at the date of grant using the followingweighted average assumptions:
2004 2003 2002
Expected life (in years) . . . . . . . . . . . . . . . . . . . . . . . . . . . . . . . . . . . . . . . . . . . . . . . . . . . . . . . . .5 .5 .5Risk-free interest rate . . . . . . . . . . . . . . . . . . . . . . . . . . . . . . . . . . . . . . . . . . . . . . . . . . . . . . . . . . 1.4% 1.1% 1.8%Volatility . . . . . . . . . . . . . . . . . . . . . . . . . . . . . . . . . . . . . . . . . . . . . . . . . . . . . . . . . . . . . . . . . . . .30 .50 .50Dividend yield . . . . . . . . . . . . . . . . . . . . . . . . . . . . . . . . . . . . . . . . . . . . . . . . . . . . . . . . . . . . . . . .6% .4% .3%
Recent Accounting Pronouncements
In March 2004, the FASB approved the consensus reached on the Emerging Issues Task Force (EITF) Issue No. 03-1, “TheMeaning of Other-Than-Temporary Impairment and Its Application to Certain Investments.” The Issue’s objective is to provideguidance for identifying other-than-temporarily impaired investments. EITF 03-1 also provides new disclosure requirements forinvestments that are deemed to be temporarily impaired. In September 2004, the FASB issued a FASB Staff Position (FSP)EITF 03-1-1 that delays the effective date of the measurement and recognition guidance in EITF 03-1 until further notice. Thedisclosure requirements of EITF 03-1 are effective with this annual report for fiscal 2004. Once the FASB reaches a final decision onthe measurement and recognition provisions, the company will evaluate the impact of the adoption of the accounting provisions ofEITF 03-1.
In December 2004, the FASB issued SFAS No. 123R, “Share-Based Payment.” SFAS No. 123R requires employee stock optionsand rights to purchase shares under stock participation plans to be accounted for under the fair value method, and eliminates the abilityto account for these instruments under the intrinsic value method prescribed by APB Opinion No. 25, and allowed under the originalprovisions of SFAS No. 123. SFAS No. 123R requires the use of an option pricing model for estimating fair value, which is amortizedto expense over the service periods. The requirements of SFAS No. 123R are effective for fiscal periods beginning after June 15, 2005.If the company had applied the provisions of SFAS No. 123R to the financial statements for the period ending December 25, 2004, netincome would have been reduced by approximately $1.3 billion. SFAS No. 123R allows for either prospective recognition ofcompensation expense or retrospective recognition, which may be back to the original issuance of SFAS No. 123 or only to interimperiods in the year of adoption. The company is currently evaluating these transition methods.
Note 3: Earnings Per Share
The shares used in the computation of the company’s basic and diluted earnings per common share were as follows:
(In Millions) 2004 2003 2002
Weighted average common shares outstanding . . . . . . . . . . . . . . . . . . . . . . . . . . . . . . . . . . . . 6,400 6,527 6,651Dilutive effect of employee stock options . . . . . . . . . . . . . . . . . . . . . . . . . . . . . . . . . . . . . . . . . . 94 94 108
Weighted average common shares outstanding, assuming dilution . . . . . . . . . . . . . . . . . . . . 6,494 6,621 6,759
56

INTEL CORPORATIONNOTES TO CONSOLIDATED FINANCIAL STATEMENTS (Continued)
Weighted average common shares outstanding, assuming dilution, include the incremental shares that would be issued upon theassumed exercise of stock options. For 2004, approximately 357 million of the company’s stock options were excluded from thecalculation of diluted earnings per share because the exercise prices of the stock options were greater than or equal to the average priceof the common shares, and therefore their inclusion would have been anti-dilutive (418 million in 2003 and 387 million in 2002).These options could be dilutive in the future if the average share price increases and is greater than the exercise price of these options.
Note 4: Common Stock Repurchase Program
The company has an ongoing authorization, as amended, from the Board of Directors to repurchase up to 2.8 billion shares ofIntel’s common stock in open market or negotiated transactions, including the 2004 authorization to purchase an additional 500 millionshares. During 2004, the company repurchased 301 million shares of common stock at a cost of $7.5 billion (176 million shares at acost of $4.0 billion during 2003, and 183 million shares at a cost of $4.0 billion during 2002). Since the program began in 1990, thecompany has repurchased and retired approximately 2.2 billion shares at a cost of approximately $42 billion. As of December 25,2004, approximately 614 million shares remained available for repurchase under the existing repurchase authorization.
Note 5: Borrowings
Short-Term Debt
Short-term debt included non-interest-bearing drafts payable of $168 million and the current portion of long-term debt of $33million as of December 25, 2004 (drafts payable of $143 million and the current portion of long-term debt of $81 million as ofDecember 27, 2003). The company also borrows under a commercial paper program. Maximum borrowings under the company’scommercial paper program reached $550 million during 2004 and $30 million during 2003, and did not exceed authorized borrowingsof $3.0 billion. No commercial paper was outstanding as of December 25, 2004 or December 27, 2003. The company’s commercialpaper is rated A-1+ by Standard & Poor’s and P-1 by Moody’s.
Long-Term Debt
Long-term debt at fiscal year-ends was as follows:
(In Millions) 2004 2003
Payable in U.S. dollars:Zero coupon senior exchangeable notes due 2004 . . . . . . . . . . . . . . . . . . . . . . . . . . . . . . . . . . . . . . . $ — $ 41Other debt . . . . . . . . . . . . . . . . . . . . . . . . . . . . . . . . . . . . . . . . . . . . . . . . . . . . . . . . . . . . . . . . . . . . . . 1 1
Payable in other currencies:Euro debt due 2005–2018 at 1.5%–11% . . . . . . . . . . . . . . . . . . . . . . . . . . . . . . . . . . . . . . . . . . . . . . . 735 975
736 1,017Less current portion of long-term debt . . . . . . . . . . . . . . . . . . . . . . . . . . . . . . . . . . . . . . . . . . . . . . . . . . (33) (81)
Total long-term debt . . . . . . . . . . . . . . . . . . . . . . . . . . . . . . . . . . . . . . . . . . . . . . . . . . . . . . . . . . . . . . . $ 703 $ 936
During 2001, the company issued zero coupon senior exchangeable notes (Intel notes) in order to partially mitigate the equitymarket risk of Intel’s investment in Samsung Electronics Co., Ltd. convertible notes. The exchange option was accounted for as anequity derivative and marked-to-market with the fair value recorded in long-term debt. The Intel notes matured in February 2004.
The Euro borrowings were made in connection with the financing of manufacturing facilities and equipment in Ireland, and Intelhas invested the proceeds in Euro-denominated loan participation notes of similar maturity to hedge currency and interest rateexposures. During 2004, the company retired $273 million of the Euro borrowings prior to their maturity dates through thesimultaneous settlement of an equivalent amount of investments in loan participation notes (see “Note 8: Interest and Other, Net”).
As of December 25, 2004, aggregate debt maturities were as follows: 2005—$33 million; 2006—$39 million; 2007—$41million; 2008—$128 million; 2009—$43 million; and thereafter—$452 million.
57

INTEL CORPORATIONNOTES TO CONSOLIDATED FINANCIAL STATEMENTS (Continued)
Note 6: Investments
Trading Assets
Trading assets outstanding at fiscal year-ends were as follows:
2004 2003
(In Millions)
NetUnrealized
GainsEstimatedFair Value
NetUnrealized
GainsEstimatedFair Value
Debt instruments . . . . . . . . . . . . . . . . . . . . . . . . . . . . . . . . . . . . $ 187 $ 2,772 $ 174 $ 2,321Equity securities offsetting deferred compensation . . . . . . . . . . . 81 339 60 304
Total trading assets . . . . . . . . . . . . . . . . . . . . . . . . . . . . . . . . . $ 268 $ 3,111 $ 234 $ 2,625
Net holding gains on fixed income debt instruments classified as trading assets were $80 million in 2004, $208 million in 2003and $79 million in 2002. Net holding losses on the related derivatives were $(77) million in 2004, $(192) million in 2003 and $(75)million in 2002. These amounts were included in interest and other, net in the consolidated statements of income.
Certain equity securities within the trading asset portfolio are maintained to generate returns that seek to offset changes inliabilities related to the equity market risk of certain deferred compensation arrangements. These deferred compensation liabilities were$458 million in 2004 and $427 million in 2003, and are included in other accrued liabilities on the consolidated balance sheets. Netholding gains (losses) on equity securities offsetting deferred compensation arrangements were $29 million in 2004, $52 million in2003 and $(64) million in 2002, and were included within interest and other, net in the consolidated statements of income.
Prior to 2004, the company held certain other marketable equity securities which were included in trading assets. Net holdinggains on these equity security trading assets were $77 million in 2003 and $57 million in 2002. The $57 million net gain in 2002included a gain of $120 million that resulted from the designation of formerly restricted equity investments as trading assets as theybecame marketable. The cumulative difference between their cost and fair market value at the time they became marketable wasrecorded as a gain in 2002. Net holding gains (losses) on the related derivatives were $(84) million in 2003 and $110 million in 2002.These gains and losses were included within losses on equity securities, net in the consolidated statements of income.
58

INTEL CORPORATIONNOTES TO CONSOLIDATED FINANCIAL STATEMENTS (Continued)
Available-for-Sale Investments
Available-for-sale investments at December 25, 2004 were as follows:
(In Millions)Adjusted
Cost
GrossUnrealized
Gains
GrossUnrealized
LossesEstimatedFair Value
Commercial paper . . . . . . . . . . . . . . . . . . . . . . . . . . . . . . . . . . . . . $ 9,024 $ — $ (4) $ 9,020Floating rate notes . . . . . . . . . . . . . . . . . . . . . . . . . . . . . . . . . . . . . 3,419 — (1) 3,418Bank time deposits . . . . . . . . . . . . . . . . . . . . . . . . . . . . . . . . . . . . 1,936 — — 1,936Corporate bonds . . . . . . . . . . . . . . . . . . . . . . . . . . . . . . . . . . . . . . 794 — — 794Marketable strategic equity securities . . . . . . . . . . . . . . . . . . . . . . 589 118 (51) 656Preferred stock and other equity . . . . . . . . . . . . . . . . . . . . . . . . . . 200 — — 200Other debt securities . . . . . . . . . . . . . . . . . . . . . . . . . . . . . . . . . . . 234 — — 234
Total available-for-sale investments . . . . . . . . . . . . . . . . . . . . . . $ 16,196 $ 118 $ (56) $ 16,258
CarryingAmount
Available-for-sale investments . . . . . . . . . . . . . . . . . . . . . . . . . . . . . . . . . . . . . . . . . . . . . . . . . . . . . . . . . . . . . $ 16,258Cost basis investments in loan participation notes . . . . . . . . . . . . . . . . . . . . . . . . . . . . . . . . . . . . . . . . . . . . . . . 723Cash on hand . . . . . . . . . . . . . . . . . . . . . . . . . . . . . . . . . . . . . . . . . . . . . . . . . . . . . . . . . . . . . . . . . . . . . . . . . . . 299
Total . . . . . . . . . . . . . . . . . . . . . . . . . . . . . . . . . . . . . . . . . . . . . . . . . . . . . . . . . . . . . . . . . . . . . . . . . . . . . . . $ 17,280
Reported as:Cash and cash equivalents . . . . . . . . . . . . . . . . . . . . . . . . . . . . . . . . . . . . . . . . . . . . . . . . . . . . . . . . . . . . . . . $ 8,407Short-term investments . . . . . . . . . . . . . . . . . . . . . . . . . . . . . . . . . . . . . . . . . . . . . . . . . . . . . . . . . . . . . . . . . 5,654Marketable strategic equity investments . . . . . . . . . . . . . . . . . . . . . . . . . . . . . . . . . . . . . . . . . . . . . . . . . . . . 656Other long-term investments . . . . . . . . . . . . . . . . . . . . . . . . . . . . . . . . . . . . . . . . . . . . . . . . . . . . . . . . . . . . . 2,563
Total . . . . . . . . . . . . . . . . . . . . . . . . . . . . . . . . . . . . . . . . . . . . . . . . . . . . . . . . . . . . . . . . . . . . . . . . . . . . . . . $ 17,280
Available-for-sale investments at December 27, 2003 were as follows:
(In Millions)Adjusted
Cost
GrossUnrealized
Gains
GrossUnrealized
LossesEstimatedFair Value
Commercial paper . . . . . . . . . . . . . . . . . . . . . . . . . . . . . . . . . . . . . $ 9,948 $ — $ (1) $ 9,947Bank time deposits . . . . . . . . . . . . . . . . . . . . . . . . . . . . . . . . . . . . 1,900 — — 1,900Floating rate notes . . . . . . . . . . . . . . . . . . . . . . . . . . . . . . . . . . . . . 1,078 — — 1,078Corporate bonds . . . . . . . . . . . . . . . . . . . . . . . . . . . . . . . . . . . . . . 703 — — 703Marketable strategic equity securities . . . . . . . . . . . . . . . . . . . . . . 467 47 — 514Preferred stock and other equity . . . . . . . . . . . . . . . . . . . . . . . . . . 224 9 — 233Other debt securities . . . . . . . . . . . . . . . . . . . . . . . . . . . . . . . . . . . 352 — — 352
Total available-for-sale investments . . . . . . . . . . . . . . . . . . . . . . $ 14,672 $ 56 $ (1) $ 14,727
CarryingAmount
Available-for-sale investments . . . . . . . . . . . . . . . . . . . . . . . . . . . . . . . . . . . . . . . . . . . . . . . . . . . . . . . . . . . . . $ 14,727Cost basis investments in loan participation notes . . . . . . . . . . . . . . . . . . . . . . . . . . . . . . . . . . . . . . . . . . . . . . . 985Cash on hand . . . . . . . . . . . . . . . . . . . . . . . . . . . . . . . . . . . . . . . . . . . . . . . . . . . . . . . . . . . . . . . . . . . . . . . . . . . 207
Total . . . . . . . . . . . . . . . . . . . . . . . . . . . . . . . . . . . . . . . . . . . . . . . . . . . . . . . . . . . . . . . . . . . . . . . . . . . . . . . $ 15,919
Reported as:Cash and cash equivalents . . . . . . . . . . . . . . . . . . . . . . . . . . . . . . . . . . . . . . . . . . . . . . . . . . . . . . . . . . . . . . . $ 7,971Short-term investments . . . . . . . . . . . . . . . . . . . . . . . . . . . . . . . . . . . . . . . . . . . . . . . . . . . . . . . . . . . . . . . . . 5,568Marketable strategic equity investments . . . . . . . . . . . . . . . . . . . . . . . . . . . . . . . . . . . . . . . . . . . . . . . . . . . . 514Other long-term investments . . . . . . . . . . . . . . . . . . . . . . . . . . . . . . . . . . . . . . . . . . . . . . . . . . . . . . . . . . . . . 1,866
Total . . . . . . . . . . . . . . . . . . . . . . . . . . . . . . . . . . . . . . . . . . . . . . . . . . . . . . . . . . . . . . . . . . . . . . . . . . . . . . . $ 15,919
59

INTEL CORPORATIONNOTES TO CONSOLIDATED FINANCIAL STATEMENTS (Continued)
The duration of the unrealized losses on available-for-sale investments at December 25, 2004 did not exceed 12 months. Thecompany’s unrealized losses of $51 million on investments in marketable strategic equity securities at December 25, 2004 relatedprimarily to a $450 million investment in Micron Technology, Inc. The unrealized losses were due to market-price movements.Management does not believe that any of the unrealized losses represented an other-than-temporary impairment based on its evaluationof available evidence as of December 25, 2004.
The company sold available-for-sale securities, primarily equity securities, with a fair value at the date of sale of $85 million in2004, $39 million in 2003 and $114 million in 2002. The gross realized gains on these sales totaled $52 million in 2004, $16 million in2003 and $15 million in 2002. The company recognized impairment losses on available-for-sale and non-marketable investments of$117 million in 2004, $319 million in 2003 and $524 million in 2002.
The amortized cost and estimated fair value of available-for-sale and loan participation investments in debt securities at December25, 2004, by contractual maturity, were as follows:
(In Millions) CostEstimatedFair Value
Due in 1 year or less . . . . . . . . . . . . . . . . . . . . . . . . . . . . . . . . . . . . . . . . . . . . . . . . . . . . . . . . . . $ 13,667 $ 13,662Due in 1–2 years . . . . . . . . . . . . . . . . . . . . . . . . . . . . . . . . . . . . . . . . . . . . . . . . . . . . . . . . . . . . . 1,375 1,375Due in 2–5 years . . . . . . . . . . . . . . . . . . . . . . . . . . . . . . . . . . . . . . . . . . . . . . . . . . . . . . . . . . . . . 646 646Due after 5 years . . . . . . . . . . . . . . . . . . . . . . . . . . . . . . . . . . . . . . . . . . . . . . . . . . . . . . . . . . . . . 442 442
Total . . . . . . . . . . . . . . . . . . . . . . . . . . . . . . . . . . . . . . . . . . . . . . . . . . . . . . . . . . . . . . . . . . . . . $ 16,130 $ 16,125
Note 7: Concentrations of Credit Risk
Financial instruments that potentially subject the company to concentrations of credit risk consist principally of investments indebt securities, derivative financial instruments and trade receivables.
Intel generally places its investments with high-credit-quality counterparties and, by policy, limits the amount of credit exposureto any one counterparty based on Intel’s analysis of that counterparty’s relative credit standing. Investments in debt securities withoriginal maturities of greater than six months consist primarily of A and A2 or better rated financial instruments and counterparties.Investments with original maturities of up to six months consist primarily of A-1 and P-1 or better rated financial instruments andcounterparties. Government regulations imposed on investment alternatives of Intel’s non-U.S. subsidiaries, or the absence of A andA2 rated counterparties in certain countries, result in some minor exceptions, which are reviewed and approved annually by theFinance Committee of the Board of Directors. Credit rating criteria for derivative instruments are similar to those for investments. Theamounts subject to credit risk related to derivative instruments are generally limited to the amounts, if any, by which a counterparty’sobligations exceed the obligations of Intel with that counterparty. At December 25, 2004, the total credit exposure to any singlecounterparty did not exceed $350 million. Intel’s practice is to obtain and secure available collateral from counterparties againstobligations, including securities lending transactions, whenever Intel deems appropriate.
A majority of the company’s trade receivables are derived from sales to original equipment manufacturers and original designmanufacturers of computer systems, cellular handsets and handheld computing devices, and networking and communicationsequipment. The company also has accounts receivable derived from sales to industrial and retail distributors. The company’s threelargest customers accounted for approximately 42% of net revenue for 2004 and 2003 (38% of net revenue for 2002). At December 25,2004, the three largest customers accounted for approximately 45% of net accounts receivable (43% of net accounts receivable atDecember 27, 2003). Management believes that the receivable balances from these largest customers do not represent a significantcredit risk based on cash flow forecast, balance sheet analysis and past collection experience.
The company has adopted credit policies and standards intended to accommodate industry growth and inherent risk. Managementbelieves that credit risks are moderated by the financial stability of the company’s end customers and the diverse geographic salesareas. To assess the credit risk of counterparties, a quantitative and qualitative analysis is performed. From this analysis, credit limitsare established and a determination is made whether one or more credit support devices, such as obtaining some form of third-partyguarantee or standby letter of credit, or obtaining credit insurance for all or a portion of the account balance, is necessary.
60

INTEL CORPORATIONNOTES TO CONSOLIDATED FINANCIAL STATEMENTS (Continued)
Note 8: Interest and Other, Net
The components of interest and other, net were as follows:
(In Millions) 2004 2003 2002
Interest income . . . . . . . . . . . . . . . . . . . . . . . . . . . . . . . . . . . . . . . . . . . . . . . . . . . . . . . . . . . $ 301 $ 248 $ 298Interest expense . . . . . . . . . . . . . . . . . . . . . . . . . . . . . . . . . . . . . . . . . . . . . . . . . . . . . . . . . . . (50) (62) (84)Other, net . . . . . . . . . . . . . . . . . . . . . . . . . . . . . . . . . . . . . . . . . . . . . . . . . . . . . . . . . . . . . . . . 38 6 (20)
Total . . . . . . . . . . . . . . . . . . . . . . . . . . . . . . . . . . . . . . . . . . . . . . . . . . . . . . . . . . . . . . . . . . . $ 289 $ 192 $ 194
During 2004, the company recognized approximately $60 million of gains in other, net associated with terminating financingarrangements for manufacturing facilities and equipment in Ireland (see “Note 5: Borrowings”).
Note 9: Comprehensive Income
The components of other comprehensive income and related tax effects were as follows:
(In Millions) 2004 2003 2002
Net income . . . . . . . . . . . . . . . . . . . . . . . . . . . . . . . . . . . . . . . . . . . . . . . . . . . . . . . . . . . . . . $7,516 $5,641 $3,117Change in net unrealized holding gain on investments, net of tax of $(17), $(18) and $24 in
2004, 2003 and 2002, respectively . . . . . . . . . . . . . . . . . . . . . . . . . . . . . . . . . . . . . . . . . . . 31 33 (44)Less: adjustment for net realized gain or loss on investments included in net income, net of
tax of $15, $5 and $(14) in 2004, 2003 and 2002, respectively . . . . . . . . . . . . . . . . . . . . . (29) (11) 25Change in net unrealized holding gain on derivatives, net of tax of $(34), $(15) and $(23) in
2004, 2003 and 2002, respectively . . . . . . . . . . . . . . . . . . . . . . . . . . . . . . . . . . . . . . . . . . . 63 27 43Less: adjustment for amortization of net gain on derivatives included in net income, net of
tax of $4 in 2004 . . . . . . . . . . . . . . . . . . . . . . . . . . . . . . . . . . . . . . . . . . . . . . . . . . . . . . . . (8) (1) —Minimum pension liability, net of tax of $(2) and $2 in 2003 and 2002, respectively . . . . . . (1) 5 (6)
Total . . . . . . . . . . . . . . . . . . . . . . . . . . . . . . . . . . . . . . . . . . . . . . . . . . . . . . . . . . . . . . . . . . . $7,572 $5,694 $3,135
The components of accumulated other comprehensive income, net of tax, were as follows:
(In Millions) 2004 2003
Accumulated net unrealized holding gain on available-for-sale investments . . . . . . . . . . . . . . . . . . . . . . $ 37 $ 35Accumulated net unrealized holding gain on derivatives . . . . . . . . . . . . . . . . . . . . . . . . . . . . . . . . . . . . 117 62Accumulated minimum pension liability . . . . . . . . . . . . . . . . . . . . . . . . . . . . . . . . . . . . . . . . . . . . . . . . (2) (1)
Total accumulated other comprehensive income . . . . . . . . . . . . . . . . . . . . . . . . . . . . . . . . . . . . . . . . $ 152 $ 96
61

INTEL CORPORATIONNOTES TO CONSOLIDATED FINANCIAL STATEMENTS (Continued)
Note 10: Provision for Taxes
Income before taxes and the provision for taxes consisted of the following:
(Dollars in Millions) 2004 2003 2002
Income before taxes:U.S. . . . . . . . . . . . . . . . . . . . . . . . . . . . . . . . . . . . . . . . . . . . . . . . . . . . . . . . . . . . . . . . $ 7,422 $ 5,705 $ 2,165Non-U.S. . . . . . . . . . . . . . . . . . . . . . . . . . . . . . . . . . . . . . . . . . . . . . . . . . . . . . . . . . . . 2,995 1,737 2,039
Total income before taxes . . . . . . . . . . . . . . . . . . . . . . . . . . . . . . . . . . . . . . . . . . . . . . . $10,417 $ 7,442 $ 4,204
Provision for taxes:Current:
Federal . . . . . . . . . . . . . . . . . . . . . . . . . . . . . . . . . . . . . . . . . . . . . . . . . . . . . . . . . . . . . $ 2,787 $ 808 $ 542State . . . . . . . . . . . . . . . . . . . . . . . . . . . . . . . . . . . . . . . . . . . . . . . . . . . . . . . . . . . . . . . (69) 223 143Non-U.S. . . . . . . . . . . . . . . . . . . . . . . . . . . . . . . . . . . . . . . . . . . . . . . . . . . . . . . . . . . . 390 379 292
3,108 1,410 977
Deferred:Federal . . . . . . . . . . . . . . . . . . . . . . . . . . . . . . . . . . . . . . . . . . . . . . . . . . . . . . . . . . . . . (128) 420 91Other . . . . . . . . . . . . . . . . . . . . . . . . . . . . . . . . . . . . . . . . . . . . . . . . . . . . . . . . . . . . . . (79) (29) 19
(207) 391 110
Total provision for taxes . . . . . . . . . . . . . . . . . . . . . . . . . . . . . . . . . . . . . . . . . . . . . . . . $ 2,901 $ 1,801 $ 1,087
Effective tax rate . . . . . . . . . . . . . . . . . . . . . . . . . . . . . . . . . . . . . . . . . . . . . . . . . . . . . . 27.8% 24.2% 25.9%
The tax benefit from employee stock plans was $344 million for 2004 ($216 million for 2003 and $270 million for 2002).
The difference between the tax provision at the statutory federal income tax rate and the tax provision attributable to incomebefore income taxes was as follows:
(In Percentages) 2004 2003 2002
Statutory federal income tax rate . . . . . . . . . . . . . . . . . . . . . . . . . . . . . . . . . . . . . . . . . . . 35.0% 35.0% 35.0%Increase (reduction) in rate resulting from:
State taxes, net of federal benefits . . . . . . . . . . . . . . . . . . . . . . . . . . . . . . . . . . . . . . . . (0.4) 1.9 2.2Non-U.S. income taxed at different rates . . . . . . . . . . . . . . . . . . . . . . . . . . . . . . . . . . . (2.5) (2.8) (5.9)Non-deductible acquisition-related costs and goodwill impairments . . . . . . . . . . . . . . 0.1 3.1 1.3Tax benefit related to divestitures . . . . . . . . . . . . . . . . . . . . . . . . . . . . . . . . . . . . . . . . — (10.2) (1.8)Export sales benefit . . . . . . . . . . . . . . . . . . . . . . . . . . . . . . . . . . . . . . . . . . . . . . . . . . . (4.8) (2.5) (3.0)Other . . . . . . . . . . . . . . . . . . . . . . . . . . . . . . . . . . . . . . . . . . . . . . . . . . . . . . . . . . . . . . 0.4 (0.3) (1.9)
Income tax rate . . . . . . . . . . . . . . . . . . . . . . . . . . . . . . . . . . . . . . . . . . . . . . . . . . . . . . . . 27.8% 24.2% 25.9%
During 2004, in connection with preparing and filing its 2003 federal tax return and preparing its state tax returns, the companyreduced its 2004 tax provision by $195 million. This reduction in the 2004 tax provision was primarily driven by tax benefits for exportsales and state tax benefits for divestitures that exceeded the amounts originally estimated in connection with the 2003 provision. Alsoduring 2004, the company reversed previously accrued taxes related primarily to the closing of a state income tax audit that reduced thetax provision for 2004 by $62 million.
The company reduced its tax provision for 2003 by approximately $758 million due to the tax benefits related to the sale ofcertain businesses and assets through the sale of stock of acquired companies ($75 million in 2002). See “Note 13: Acquisitions andDivestitures.”
In 2001, the U.S. Internal Revenue Service (IRS) commenced an examination of Intel’s tax returns for the years 1999 and 2000.In August 2003, the IRS proposed certain adjustments primarily related to the amounts reflected by Intel on these returns as a taxbenefit for its export sales (see “Note 18: Contingencies”). Subsequently, in January 2005, the IRS issued formal assessments for theseadjustments. The company does not agree with these adjustments and intends to appeal the assessments.
62

INTEL CORPORATIONNOTES TO CONSOLIDATED FINANCIAL STATEMENTS (Continued)
Deferred income taxes reflect the net tax effects of temporary differences between the carrying amount of assets and liabilities forfinancial reporting purposes and the amounts used for income tax purposes. Significant components of the company’s deferred taxassets and liabilities at fiscal year-ends were as follows:
(In Millions) 2004 2003
Deferred tax assets (liabilities)Accrued compensation and other benefits . . . . . . . . . . . . . . . . . . . . . . . . . . . . . . . . . . . . . . . . . . . . . . $ 265 $ 218Accrued advertising . . . . . . . . . . . . . . . . . . . . . . . . . . . . . . . . . . . . . . . . . . . . . . . . . . . . . . . . . . . . . . . 115 107Acquired intangibles . . . . . . . . . . . . . . . . . . . . . . . . . . . . . . . . . . . . . . . . . . . . . . . . . . . . . . . . . . . . . . (26) (68)Deferred income . . . . . . . . . . . . . . . . . . . . . . . . . . . . . . . . . . . . . . . . . . . . . . . . . . . . . . . . . . . . . . . . . . 232 245Depreciation . . . . . . . . . . . . . . . . . . . . . . . . . . . . . . . . . . . . . . . . . . . . . . . . . . . . . . . . . . . . . . . . . . . . . (894) (1,272)Impairment losses on equity investments . . . . . . . . . . . . . . . . . . . . . . . . . . . . . . . . . . . . . . . . . . . . . . . 110 106Inventory valuation . . . . . . . . . . . . . . . . . . . . . . . . . . . . . . . . . . . . . . . . . . . . . . . . . . . . . . . . . . . . . . . 193 156Unrealized gains on investments . . . . . . . . . . . . . . . . . . . . . . . . . . . . . . . . . . . . . . . . . . . . . . . . . . . . . (82) (50)Other, net . . . . . . . . . . . . . . . . . . . . . . . . . . . . . . . . . . . . . . . . . . . . . . . . . . . . . . . . . . . . . . . . . . . . . . . 286 45
199 (513)Valuation allowance . . . . . . . . . . . . . . . . . . . . . . . . . . . . . . . . . . . . . . . . . . . . . . . . . . . . . . . . . . . . . . . (75) —
Net deferred tax assets (liabilities) . . . . . . . . . . . . . . . . . . . . . . . . . . . . . . . . . . . . . . . . . . . . . . . . . . $ 124 $ (513)
Reported as:Current deferred tax assets . . . . . . . . . . . . . . . . . . . . . . . . . . . . . . . . . . . . . . . . . . . . . . . . . . . . . . . . $ 979 $ 969Long-term deferred tax liabilities . . . . . . . . . . . . . . . . . . . . . . . . . . . . . . . . . . . . . . . . . . . . . . . . . . . (855) (1,482)
Net deferred taxes . . . . . . . . . . . . . . . . . . . . . . . . . . . . . . . . . . . . . . . . . . . . . . . . . . . . . . . . . . . . . $ 124 $ (513)
Gross deferred tax assets as of December 25, 2004 were reduced by a valuation allowance of $75 million related to certain statecapital loss carryforwards and state credit carryforwards, as recovery of these assets is not likely. In addition, the company reclassified$445 million from deferred tax liabilities to common stock and capital stock in excess of par value. The balance sheet reclassificationrepresented the tax benefit attributable to certain prior-year stock option exercises by non-U.S. employees and had no impact on theaccompanying statement of cash flows.
U.S. income taxes were not provided for on a cumulative total of approximately $7.9 billion of undistributed earnings for certainnon-U.S. subsidiaries. The company currently intends to reinvest these earnings in operations outside the U.S. The American JobsCreation Act of 2004 (the Jobs Act) creates a temporary incentive for U.S. corporations to repatriate accumulated income earnedabroad by providing an 85% dividends-received deduction for certain dividends from controlled foreign corporations. The deduction issubject to a number of limitations, and currently the company is uncertain as to how to interpret numerous provisions in the Jobs Act.The company is not yet in a position to decide whether, and to what extent, foreign earnings that have not yet been remitted to the U.S.might be repatriated. Based on the analysis to date, however, it is reasonably possible that as much as $6.0 billion might be repatriated,with a respective tax liability of up to $475 million. The company expects to be in a position to finalize its analysis by October 2005.
63

INTEL CORPORATIONNOTES TO CONSOLIDATED FINANCIAL STATEMENTS (Continued)
Note 11: Employee Equity Incentive Plans
Stock Option Plans
In May 2004, stockholder approval was obtained for the 2004 Equity Incentive Plan (the 2004 Plan). Under the 2004 Plan, 240million shares of common stock were made available for issuance during the two-year period ending June 30, 2006. Under the 2004Plan, options to purchase shares may be granted to all employees and non-employee directors. Intel may also use other types of equityincentive awards, such as restricted stock, stock units and stock appreciation rights. The 2004 Plan also allows for performance-basedvesting for equity incentive awards. The Intel Corporation 1984 Stock Option Plan expired in May 2004, and the Intel Corporation1997 Stock Option Plan was terminated upon stockholder approval of the 2004 Plan. As of December 25, 2004, substantially all of thecompany’s employees were participating in one of the stock option plans. Options granted by the company under the 2004 Plan willgenerally expire seven years from the grant date. Options granted under the company’s previous stock option plans generally expire tenyears from the grant date. Options granted in 2004 to existing and newly hired employees generally vest over a four-year period fromthe date of grant. Certain grants to key employees have delayed vesting, generally beginning six years from the date of grant. In prioryears, Intel also assumed the stock option plans and the outstanding options of certain acquired companies. No additional stock grantswill be made under these assumed plans. Additional information with respect to stock option plan activity is as follows:
Outstanding Options
(Shares in Millions)
SharesAvailablefor Grant
Number ofShares
WeightedAverage
Exercise Price
December 29, 2001 . . . . . . . . . . . . . . . . . . . . . . . . . . . . . . . . . . . . . . . . . . . . 1,054.6 768.5 $ 25.33Supplemental grant . . . . . . . . . . . . . . . . . . . . . . . . . . . . . . . . . . . . . . . . . . . . (118.1) 118.1 $ 20.23Other grants . . . . . . . . . . . . . . . . . . . . . . . . . . . . . . . . . . . . . . . . . . . . . . . . . . (55.5) 55.5 $ 25.43Exercises . . . . . . . . . . . . . . . . . . . . . . . . . . . . . . . . . . . . . . . . . . . . . . . . . . . . — (51.4) $ 6.79Cancellations . . . . . . . . . . . . . . . . . . . . . . . . . . . . . . . . . . . . . . . . . . . . . . . . . 40.8 (45.3) $ 33.56
December 28, 2002 . . . . . . . . . . . . . . . . . . . . . . . . . . . . . . . . . . . . . . . . . . . . 921.8 845.4 $ 25.31Grants . . . . . . . . . . . . . . . . . . . . . . . . . . . . . . . . . . . . . . . . . . . . . . . . . . . . . . (109.9) 109.9 $ 20.22Exercises . . . . . . . . . . . . . . . . . . . . . . . . . . . . . . . . . . . . . . . . . . . . . . . . . . . . — (63.7) $ 10.08Cancellations . . . . . . . . . . . . . . . . . . . . . . . . . . . . . . . . . . . . . . . . . . . . . . . . . 40.0 (41.5) $ 30.49Reduction in shares available for grant . . . . . . . . . . . . . . . . . . . . . . . . . . . . . (325.0) — —
December 27, 2003 . . . . . . . . . . . . . . . . . . . . . . . . . . . . . . . . . . . . . . . . . . . . 526.9 850.1 $ 25.54Grants . . . . . . . . . . . . . . . . . . . . . . . . . . . . . . . . . . . . . . . . . . . . . . . . . . . . . . (114.7) 114.7 $ 26.23Exercises . . . . . . . . . . . . . . . . . . . . . . . . . . . . . . . . . . . . . . . . . . . . . . . . . . . . — (48.4) $ 10.89Cancellations . . . . . . . . . . . . . . . . . . . . . . . . . . . . . . . . . . . . . . . . . . . . . . . . . 11.5 (32.5) $ 30.00Expiration of 1984 Stock Option Plan . . . . . . . . . . . . . . . . . . . . . . . . . . . . . . (143.2) — —Cancellation of 1997 Stock Option Plan . . . . . . . . . . . . . . . . . . . . . . . . . . . . (300.1) — —Adoption of 2004 Equity Incentive Plan . . . . . . . . . . . . . . . . . . . . . . . . . . . . 240.0 — —
December 25, 2004 . . . . . . . . . . . . . . . . . . . . . . . . . . . . . . . . . . . . . . . . . . . . 220.4 883.9 $ 26.26
Options exercisable at:December 28, 2002 . . . . . . . . . . . . . . . . . . . . . . . . . . . . . . . . . . . . . . . . . . 274.0 $ 16.57December 27, 2003 . . . . . . . . . . . . . . . . . . . . . . . . . . . . . . . . . . . . . . . . . . 327.5 $ 20.53December 25, 2004 . . . . . . . . . . . . . . . . . . . . . . . . . . . . . . . . . . . . . . . . . . 397.5 $ 23.83
In December 2003, the Board of Directors approved a reduction in the number of shares authorized for issuance under the 1997Stock Option Plan, reducing the number of shares available for issuance by 325 million. In November 2002, a supplemental stockoption grant was given to employees who had previously been granted options in 2001 and 2000 that had exercise prices above theNovember 2002 market price. This 2002 supplemental grant was made in order to retain employees, due to competitive marketconditions and a decline in the company’s stock price. These 2002 supplemental stock option grants vest in equal amounts over fouryears.
The range of option exercise prices for options outstanding at December 25, 2004 was $0.05 to $87.90. This range reflects theimpact of options assumed with acquired companies in addition to the fluctuating price of Intel common stock.
64

INTEL CORPORATIONNOTES TO CONSOLIDATED FINANCIAL STATEMENTS (Continued)
The following table summarizes information about options outstanding at December 25, 2004:
Outstanding Options Exercisable Options
Range of Exercise Prices
Number ofShares
(In Millions)
WeightedAverage
ContractualLife
(In Years)
WeightedAverageExercise
Price
Number ofShares
(In Millions)
WeightedAverageExercise
Price
$0.05–$15.00 . . . . . . . . . . . . . . . . . . . . . . . . . . . . . . 64.2 1.3 $ 7.65 63.9 $ 7.62$15.01–$20.00 . . . . . . . . . . . . . . . . . . . . . . . . . . . . . 197.6 5.5 $ 18.22 117.7 $ 18.34$20.01–$25.00 . . . . . . . . . . . . . . . . . . . . . . . . . . . . . 267.7 7.0 $ 22.32 65.1 $ 20.82$25.01–$30.00 . . . . . . . . . . . . . . . . . . . . . . . . . . . . . 163.0 8.0 $ 27.22 46.1 $ 26.51$30.01–$40.00 . . . . . . . . . . . . . . . . . . . . . . . . . . . . . 101.8 5.6 $ 33.41 72.9 $ 33.48$40.01–$87.90 . . . . . . . . . . . . . . . . . . . . . . . . . . . . . 89.6 5.3 $ 59.27 31.8 $ 56.84
Total . . . . . . . . . . . . . . . . . . . . . . . . . . . . . . . . . . . . 883.9 6.1 $ 26.26 397.5 $ 23.83
These options will expire if not exercised at specific dates through May 2014. Option exercise prices for options exercised duringthe three-year period ended December 25, 2004 ranged from $0.01 to $36.47.
Stock Participation Plan
In addition to the employee stock option plans, the company has a Stock Participation Plan under which eligible employees maypurchase shares of Intel’s common stock at 85% of the average of the high and low stock price reported on The NASDAQ StockMarket at specific, predetermined dates. Approximately 70% of the company’s employees were participating in the Stock ParticipationPlan as of December 25, 2004. Of the 944 million shares authorized to be issued under the plan, 67.5 million shares remained availablefor issuance at December 25, 2004. Employees purchased 18.4 million shares in 2004 (23.8 million in 2003 and 17.0 million in 2002)for $367 million ($328 million in 2003 and $338 million in 2002).
Note 12: Retirement Benefit Plans
Profit Sharing Plans
The company provides tax-qualified profit sharing retirement plans for the benefit of eligible employees, former employees andretirees in the U.S. and certain other countries. The plans are designed to provide employees with an accumulation of funds forretirement on a tax-deferred basis and provide for annual discretionary employer contributions. Amounts to be contributed to the U.S.Profit Sharing Plan are determined by the Chief Executive Officer of the company under delegation of authority from the Board ofDirectors, pursuant to the terms of the Profit Sharing Plan. As of December 25, 2004, substantially all of the assets of the U.S. ProfitSharing Plan have been allocated to an equity index fund managed by an outside fund manager, consistent with the investment policy.
The company also provides a non-qualified profit sharing retirement plan for the benefit of eligible employees in the U.S. Thisplan is designed to permit certain discretionary employer contributions and to permit employee deferral of a portion of salaries inexcess of certain tax limits and deferral of bonuses. This plan is unfunded.
The company expensed $323 million for the qualified and non-qualified U.S. profit sharing retirement plans in 2004 ($302million in 2003 and $303 million in 2002). The company expects to fund approximately $315 million for the 2004 contribution to theU.S. qualified Profit Sharing Plan and to allocate approximately $5 million for the U.S. non-qualified profit sharing retirement plan.
Contributions made by the company to the U.S. Profit Sharing Plan on behalf of the employees vest based on the employee’syears of service. Vesting begins after three years of service in 20% annual increments until the employee is 100% vested after sevenyears, or earlier, if the employee reaches age 60.
65

INTEL CORPORATIONNOTES TO CONSOLIDATED FINANCIAL STATEMENTS (Continued)
Pension and Postretirement Benefit Plans
U.S. Pension Benefits. The company provides a tax-qualified defined-benefit pension plan for the benefit of eligible employeesand retirees in the U.S. The plan provides for a minimum pension benefit that is determined by a participant’s years of service and finalaverage compensation (taking into account the participant’s social security wage base), reduced by the participant’s balance in theProfit Sharing Plan. If the pension benefit exceeds the participant’s balance in the Profit Sharing Plan, the participant will receive acombination of pension and profit sharing amounts equal to the pension benefit. However, the participant will receive only the benefitfrom the Profit Sharing Plan if that benefit is greater than the value of the pension benefit. The U.S. defined-benefit plan’s projectedbenefit obligation assumes future contributions to the Profit Sharing Plan, and if the company does not continue to contribute to orsignificantly reduces contributions to the Profit Sharing Plan, the U.S. defined-benefit plan projected benefit obligation could increasesignificantly. Historically, the company has contributed 8% to 12.5% of participants’ eligible compensation to the Profit Sharing Planon an annual basis. The benefit obligation and related assets under this plan have been measured as of November 30, 2004.
Non-U.S. Pension Benefits. The company also provides defined-benefit pension plans in certain other countries. Consistent withthe requirements of local law, the company deposits funds for certain of these plans with insurance companies, third-party trustees, orinto government-managed accounts, and/or accrues for the unfunded portion of the obligation. The assumptions used in calculating theobligation for the non-U.S. plans depend on the local economic environment. The benefit obligations and related assets under theseplans have been measured as of December 25, 2004.
Postretirement Medical Benefits. Upon retirement, eligible U.S. employees are credited with a defined dollar amount based onyears of service. These credits can be used to pay all or a portion of the cost to purchase coverage in an Intel-sponsored medical plan. Ifthe available credits are not sufficient to pay the entire cost of the coverage, the remaining cost is the responsibility of the retiree.
Funding Policy. The company’s practice is to fund the various pension plans in amounts at least sufficient to meet the minimumrequirements of U.S. federal laws and regulations or applicable local laws and regulations. The assets of the various plans are investedin corporate equities, corporate debt securities, government securities and other institutional arrangements. The portfolio of each plandepends on plan design and applicable local laws. Depending on the design of the plan, local custom and market circumstances, theminimum liabilities of a plan may exceed qualified plan assets. The company accrues for all such liabilities.
Benefit Obligation and Plan Assets
The changes in the benefit obligations, plan assets and funded status for the plans described above were as follows:
U.S. PensionBenefits
Non-U.S. PensionBenefits
PostretirementMedical Benefits
(In Millions) 2004 2003 2004 2003 2004 2003
Change in projected benefit obligation:Beginning benefit obligation . . . . . . . . . . . . . . . . . . . . . . . . . . . . $ 49 $ 28 $ 306 $ 242 $ 178 $ 132Service cost . . . . . . . . . . . . . . . . . . . . . . . . . . . . . . . . . . . . . . . . . 2 5 29 26 15 12Interest cost . . . . . . . . . . . . . . . . . . . . . . . . . . . . . . . . . . . . . . . . . 2 3 16 18 12 10Plan participants’ contributions . . . . . . . . . . . . . . . . . . . . . . . . . . — — 6 3 2 —Actuarial (gain) loss . . . . . . . . . . . . . . . . . . . . . . . . . . . . . . . . . . (10) 14 (40) (15) (26) 28Currency exchange rate changes . . . . . . . . . . . . . . . . . . . . . . . . . — — 17 37 — —Benefits paid to plan participants . . . . . . . . . . . . . . . . . . . . . . . . (1) (1) (7) (5) (4) (4)
Ending projected benefit obligation . . . . . . . . . . . . . . . . . . . . . $ 42 $ 49 $ 327 $ 306 $ 177 $ 178
66

INTEL CORPORATIONNOTES TO CONSOLIDATED FINANCIAL STATEMENTS (Continued)
U.S. PensionBenefits
Non-U.S. PensionBenefits
PostretirementMedical Benefits
(In Millions) 2004 2003 2004 2003 2004 2003
Change in plan assets:Beginning fair value of plan assets . . . . . . . . . . . . . . . . . . . . . . . . $ 30 $ 23 $ 195 $ 140 $ 2 $ 1Actual return on plan assets . . . . . . . . . . . . . . . . . . . . . . . . . . . . . . 3 2 4 18 — —Employer contributions . . . . . . . . . . . . . . . . . . . . . . . . . . . . . . . . . 7 6 31 15 4 3Plan participants’ contributions . . . . . . . . . . . . . . . . . . . . . . . . . . . — — 6 3 2 2Currency exchange rate changes . . . . . . . . . . . . . . . . . . . . . . . . . . — — 11 23 — —Benefits paid to participants . . . . . . . . . . . . . . . . . . . . . . . . . . . . . (1) (1) (7) (4) (4) (4)
Ending fair value of plan assets . . . . . . . . . . . . . . . . . . . . . . . . . $ 39 $ 30 $ 240 $ 195 $ 4 $ 2
U.S. PensionBenefits
Non-U.S. PensionBenefits
PostretirementMedical Benefits
(In Millions) 2004 2003 2004 2003 2004 2003
Funded status:Ending funded status . . . . . . . . . . . . . . . . . . . . . . . . . . . . . . . . . . . $ (3) $ (19) $ (87) $(111) $(173) $(176)Unrecognized transition obligation . . . . . . . . . . . . . . . . . . . . . . . . — — 2 2 — —Unrecognized net actuarial (gain) loss . . . . . . . . . . . . . . . . . . . . . . 5 18 (3) 32 6 33Unrecognized prior service cost . . . . . . . . . . . . . . . . . . . . . . . . . . 1 1 — — 33 36
Net amount recognized . . . . . . . . . . . . . . . . . . . . . . . . . . . . . . . . $ 3 $ — $ (88) $ (77) $(134) $(107)
The amounts recognized on the balance sheet for the plans described above were as follows:
U.S. PensionBenefits
Non-U.S. PensionBenefits
PostretirementMedical Benefits
(In Millions) 2004 2003 2004 2003 2004 2003
Amounts recognized in the balance sheet:Prepaid benefit cost . . . . . . . . . . . . . . . . . . . . . . . . . . . . . . . . . . . . $ 3 $ — $ 40 $ 25 $ — $ —Accrued benefit liability . . . . . . . . . . . . . . . . . . . . . . . . . . . . . . . . — — (131) (103) (134) (107)Deferred tax asset . . . . . . . . . . . . . . . . . . . . . . . . . . . . . . . . . . . . . — — 1 — — —Accumulated other comprehensive income . . . . . . . . . . . . . . . . . . — — 2 1 — —
Net amount recognized . . . . . . . . . . . . . . . . . . . . . . . . . . . . . . . . $ 3 $ — $ (88) $ (77) $(134) $(107)
The accumulated benefit obligations for the plans were as follows:U.S. Pension
BenefitsNon-U.S. Pension
BenefitsPostretirement
Medical Benefits
(In Millions) 2004 2003 2004 2003 2004 2003
Accumulated benefit obligation . . . . . . . . . . . . . . . . . . . . . . . . . . . $ 38 $ 28 $ 222 $ 224 $ 177 $ 178
Included in the aggregate data in the tables below are the aggregate amounts applicable to the company’s pension plans withaccumulated benefit obligations in excess of plan assets as well as plans with projected benefit obligations in excess of plan assets.Amounts related to such plans were as follows:
U.S. PensionBenefits
Non-U.S. PensionBenefits
(In Millions) 2004 2003 2004 2003
Plans with accumulated benefit obligations in excess of plan assets:Accumulated benefit obligations . . . . . . . . . . . . . . . . . . . . . . . . . . . . . . . . . . . . . . . . . $ — $ — $ 70 $ 148Plan assets . . . . . . . . . . . . . . . . . . . . . . . . . . . . . . . . . . . . . . . . . . . . . . . . . . . . . . . . . . $ — $ — $ 18 $ 87
Plans with projected benefit obligations in excess of plan assets:Projected benefit obligations . . . . . . . . . . . . . . . . . . . . . . . . . . . . . . . . . . . . . . . . . . . . $ 42 $ 49 $ 296 $ 306Plan assets . . . . . . . . . . . . . . . . . . . . . . . . . . . . . . . . . . . . . . . . . . . . . . . . . . . . . . . . . . $ 39 $ 30 $ 205 $ 195
67

INTEL CORPORATIONNOTES TO CONSOLIDATED FINANCIAL STATEMENTS (Continued)
Assumptions
Weighted-average actuarial assumptions used to determine benefit obligations for the plans were as follows:
U.S. PensionBenefits
Non-U.S. PensionBenefits
PostretirementMedical Benefits
2004 2003 2004 2003 2004 2003
Discount rate . . . . . . . . . . . . . . . . . . . . . . . . . . . . . . . . . . . . . . . . . 5.6% 6.0% 5.9% 5.5% 5.6% 6.0%Expected return on plan assets . . . . . . . . . . . . . . . . . . . . . . . . . . . . 8.0% 8.0% 6.3% 6.7% — —Rate of compensation increase . . . . . . . . . . . . . . . . . . . . . . . . . . . 5.0% 5.0% 3.5% 3.5% — —Future profit sharing contributions . . . . . . . . . . . . . . . . . . . . . . . . 8.0% 6.0% — — — —
For the postretirement medical benefit plan, an increase in the assumed healthcare cost trend rate of one percentage point eachyear would not have a significant impact on the benefit obligation because the plan provides defined credits that the retiree can use topay all or a portion of the cost to purchase medical coverage.
Weighted-average actuarial assumptions used to determine costs for the plans were as follows:
U.S. PensionBenefits
Non-U.S. PensionBenefits
PostretirementMedical Benefits
2004 2003 2004 2003 2004 2003
Discount rate . . . . . . . . . . . . . . . . . . . . . . . . . . . . . . . . . . . . . . . . . 6.0% 7.0% 5.9% 5.5% 6.0% 7.0%Expected return on plan assets . . . . . . . . . . . . . . . . . . . . . . . . . . . . 8.0% 8.0% 6.3% 6.7% — —Rate of compensation increase . . . . . . . . . . . . . . . . . . . . . . . . . . . 5.0% 5.0% 3.5% 3.5% — —Future profit sharing contributions . . . . . . . . . . . . . . . . . . . . . . . . 8.0% 6.0% — — — —
Several factors are considered in developing the asset return assumptions for the U.S. and non-U.S. plans. The company analyzedrates of return relevant to the country where each plan is in effect and the investments applicable to the plan. Additional analysis wasperformed in order to reflect expectations of future returns. For the U.S. plan, the company analyzed the historical and projected ratesof return of the Standard & Poor’s 500 Index*. For the non-U.S. plans, the company analyzed local actuarial projections as well as theprojected rates of return from investment managers. In addition, the expected long-term rate of return shown for the non-U.S. planassets is weighted to reflect each country’s relative portion of the non-U.S. plan assets.
Net Periodic Benefit Cost
The net periodic benefit cost for the plans included the following components:
U.S. PensionBenefits
Non-U.S. PensionBenefits
PostretirementMedical Benefits
(In Millions) 2004 2003 2002 2004 2003 2002 2004 2003 2002
Service cost . . . . . . . . . . . . . . . . . . . $ 4 $ 7 $ 6 $ 29 $ 27 $ 22 $ 15 $ 12 $ 10Interest cost . . . . . . . . . . . . . . . . . . . 2 2 2 16 18 14 11 10 8Expected return on plan assets . . . . . (2) (2) (1) (14) (1) (12) — — —Amortization of prior service cost . . 1 1 — — — — 4 4 4Recognized net actuarial loss . . . . . . — 1 — — 1 — 1 — —
Net periodic benefit cost . . . . . . . . $ 5 $ 9 $ 7 $ 31 $ 45 $ 24 $ 31 $ 26 $ 22
68

INTEL CORPORATIONNOTES TO CONSOLIDATED FINANCIAL STATEMENTS (Continued)
U.S. Plan Assets
The company’s U.S. Pension Plan assets at the end of fiscal 2004 and 2003 were 100% allocated to equity securities. The targetallocation for 2005 is expected to remain the same. The long-term rate of return for the equity securities used in these calculations isassumed to be 8%. In general, the investment strategy followed is designed to assure that the pension assets are available to paybenefits as they come due and minimize market risk. The U.S. plan assets are invested in equity securities, primarily in large,diversified domestic and multinational U.S. equities, which seek to match the performance of the S&P 500. When deemed appropriate,a portion of the fund may be invested in futures contracts for the purpose of acting as a temporary substitute for an investment in aparticular equity security. The fund does not engage in speculative futures transactions.
Non-U.S. Plan Assets
The non-U.S. plans’ investments are managed by insurance companies, third-party trustees or pension funds consistent withregulations or market practice of the country where the assets are invested. The investment manager makes investment decisions withinthe guidelines set by Intel or local regulations. Performance is evaluated by comparing the actual rate of return to the return of otherbenchmark funds. Investments that are managed by qualified insurance companies or pension funds under standard contracts followlocal regulations, and Intel is not actively involved in the investment strategy. In general, the investment strategy followed is designedto accumulate a diversified portfolio among markets, asset classes or individual securities in order to reduce market risk and assure thatthe pension assets are available to pay benefits as they come due. The average expected long-term rate of return for the non-U.S. planassets is 6.3%.
The asset allocation for the company’s non-U.S. plans, excluding assets managed by qualified insurance companies, at the end offiscal 2004 and 2003, and the target allocation rate for 2005, by asset category, are as follows:
Percentage of Plan Assets
Asset Category Target Allocation 2004 2003
Equity securities . . . . . . . . . . . . . . . . . . . . . . . . . . . . . . . . . . . 81.0% 79.0% 80.0%Debt securities . . . . . . . . . . . . . . . . . . . . . . . . . . . . . . . . . . . . 13.0% 13.0% 12.0%Other . . . . . . . . . . . . . . . . . . . . . . . . . . . . . . . . . . . . . . . . . . . 6.0% 8.0% 8.0%
Investments that are managed by qualified insurance companies are invested as part of the insurance companies’ general fund.Intel does not have control over the target allocation of these investments. These investments made up 35% of total non-U.S. planassets in 2004 and 42% in 2003.
Funding Expectations
No further contributions are required during 2005 under applicable law for the U.S. Pension Plan. The company intends to makevoluntary contributions so that assets exceed the accumulated benefit obligation at the end of the year. Expected funding for thenon-U.S. plans during 2005 is $31 million. Employer contributions to the postretirement medical benefits plan are expected to be lessthan $1 million during 2005.
Estimated Future Benefit Payments
The total benefits to be paid from the U.S. and non-U.S. pension plans and other postretirement benefit plans, including theamounts that will be funded from retiree contributions, are not expected to exceed $50 million in any year through 2014.
69

INTEL CORPORATIONNOTES TO CONSOLIDATED FINANCIAL STATEMENTS (Continued)
Note 13: Acquisitions and Divestitures
Business Combinations
All of the company’s acquisitions that qualified as business combinations have been accounted for using the purchase method ofaccounting. Consideration includes the cash paid and the value of any options assumed, less any cash acquired, and excludescontingent employee compensation payable in cash and any debt assumed. The company accounts for the intrinsic value of stockoptions assumed related to future services as unearned compensation within stockholders’ equity (see “Note 15: Identified IntangibleAssets and Acquisition-Related Unearned Stock Compensation”).
During 2004, the company completed an acquisition qualifying as a business combination in exchange for net cash considerationof approximately $33 million, plus certain liabilities. During 2003, the company completed one acquisition qualifying as a businesscombination in exchange for total cash consideration of approximately $21 million. The operating results of the businesses acquired in2003 and 2004 have been included in the results of the Intel Communications Group (ICG) operating segment from the date ofacquisition. There were no acquisitions qualifying as business combinations in 2002.
Development-Stage Operations
An acquisition of a development-stage operation does not qualify as a business combination under SFAS No. 141, “BusinessCombinations,” and purchase consideration for such an acquisition is not allocated to goodwill. Workforce-in-place qualifies as anidentified intangible asset for an acquisition of a development-stage operation.
During 2003, the company acquired a development-stage operation in exchange for total cash consideration of approximately $40million, all of which was allocated to workforce-in-place. During 2002, the company acquired three development-stage operations inexchange for total consideration of approximately $57 million. Approximately $35 million was allocated to acquisition-relateddeveloped technology and $20 million to purchased in-process research and development, with the remaining amount representing thevalue of net tangible assets. The operating results of each of these acquisitions since the date of acquisition have been included in theoperating results of the acquiring business unit within either the ICG operating segment or the “all other” category, as appropriate, forsegment reporting purposes.
Divestitures
During 2003, the company recognized approximately $758 million in tax benefits related to sales of the stock of certainpreviously acquired companies, primarily DSP Communications, Inc. (DSP), Dialogic Corporation and Xircom, Inc. A net benefit ofapproximately $420 million was recognized on the divestiture of a portion of the intellectual property assets of DSP, through the saleof the stock of DSP. A benefit of approximately $200 million was recognized on the divestiture of a portion of the assets, primarily realestate, of Dialogic, through the sale of the stock of Dialogic, and a benefit of approximately $125 million was recognized related to thesale of a wireless WAN business, through the sale of the stock of Xircom. The pre-tax gains and losses on these sales for financialstatement or book purposes were not significant. The company was able to recognize tax losses because the tax basis in the entitiesexceeded the book basis, as the goodwill allocated to the transactions for financial statement purposes was less than the amount thecompany could effectively deduct for tax purposes. During 2002, the company recognized a $75 million tax benefit related to sales ofthe stock of certain previously acquired companies, primarily Ziatech Corporation.
70

INTEL CORPORATIONNOTES TO CONSOLIDATED FINANCIAL STATEMENTS (Continued)
Note 14: Goodwill
Goodwill attributed to operating segments for the years ended December 27, 2003 and December 25, 2004 was as follows:
(In Millions)
IntelCommunications
Group
IntelArchitecture
Business All Other Total
December 28, 2002 . . . . . . . . . . . . . . . . . . . . . . . . $ 4,255 $ 69 $ 6 $ 4,330Impairments . . . . . . . . . . . . . . . . . . . . . . . . . . . . . (611) — (6) (617)Additions . . . . . . . . . . . . . . . . . . . . . . . . . . . . . . . . 3 — — 3Other adjustments . . . . . . . . . . . . . . . . . . . . . . . . . (9) (2) — (11)
December 27, 2003 . . . . . . . . . . . . . . . . . . . . . . . . 3,638 67 — 3,705Transfer . . . . . . . . . . . . . . . . . . . . . . . . . . . . . . . . . (466) 466 — —Additions . . . . . . . . . . . . . . . . . . . . . . . . . . . . . . . . 29 — — 29Other adjustments . . . . . . . . . . . . . . . . . . . . . . . . . (15) — — (15)
December 25, 2004 . . . . . . . . . . . . . . . . . . . . . . . . $ 3,186 $ 533 $ — $ 3,719
During the first quarter of 2004, the company combined its communications-related businesses, the former Intel CommunicationsGroup (ICG) and the Wireless Communications and Computing Group (WCCG), into a single organization, the Intel CommunicationsGroup (ICG) (see “Note 19: Operating Segment and Geographic Information”). The ICG operating segment is made up of tworeporting units: the flash memory reporting unit and the ICG reporting unit. All of the ICG operating segment goodwill is included inthe ICG reporting unit. Also during the first quarter of 2004, the consumer electronics business, which was previously part of theformer ICG operating segment, was moved into the Intel Architecture business. Based on the estimated fair value of the consumerelectronics business relative to the former ICG reporting unit, goodwill of $466 million was transferred to the Intel Architecturebusiness.
During the fourth quarter of 2004, the company completed its annual review and determined that the fair value of the ICGreporting unit was in excess of its carrying value; therefore, goodwill was not impaired. During 2003, the company completed itsimpairment review for goodwill for the former ICG and WCCG reporting units and found indicators of impairment for the WCCGreporting unit. The WCCG business, comprising primarily flash memory products and cellular baseband chipsets, had not performed asmanagement had expected, and it became apparent that WCCG was expected to grow more slowly than had previously been projected.A slower-than-expected rollout of products and slower-than-expected customer acceptance of the reporting unit’s products in thebaseband chipset business, as well as a delay in the transition to next-generation phone networks, had pushed out the forecasts for salesinto high-end data cell phones. These factors resulted in lower growth expectations for the reporting unit and triggered the goodwillimpairment. An impairment review requires a two-step process. The first step of the review compares the fair value of the reportingunits with substantial goodwill against their aggregate carrying values, including goodwill. The company estimated the fair value of theWCCG and ICG reporting units using the income method of valuation, which included the use of estimated discounted cash flows.Based on the comparison, the carrying value of the WCCG reporting unit exceeded the fair value. Accordingly, the companyperformed the second step of the test, comparing the implied fair value of the WCCG reporting unit’s goodwill with the carryingamount of that goodwill. Based on this assessment, the company recorded a non-cash impairment charge of $611 million in 2003,which was included as a component of operating income in the “all other” category for segment reporting purposes.
Also during 2003, the goodwill related to one of the company’s small seed businesses, included in the “all other” category, wasimpaired. In addition, goodwill in the ICG operating segment decreased, primarily as a result of goodwill allocated to divestitures on afair value basis in 2003. During 2004, the company recorded goodwill of $29 million ($3 million in 2003) in connection with aqualifying business combination. In 2004, as a result of a change in estimate associated with deferred tax assets of certain previousacquisitions, goodwill in the ICG operating segment decreased.
71

INTEL CORPORATIONNOTES TO CONSOLIDATED FINANCIAL STATEMENTS (Continued)
Note 15: Identified Intangible Assets and Acquisition-Related Unearned Stock Compensation
Identified intangible assets acquired during 2004 and 2003 are summarized as follows:
2004 2003
(In Millions) Value
WeightedAverage
Life Value
WeightedAverage
Life
Acquisition-related developed technology . . . . . . . . . . . . . . . . $ 18 4 $ 14 4Other acquisition-related intangibles . . . . . . . . . . . . . . . . . . . . . 28 3 40 2Intellectual property assets . . . . . . . . . . . . . . . . . . . . . . . . . . . . 250 8 96 5
Total identified intangible assets . . . . . . . . . . . . . . . . . . . . . . $ 296 $ 150
In 2004, the company entered into certain arrangements related to the hiring of a group of employees which resulted in therecording of workforce-in-place of $28 million. Also in 2004, the company acquired $18 million in developed technology inconnection with an acquisition qualifying as a business combination (see “Note 13: Acquisitions and Divestitures”).
Of the intellectual property assets acquired in 2004, $63 million represented the value of assets capitalized as a result of paymentsunder the settlement agreement with Intergraph Corporation related to the lawsuit in Texas (see “Note 18: Contingencies”). The valueof the Intergraph assets was derived from the expected future revenue from Intel microprocessors, Intel chipsets and Intel motherboardssold in combination. Also during 2004, the company entered into a cross-license agreement for cash consideration of $143 million,which will be amortized over a period of 10 years.
Identified intangible assets as of December 25, 2004 consisted of the following:
(In Millions) Gross AssetsAccumulatedAmortization Net
Acquisition-related developed technology . . . . . . . . . . . . . . . . . . . . . . . . . . . . $ 631 $ (514) $ 117Other acquisition-related intangibles . . . . . . . . . . . . . . . . . . . . . . . . . . . . . . . . . 91 (45) 46Intellectual property assets . . . . . . . . . . . . . . . . . . . . . . . . . . . . . . . . . . . . . . . . 799 (285) 514
Total identified intangible assets . . . . . . . . . . . . . . . . . . . . . . . . . . . . . . . . . . $ 1,521 $ (844) $ 677
Identified intangible assets as of December 27, 2003 consisted of the following:
(In Millions) Gross AssetsAccumulatedAmortization Net
Acquisition-related developed technology . . . . . . . . . . . . . . . . . . . . . . . . . . . . $ 994 $ (772) $ 222Other acquisition-related intangibles . . . . . . . . . . . . . . . . . . . . . . . . . . . . . . . . . 94 (49) 45Intellectual property assets . . . . . . . . . . . . . . . . . . . . . . . . . . . . . . . . . . . . . . . . 604 (212) 392
Total identified intangible assets . . . . . . . . . . . . . . . . . . . . . . . . . . . . . . . . . . $ 1,692 $ (1,033) $ 659
Amortization of acquisition-related intangibles and costs included the following:
(In Millions) 2004 2003 2002
Amortization of acquisition-related intangibles . . . . . . . . . . . . . . . . . . . . . . . . $ 150 $ 203 $ 246Impairment of acquisition-related intangibles . . . . . . . . . . . . . . . . . . . . . . . . . . — — 127Amortization of acquisition-related unearned stock compensation . . . . . . . . . . 16 39 90Other acquisition-related costs . . . . . . . . . . . . . . . . . . . . . . . . . . . . . . . . . . . . . 13 59 85
Total . . . . . . . . . . . . . . . . . . . . . . . . . . . . . . . . . . . . . . . . . . . . . . . . . . . . . . . . $ 179 $ 301 $ 548
72

INTEL CORPORATIONNOTES TO CONSOLIDATED FINANCIAL STATEMENTS (Continued)
Acquisition-related intangible impairments of $127 million in 2002 related to a portion of the developed technology acquired withthe Xircom acquisition and the acquisition of Trillium Digital Systems, Inc. The impaired developed technology of Xircom primarilyrelated to PC Ethernet cards, whose forecasted revenue declined significantly as the market moved to LAN-on-motherboardtechnology. The impaired developed technology of Trillium related primarily to a change in the product roadmap for telephonyoperating-systems software that resulted in a significant decline in forecasted revenue for that technology. The amount of theimpairments was determined using a fair-value approach based on discounted future cash flows.
The company records acquisition-related purchase consideration as unearned stock-based compensation in accordance with FASBInterpretation No. 44, “Accounting for Certain Transactions Involving Stock Compensation.” During 2004 and 2003, the companyrecorded no such unearned stock-based compensation. Acquisition-related unearned stock compensation includes the portion of thepurchase consideration related to shares issued contingent upon the continued employment of selected employee stockholders and/orthe completion of specified milestones. The unearned stock-based compensation also includes the intrinsic value of stock optionsassumed in connection with business combinations that is earned as the employees provide future services. The compensation is beingrecognized over the period earned, and the expense is included in the amortization of acquisition-related intangibles and costs.
Other acquisition-related costs include the amortization of deferred cash payments that represent contingent compensation toemployees related to previous acquisitions. The compensation is being recognized over the period earned. All amortization ofacquisition-related intangibles and costs, including impairments, is included in “all other” for segment reporting purposes.
Amortization of intellectual property assets was $120 million in 2004 ($118 million in 2003 and $120 million in 2002). Theamortization of an intellectual property asset is generally included in either cost of sales or research and development.
Based on the carrying value of identified intangible assets recorded at December 25, 2004, and assuming no subsequentimpairment of the underlying assets, the annual amortization expense is expected to be as follows:
(In Millions) 2005 2006 2007 2008 2009
Acquisition-related intangibles . . . . . . . . . . . . . . . . . . . . . . . . . . . . . . . . . . . . . . . $115 $ 35 $ 12 $ 1 $ —Intellectual property assets . . . . . . . . . . . . . . . . . . . . . . . . . . . . . . . . . . . . . . . . . . $115 $106 $ 76 $67 $ 39
Note 16: Impairment of Long-Lived Assets
During 2003, the company substantially completed the wind-down of its Intel® Online Services web hosting business. Thecompany recognized a related $131 million pre-tax charge in cost of sales, of which $106 million was recorded in 2002, and theremainder was recorded in 2003 due to an increase in the estimate of assets that would no longer be utilized. Approximately $123million of the charge related to the impairment of the web hosting business’ assets, including leasehold improvements and serverequipment. The amount of the impairment was determined based on discounted future cash flows and comparable market prices. Theremaining $8 million represented the accrual of lease and other exit-related costs. The total charge was reflected in the “all other”category for segment reporting purposes. For both 2003 and 2002, the operating results of this business were not significant to theresults of the company.
Note 17: Commitments
The company leases a portion of its capital equipment and certain of its facilities under operating leases that expire at variousdates through 2026. Rental expense was $136 million in 2004, $149 million in 2003 and $163 million in 2002. Minimum rentalcommitments under all non-cancelable leases with an initial term in excess of one year are payable as follows: 2005—$124 million;2006—$82 million; 2007—$56 million; 2008—$43 million; 2009—$36 million; 2010 and beyond—$222 million. Commitments forconstruction or purchase of property, plant and equipment approximated $2.8 billion at December 25, 2004. Capital purchaseobligations increased from $1.5 billion at December 27, 2003 to $2.8 billion at December 25, 2004, primarily due to purchaseobligations for capital equipment relating to next-generation 65-nanometer process technology. Other commitments as of December25, 2004 totaled $687 million. Other commitments primarily included payments due under various types of licenses and non-contingent funding obligations, such as co-marketing and co-development initiatives.
73

INTEL CORPORATIONNOTES TO CONSOLIDATED FINANCIAL STATEMENTS (Continued)
Note 18: Contingencies
Tax Matters
In August 2003, in connection with the IRS’s regular examination of Intel’s tax returns for the years 1999 and 2000, the IRSproposed certain adjustments primarily related to the amounts reflected by Intel on these returns as a tax benefit for its export sales. InJanuary 2005, the IRS issued formal assessments for these adjustments. The company does not agree with these adjustments andintends to appeal these assessments. If the IRS prevails in its position, Intel’s federal income tax due for these years would increase byapproximately $600 million, plus interest. The IRS may make similar claims for years subsequent to 2000 in future audits.
Although the final resolution of the adjustments is uncertain, based on currently available information, management believes thatthe ultimate outcome will not have a material adverse effect on the company’s financial position, cash flows or overall trends in resultsof operations. There is the possibility of a material adverse impact on the results of operations of the period in which the matter isultimately resolved, if it is resolved unfavorably, or in the period in which an unfavorable outcome becomes probable and reasonablyestimable.
Legal Proceedings
In 1997, Intergraph Corporation filed suit in Federal District Court in Alabama, generally alleging, among other claims, that Intelinfringed certain Intergraph patents. In 2001, Intergraph filed a second suit in the U.S. District Court for the Eastern District of Texas,alleging that Intel infringed additional Intergraph patents, and seeking an injunction and unspecified damages. In 2002, Intel andIntergraph entered into a settlement agreement, pursuant to which they agreed to settle the Alabama lawsuit and dismiss it withprejudice. Pursuant to the 2002 settlement agreement, Intel made a cash payment of $300 million to Intergraph and received a licenseunder all Intergraph patents, excluding the patents at issue in the Texas case.
Under the 2002 settlement agreement, if the patents in the Texas case were found to be infringed, Intel would pay Intergraph $150million. If Intergraph prevailed on either patent on appeal, the 2002 settlement agreement provided that Intel would pay Intergraph anadditional $100 million and receive a license for the patents at issue in the case. In 2002, the Texas District Court ruled that Intelinfringed both patents at issue in that case. Pursuant to the settlement agreement, Intel paid Intergraph $150 million. Intel then appealedthe decision. In February 2004, the Court of Appeals for the Federal Circuit found that the District Court had erred, and remanded thecase to the District Court to determine in the first instance whether the patents at issue had been infringed.
In 2002, Intergraph filed suit in the Eastern District of Texas against Dell Inc., Gateway Inc. and Hewlett-Packard Company,alleging infringement of three of Intergraph’s patents. These three patents are a subset of the patents that were the subject of theAlabama lawsuit that Intergraph had filed against Intel. In 2003, Dell filed its answer and counterclaim and named Intel as well asIntergraph in a counterclaim for declaratory judgment.
In March 2004, Intel and Intergraph entered into a second settlement agreement, pursuant to which they agreed to settle the Texaslawsuit, and Intergraph agreed to dismiss Intergraph’s separate pending litigation against Dell Inc. The Texas case and Intergraph’sclaims against Dell in the Eastern District case were dismissed with prejudice. Pursuant to the 2004 settlement agreement, Intel willpay Intergraph a total of $225 million, with $125 million paid in April 2004 and $25 million paid in each of the following fourquarters. Also pursuant to the 2004 settlement agreement, Intergraph granted Dell a license under patents filed prior to April 4, 2012 tosell Dell products, including Dell computer systems that contain Intel microprocessors. The 2004 settlement agreement furtherprovided that Intergraph is entitled to retain the $150 million previously paid by Intel pursuant to the 2002 settlement agreement, butthat no additional $100 million payment would be required under the 2002 settlement agreement. The 2004 settlement agreement alsoincludes additional license rights in favor of Intel and Intel’s customers and a covenant by Intergraph not to sue any Intel customer forproducts that include Intel microprocessors, Intel chipsets and Intel motherboards in combination. As a result of the 2004 settlementagreement, Intel recorded a $162 million charge to cost of sales in the first quarter of 2004. The remaining balance of $63 millionrepresented the value of intellectual property assets acquired as part of the settlement. This balance will be amortized over the assets’remaining useful lives.
In March 2004, MicroUnity, Inc. filed suit against Intel and Dell Inc. in the Eastern District of Texas. MicroUnity claims thatIntel® Pentium® III, Pentium® 4, Pentium® M and Itanium® 2 microprocessors infringe seven MicroUnity patents, and that certainIntel chipsets infringe one MicroUnity patent. MicroUnity also alleges that Dell products that contain these Intel products infringe thesame patents. At Dell’s request, Intel agreed to indemnify Dell with respect to MicroUnity’s claims against Dell, subject to the terms ofa prior agreement between Intel and Dell. MicroUnity seeks an injunction, unspecified damages and attorneys’ fees against both Inteland Dell. Intel disputes MicroUnity’s claims and intends to defend the lawsuit vigorously.
74

INTEL CORPORATIONNOTES TO CONSOLIDATED FINANCIAL STATEMENTS (Continued)
In June 2002, various plaintiffs filed a lawsuit in the Third Judicial Circuit Court, Madison County, Illinois, against Intel,Hewlett-Packard Company, HPDirect, Inc. and Gateway Inc., alleging that the defendants’ advertisements and statements misled thepublic by suppressing and concealing the alleged material fact that systems containing Intel Pentium 4 microprocessors are lesspowerful and slower than systems containing Intel Pentium III microprocessors and a competitor’s microprocessors. In July 2004, theCourt certified against Intel an Illinois-only class of certain end use purchasers of certain Pentium 4 microprocessors or computerscontaining such microprocessors. The Court denied plaintiffs’ motion for reconsideration of this ruling. In January 2005, the Courtgranted a motion filed jointly by the plaintiffs and Intel that stayed the proceedings in the trial court pending discretionary appellatereview of the Court’s class certification order. The plaintiffs and Intel thereafter filed a joint application for discretionary appeal of thetrial court’s class certification ruling. The plaintiffs seek unspecified damages, and attorneys’ fees and costs. Intel disputes theplaintiffs’ claims and intends to defend the lawsuit vigorously.
The company is currently a party to various claims and legal proceedings, including those noted above. If management believesthat a loss arising from these matters is probable and can reasonably be estimated, the company records the amount of the loss, or theminimum estimated liability when the loss is estimated using a range, and no point within the range is more probable than another. Asadditional information becomes available, any potential liability related to these matters is assessed and the estimates are revised, ifnecessary. Based on currently available information, management believes that the ultimate outcome of these matters, individually andin the aggregate, will not have a material adverse effect on the company’s financial position, cash flows or overall trends in results ofoperations. However, litigation is subject to inherent uncertainties, and unfavorable rulings could occur. An unfavorable ruling couldinclude monetary damages or an injunction prohibiting Intel from selling one or more products. If an unfavorable ruling were to occur,there exists the possibility of a material adverse impact on the results of operations of the period in which the ruling occurs, or futureperiods.
Intel has been named to the California and U.S. Superfund lists for three of its sites and has completed, along with two othercompanies, a Remedial Investigation/Feasibility study with the U.S. Environmental Protection Agency (EPA) to evaluate thegroundwater in areas adjacent to one of its former sites. The EPA has issued a Record of Decision with respect to a groundwatercleanup plan at that site, including expected costs to complete. Under the California and U.S. Superfund statutes, liability for cleanupof this site and the adjacent area is joint and several. The company, however, has reached agreement with those same two companieswhich significantly limits the company’s liabilities under the proposed cleanup plan. Also, the company has completed extensivestudies at its other sites and is engaged in cleanup at several of these sites. In the opinion of management, the potential losses to thecompany arising out of these matters would not have a material adverse effect on the company’s financial position or overall trends inresults of operations, even if joint and several liability were to be assessed.
The estimate of the potential impact on the company’s financial position, cash flows or overall results of operations for the abovetax matters and legal and environmental proceedings could change in the future.
Note 19: Operating Segment and Geographic Information
Beginning in 2004, the company combined its communications-related businesses into a single organization, the IntelCommunications Group (ICG). Previously, these communications businesses were in two separate product-line operating segments:the former Intel Communications Group and the Wireless Communications and Computing Group (WCCG). The company nowconsists of two product-line operating segments: the Intel Architecture business, which is composed of the Desktop Platforms Group,the Mobile Platforms Group and the Enterprise Platforms Group; and ICG. All prior-period amounts have been restated to reflect thenew presentation as well as certain minor reorganizations effected during 2004.
The company’s Executive Office consists of Chief Executive Officer (CEO) Craig R. Barrett and President and Chief OperatingOfficer (COO) Paul S. Otellini. The CEO and COO have joint responsibility as the Chief Operating Decision Maker (CODM), asdefined by SFAS No. 131, “Disclosures about Segments of an Enterprise and Related Information.” The CODM allocates resources toand assesses the performance of each operating segment using information about their revenue and operating profit before interest andtaxes.
The Intel Architecture operating segment’s products include microprocessors and related chipsets and motherboards. Net revenuefor the Intel Architecture operating segment made up approximately 85% of the company’s consolidated net revenue in 2004 (87% in2003 and 83% in 2002). Revenue from sales of microprocessors within the Intel Architecture operating segment represented 72% ofconsolidated net revenue in 2004 (73% in 2003 and 70% in 2002). ICG’s products include flash memory, wired and wireless
75

INTEL CORPORATIONNOTES TO CONSOLIDATED FINANCIAL STATEMENTS (Continued)
connectivity products, communications infrastructure components such as network and embedded processors and optical components,microcontrollers, application and cellular processors used in cellular handsets and handheld computing devices, and cellular basebandchipsets. The company’s products in both operating segments are sold directly to original equipment manufacturers, and through retailand industrial distributors as well as reseller channels throughout the world.
In addition to these operating segments, the company has sales and marketing, manufacturing, finance and administration groups.Expenses of these groups are allocated to the operating segments and are included in the operating results reported below.
The “all other” category includes acquisition-related costs, including amortization and any impairments of acquisition-relatedintangibles and goodwill and charges for purchased in-process research and development. In 2003, acquisition-related costs included agoodwill impairment charge of $611 million for the remaining goodwill balance related to the former WCCG, and in 2002 included a$127 million impairment of acquisition-related identified intangibles related to prior-year acquisitions. “All other” also includes theresults of operations of seed businesses that support the company’s initiatives, and the results for 2002 included a charge of $106million related to the wind-down of the Intel Online Services web hosting business. Finally, “all other” includes certain corporate-leveloperating expenses, including a portion of profit-dependent bonus and other expenses not allocated to the operating segments.
The company does not identify or allocate assets by operating segment, and does not allocate depreciation as such to the operatingsegments, nor does the CODM evaluate operating segments on these criteria. Operating segments do not record intersegment revenue,and, accordingly, there is none to be reported. The company does not allocate interest and other income, interest expense or taxes tooperating segments. Although the CODM uses operating income to evaluate the segments, operating costs included in one segmentmay benefit other segments. Except as discussed above, the accounting policies for segment reporting are the same as for the companyas a whole.
In January 2005, the company announced a planned reorganization of its business groups to bring all major product groups in linewith the company’s strategy to drive development of complete technology platforms. These new business units include the MobilityGroup, the Digital Enterprise Group, the Digital Home Group, the Digital Health Group and the Channel Platforms Group. Thisreorganization is expected to become effective in 2005. Because this reporting period is as of December 25, 2004, the operatingsegment information below is presented under the organizational structure that existed as of December 25, 2004.
Net revenue and operating income or loss for operating segments for the three years ended December 25, 2004 were as follows:
(In Millions) 2004 2003 2002
Intel Architecture BusinessNet revenue . . . . . . . . . . . . . . . . . . . . . . . . . . . . . . . . . . . . . . . . . . . . . . . . . . . . . . . . $ 29,167 $ 26,178 $ 22,347Operating income . . . . . . . . . . . . . . . . . . . . . . . . . . . . . . . . . . . . . . . . . . . . . . . . . . . . $ 12,067 $ 10,354 $ 6,498Intel Communications GroupNet revenue . . . . . . . . . . . . . . . . . . . . . . . . . . . . . . . . . . . . . . . . . . . . . . . . . . . . . . . . $ 5,027 $ 3,928 $ 4,288Operating loss . . . . . . . . . . . . . . . . . . . . . . . . . . . . . . . . . . . . . . . . . . . . . . . . . . . . . . $ (791) $ (824) $ (817)All OtherNet revenue . . . . . . . . . . . . . . . . . . . . . . . . . . . . . . . . . . . . . . . . . . . . . . . . . . . . . . . . $ 15 $ 35 $ 129Operating loss . . . . . . . . . . . . . . . . . . . . . . . . . . . . . . . . . . . . . . . . . . . . . . . . . . . . . . $ (1,146) $ (1,997) $ (1,299)TotalNet revenue . . . . . . . . . . . . . . . . . . . . . . . . . . . . . . . . . . . . . . . . . . . . . . . . . . . . . . . . $ 34,209 $ 30,141 $ 26,764Operating income . . . . . . . . . . . . . . . . . . . . . . . . . . . . . . . . . . . . . . . . . . . . . . . . . . . . $ 10,130 $ 7,533 $ 4,382
In 2004, one customer accounted for approximately 19% of the company’s net revenue (19% in 2003 and 16% in 2002) whileanother customer accounted for approximately 16% in 2004 (15% in both 2003 and 2002). A substantial majority of the sales to thesecustomers were products from the Intel Architecture business.
Geographic revenue information for the three years ended December 25, 2004 is based on the location of the customer. Property,plant and equipment information is based on the physical location of the assets at the end of each of the fiscal years.
76

INTEL CORPORATIONNOTES TO CONSOLIDATED FINANCIAL STATEMENTS (Continued)
Revenue from unaffiliated customers by geographic region/country was as follows:
(In Millions) 2004 2003 2002
United States . . . . . . . . . . . . . . . . . . . . . . . . . . . . . . . . . . . . . . . . . . . . . . . . . . . . . . . . . . $ 6,563 $ 7,644 $ 7,698Other Americas† . . . . . . . . . . . . . . . . . . . . . . . . . . . . . . . . . . . . . . . . . . . . . . . . . . . . . . . . 1,402 759 950
7,965 8,403 8,648
Taiwan† . . . . . . . . . . . . . . . . . . . . . . . . . . . . . . . . . . . . . . . . . . . . . . . . . . . . . . . . . . . . . . 5,391 4,405 2,854China† . . . . . . . . . . . . . . . . . . . . . . . . . . . . . . . . . . . . . . . . . . . . . . . . . . . . . . . . . . . . . . . 4,651 3,679 3,199Other Asia-Pacific† . . . . . . . . . . . . . . . . . . . . . . . . . . . . . . . . . . . . . . . . . . . . . . . . . . . . . 5,338 4,077 4,020
15,380 12,161 10,073
Europe† . . . . . . . . . . . . . . . . . . . . . . . . . . . . . . . . . . . . . . . . . . . . . . . . . . . . . . . . . . . . . . 7,755 6,868 6,139
Japan† . . . . . . . . . . . . . . . . . . . . . . . . . . . . . . . . . . . . . . . . . . . . . . . . . . . . . . . . . . . . . . . . 3,109 2,709 1,904
Total revenue . . . . . . . . . . . . . . . . . . . . . . . . . . . . . . . . . . . . . . . . . . . . . . . . . . . . . . . $34,209 $30,141 $26,764
† Revenue from unaffiliated customers outside the U.S. totaled $27,646 million in 2004 ($22,497 million in 2003 and$19,066 million in 2002).
Net property, plant and equipment by country was as follows:
(In Millions) 2004 2003 2002
United States . . . . . . . . . . . . . . . . . . . . . . . . . . . . . . . . . . . . . . . . . . . . . . . . . . . . . . . . . . $11,265 $12,483 $14,518Ireland† . . . . . . . . . . . . . . . . . . . . . . . . . . . . . . . . . . . . . . . . . . . . . . . . . . . . . . . . . . . . . . 2,365 2,392 1,405Other countries† . . . . . . . . . . . . . . . . . . . . . . . . . . . . . . . . . . . . . . . . . . . . . . . . . . . . . . . . 2,138 1,786 1,924
Total property, plant and equipment, net . . . . . . . . . . . . . . . . . . . . . . . . . . . . . . . . $15,768 $16,661 $17,847
† Net property, plant and equipment outside the U.S. totaled $4,503 million in 2004 ($4,178 million in 2003 and $3,329million in 2002).
77

REPORT OF ERNST & YOUNG LLP, INDEPENDENT REGISTERED PUBLIC ACCOUNTING FIRM
The Board of Directors and Stockholders, Intel Corporation
We have audited the accompanying consolidated balance sheets of Intel Corporation as of December 25, 2004 and December 27,2003, and the related consolidated statements of income, stockholders’ equity, and cash flows for each of the three years in the periodended December 25, 2004. Our audits also included the financial statement schedule listed in the Index at Part IV, Item 15. Thesefinancial statements and schedule are the responsibility of the company’s management. Our responsibility is to express an opinion onthese financial statements and schedule based on our audits.
We conducted our audits in accordance with the standards of the Public Company Accounting Oversight Board (United States).Those standards require that we plan and perform the audit to obtain reasonable assurance about whether the financial statements arefree of material misstatement. An audit includes examining, on a test basis, evidence supporting the amounts and disclosures in thefinancial statements. An audit also includes assessing the accounting principles used and significant estimates made by management, aswell as evaluating the overall financial statement presentation. We believe that our audits provide a reasonable basis for our opinion.
In our opinion, the consolidated financial statements referred to above present fairly, in all material respects, the consolidatedfinancial position of Intel Corporation at December 25, 2004 and December 27, 2003, and the consolidated results of their operationsand their cash flows for each of the three years in the period ended December 25, 2004, in conformity with accounting principlesgenerally accepted in the United States. Also, in our opinion, the related financial statement schedule, when considered in relation tothe basic financial statements taken as a whole, presents fairly in all material respects the information set forth therein.
We also have audited, in accordance with the standards of the Public Company Accounting Oversight Board (United States), theeffectiveness of Intel Corporation’s internal control over financial reporting as of December 25, 2004, based on criteria established inInternal Control—Integrated Framework issued by the Committee of Sponsoring Organizations of the Treadway Commission and ourreport dated February 15, 2005 expressed an unqualified opinion thereon.
San Jose, CaliforniaFebruary 15, 2005
78

REPORT OF ERNST & YOUNG LLP, INDEPENDENT REGISTERED PUBLIC ACCOUNTING FIRM
The Board of Directors and Stockholders, Intel Corporation
We have audited management’s assessment, included in the accompanying Management Report on Internal Control OverFinancial Reporting, that Intel Corporation maintained effective internal control over financial reporting as of December 25, 2004,based on criteria established in Internal Control—Integrated Framework issued by the Committee of Sponsoring Organizations of theTreadway Commission (the COSO criteria). Intel Corporation’s management is responsible for maintaining effective internal controlover financial reporting and for its assessment of the effectiveness of internal control over financial reporting. Our responsibility is toexpress an opinion on management’s assessment and an opinion on the effectiveness of the company’s internal control over financialreporting based on our audit.
We conducted our audit in accordance with the standards of the Public Company Accounting Oversight Board (United States).Those standards require that we plan and perform the audit to obtain reasonable assurance about whether effective internal control overfinancial reporting was maintained in all material respects. Our audit included obtaining an understanding of internal control overfinancial reporting, evaluating management’s assessment, testing and evaluating the design and operating effectiveness of internalcontrol, and performing such other procedures as we considered necessary in the circumstances. We believe that our audit provides areasonable basis for our opinion.
A company’s internal control over financial reporting is a process designed to provide reasonable assurance regarding thereliability of financial reporting and the preparation of financial statements for external purposes in accordance with generally acceptedaccounting principles. A company’s internal control over financial reporting includes those policies and procedures that (1) pertain tothe maintenance of records that, in reasonable detail, accurately and fairly reflect the transactions and dispositions of the assets of thecompany; (2) provide reasonable assurance that transactions are recorded as necessary to permit preparation of financial statements inaccordance with generally accepted accounting principles, and that receipts and expenditures of the company are being made only inaccordance with authorizations of management and directors of the company; and (3) provide reasonable assurance regardingprevention or timely detection of unauthorized acquisition, use, or disposition of the company’s assets that could have a material effecton the financial statements.
Because of its inherent limitations, internal control over financial reporting may not prevent or detect misstatements. Also,projections of any evaluation of effectiveness to future periods are subject to the risk that controls may become inadequate because ofchanges in conditions, or that the degree of compliance with the policies or procedures may deteriorate.
In our opinion, management’s assessment that Intel Corporation maintained effective internal control over financial reporting asof December 25, 2004, is fairly stated, in all material respects, based on the COSO criteria. Also, in our opinion, Intel Corporationmaintained, in all material respects, effective internal control over financial reporting as of December 25, 2004, based on the COSOcriteria.
We also have audited, in accordance with the standards of the Public Company Accounting Oversight Board (United States), the2004 consolidated financial statements of Intel Corporation and our report dated February 15, 2005 expressed an unqualified opinionthereon.
San Jose, CaliforniaFebruary 15, 2005
79

INTEL CORPORATIONFINANCIAL INFORMATION BY QUARTER (UNAUDITED)
(In Millions—Except Per Share Amounts)2004 For Quarter Ended December 25 September 25 June 26 March 27
Net revenue . . . . . . . . . . . . . . . . . . . . . . . . . . . . . . . . . . . . . . . . . . . . . . . . . . . $ 9,598 $ 8,471 $ 8,049 $ 8,091Gross margin . . . . . . . . . . . . . . . . . . . . . . . . . . . . . . . . . . . . . . . . . . . . . . . . . . $ 5,377 $ 4,719 $ 4,780 $ 4,870Net income1 . . . . . . . . . . . . . . . . . . . . . . . . . . . . . . . . . . . . . . . . . . . . . . . . . . . $ 2,123 $ 1,906 $ 1,757 $ 1,730Basic earnings per share1 . . . . . . . . . . . . . . . . . . . . . . . . . . . . . . . . . . . . . . . . . $ 0.34 $ 0.30 $ 0.27 $ 0.27Diluted earnings per share1 . . . . . . . . . . . . . . . . . . . . . . . . . . . . . . . . . . . . . . . $ 0.33 $ 0.30 $ 0.27 $ 0.26Dividends per share
Declared . . . . . . . . . . . . . . . . . . . . . . . . . . . . . . . . . . . . . . . . . . . . . . . . . . . $ — $ 0.08 $ — $ 0.08Paid . . . . . . . . . . . . . . . . . . . . . . . . . . . . . . . . . . . . . . . . . . . . . . . . . . . . . . . $ 0.04 $ 0.04 $ 0.04 $ 0.04
Market price range common stock2
High . . . . . . . . . . . . . . . . . . . . . . . . . . . . . . . . . . . . . . . . . . . . . . . . . . . . . . $ 24.80 $ 27.60 $ 28.99 $ 34.24Low . . . . . . . . . . . . . . . . . . . . . . . . . . . . . . . . . . . . . . . . . . . . . . . . . . . . . . . $ 19.68 $ 19.72 $ 25.73 $ 26.16
(In Millions—Except Per Share Amounts)2003 For Quarter Ended December 27 September 27 June 28 March 29
Net revenue . . . . . . . . . . . . . . . . . . . . . . . . . . . . . . . . . . . . . . . . . . . . . . . . . . . $ 8,741 $ 7,833 $ 6,816 $ 6,751Gross margin . . . . . . . . . . . . . . . . . . . . . . . . . . . . . . . . . . . . . . . . . . . . . . . . . . $ 5,556 $ 4,558 $ 3,468 $ 3,512Impairment of goodwill . . . . . . . . . . . . . . . . . . . . . . . . . . . . . . . . . . . . . . . . . . $ 611 $ — $ 6 $ —Net income3 . . . . . . . . . . . . . . . . . . . . . . . . . . . . . . . . . . . . . . . . . . . . . . . . . . . $ 2,173 $ 1,657 $ 896 $ 915Basic earnings per share3 . . . . . . . . . . . . . . . . . . . . . . . . . . . . . . . . . . . . . . . . . $ 0.33 $ 0.25 $ 0.14 $ 0.14Diluted earnings per share3 . . . . . . . . . . . . . . . . . . . . . . . . . . . . . . . . . . . . . . . $ 0.33 $ 0.25 $ 0.14 $ 0.14Dividends per share
Declared . . . . . . . . . . . . . . . . . . . . . . . . . . . . . . . . . . . . . . . . . . . . . . . . . . . $ — $ 0.04 $ — $ 0.04Paid . . . . . . . . . . . . . . . . . . . . . . . . . . . . . . . . . . . . . . . . . . . . . . . . . . . . . . . $ 0.02 $ 0.02 $ 0.02 $ 0.02
Market price range common stock2
High . . . . . . . . . . . . . . . . . . . . . . . . . . . . . . . . . . . . . . . . . . . . . . . . . . . . . . $ 34.12 $ 29.18 $ 22.14 $ 18.90Low . . . . . . . . . . . . . . . . . . . . . . . . . . . . . . . . . . . . . . . . . . . . . . . . . . . . . . . $ 27.52 $ 20.81 $ 16.28 $ 15.05
1 Net income for the quarter ended September 25, 2004 included $195 million in tax benefits related to export sales and state taxbenefits for divestitures that exceeded the amounts originally estimated in connection with the 2003 provision, increasing both basicand diluted earnings per share by $0.03. Net income for the quarter ended June 26, 2004 included $62 million in tax benefits relatedto the reversal of previously accrued taxes related primarily to the closing of a state income tax audit, increasing both basic anddiluted earnings per share by $0.01.
2 Intel’s common stock (symbol INTC) trades on The NASDAQ Stock Market* and is quoted in the Wall Street Journal and othernewspapers. Intel’s common stock also trades on The Swiss Exchange. At December 25, 2004, there were approximately 230,000registered holders of common stock. All stock prices are closing prices per The NASDAQ Stock Market.
3 Net income for the quarter ended December 27, 2003 included $620 million in tax benefits related to divestitures, increasing bothbasic and diluted earnings per share by $0.09.
80

ITEM 9. CHANGES IN AND DISAGREEMENTS WITH ACCOUNTANTS ON ACCOUNTING AND FINANCIALDISCLOSURE
Not applicable.
ITEM 9A. CONTROLS AND PROCEDURES
Attached as exhibits to this Form 10-K are certifications of Intel’s Chief Executive Officer (CEO) and Chief Financial Officer(CFO), which are required in accordance with Rule 13a-14 of the Securities Exchange Act of 1934, as amended (the Exchange Act).This “Controls and Procedures” section includes information concerning the controls and controls evaluation referred to in thecertifications. Part II, Item 8 of this Form 10-K sets forth the report of Ernst & Young LLP, our independent registered publicaccounting firm, regarding its audit of Intel’s internal control over financial reporting and of management’s assessment of internalcontrol over financial reporting set forth below in this section. This section should be read in conjunction with the certifications and theErnst & Young report for a more complete understanding of the topics presented.
Evaluation of Disclosure Controls and Procedures
We conducted an evaluation of the effectiveness of the design and operation of our “disclosure controls and procedures”(Disclosure Controls) as of the end of the period covered by this Form 10-K. The controls evaluation was conducted under thesupervision and with the participation of management, including our CEO and CFO. Disclosure Controls are controls and proceduresdesigned to reasonably assure that information required to be disclosed in our reports filed under the Exchange Act, such as this Form10-K, is recorded, processed, summarized and reported within the time periods specified in the U.S. Securities and ExchangeCommission’s (SEC’s) rules and forms. Disclosure Controls are also designed to reasonably assure that such information isaccumulated and communicated to our management, including the CEO and CFO, as appropriate to allow timely decisions regardingrequired disclosure. Our quarterly evaluation of Disclosure Controls includes an evaluation of some components of our internal controlover financial reporting, and internal control over financial reporting is also separately evaluated on an annual basis for purposes ofproviding the management report which is set forth below.
The evaluation of our Disclosure Controls included a review of the controls’ objectives and design, the company’simplementation of the controls and the effect of the controls on the information generated for use in this Form 10-K. In the course ofthe controls evaluation, we reviewed identified data errors, control problems or acts of fraud and sought to confirm that appropriatecorrective actions, including process improvements, were being undertaken. This type of evaluation is performed on a quarterly basisso that the conclusions of management, including the CEO and CFO, concerning the effectiveness of the Disclosure Controls can bereported in our periodic reports on Form 10-Q and Form 10-K. Many of the components of our Disclosure Controls are also evaluatedon an ongoing basis by our Internal Audit Department and by other personnel in our Finance and Enterprise Services organization. Theoverall goals of these various evaluation activities are to monitor our Disclosure Controls, and to modify them as necessary. Our intentis to maintain the Disclosure Controls as dynamic systems that change as conditions warrant.
Based upon the controls evaluation, our CEO and CFO have concluded that, subject to the limitations noted in this Part II,Item 9A, as of the end of the period covered by this Form 10-K, our Disclosure Controls were effective to provide reasonableassurance that information required to be disclosed in our Exchange Act reports is recorded, processed, summarized and reportedwithin the time periods specified by the SEC, and that material information relating to Intel and its consolidated subsidiaries is madeknown to management, including the CEO and CFO, particularly during the period when our periodic reports are being prepared.
Management Report on Internal Control Over Financial Reporting
Our management is responsible for establishing and maintaining adequate internal control over financial reporting to providereasonable assurance regarding the reliability of our financial reporting and the preparation of financial statements for externalpurposes in accordance with generally accepted accounting principles. Internal control over financial reporting includes those policiesand procedures that (i) pertain to the maintenance of records that in reasonable detail accurately and fairly reflect the transactions anddispositions of the assets of the company; (ii) provide reasonable assurance that transactions are recorded as necessary to permitpreparation of financial statements in accordance with generally accepted accounting principles, and that receipts and expenditures ofthe company are being made only in accordance with authorizations of management and directors of the company; and (iii) providereasonable assurance regarding prevention or timely detection of unauthorized acquisition, use or disposition of the company’s assetsthat could have a material effect on the financial statements.
Management assessed our internal control over financial reporting as of December 25, 2004, the end of our fiscal year.Management based its assessment on criteria established in Internal Control–Integrated Framework issued by the Committee of
81
Sponsoring Organizations of the Treadway Commission. Management’s assessment included evaluation of such elements as the designand operating effectiveness of key financial reporting controls, process documentation, accounting policies, and our overall controlenvironment. This assessment is supported by testing and monitoring performed both by our Internal Audit organization and ourFinance and Enterprise Services organization.
Based on our assessment, management has concluded that our internal control over financial reporting was effective as of the endof the fiscal year to provide reasonable assurance regarding the reliability of financial reporting and the preparation of financialstatements for external reporting purposes in accordance with generally accepted accounting principles. We reviewed the results ofmanagement’s assessment with the Audit Committee of our Board of Directors.
Our independent registered public accounting firm, Ernst & Young LLP, audited management’s assessment and independentlyassessed the effectiveness of the company’s internal control over financial reporting. Ernst & Young has issued an attestation reportconcurring with management’s assessment, which is included at the end of Part II, Item 8 of this Form 10-K.
Inherent Limitations on Effectiveness of Controls
The company’s management, including the CEO and CFO, does not expect that our Disclosure Controls or our internal controlover financial reporting will prevent or detect all error and all fraud. A control system, no matter how well designed and operated, canprovide only reasonable, not absolute, assurance that the control system’s objectives will be met. The design of a control system mustreflect the fact that there are resource constraints, and the benefits of controls must be considered relative to their costs. Further,because of the inherent limitations in all control systems, no evaluation of controls can provide absolute assurance that misstatementsdue to error or fraud will not occur or that all control issues and instances of fraud, if any, within the company have been detected.These inherent limitations include the realities that judgments in decision-making can be faulty and that breakdowns can occur becauseof simple error or mistake. Controls can also be circumvented by the individual acts of some persons, by collusion of two or morepeople, or by management override of the controls. The design of any system of controls is based in part on certain assumptions aboutthe likelihood of future events, and there can be no assurance that any design will succeed in achieving its stated goals under allpotential future conditions. Projections of any evaluation of controls effectiveness to future periods are subject to risks. Over time,controls may become inadequate because of changes in conditions or deterioration in the degree of compliance with policies orprocedures.
ITEM 9B. OTHER INFORMATION
None.
82

PART III
ITEM 10. DIRECTORS AND EXECUTIVE OFFICERS OF THE REGISTRANT
The information regarding Directors and Executive Officers appearing under the headings “Proposal 1: Election of Directors” and“Other Matters—Section 16(a) Beneficial Ownership Reporting Compliance” of our 2005 Proxy Statement is incorporated byreference in this section. The information under the heading “Executive Officers of the Registrant” in Part I, Item 1 of this Form 10-Kis also incorporated by reference in this section. In addition, the information included under the heading “Corporate Governance” inPart I, Item 1 of this Form 10-K identifying the “audit committee financial expert” who serves on the Audit Committee of our Board ofDirectors and the process by which stockholders may recommend candidates for the Board of Directors to the Corporate Governanceand Nominating Committee is incorporated by reference in this section. There were no changes to the process by which stockholdersmay recommend candidates for the Board of Directors during 2004.
Intel has, for many years, maintained a set of Corporate Business Principles which incorporate our code of ethics applicable to allemployees, including all officers, and including our independent directors, who are not employees of the company, with regard to theirIntel-related activities. The Corporate Business Principles incorporate our guidelines designed to deter wrongdoing and to promotehonest and ethical conduct and compliance with applicable laws and regulations. They also incorporate our expectations of ouremployees that enable us to provide accurate and timely disclosure in our filings with the Securities and Exchange Commission andother public communications. In addition, they incorporate Intel guidelines pertaining to topics such as environmental, health andsafety compliance; diversity and non-discrimination; supplier expectations; privacy; and business continuity.
The full text of our Corporate Business Principles is published on our Investor Relations web site at www.intc.com. We intend todisclose future amendments to certain provisions of our Corporate Business Principles, or waivers of such provisions granted toexecutive officers and directors, on this web site within four business days following the date of such amendment or waiver.
ITEM 11. EXECUTIVE COMPENSATION
The information appearing under the headings “Directors’ Compensation,” “Employment Contracts and Change of ControlArrangements,” “Report of the Compensation Committee on Executive Compensation,” “Stock Price Performance Graph,”“Compensation Committee Interlocks and Insider Participation” and “Executive Compensation” of the 2005 Proxy Statement isincorporated by reference.
ITEM 12. SECURITY OWNERSHIP OF CERTAIN BENEFICIAL OWNERS AND MANAGEMENT AND RELATEDSTOCKHOLDER MATTERS
The information appearing in our 2005 Proxy Statement under the heading “Security Ownership of Certain Beneficial Ownersand Management” is incorporated by reference.
See “Employee Equity Incentive Plans” in Part II, Item 7 of this Form 10-K regarding shares authorized for issuance under equitycompensation plans approved by stockholders and not approved by stockholders. For descriptions of our equity incentive plans, see“Employee Equity Incentive Plans” in Part II, Item 7 and “Note 11: Employee Equity Incentive Plans” in Part II, Item 8 of this Form10-K.
ITEM 13. CERTAIN RELATIONSHIPS AND RELATED TRANSACTIONS
The information appearing in our 2005 Proxy Statement under the heading “Certain Relationships and Related Transactions” isincorporated by reference.
ITEM 14. PRINCIPAL ACCOUNTANT FEES AND SERVICES
The information appearing in our 2005 Proxy Statement under the headings “Report of the Audit Committee” and “Ratification ofSelection of Independent Registered Public Accounting Firm” is incorporated by reference.
83

PART IV
ITEM 15. EXHIBITS AND FINANCIAL STATEMENT SCHEDULES
1. Financial Statements: See “Index to Consolidated Financial Statements” in Part II, Item 8 on page 45 of this Form 10-K.
2. Financial Statement Schedule: See “Schedule II—Valuation and Qualifying Accounts” on page 85 of this Form 10-K.
3. Exhibits: The exhibits listed in the accompanying index to exhibits are filed or incorporated by reference as part of thisForm 10-K.
Intel, the Intel logo, Intel Inside, Celeron, Intel Centrino, Intel SpeedStep, Intel StrataFlash, Intel Xeon, Intel XScale, Itanium, MMXand Pentium are trademarks or registered trademarks of Intel Corporation or its subsidiaries in the United States and other countries.*Other names and brands may be claimed as the property of others.
84

INTEL CORPORATIONSCHEDULE II—VALUATION AND QUALIFYING ACCOUNTS
December 25, 2004, December 27, 2003 and December 28, 2002(In Millions)
Balance atBeginning of
Year
AdditionsCharged toCosts andExpenses Deductions
Balance atEnd of Year
Allowance for doubtful receivables†
2004 . . . . . . . . . . . . . . . . . . . . . . . . . . . . . . . . . . . . . . . . . . . . . . . . . . . . . . . . . $ 55 $ 4 $ 16 $ 432003 . . . . . . . . . . . . . . . . . . . . . . . . . . . . . . . . . . . . . . . . . . . . . . . . . . . . . . . . . $ 57 $ 14 $ 16 $ 552002 . . . . . . . . . . . . . . . . . . . . . . . . . . . . . . . . . . . . . . . . . . . . . . . . . . . . . . . . . $ 68 $ 10 $ 21 $ 57
Valuation allowance for deferred tax asset2004 . . . . . . . . . . . . . . . . . . . . . . . . . . . . . . . . . . . . . . . . . . . . . . . . . . . . . . . . . $ — $ 75 $ — $ 752003 . . . . . . . . . . . . . . . . . . . . . . . . . . . . . . . . . . . . . . . . . . . . . . . . . . . . . . . . . $ — $ — $ — $ —2002 . . . . . . . . . . . . . . . . . . . . . . . . . . . . . . . . . . . . . . . . . . . . . . . . . . . . . . . . . $ — $ — $ — $ —
† Deductions represent uncollectible accounts written off, net of recoveries.
85

INDEX TO EXHIBITS
Incorporated by Reference
ExhibitNumber Exhibit Description Form File Number Exhibit
FilingDate
FiledHerewith
3.1 Intel Corporation Second Restated Certificate of Incorporation filedMarch 13, 2003
10-Q 000-06217 3.1 5/7/03
3.2 Intel Corporation Bylaws as amended on November 10, 2004 8-K 000-06217 3.1 11/15/04
10.1** Intel Corporation 2004 Equity Incentive Plan, effective May 19, 2004 10-Q 000-06217 10.3 8/2/04
10.2** Standard Terms and Conditions Relating to Non-Qualified StockOptions granted to U.S. employees on and after May 19, 2004 under theIntel Corporation 2004 Equity Incentive Plan
10-Q 000-06217 10.5 8/2/04
10.3** Notice of Grant of Non-Qualified Stock Option under the IntelCorporation 2004 Equity Incentive Plan
10-Q 000-06217 10.7 8/2/04
10.4** Standard International Non-Qualified Stock Option Agreement under theIntel Corporation 2004 Equity Incentive Plan
10-Q 000-06217 10.6 8/2/04
10.5** Intel Corporation Non-Employee Director Non-Qualified Stock OptionAgreement under the Intel Corporation 2004 Equity Incentive Plan
10-Q 000-06217 10.4 8/2/04
10.6** Form of ELTSOP Non-Qualified Stock Option Agreement under theIntel Corporation 2004 Equity Incentive Plan
8-K 000-06217 10.1 10/12/04
10.7 Intel Corporation 1997 Stock Option Plan, as amended and restatedeffective July 16, 1997
10-K 000-06217 10.7 3/11/03
10.8** Intel Corporation 1988 Executive Long Term Stock Option Plan, asamended and restated effective July 16, 1997
10-Q 333-45395 10.2 8/11/98
10.9** Intel Corporation 1984 Stock Option Plan, as amended and restatedeffective July 16, 1997
10-Q 333-45395 10.1 8/11/98
10.10** Intel Corporation Executive Officer Incentive Plan, as amended andrestated effective January 1, 2004
10-K 000-06217 10.7 2/23/04
10.11** Description of Bonus Terms under the Executive Officer Incentive Plan 10-Q 000-06217 10.2 8/2/04
10.12** Intel Corporation Deferral Plan for Outside Directors, effective July 1,1998
10-K 333-45395 10.6 3/26/99
10.13** Intel Corporation Special Deferred Compensation Plan S-8 333-45395 4.1 2/2/98
10.14** Intel Corporation Sheltered Employee Retirement Plan Plus, as amendedand restated effective July 15, 1996
S-8 033-63489 4.1.1 7/17/96
10.15** Form of Indemnification Agreement with Directors and ExecutiveOfficers
X
12.1 Statement Setting Forth the Computation of Ratios of Earnings to FixedCharges
X
21.1 Intel subsidiaries X
23.1 Consent of Ernst & Young LLP, Independent Registered PublicAccounting Firm
X
31.1 Certification of Chief Executive Officer Pursuant to Rule 13a-14(a) ofthe Securities Exchange Act of 1934, as amended (the Exchange Act)
X
31.2 Certification of Chief Financial Officer and Principal AccountingOfficer Pursuant to Rule 13a-14(a) of the Exchange Act
X
86

Incorporated by Reference
ExhibitNumber Exhibit Description Form File Number Exhibit
FilingDate
FiledHerewith
32.1 Certification of the Chief Executive Officer and the Chief FinancialOfficer and Principal Accounting Officer Pursuant to Rule 13a-14(b) ofthe Exchange Act and 18 U.S.C. Section 1350, as Adopted Pursuant toSection 906 of the Sarbanes-Oxley Act of 2002
X
**Compensation plans or arrangements in which directors or executive officers are eligible to participate.
87
SIGNATURES
Pursuant to the requirements of Section 13 or 15(d) of the Securities Exchange Act of 1934, the Registrant has duly caused thisreport to be signed on its behalf by the undersigned, thereunto duly authorized.
INTEL CORPORATIONRegistrant
By: /s/ ANDY D. BRYANT
Andy D. BryantExecutive Vice President, Chief Financial Officerand Principal Accounting OfficerFebruary 18, 2005
Pursuant to the requirements of the Securities Exchange Act of 1934, this report has been signed below by the following personson behalf of the Registrant and in the capacities and on the dates indicated.
/s/ CRAIG R. BARRETT /s/ REED E. HUNDT
Craig R. BarrettChief Executive Officer, Director andPrincipal Executive OfficerFebruary 18, 2005
Reed E. HundtDirectorFebruary 18, 2005
/s/ CHARLENE BARSHEFSKY /s/ PAUL S. OTELLINI
Charlene BarshefskyDirectorFebruary 18, 2005
Paul S. OtelliniPresident, Chief Operating Officer and DirectorFebruary 18, 2005
/s/ E. JOHN P. BROWNE /s/ DAVID S. POTTRUCK
E. John P. BrowneDirectorFebruary 18, 2005
David S. PottruckDirectorFebruary 18, 2005
/s/ ANDY D. BRYANT /s/ JANE E. SHAW
Andy D. BryantExecutive Vice President, Chief Financial Officer andPrincipal Accounting OfficerFebruary 18, 2005
Jane E. ShawDirectorFebruary 18, 2005
/s/ ANDREW S. GROVE /s/ JOHN L. THORNTON
Andrew S. GroveChairman of the Board and DirectorFebruary 18, 2005
John L. ThorntonDirectorFebruary 18, 2005
/s/ D. JAMES GUZY /s/ DAVID B. YOFFIE
D. James GuzyDirectorFebruary 18, 2005
David B. YoffieDirectorFebruary 18, 2005
88

Exhibit 31.1
The following certification includes references to an evaluation of the effectiveness of the design and operation of the company’s“disclosure controls and procedures” and to certain matters related to the company’s “internal control over financial reporting.”Item 9A of Part II of this Form 10-K presents the conclusions of the CEO and the CFO about the effectiveness of the company’sdisclosure controls and procedures and internal control over financial reporting based on and as of the date of management’sevaluations of such controls (relating to Item 4 of the certification), and contains additional information concerning disclosures to thecompany’s Audit Committee and independent auditors with regard to deficiencies in internal control over financial reporting and fraudand related matters (Item 5 of the certification).
CERTIFICATION
I, Craig R. Barrett, certify that:
1. I have reviewed this annual report on Form 10-K of Intel Corporation;
2. Based on my knowledge, this report does not contain any untrue statement of a material fact or omit to state a material factnecessary to make the statements made, in light of the circumstances under which such statements were made, not misleadingwith respect to the period covered by this report;
3. Based on my knowledge, the financial statements, and other financial information included in this report, fairly present in allmaterial respects the financial condition, results of operations and cash flows of the registrant as of, and for, the periods presentedin this report;
4. The registrant’s other certifying officer(s) and I are responsible for establishing and maintaining disclosure controls andprocedures (as defined in Exchange Act Rules 13a-15(e) and 15d-15(e)) and internal control over financial reporting (as definedin Exchange Act Rules 13a-15(f) and 15d-15(f)) for the registrant and have:
a) Designed such disclosure controls and procedures, or caused such disclosure controls and procedures to be designed underour supervision, to ensure that material information relating to the registrant, including its consolidated subsidiaries, is madeknown to us by others within those entities, particularly during the period in which this report is being prepared;
b) Designed such internal control over financial reporting, or caused such internal control over financial reporting to bedesigned under our supervision, to provide reasonable assurance regarding the reliability of financial reporting and thepreparation of financial statements for external purposes in accordance with generally accepted accounting principles;
c) Evaluated the effectiveness of the registrant’s disclosure controls and procedures and presented in this report our conclusionsabout the effectiveness of the disclosure controls and procedures, as of the end of the period covered by this report based onsuch evaluation; and
d) Disclosed in this report any change in the registrant’s internal control over financial reporting that occurred during theregistrant’s most recent fiscal quarter (the registrant’s fourth fiscal quarter in the case of an annual report) that has materiallyaffected, or is reasonably likely to materially affect, the registrant’s internal control over financial reporting; and
5. The registrant’s other certifying officer(s) and I have disclosed, based on our most recent evaluation of internal control overfinancial reporting, to the registrant’s auditors and the audit committee of the registrant’s board of directors (or personsperforming the equivalent functions):
a) All significant deficiencies and material weaknesses in the design or operation of internal control over financial reportingwhich are reasonably likely to adversely affect the registrant’s ability to record, process, summarize and report financialinformation; and
b) Any fraud, whether or not material, that involves management or other employees who have a significant role in theregistrant’s internal control over financial reporting.
Date: February 18, 2005 By: /s/ CRAIG R. BARRETT
Craig R. BarrettChief Executive Officer
89

Exhibit 31.2
The following certification includes references to an evaluation of the effectiveness of the design and operation of the company’s“disclosure controls and procedures” and to certain matters related to the company’s “internal control over financial reporting.”Item 9A of Part II of this Form 10-K presents the conclusions of the CEO and the CFO about the effectiveness of the company’sdisclosure controls and procedures and internal control over financial reporting based on and as of the date of management’sevaluations of such controls (relating to Item 4 of the certification), and contains additional information concerning disclosures to thecompany’s Audit Committee and independent auditors with regard to deficiencies in internal control over financial reporting and fraudand related matters (Item 5 of the certification).
CERTIFICATION
I, Andy D. Bryant, certify that:
1. I have reviewed this annual report on Form 10-K of Intel Corporation;
2. Based on my knowledge, this report does not contain any untrue statement of a material fact or omit to state a material factnecessary to make the statements made, in light of the circumstances under which such statements were made, not misleadingwith respect to the period covered by this report;
3. Based on my knowledge, the financial statements, and other financial information included in this report, fairly present in allmaterial respects the financial condition, results of operations and cash flows of the registrant as of, and for, the periods presentedin this report;
4. The registrant’s other certifying officer(s) and I are responsible for establishing and maintaining disclosure controls andprocedures (as defined in Exchange Act Rules 13a-15(e) and 15d-15(e)) and internal control over financial reporting (as definedin Exchange Act Rules 13a-15(f) and 15d-15(f)) for the registrant and have:
a) Designed such disclosure controls and procedures, or caused such disclosure controls and procedures to be designed underour supervision, to ensure that material information relating to the registrant, including its consolidated subsidiaries, is madeknown to us by others within those entities, particularly during the period in which this report is being prepared;
b) Designed such internal control over financial reporting, or caused such internal control over financial reporting to bedesigned under our supervision, to provide reasonable assurance regarding the reliability of financial reporting and thepreparation of financial statements for external purposes in accordance with generally accepted accounting principles;
c) Evaluated the effectiveness of the registrant’s disclosure controls and procedures and presented in this report our conclusionsabout the effectiveness of the disclosure controls and procedures, as of the end of the period covered by this report based onsuch evaluation; and
d) Disclosed in this report any change in the registrant’s internal control over financial reporting that occurred during theregistrant’s most recent fiscal quarter (the registrant’s fourth fiscal quarter in the case of an annual report) that has materiallyaffected, or is reasonably likely to materially affect, the registrant’s internal control over financial reporting; and
5. The registrant’s other certifying officer(s) and I have disclosed, based on our most recent evaluation of internal control overfinancial reporting, to the registrant’s auditors and the audit committee of the registrant’s board of directors (or personsperforming the equivalent functions):
a) All significant deficiencies and material weaknesses in the design or operation of internal control over financial reportingwhich are reasonably likely to adversely affect the registrant’s ability to record, process, summarize and report financialinformation; and
b) Any fraud, whether or not material, that involves management or other employees who have a significant role in theregistrant’s internal control over financial reporting.
Date: February 18, 2005 By: /s/ ANDY D. BRYANT
Andy D. BryantExecutive Vice President, Chief Financial Officer andPrincipal Accounting Officer
90

Exhibit 32.1
CERTIFICATION
Each of the undersigned hereby certifies, for the purposes of section 1350 of chapter 63 of title 18 of the United States Code, asadopted pursuant to Section 906 of the Sarbanes-Oxley Act of 2002, in his capacity as an officer of Intel Corporation (Intel), that, to hisknowledge, the Annual Report of Intel on Form 10-K for the period ended December 25, 2004, fully complies with the requirements ofSection 13(a) of the Securities Exchange Act of 1934 and that the information contained in such report fairly presents, in all materialrespects, the financial condition and results of operation of Intel. This written statement is being furnished to the Securities andExchange Commission as an exhibit to such Form 10-K. A signed original of this statement has been provided to Intel and will beretained by Intel and furnished to the Securities and Exchange Commission or its staff upon request.
Date: February 18, 2005 By: /s/ CRAIG R. BARRETT
Craig R. BarrettChief Executive Officer
Date: February 18, 2005 By: /s/ ANDY D. BRYANT
Andy D. BryantExecutive Vice President, Chief Financial Officerand Principal Accounting Officer
91

(You are leaving the Form 10-K and continuing to the Corporate Directory.)

Corporate Directory**
BOARD OFDIRECTORSAndrew S. GroveChairman of the Board
Craig R. Barrett 4
Chief Executive Officer
AmbassadorCharlene Barshefsky 5
Senior International PartnerWilmer Cutler PickeringHale and Dorr LLP
E. John P. Browne 1 2
Group Chief ExecutiveBP plcAn integrated oil company
D. James Guzy 1 3†
ChairmanArbor CompanyA limited partnership
Reed E. Hundt 2† 3
PrincipalCharles Ross PartnersPrivate investor andbusiness advisory services
Paul S. Otellini 4
President andChief Operating Officer
David S. Pottruck 2
Managing DirectorThe Pottruck GroupA private equity firm
Jane E. Shaw 1† 3
Chairman andChief Executive OfficerAerogen, Inc.An emerging specialtypharmaceutical company
John L. Thornton 5†
Professor andDirector of Global LeadershipTsinghua University (Beijing)
David B. Yoffie 3† 4† 5 6
Max and Doris StarrProfessor of InternationalBusiness AdministrationHarvard Business School
DIRECTOREMERITUSGordon E. MooreChairman Emeritus
1 Member of Audit Committee2 Member of Compensation
Committee3 Member of Corporate
Governance andNominating Committee
4 Member of ExecutiveCommittee
5 Member of FinanceCommittee
6 Lead Independent Director† Committee Chairman
**As of February 18, 2005
CORPORATEOFFICERSAndrew S. GroveChairman of the Board
Craig R. BarrettChief Executive Officer
Paul S. OtelliniPresident andChief Operating Officer
Andy D. BryantExecutive Vice PresidentChief Financial andEnterprise Services Officer
Sean M. MaloneyExecutive Vice PresidentGeneral Manager,Mobility Group
Robert J. BakerSenior Vice PresidentGeneral Manager,Technology andManufacturing Group
Sunlin ChouSenior Vice PresidentGeneral Manager,Technology andManufacturing Group
Patrick P. GelsingerSenior Vice PresidentGeneral Manager,Digital Enterprise Group
Patricia MurraySenior Vice PresidentDirector,Human Resources
Arvind SodhaniSenior Vice PresidentTreasurer
Howard G. BubbVice PresidentGeneral Manager,CommunicationsInfrastructure Group
Louis J. BurnsVice PresidentGeneral Manager,Digital Health Group
Douglas F. BuschVice PresidentChief Technology Officer,Digital Health Group
Anand ChandrasekherVice PresidentDirector,Sales and Marketing Group
Leslie S. CulbertsonVice PresidentDirector,Corporate Finance
Thomas R. FranzVice PresidentGeneral Manager,Fab/Sort Manufacturing
Hans G. GeyerVice PresidentGeneral Manager,Networking and Storage Group
Jai K. HakhuVice PresidentGeneral Manager,Technology ManufacturingEngineering
Brian L. HarrisonVice PresidentGeneral Manager,Europe, Middle East, Africa
William M. HoltVice PresidentDirector, Logic TechnologyDevelopment
Eric B. KimVice PresidentDirector,Sales and Marketing Group
John H. F. MinerVice PresidentPresident,Intel Capital
Sandra K. MorrisVice PresidentGeneral Manager,Mobility Group BusinessOperations and Services
David PerlmutterVice PresidentGeneral Manager,Mobility Group
Pamela L. PollaceVice PresidentDirector, CorporateCommunications Group
D. Bruce SewellVice PresidentGeneral Counsel
Gidu K. ShroffVice PresidentDirector, Materials
William M. SiuVice PresidentGeneral Manager,Channel Platforms Group
Stephen L. SmithVice PresidentDirector,Desktop Platform Operations
Edward Y. SoVice PresidentDirector,California Technology andManufacturing
William A. SwopeVice PresidentDirector,Digital EnterpriseBrand Management
Abhijit Y. TalwalkarVice PresidentGeneral Manager,Digital Enterprise Group
Richard B. WirtVice PresidentSenior FellowGeneral Manager,Software and Solutions Group
Cary I. KlafterCorporate Secretary
APPOINTEDVICE PRESIDENTS
ChannelPlatforms Group
L. Wilton Agatstein, Jr.General Manager,Reseller Products Group
Shane D. WallGeneral Manager,Channel Software Operation
CorporateTechnology Group
David L. TennenhouseDirector, Research
Abel WeinribDeputy Director,Corporate Technology Group
Donald M. WhitesideDirector,Technology Policy andStandards
Digital Enterprise Group
Diane M. BryantGeneral Manager,Volume Server Product Line
Daniel J. CasalettoDirector,Massachusetts Design Center
David M. CowanTechnical Staff
Robert B. CrookeGeneral Manager,Business Client Group
Douglas L. DavisGeneral Manager,Infrastructure ProcessorDivision
Timothy A. DunnGeneral Manager,Networking and Storage Group
Thomas R. MacdonaldGeneral Manager,Advanced ComponentsDivision
Nimish H. ModiGeneral Manager,Enterprise Microprocessor Group
Prasad L. RampalliDirector,End-User Platform Integration
Thomas A. RamponeGeneral Manager,Platform Architecture andSolutions Division
D. Jeffrey RichardsonGeneral Manager,Server Platform Group
Joseph D. SchutzDirector,Microprocessor Development
Sunil R. ShenoyGeneral Manager,Enterprise Microprocessor Group
Digital Home Group
Deborah S. ConradDirector, Solutions MarketDevelopment Group
Kevin M. CorbettChief Technology Officer,Digital Home Group
John E. DaviesDirector, Solutions MarketDevelopment Group
Glenda M. DorchakGeneral Manager,Consumer Electronics Group
Gerald S. HolzhammerGeneral Manager,Consumer Computing Group
Donald J. MacDonaldGeneral Manager,Digital Home Group
Finance andEnterprise Services
James G. CampbellCorporate Controller
Anthony R. GosdenAssistant Treasurer andDirector, Corporate Credit
Ravi JacobAssistant Treasurer,Acquisitions andStrategic Investments
John N. JohnsonDirector,Enterprise Production Services
Franklin B. JonesDirector,Supply Network Capability
Jon A. OlsonDirector, Finance
Nanci S. PalmintereDirector,Tax, Licensing and Customs
Ogden M. ReidDirector,Human ResourcesLegal Services
Dianne L. RudolphController, Mobility Group
Stacy J. SmithChief Information Officer
Jacklyn A. SturmController, Technology andManufacturing Group
Richard G. A. TaylorDirector, Human Resources
Janice F. WilkinsDirector, Internal Audit
Intel Capital
Scott C. DarlingDirector, Enterprise andDigital Home Sectors
Claude M. LegliseDirector,International Sector
Curt J. NicholsDirector,Digital Home Sector
Legal andGovernment Affairs
James W. JarrettDirector,Worldwide Government Affairs
Cary I. KlafterDirector, Corporate Affairs
Suzan A. MillerAssistant General Counsel

Corporate Directory (continued)
Mobility Group
Shmuel ArditiGeneral Manager,Cellular and Handheld Group
Darin G. BillerbeckGeneral Manager,Flash Products Group
Laura G. CroneDirector, Flash ProductsGroup Operations
Shmuel EdenGeneral Manager,Mobile Platforms Group
Ron FriedmanDirector,Microprocessor Design
Gil G. FrostigDirector, TechnologyCapabilities and Operations
James A. JohnsonGeneral Manager,Wireless Networking Group
W. Eric MentzerGeneral Manager,Client Platform Division
Rama K. ShuklaDirector,Platform Program Office
Gadi SingerChief Technology Officer,Mobility Group
Dalibor F. VrsalovicGeneral Manager,Service ProvidersProgram Office
Randy L. WilhelmGeneral Manager,Wireless Networking Group
Sales andMarketing Group
John A. AntoneGeneral Manager,Asia-Pacific
(Sophia) Lee Fang ChewGeneral Manager,Reseller Channel Operation
Gerald J. GreeveGeneral Manager,Asia-Pacific
Jeffery L. HoogenboomDirector,Global Accounts—IBM andLenovo
Thomas M. KilroyCo-President,Intel Americas, Inc.
Ann LewnesDirector,Partner Marketing
Jeffrey P. McCreaCo-President,Intel Americas, Inc.
Christian MoralesGeneral Manager,Europe, Middle East, Africa
Stuart C. PannGeneral Manager,Customer Fulfillment,Planning and Logistics
Gregory R. PearsonCo-President,Intel K.K. (Japan)
Keith E. ReeseGeneral Manager,Customer Fulfillment,Planning and Logistics
Arthur W. RoehmDirector,Global Accounts—Dell
Daniel R. RussellDirector,Technical Operations
Frank E. SpindlerDirector,Technology Programs
Kazumasa YoshidaCo-President,Intel K.K. (Japan)
Software andSolutions Group
Renee J. JamesGeneral Manager,Software and Solutions Group
Jonathan KhazamGeneral Manager,Intel SoftwareDevelopment Products
Technology andManufacturing Group
Sohail U. AhmedDirector, Logic TechnologyDevelopment
Nasser Bozorg-GrayeliDirector, AssemblyTechnology Development
Craig C. BrownDirector, Indirect Materials
Robert E. BruckDirector, Fab CapitalEquipment Development
Maxine FassbergFab 18 Plant Manager
Steven R. GrantGeneral Manager,Fab/Sort Manufacturing
Kirk R. HasserjianDirector, D2 TechnologyDevelopment andD2 Plant Manager
Timothy G. HendryFab 11X Plant Manager
Alexander KornhauserGeneral Manager,Israel Operations andNonvolatile Memory Strategy
Charles H. KorstadDirector,Corporate Quality Network
Brian M. KrzanichGeneral Manager,Assembly/Test
Stefan K. LaiDirector,California Technology andManufacturing
Bruce H. LeisingDirector, Corporate Services
Michael C. MayberryDirector,Sort/Test TechnologyDevelopment
John McGowanDirector, Corporate Services
Gulzar Mohd AliGeneral Manager,Assembly/Test
James R. OHaraGeneral Manager,Ireland Operations andFab 10/14 Plant Manager
Sanjay D. PanditjiDirector,Systems Technologies
Clemente J. RussoGeneral Manager,Systems Manufacturing
Babak SabiDirector,Corporate Quality Network
Joshua M. WaldenFab 24 Plant Manager
SENIOR FELLOWSCorporateTechnology Group
Kevin C. KahnDirector, CommunicationsTechnology Lab
Justin R. RattnerDirector,Corporate Technology Group
Digital Enterprise Group
Peter D. MacWilliamsStaff Architect
Stephen S. PawlowskiDirector, Platform Architecture,Planning and Technology
Software andSolutions Group
Richard B. WirtGeneral Manager,Software and Solutions Group
Technology andManufacturing Group
Mark T. BohrDirector,Process Architecture andIntegration
Yan A. BorodovskyDirector,Advanced Lithography
Eugene S. MeieranDirector,Manufacturing StrategicSupport
Ian A. YoungDirector,Advanced Circuits andTechnology Integration
FELLOWSCorporateTechnology Group
Shekhar Y. BorkarInterim Director,Microprocessor Technology Lab
Stephen R. MooneyDirector, I/O Research
Uri C. WeiserDirector, Streaming MediaArchitecture Lab
Rajendra S. YavatkarDirector,Systems Technology Lab
Digital Enterprise Group
Matthew J. AdilettaDirector, CommunicationProcessor Architecture
John H. CrawfordDirector, Itanium® Architecture
Joel S. EmerDirector,Microarchitecture Research
Tryggve FossumDirector,Microarchitecture Development
Glenn J. HintonDirector,IA-32 MicroarchitectureDevelopment
P. Geoffrey LowneyDirector,Compiler and ArchitectureAdvanced Development
Samuel D. NaffzigerDirector,Itanium® Circuits andTechnology
Jean-Marc VerdiellDirector, Optical Technology
Digital Home Group
C. Brendan S. TrawDirector,Digital Home Architecture
Intel Capital
Steven G. DuvallDirector,Australia and New ZealandStrategic Investment
Legal andGovernment Affairs
David B. PapworthDirector, MicroprocessorProduct Development
Mobility Group
Thomas A. PiazzaDirector,Graphics IntegratedChipset Architecture
Software andSolutions Group
Boris A. BabayanDirector, Architecture
Bryant E. BigbeeDirector, Systems Software
Richard B. GroveDirector, Compiler Technology
David J. KuckDirector,Parallel and DistributedSolutions Division
Seckin UnluDirector, System Performance
Technology andManufacturing Group
Gregory E. AtwoodDirector, CommunicationTechnology Development
Kenneth C. CadienDirector,Innovative Technology
Robert S. ChauDirector,Transistor Research andNanotechnology
Richard L. CoulsonDirector, I/O Architecture
Timothy L. DeeterDirector, Design Rules andTapeout Technology
Albert FazioDirector, Memory TechnologyDevelopment
Paolo A. GarginiDirector, Technology Strategy
William J. GrundmannDirector,Computer Aided DesignResearch
David H. HwangDirector,Flash Process Technology
Karl G. KempfDirector,Decision Technologies
Shiuh-Wuu LeeDirector,Advanced Circuit SimulationComputer-Aided Design
Jose A. MaizDirector, Logic TechnologyQuality and Reliability
Neal R. MielkeDirector, Reliability Methods
Devadas D. PillaiDirector, EnablingTechnologies and Solutions
Valluri R. RaoDirector, Analytical andMicrosystems Technologies
George E. SeryDirector,Device TechnologyOptimization
Peter J. SilvermanDirector,Equipment TechnologyStrategy
Swaminathan SivakumarDirector, Lithography
Gregory F. TaylorDirector, Mixed SignalCircuit Technology
Clair WebbDirector, Circuit Technology


Intel Around the World
North AmericaIntel CorporationRobert Noyce Building2200 Mission College BoulevardP.O. Box 58119Santa Clara, CA 95052-8119USA
PhoneGeneral information: (408) 765-8080Customer support: (800) 628-8686
EuropeIntel Corporation (UK) Ltd.Pipers WaySwindonWiltshire SN3 1RJUK
PhoneEngland: (44) 1793 403 000France: (33) 1588 77171Germany: (49) 89 99143 0Ireland: (353) 1 606 7000Israel: (972) 2 589 7111Italy: (39) 02 575 441Netherlands: (31) 20 659 1800
Asia-PacificIntel Semiconductor Ltd.32/F Two Pacific Place88 Queensway, CentralHong Kong, SAR
Phone: (852) 2844 4555
JapanIntel Kabushiki KaishaP.O. Box 300-8603 Tsukuba-gakuen5-6 Tokodai, Tsukuba-shiIbaraki-ken 300-2635Japan
Phone: (81) 298 47 8511
South AmericaIntel Semicondutores do BrasilAv. Dr Chucri Zaidan, 940-10th floorMarket Place Tower II04583-906Sao Paulo-SP-Brasil
Phone: (55) 11 3365 5500
For more informationTo learn more about Intel Corporation, visit
our site on the Internet at www.intel.com.For stock information, earnings and
conference webcasts, annual reports, andcorporate governance and historical financialinformation, visit www.intc.com.


![Washington, D.C. 20549 SECURITIES AND EXCHANGE … · united states securities and exchange commission washington, d.c. 20549 form 10-q (mark one) [x] quarterly report pursuant to](https://static.documents.pub/doc/80x56/5f27a465e7a8ed5f2163b2a7/washington-dc-20549-securities-and-exchange-united-states-securities-and-exchange.jpg)


