232
825 MXSf~91 824—MxSA—10244

825 MXSf~91
824—MxSA—10244


I ~ I~I ~I ~J 1’ I ~ L. I) E V EL. C):P t’1~&
1N r1.1E
~ -r o i~
IN
~.AN L.tJI~ PcYrc~I
A project report submitted In partial fulfilment
of the requirements for the award of the degree of
J(aster of Science
of Loughborough University of Technology
r:’~~j \O~z~L(~ ~�~C
SUPERVISORS: L. G. Button B. Sc., Dip. Oc., C. Chem., J(RSC,
FGS, FIWEX
D.C. Sime C.Eng., 1(1GB, FIVE)(.
BY
J(.A. HARVEY
SEPTEXBER 1991 ~ AL) 1,-. ~.
VEDC, Department of Civil Engineering

IIIIIIIIIII1IIII1III

—1—
c~ar I i~I cam or an-rnonsn I r
1 certity that:
all sources of infornation, including figures, are
identified by references”.
Signed: .
X.A. HARVEY


— ii —
S TJ 14fl RY
This project begins by considering the problems
racing the water sector in the city of San Luis Potosi in
Mexico. Problems of diminishing fresh groundwater reserves
and unsafe methods of wastewater disposal.
It assesses the roles and effectiveness of the
various organizations involved in management of the water
sector, illustrates how future development may impact on
these organizations and proposes a model for a single
institution that would be better suited to meet the future
needs of the city and its people.
The report proceeds to show how one section of the
proposed institution can be strengthened and developed by
means of a suitable self—implemented project. In this case
a programme of reduction and control of unaccounted—for
water carried out by the water supply section.

— iii -
i.. i sm or coNmsnms
GRAFTER ONE
1.1
1.2
1.2.1
1.2.2
2.1.1
2.1.2
2.1.3
2. 1.4
2.1.5
2.1.6
Certificate of Authorship
Summary
List of Contents
List of Figures
List of Tables
Abbreviations
I NTRODUCTION
The City of San Luis Potosi
Problems Facing the Water Sector
Water Supply
Wastewater
Future Growth of the City
Aim of the Project
Data Collection and FieldStudy Organization
EXISTING INSTITUTIONS IN THEWATER SECTOR
The Institutions
National Water Conunission, CNA
Ministry of Agriculture andWater Resources, SARH
Ministry of Urban and EcologicalDevelopment, SEDUE
Municipalities
Ministry of Health andAssistance, SSA
Local Water Committee, JM
1.3
1.4
1.5
CHAPTER TWO
2. 1
Page
i
ii
iii
vi
vii
viii
1
1
3
3
4
6
9
10
11
11
11
13
13
14
15
15

IIII1IIIIII1IIIIIIII

- iv -
2.1.7 Ejidos 15
2.1.8 Engineering Faculty at UASLP 15
2.1.9 Institutional Relationshipsand Current Reforms 16
2.2 Performance of the Institutions 16
2.2.1 Comments on PerformanceIndicators 18
2.3 Assets of the Institutions 24
2.3.1 Water Supply 24
2.3.2 Sanitation 27
2.4 Organizational Structure of theInstitutions 29
2.5 Current Programme of Works 33
2.6 Institutional Assessment 34
2.6.1 Organizational Autonomy 35
2.6.2 Leadership 35
2.6.3 Management and Administration 35
2.6.4 Commercial Orientation 36
2.6.5 Consumer Orientation 36
2.6.6 Technical Capability 36
2.6.7 Developing and Maintaining Staff 37
2.6.8 Organizational Culture 37
2.6.9 Interaction with Key ExternalInstitutions 37
CHAPTER THREE PROPOSALSFOR ORGANIZATION OFTHE WATER SECTOR 39
3.1 Limitations of the ExistingInstitutions 39
3.2 Future Developments AffectingThe Institutions 41
3.3 A Single Authority for SanLuis Potosi 49

IIII11IIIIIIIIIIIIII

-v -
A PROGRAJI](E FOR INSTITUTIONALDEVELOPMENT
Components of an InstitutionalDevelopment Programme
A Programme of Reduction andControl of Unaccounted—for Water
4.2.1 EstImate of UFW
4.2.2 Production Meters
4.2.3 Design ot Districts
4.2.4 Consumption Meters
4.2.5 Mapping
4,2.6 Method of Leakage control
4.2.7 Use of Computers
4.2.8 Programme Implementation
CHAPTERFIVE GONCLUSIONS Afl REGONXRNDATIONS
5.1 Conclusions
5.2 Recommendations
5.3 Achievements of the Project
ACKNOWLEDGEMENTS 90
APPENDI CES
Population Projections
Water Supply Tariff Structure
Organization Charts of ExistingDepartments
Addresses for Obtaining Material
CHAPTER FOUR
4. 1
4.2
56
56
60
61
62
64
72
‘73
77
79
80
82
82
83
85
REFERENCES 87
A.
B.
C.
92
D.


- vi -
Figure 1.1
Figure 1.2
Figure 1.3
Activity and Responsibility Matrix forthe Institutions of the Water Sector
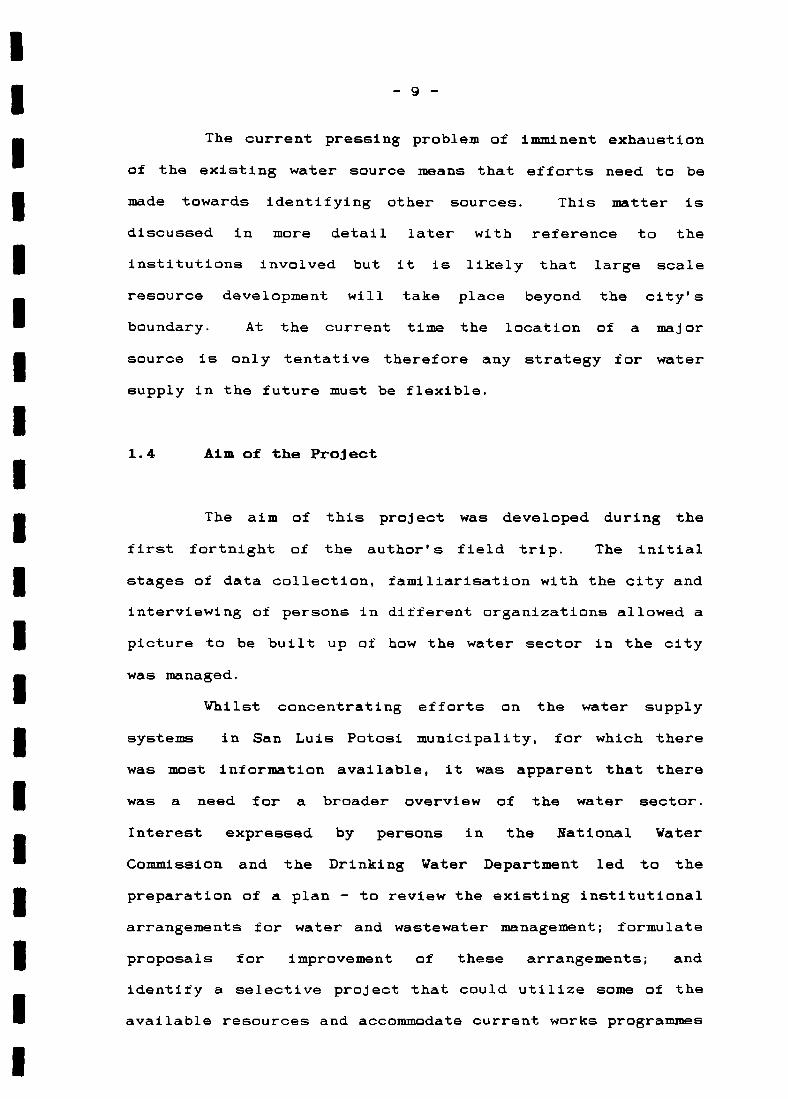
Water Supply System
Sanitation System
Water Department Organization Chart -
San Luis Potosi
Water Department Organization Chart -
Soledad de Graciano Sanchez
Figure 3.1 42
Figure 3.2 44
Figure 3.3 45
Figure 3.447
65
65
Figure 4.3 67
Figure 4.4 68
Figure 4.5 70
Figure 4.6 74
Figure 4.7 75
L.ISm 0P rIOunss
Location Plan
Existing and Future Developments
Population Proj ections
Figure 2.1
Figure
Figure
Figure
2.2
2.3
2.4
Page
2
7
8
17
26
28
30
31Figure 2.5
Figure 3.5
Figure 4.1
Figure 4.2
53
Possible Future Water Sources
Strategy for Future Water Supply, I
Strategy for future Water supply, II
Road Section of the Rio Santiagoin Flood
Organizational Structure of a SingleInstitution
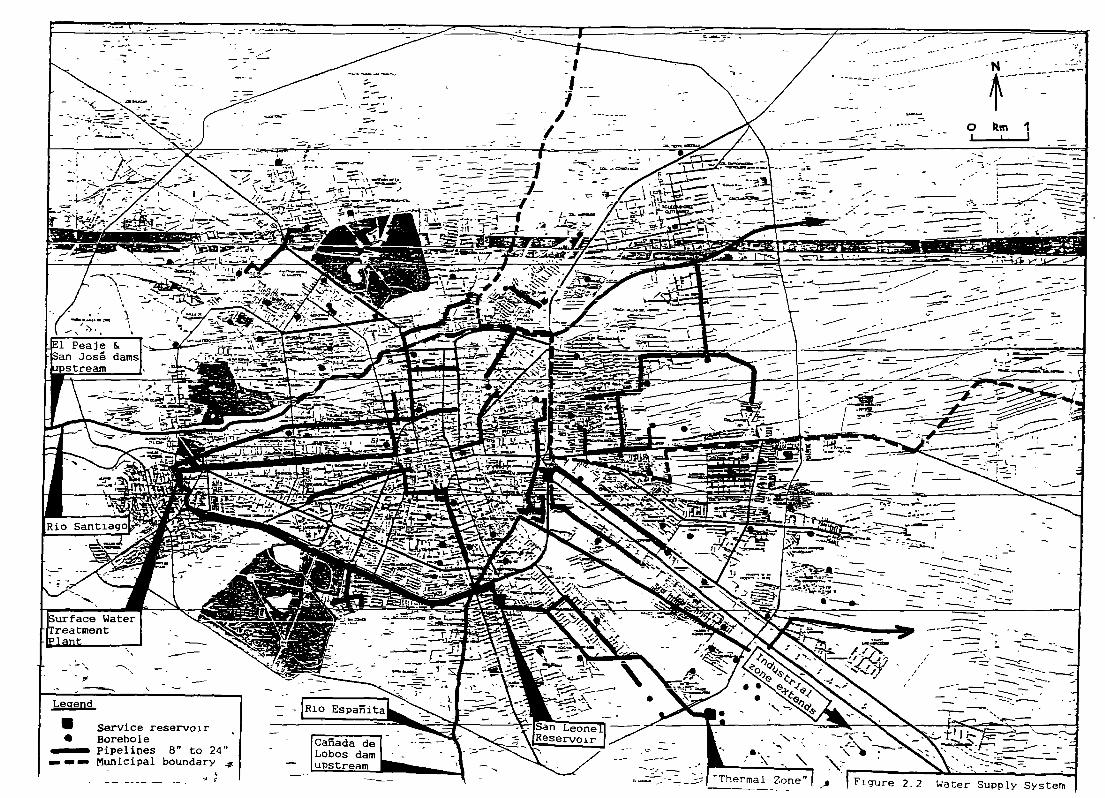
Production Meter Installation -
Borehole No.27
Production Meter Installation —
Borehole No.15
Plan of Consumer Regions
Water Supply Consumer Registrations
Details of Proposed Pilot District
Typical Valve Record Sheet
Typical Detail From 1:2000 Plans


- vii -
L.I~r or
Page
Table 1.1
Table 2.1
Table 2.2
Table 4.1
Population and Growth Rates 6
Performance Indicators for Water Supply 19
Performance Indicators for Sanitation 22
Estimates of UFW 62

— — — — — — — — — — — — — : — — — —

— viii —
ASSRaV i .p4?r i o&s
Organizations:
CNA Comision Nacional del Agua - National WaterCommission
DAP Direccion de Agua Potable — Drinking WaterDepartment
DOP Direccion de Obras Publicas — Public WorksDepartment
JEAPA Junta Estatal de Agua Potable yAlcantarillado - State Committee forDrinking Water and Sewerage
JM Junta de Mejores — Local Water Committee
SAG Secretaria de Agricultura y Ganaderia -
Ministry of Agriculture and Livestock
SAHOP Secretaria de Asentamientos Humanos y ObrasPublicas - Ministry for Human Settlementsand Public Works
SARH Secretaria de Agricultura y RecursosHidraulicos - Ministry of Agriculture andWater Resources
SEDUE Secretaria de Desarrollo Urbano y Ecologia -
Ministry of Urban and Ecological Development
SRH Secretaria de Recursos Hidraulicos —
Ministry of Water resources
SSA Secretaria de Salubridad y Asistencia —
Ministry of Health and Assistance
UASLP Universidad Autonoma de San Luis Potosi -
San Luis Potosi University
Other:
SLP San Luis Potosi
SGS Soledad de Graciano Sanchez
NRW Non—Revenue Water
UFW Unaccounted—for Water

I
II

.0>.
‘4 C-4
~a:~ ‘---———H/
//
/
—_/‘S ‘S
-SAhualulcomunicipality
Main Roads
San Luis Potosimunicipality
0 %~vn 100• I
Luis Potosi state
Source : Ginfos,.1991a
Figure 1.1 Location Plan
‘5’
-S —
,, I---
Mexquiticmunicipality
Cerro San Pedromunicipality i
Mexico
0 ~cn ¶000
Soledad de Graciano Sanchezmunicipality
UrbanArea
‘S
-SI -S--. -~
Villa de Reyes municipality ‘S
San Luis Potosi Environs
0 I~m 10• I
‘S ,5’,
//
State of San Luis Potosi


—1—
~HA~ I~ cJ~T~
I &r ROD Uc~~r I OI~
1. 1 The City of San Luis Potosi
The city of San Luis Potosi is situated in the semi-
arid north — central zone of Mexico. The city is the state
capital and is at the centre of what was once a rich mining
area, in recent decades it has developed into a services and
industrial city.
The result of this development has seen the state
rise from being among the bottom five in the country (Trade
and Travel Fublications~, 1988), as far as per capita income
Is concerned to thirteenth out of the thirty—one Mexican
states (Noriega-Crespo, 1991).
The city authority more correctly comprises the
municipalities of San Luis Potosi and Soledad de Graciano
Sanchez (formerly Soledad de DIez Gutierrez). Figure 1.1
shows the geography of the area.
Large industries attracted by the central location
in Mexico and tax incentives have resulted in rapid
industrialization and population growth. However, the
physical infrastructure of the city is found to be somewhat
underdeveloped and under increasing pressure. Relative
poverty is also evident with 50% of households classified as
having low or very low socio—economic level (Ginfos, 199Th).
The effect of this rapid growth on the water sector
shows itself In two ways. Increasing water demand by
industrial and domestic consumers means that the existing


-3-
fresh groundwater reserves are being mined and the
continuing lack of adequate treatment and disposal of
wastewaters is resulting in serious environmental and public
health risks.
1.2 Probleme Facing the Water Sector
1.2.1 Water Supply
The water supply of the city from its foundation in
the late 16th century until the 19th century was obtained
from the small intermittent rivers Santiago and Espanita and
shallow wells in the unconfined aquifer. The surface water
supply was strengthened in the 19th century by the
construction of the San Jose dam and, later, El Peaje dam
and an infiltration gallery near to the location of the more
recent Canada de Lobos dam. The water being conveyed to the
city by means of open channels, pipes and aqueducts.
By 1965 this existing system was becoming
insufficient for the needs of the city and the first deep
borehole was drilled to tap into the lower confined aquifer.
Further boreholes were developed and in 1975 the lowering of
the water levels in the boreholes was ±irst registered. The
situation has worsened as demands have increased and the
University of San Luis Potosi conducted a study of the local
aquifers and warned of the consequences of over—exploitation
of this resource (INTL 1987).
At the present time the water supply to the city
comprises 7% from surface sources and 93% from the deep
aquifer. The estimated extraction rate of water from the

II

—4—
aquifer is 95 x los m~/y with only 50 x 10~ ma/y being
recharged (Ginfos, 1991a).
At this rate of mining of the aquifer it has been
estimated that the source will be totally depleted by the
year 2000 (SEDUE, 1988a).
The location of a future water source has not yet
been confirmed although the potential of aquifers in the
region has been investigated, as discussed later in Section
3.2. In fact it is not certain that the local groundwater
resources are fully understood. Mention is made in Section
2.3.1 of the warm groundwater derived from some boreholes
but it is not known if this constitutes a separate aquifer
from the one tapped by other boreholes.
If the existing aquifer is to be depleted as
predicted there is not much time in which to locate, plan
and develop a new source.
1.2.2 Wastewater
The problem of wastewater management is also
reaching a critical position in San Luis Potosi. It is
estimated that 50 x 10~ mZ4/y of domestic and commercial
wastewater and 8 x l0~ m~/y of industrial wastewater are
currently being generated. (SEDUE, 1988b).
Only two wastewater treatment plants exist. The
first was commissioned in 1989 and treats approximately 0.7
x l0~ n9/y of primarily domestic wastewater COmbs, 1991a)
and uses the effluent to irrigate one of the city’s parks.
The second has recently been commissioned (June 1991) for

-5—
the same purpose in another park and will treat approxi-
mately the same amount of wastewater.
The remainder of the generated wastewater is
discharged in a number of locations around the north and
east sides of the urban area. The great proportion of it
finds its way to two lagoons; Tanque Tenorio situated 9km to
the east of the city centre and El Morro in Soledad de
Graciano Sanchez situated 6km to the north—east of the city
centre (See Figure 2.3).
Tanque Tenorio was originally designed as part of a
flood control scheme but it has grown with time to be,
reportedly, the largest lagoon of untreated wastewater in
Latin America. Effluent from the lagoon is channelled in an
unlined canal around to the north east of the city for re-
use in irrigation of crops.
El Morro is in a residential/agricultural area and
the wastewater here is also used for local irrigation. The
consequences for the health of the people dealing directly
with animals and crops and for the consumers of the produce
of these areas are very serious.
The state of San Luis Potosi as a whole has a rate
of enteric disease 70% above the national average and the
city itself has the third highest rate of incidence in the
state (Omnfos, 1991a).
In addition to the risks mentioned above the
wastewater discharges have already made the unconfined
shallow aquifer in the city unsafe to drink due to
contamination, It is not understood whether such
contamination will spread to the deep aquifer in the long

term — a problem that would compound the current one of
mining of the water resource.
1.3 Future Growth of the City
The current extent of the two municipalities and
plan for their future development is shown in Figure 1.2.
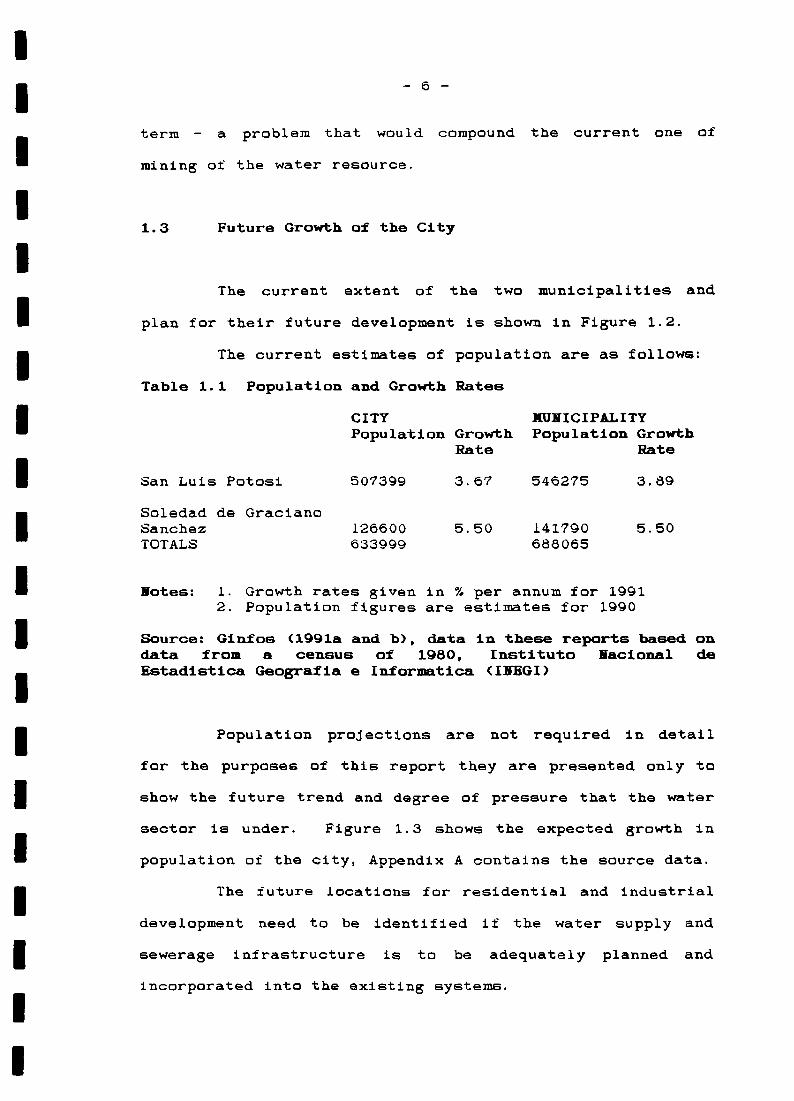
The current estimates of population are as follows:
Table 1.1 Population and Growth Rates
CITY XUNICIPALITYPopulation Growth Population Growth
Rate Rate
San Luis Potosi 507399 3.67 546275 3.89
Soledad de GracianoSanchez 126600 5.50 141790 5.50TOTALS 633999 688065
Notes: 1. Growth rates given in % per annum for 19912. Population figures are estimates for 1990
Source: Gin.fos (1991a and b), data in these reports based ondata from a census of 1980, Instituto Nacional deEstadistica Geograf Ia e Inforn~t1ca (INEGI)
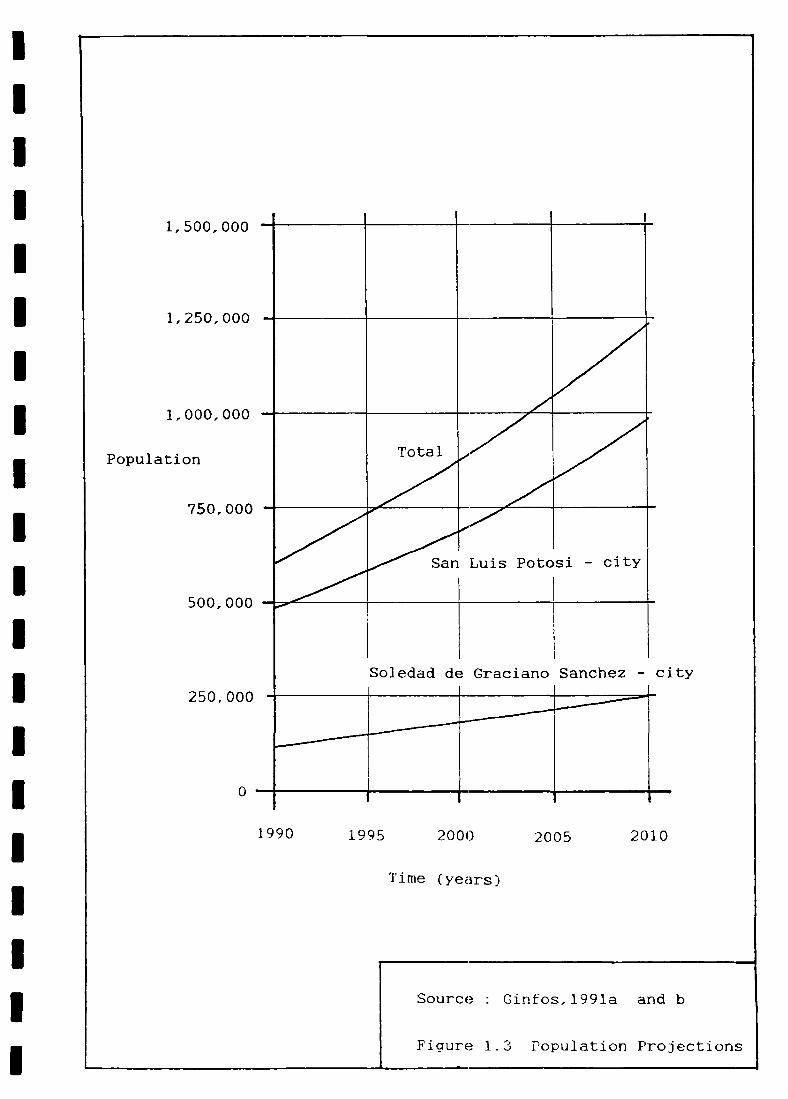
Population projections are not required in detail
for the purposes of this report they are presented only to
show the future trend and degree of pressure that the water
sector is under. Figure 1.3 shows the expected growth in
population of the city, Appendix A contains the source data.
The future locations for residential and industrial
development need to be identified if the water supply and
sewerage infrastructure is to be adequately planned and
incorporated into the existing systems.

I

short1tertfl growth
Medium and long-term growth
Industrial zones
Prii~iary roads
San Luis Potosi./Soiedad de Graciariomunicipality boundary
Source . Girifos,1991a
Figure 1.2 Existing and Future Developments
Legend

1,500,000
1,250,000
1,000,000
Population
750, 000
500, 000
250, 000
1990 1995 2005 2010
Time (years)
Source : Ginfos,1991a and b
0
2000
Fiaure 1.3 Population Projections

-9—
The current pressing problem of imminent exhaustion
of the existing water source means that efforts need to be
made towards identifying other sources. This matter is
discussed in more detail later with reference to the
institutions involved but it is likely that large scale
resource development will take place beyond the city’s
boundary. At the current time the location of a major
source is only tentative therefore any strategy for water
supply in the future must be flexible.
1.4 Aim of the Project
The aim of this project was developed during the
first fortnight of the author’s field trip. The initial
stages of data collection, familiarisation with the city and
interviewing of persons in different organizations allowed a
picture to be built up of how the water sector in the city
was managed.
Whilst concentrating efforts on the water supply
systeme in San Luis Potosi municipality, for which there
was most information available, it was apparent that there
was a need for a broader overview of the water sector.
Interest expressed by persons in the National Water
Commission and the Drinking Water Department led to the
preparation of a plan — to review the existing institutional
arrangements for water and wastewater management; formulate
proposals for improvement of these arrangements; and
identify a selective project that could utilize some of the
available resources and accommodate current works programmes


— 10 —
to begin to address one of the main problems facing the
city, that of shortage of water.
1.5 Data Collection and Field Study Organization
Whilst this report assesses the responsibilities and
activities of the various organizations involved in the
water sector and discusses the performance of the most
significant ones a full institutional analysis following the
WASH Guidelines (Cullivan et al, 1986) was not intended.
Time and resources did not allow for this.
Data collection however was carried out by means of
the four techniques recommended in the guidelines (Cullivan
et al, 1986) during the author’s field trip between 12 June
and 29 July 1991.
A list of organizations visited and persons
interviewed is contained in the Acknowledgements section at
the rear of this report.
Where some items of information are not directly
referenced they have been obtained from the interviews
carried out with the above mentioned persons.

II

— 11 —
Cl-I AP ThI~ -rwO
E~xIs-rino ins-ri ttimi~iis in -rn:B
WA.ThR S~C tOfl
2.1 The Institutions
A number of institutions are involved in various
aspects of the water sector. Some of their functions and
responsibilities are described in detail elsewhere (SEDUE,
1988b) but it is important to outline the roles of the key
organizations here.
2.1.1 National Water Commission, CiA
The National Water Commission was created on 13
January 1989 out of SARH, its parent organization.
The Ministry of Water Resources, SRH, was originally
created in 1947 and was wholly responsible for the
development and conservation of the water resource with
three main divisions ±or planning, construction and
operation (ECLA, 1979). Hydro—electric schemes were outside
its direct control but it was involved in that area.
In 1977 the SRH was merged with the Ministry of
Agriculture and Livestock, SAG, to form the Ministry of
Agriculture and Water Resources, SAPH, to improve integrated
water management by incorporating irrigation activities
(ECLA, 1979) and to increase food production (Garduno,
1985).


- 12 —
By retaining responsibility for agriculture with
SARH the CNA was created in 1989 to be solely responsible
for management and administration of water that, according
to the Mexican constitution, belongs originally to the
Nation (Garduno, 1985). The CNA therefore, has a similar
role to that of the original SRH.
For the purposes at this study the following points
are significant:
a) The CNA grants permission to utilize the natian”s
surface water sources that cross state boundaries
and all underground sources. For example the CNA Is
responsible for the darn El Potosina but not El Peaje
and San Jose.
b) It conducts large scale studies and projects.
c) It has responsibility for billing industries and the
water supply operating organizations (the
municipalities).
d) It is implementing a nationwide water supply and
sanitation programme. In former years 90~ of funds
was directed towards water supply, in 1990 the
sanitation sector was beginning to receive a greater
share with only 83% of funds directed to water
supply.
e) In 1989 it started the Programa Naciomal del Control
de Perdida y Usa Eficiente del Agua (National
Programme for the Control of Wastage and Efficient
Use of Water).


— 13 —
f) A current trend is for the CNA to give concessions
to private industry to treat wastewater and sell it
for non drinking—water purposes.
g) All water users contribute same proportion of their
charges to the CNA.
h) The CNA has offices at Federal, State and Regional
level.
2.1.2 JU.nistry of Agriculture and Water Resources SiRS
This organization still exists after the creation of
the CNA but now is solely concerned with the agricultural
industry. However it does still have an interest in water
use for irrigation.
2.1.3 Ministry of Urban and Ecological Development, SEDUB
SEDUE has two operating arms, SEDUE Federal and
SEDUE Estatal (State). Thus in San Luis Potosi there are
two offices — the State SEDUE office and the state office of
Federal SEDUE!
The State SEDUE responsibilities were defined in
1988 when Federal SEDUE decentralized some of its
activities.
As far as the water sector is concerned the
following comments apply:
a) State SEDUE sets standards f or industrial discharges
to sewerage systems.


— 14 —
b) Federal SEDUE sets standards for industrial
discharges to bodies of water.
c) State SEDUE is required to have CNA approval and
Federal SEDUE approval for any projects it wishes to
implement.
d) State SEDUE assists the State Committee for Drinking
Water and Sewerage, JEAPA, with sewerage and
sanitation projects.
2.1.4 Municipalities
The municipalities are legally required to provide
the population with a drinking water supply of acceptable
quality and quantity. They discharge this responsibility by
means of the Drinking Water Department, DAP, which is also
responsible for planning, budgeting and implementing
sewerage works. The execution of sewerage projects is
carried out by the Public Works Department, flOP.
In addition:
a) The DAP is required to obtain the CiA’s approval for
new boreholes and any new project.
b) The flAP is responsible for operating the water
supply system and initiating new works.
c) Municipalities with few resources in rural areas
rely upon the JEAPA for their drinking water
supplies and sanitation requirements.

a a a a a a a a a a a a a a a a a a a a

- 15 -
2.1.5 Ministry of Health and Assistance, SSA
This organization is responsible for setting the
drinking water standard (based on the WHO guidelines) and,
on an irregular basis, monitoring drinking water quality.
2.1.6 Local Water Committee, JI
These are locally organized community based (urban)
committees whose main interest is that of water supply.
They check their area for signs of leakage from the
distribution system and occasionally raise funds for
localised water supply and sanitation projects.
2.1.7 Ejidos
In addition, in rural areas, Ejid.os (land owned
communally by the Indigenas, the descendants of Mexico’s
pre—Hispanic people) usually have their own borehole and
have to operate it and repair it themselves, they are
obliged to inform the State Government and the SSA of any
pollution and they are responsible for making plans and
applications for new boreholes.
2.1.8 Engineering Faculty at UASLP
The Facultad de Ingenieria conducts studies and
carries out projects in various disciplines.

I

— 16 -
2.1.9 Institutional Relationships and Current Reforms
An activity and responsibility matrix (Franceys,
1990; and WHO, 1986) is presented in Figure 2.1 to clarify
and expand upon the above information.
The boundaries between the responsibilities,
involvements and interests in the various activities of the
different institutions are not clearly defined. The system
is heavily politicized but the most significant point at the
moment is that from September 1991 the municipalities will
have to pay a tax to the CNA related to the quality and
quantity of wastewater discharges and that if the
municipality wishes to recover this cost it must have an
independent organization in place for the operation of
wastewater collection, treatment and disposal. In addition
the municipalities, from September 1991, will be able to
charge a realistic tariff for water supply without reference
to State Congress again provided an independent operating
organization is in place by then. (Until now State Congress
has set the water tariffs and has traditionally set low
tariffs for electoral expediency). The less wealthy
municipalities in rural areas will be able to apply for
credits and loans at low interest rates.
2.2 Performance of the Institutions
As stated in Section 1.5 a full Institutional
Assessment is beyond the scope of this report but the
initial step of Assessing Output Measures (Cullivan et al,


Private
enterprise
Notes
Ii__tir_~1[L II III IIEI Fi~~1I
l.Surface waters crossing statecontrolled by CNA,others by mu~
2.Discharge to sewers/bodies-of--cresponsibility of state/federa
3.Responsibility/involvement dep
Activity and Responsibility Matrixfor the Institutions of the Water Sector
ACTIVITY Evaluationof
. waterRESPONSIBILITY resources
GW SW
~astewater~o1 lection
Wastewa tertreatment
Effluentdisposalandre-use
Surfacewaterdrainage
I D I D I D
CNA I IF 1 LIII IL I I HuHSEDtJE(Federal) I I I I 1_
1F2 [ 2 2SED(JE(state) i
DAP
DOP
:ii i 1 I
JEAPA
I~ ILJ
SSA
Jtl
Ejidos
UASLP
I~
I I~i
f_~ U D


- 18 -
1986) is presented here.
The main institutions under consideration in the
water sector are those of water supply and sanitation for
the two municipalities covering the urban area.
Most of the output measures presented in Tables 2. 1
and 2.2 were obtained directly COmbs, 1991a and b) and
some were calculated from information found in those
sources. Qinfos, however, only presents the information
without comment but it is felt that these performance
indicators require clarification and comment. It should be
noted that the performance indicators are not used as a
matter of course by the institutions under consideration
here.
2. 2. 1 Comments on Performance Indicators
Indicator — Water Supply (Table 2.1) Gomnent
Al to AC It has been reported (Noriega—Crespo, 1991)
that the population figures under—estimate
the true totals.
A9 to AlO Some industries are responsible for their
own boreho].es and some have both their own
boreholes and are served by the municipal
supply.
Bl Currently only 49 of the 70 boreholes under
the SLP water department’s control are
fitted with flow meters, none in SGS are
fitted with meters, therefore production
figures should be treated with caution.

II

- 19 -
Other quoted data4. Population with house
connections5. Population with public taps6. Population using tankers
Commercial consumers7. Metered8. Unmetered
2527 (90%)284 (10%)
o (0%)40 (100%)
Industrial. consumers9. Metered10. Unmetered
204 (70%)88 (30%)
0 (0%)17 (100%)
Other consumers11. Metered12. Unmetered
105 (85%)18 (15%)
n/an/a
13. Per capita consumption ofwater
177 1/c.d 111 1/c.d
Ba~tes Elf iciencxProduction: borehole capacity1. borehole production
Surface water treatment capacity2. production
3. Storage as proportion ofdaily use
1934 1/s1725 1/s
(89%)
350 1/s117 1/s(33%)
4. Leakage
S. Daily pressure variation
6. Leaks repaired
32%or 675 1/sor 66 l/c.d
39—54%
0—25n n/a
1200 /y n/a
Table 2.1 Performance Indicators for Water Supply
Indicatot
A.~Service CoverageUrban populationHo. households
1. No. registered consumers2. Metered consumers3. IJnmetered consumers
489419 118681119000 n/a
105365 (89%) 2228476948 (65%) 028417 (24%) 22284
83.6% n/a13.47. n/a3.0% n/a
(94%)(0%)(94%)
n/a402 1/s
8822 m3(25.4%)
3750 53
(2.4%)
Table 2.1 continued


— 20 —
Table 2.1 continued!..
C Finance1. Service affordability
2. Billing efficiencyvolume billed/volume produced
3. CollectionEfficiencyBills collected/bills issuedBills more than 30 daysoutstanding/bills payable
4. Cost of connection/feecharged
½” supplyW’ supply
5. Total incomeincome from bills
6. Total expenditure
7. Operating cost
8. Energy costsitotal costsalary costs/total cost
D Management
1. Connections/employeePopulation/employee
2. Illegal connections
3. Customer relations
Notes:
Figures are for 1990n/a informetion not available
Source: Ginfos (1991a and b)
(3%
of minimum legal wage
60% n/a
64%
40%
335%451%
SM 10,928 /ySM 5,641 /y
SM 12,723 /y
$ 219 /m3(USS 0.07 /~~3)
62%20%
3101400
n/a
9500conplaints/y
n/a
n/a
n/an/a
SM 405 /y
n/a
SM 1,623 /y
S 128 /m3CUSS 0.05/nP)
78%11%
5002900
2000
n/a


— 2]. —
83 Storage consists of small balancing tanks,
only two service reservoirs exist as such
and both are small for the size of the
system.
84, BC Only passive leakage detection is carried
out, no precise figures are available, nor
are they defined as UFY or flY.
85 The pressure variation from Om appears to
indicate interruptions to the supply and a
performance indicator for this should be
adopted, e.g. no water available at the
first water tap in the property for greater
than 12 hours (QFWJ4T, 1990).
Cl Full details of the tariff structure are
contained in Appendix B, a typical household
would pay approximately USS 0.l8/nt~, and the
tariff is a water—conserving one with
consumers paying a higher charge for high
consumption.
CS, CC Limited financial information is available
but it is evident that the water departn~nts
are subsidised by approximately 50%.
C7 The operating costs are lees than US$0. 1/mS
which is low compared with figures available
on a worldwide basis (Franceys, 1990).
C8 The high proportion of energy costs
illustrates the reliance on pumping from
deep boreholes and how sensitive operating
costs are to the cost of electricity.

II

- 22 —
Table 2.2 Performance Indicators for Sanitation
Indicator
K Service Coverage1. Population served
R Systea Efficiency1. Domestic
2. Industrial
3. Total
4. TreatmentParque Tangamanga IParque Tanganianga II
5. Blockages repaired
6. Wastewater/water supplied
C Finance1. No tariffs charged
D Management1. Population/employee
totes:Figures are for 1990n/a information not available
The service coverage per employee appears to compare
favourably with figures from the UK (QFWAT. 1990).
However the comparison is not straightforward.
Typical UK water company figures are 1200 to 2500
people served/employee which shows the SLP and SGS
figures to be reasonable. A better comparison
though is the number of connections/employee. 660 to
80% 85%
49.9x10⁶ 53/y1582 1/s8.1x106 m3/y
267 1/s1839 1/s
1200 1/sused forirrigation(untreated)
211/s —
401/s —
n/a n/a
82% in both municipalities
n/a n/a
fl5Q, 000” n/a
Source: Ginfos (1991a and b)
Dl


- 23 -
970 in the UK, showing that the SLP and SGS
departments could attempt to reduce their staffing
levels over time. This comparison of indicators
reveals the possibility of misinterpretation between
figures from different countries because of the
different household occupancy rate and therefore
number of people/connection (4.1 in SLP (Glnfos,
iggia), 2,5 in UK (OFWAT, 19gm).
D3 The number of complaints dealt with per year
requires more detailed analysis if it is to reveal
the effectiveness of the customer relations section.
Levels of service for such a parameter in the [JR
(OF VAT, 1990) use banded response time for
meaningful responses to both billing queries and
customer’s written complaints (e.g. response within
2 working days, 3-5 days, 6-10 days, 11-20 days, 21
or more days). This is quite detailed and also
requires classification between queries and
complaints.
Indicator - Sanitation (Table 2.2)
Al It is felt by some that the figures for service
coverage of sewerage are optimistic. There are few
other indicators that offer much insight into Fhe
organizations. Performance in sanitation is perhaps
by its nature more difficult to quantity and is more
subject 1 ‘e.


- 24 —
The proportion of wastewater that is currently
treated (less than 5%) does not allow for much
comparison of quality of effluents and the most
revealing indicator is the severe understaffing
shown by indicator Dl. Were there an indicator of
flooding incidents (OFWS4T, i990) the author feels
that there would have been almost 100% of the
population affected during the summer’s rains!
The use of performance indicators in this case is an
analysis at one point in time and the process should be
repeated in subsequent years to show trends (Shearer, 1988).
As they stand however they suggest that a full Institutional
Assessment may be warranted, this is discussed more fully in
Section 2.6.
2.3 Assets ox the Institutions
A thorough inventory of the systems of water supply
and sanitation in the two municipalities comprising the city
authority is covered in detail by Ginfos (1991a and b).
Only brief descriptions of the systems are given
here, with reference to Figures 2.2 and 2.3, but they
present the situation that the authorities have inherited
and have to manage.
2.3.1 Water Supply
Ihe water supply ox the two municipalities is
derived tram the surtace water source at the Rio Santiago


— 25 —
and some 90 borehales. The surface water source reaches the
city via two dams to the west and an open channel and
pipeline leading to the treatment plant at Los Filtros.
Fran here water is pumped into the distribution system. The
groundwater source reaches the distribution system via
borehole pumps and, in most cases, small balancing tanks and
low lift pumps. One area, known as the thermal zone, uses
10 boreholes to pump water to a “service reservoir” and then
repumps with 5 low lift pumps to a second service reservoir
and thence via a 24” main into the distribution system.
Most of the boreholes are considered to command
their own “pressure zone” however in reality all of these
zones are open to their adjacent zones through open valves
and there is no thorough understanding of how the system
operates. There are a few elevated tanks in the city, most
of which are no longer in operation.
The distribution system comprises pipelines of 2” to
24” diameter with the majority being of 6” diameter. Pipe
materials used are asbestos—cement, PVC and galvanized iron.
Many of the older pipes in the older central part of the
city are made of iron and are apparently the cause of most
of the leaks from the system and the PVC pipes are
susceptible to bursts probably due to the pressures imposed
on them by direct pumping into the system.
Water treatment is only carried out on surface
waters (i.e. 7% of the city’s supply) and consists of plain
sedimentation and rapid sand filtration. The water obtained
from boreholes has a high fluoride content and dental
fluarasis occurs in the population.

II
I
TI/TI
o km II I I —
- -
— ~
-— — — t .5.—
~_-~--=--~~ ] — -:~-- - 2~-~-.
— - I - - - -- —~ - —~r ~_~_—••-~•~__ ——— - —-—-~_ ~ — _~
-- ---
—S.
-S~ ~ ~ ~i~-J
~:~- ~ ~S”~•.-S_
“Thermal Zone” ~ 2.2 Water Supply Syster~
- -c• .~-~i_-2~-—5,
- ~ -_~——
- ~ ‘~.---~- ~ -=.-~.- -~ —
- -
~_—. c~—I- r/’T~~ ~ - ~ -
~i~~—I 17 !~---ii1 ~ -
• ~ ~ ~:--~~~—--- ~1~-~____ ~ ~ V U-~
~‘ ~ • — —~-~-~-- ~—- - -- - -
-5~ __.~.! ~ ~r:~— —S ~ — 5--- — — — — -
- ~ ~—.-- - _.
S ~~—r~--— - — - ~- — --: ---~ ~- . ~---- —-~
-S. - — - .---~ -- —, -
~ ~ - ____
-— -—--———5-. ‘5 55_
Legend
—
U
— — —
~-
-~~:-~‘---E-~’:~
Service reservoirBoreholepipellpes 8” to 24’Municipal boundary •~
- ___
S
-5


- 27 —
Some of the boreholes produce water at a temperature
of around 38C which has implications f or design of
pipelines and selection of pipe material (IF/ES, 1984). It
should also be noted that the area does suffer from frosts
for 15 to 20 days per year on average (Ginfos, 1991a) and
this should also be taken into account in pipeline design.
The municipality of Soledad de Graciano Sanchez is
nominally separate from that of San Luis Potosi as far as
water supply is concerned but its system functions along
similar lines, using borehales and pumping into apparently
distinct distribution zones.
It has been suggested that there is one man in each
of the water supply departments who has been working with
the distribution system f or many years and that only he
understands how the respective systems function!
2.3.2 Sanitation
The sewerage system in the municipalities is
nominally combined. There are a number of main collector
sewers in the city but since the topography is very flat
there are no distinct drainage basins. There are some
sections functioning as separate systems and some areas of
the industrial zone are provided with pumping stations.
These have operational problems when it rains. Only same
main roads have drainage of any significance.
The wastewaters discharge into the two surface
water—courses, Rio Santiago and Rio Espanita, the latter was
previously a tributary of the Rio Santiago but was diverted

II

- ~ ~ .5. >— -I--5— ~—T:~ — .5
5-— -‘ ----5— - S - •S - -
~__~~5_ ~-5•-5-~__• — SSSS5-~-5~-5~-5~5 — -:_~ ___--
—.5---- - 5~_S~ - —,
— ~ ~ [Tanque El Mor~j _~ ~ —~=-~~,;;~~ __5____ -. ~_-- 5- - — - -
--5- i ~~--:z~:2-: - ~
--5 ~__55___SS5_~S~ — __.5 - - — 5.5 - — - ~— - 5 - - 5- .5- —~ - ~-
- — ~ — - .5 ~ — ----~A —- ~ ~.‘~ _~- --S ~_—T~E1iE_.~~-- - S
-S~&-- -__
.5- --
-
S - -S.5s
____ - - 5• - S —~- •-~, ~, —5 — S.- ~ ~ ~‘-~ - - :S ~ -Tan~eTenorlo-— — —~ S -
S — ••__~ 5.. ~-5 S • / —~ 5 - —
____ ~ Canal section ~- -~iE~
.5 --5 I..-5 5, -
5— / -S -
- ctiori
L.~~ ~:~-~~-— ~:_—~~‘~ ~S~jSS. —---5-- 5--- ~..----- _~Ei~
-~.5
-----3
0 km II _I I
-5-- ~ —
.5—
~ ~
Rio_Santiago~
- -~5 -~
5.55 ~ 55~~ -
U ~ -:~--:T~
-S ~
-5---
—5.5—-5~S ~ -I ~
t~S~
I ~ ~
Legend -- ________
f~!~= _ __
~Figure 2.3 Sanitation

I

- 29 -
by means of a man—made channel to flow south—eastwards
through the industrial zone.
Subsequently the wastewater flowing in the Rio
Santiago (approximately 18 x l0’- m~/y) (Ginfos, 19~1a) is
used in Soledad de Graciano Sanchez for crop irrigation,
without receiving any treatment. Wastewater flowing in the
Rio Espanita is discharged into Tanque Tenorio, again
without treatment. (approximately 40 x l0~~ n3/y). (Ginfos,
lg9la).
The only wastewater treatment of any sort is carried
out on small flows by two package plants at each of the two
main public parks.
There are few plans of the sewerage system existing
and the information presented here is based upon plans from
the Ministry for Human Settlements and Public Works, SAHOP
(now disbanded and replaced by SEDUE) and from an undated
plan from the Public Works Department, DOP.
2.4 Organizational Structure of the Institutions
The organization charts of the water supply
institutions are shown in Figures 2.4 and 2.5, more details
of the structures are contained in Appendix C but since
there are some incorrect details to be found in these the
organizational structures are not as clearly defined as they
could be.
rhe organizational structures can be described as
Line Organizations, authority is centred around one or two
key posts. (Qldcorn, 198~).

I

— — — — — — — — — — — — — — — — — — — —
_ _ —~
[~1ministration
Ioepartment
I IOffice of PersonnelAdministration OfficeServices
____ ___ ___ I ____ IAccounts Contracts Pump Consumer
inspection complaintsl
large I
_____________ _________ __________ ___________ ____________ consumersj
I IWater Computermeters1 sectionprogrammesandmaintenance
Source : Cinfos,1991a
Figure 2.4 Water DopnrLment. Organi2’~Lton (Thai tSan Luis PoLost


Administration Chief ofpipelines
Source : Ginfos,1991b
Figure 2.5 Water Department Organization ChartSoledad de Graciano Sanchez
ManagerDrinkingWaterDepartment
AssistantManager


- 32 -
One of the biggest problems facing the institutions
is the nature of the changes that occur with state
government elections every 6 years and municipal government
elections every 3 years.
A proportion of the employees are trade union
members but the remainder are known as “trusted” employees.
These are expected to leave the organization together with
the senior managers at any change of party In government.
This system only allows an organizational structure
to have been created and developed Into a functioning body
over a short period of time. It Is evident from the poor
statistical base of the institutions and the lack of depth
of knowledge regarding the distribution systems that this
leaves the organizations without the necessary resources to
operate their systems effectively. It is understood that
with the personnel changeovers a certain amount of the
crucial information is also removed as if it was the
personal property of the departing personnel.
As a result there are few updated drawings and no
drawing registers available in any of the Institutions.
The water departments concentrate on the operation
of the numerous boreholes serving the city. Up to now, as
additional water was required another borehole would be
drilled. By necessity there is fairly good information
available about the horeholes, pumps and motors. However it
is once the water enters the distribution system that the
dearth of information is apparent.
Other inefficient practices occur; Figure 2.4 shows
that consumer metering and complaints are the responsibility


— 33 -
of the administration section and, seemingly, the technical
section has no direct input. However that section does need
to know where and what the system demands are and where
problems are occurring. Indeed, at the present time the
technical and administrative sections are housed in separate
buildings.
Records of leaks and bursts from the public being
encouraged to contact the authorities for example, are only
recorded as a statistic and not presented on plans to assist
in determining weak areas in the distribution system.
The situation within the organizations and the
position regarding other institutions outlined at the end of
Section 2. 1 means that at times either more than one
organization is looking at the same problem or, more often
the case, organizations neglect to address a problem because
they leave the responsibility to others.
2.5 Current Programme of Works
The various institutions involved in the water
sector have the following works in hand:
a) The DA? (512) are currently installing flowmeters on
the delivery pipelines of all their boreholes, 45
were installed in 1990 and 27 should be completed in
1991.
b) The DAP (SLP) are currently creating pressure
monitoring points at various locations in the
distribution system, 100 were prepared in 1990 and
100 more should be completed in 1991. They will be

— — — — — — — — — — — — — — — — — — — —

- 34 -
able to receive an under—pressure pitot meter and
three such meters are being purchased.
c> The DAP (SGS) are currently rehabilitating their
boreholes and have one third completed, this
includes installation of equipment intended to
improve the efficiency of the pumping plant.
d) The DAP (SGS) have a budget to install 10,350
domestic water meters and 22 borehole delivery main
flow meters over the next four years, with 33% to be
achieved this year.
e) The DAP (SGS) intend to drill 5 more boreholes to
meet increasing demands.
0 SEDUE (State) are implementing the construction of
wastewater treatment plants in the form of waste
stabilization ponds to treat incoming wastes to
Tanque Tenorio and El Morro.
g) Both municipalities run maintenance programmes of
their water distribution systems but do not run any
active programmes of leak detection.
2.6 InstitutIonal Assessment
The assessment of output measures in Section 2.2
provides the first step of an Institutional Assessment.
Amongst other purposes (Cullivan et al, 1986) it provides
data for decision making on whether to proceed with
Institutional Assessment and determines areas of potential
weakness for follow—up.

I

- 35 —
It is felt that the organizations of the water
sector would benefit from Institutional Assessment and
Institutional Development Programmes.
Although these have not been attempted here brief
comments relating to the nine performance categories
(Cullivan et a1, 1986) would usefully summarize the
strengths and weaknesses of the San Luis Potosi water
department.
2.6.1 Organizational Autonomy
The comments at the end of Section 2. 1 are relevant
here. There is little control over the generation of
revenue and, up to now, setting tariff levels. Although
some studies and plans are conducted, long—term planning is
less than adequate.
2.6.2 Leadership
Only the San Luis Potosi water department can be
judged here. It has indicators of high performance and
perhaps only suffers from the problem that, with the
personnel being distributed around 70 boreholes, it is not
too easy to carry out fIeld visits.
2.6.3 Management and Adninistration
There are inadequacies in the management skills
throughout the organizations. Information does not appear

U
I

— 36 —
to be disseminated effectively, for instance there are few
up—to—date drawings and no register and the technical and
administration sections are housed separately.
2.6.4 Commercial Orientation
The costs of operation are heavily subsidised by the
municipal government and the service function is not thought
of as a business. But the billing is computerised and quite
efficient.
2.6.5 Consumer Orientation
Although the level of complaints from the public is
high the relationship with the public is quite good. The
National Water Commission has a high profile and the public
are encouraged to participate in leak detection, wastage
reduction and health matters. rhis reflects on the local
water department. The psychological importance that water
has for users is significant in Mexico (Garduno, 1985).
2.6.6 Technical Capability
The technical resources of the organizations are
generally quite good and attempts are underway to build on
them (see Section 2.5). It is the lack of long term
planning and inheritance of inadequate systems that cause
the most problems.

UIIIUIIIIUIIUUIIII

— 37 —
Increasing use of computers is likely to occur in
the future and plans exist in the long term for computer
modelling of the distribution system. Some of the personnel
are certainly familiar with computers but there may need to
be provision made for training in their use and involvement
with the computer section of the Civil Engineering
Department at the University to design suitable courses
should be considered.
2.6.7 Developing and Naintaining Staff
An element of the staffing methods is mentioned in
Section 2.4 and this leaves the organization weak in this
category.
2.6.8 Organizational Culture
The author learnt of the history of water supply to
the city from more than one source in the department and
this was told with pride and interest. It is felt that this
is a good indicator of performance.
2.6.9 Interaction with Key External Institutions
This area is discussed in Section 2. 1 in more
detail. This area of activity is fairly well attended to
but probably suffers from there being too many institutions
attempting to manage the sector.

I

- 38 —
From the comments above it is felt that the most
serious areas of need for improvement are those of
Management and Administration and Commercial Orientation.
Organizational Autonomy is shortly to be improved under new
legislation and the subject is discussed in more detail in
Chapter 3.

II
I

- 39 -
c}1A:P rsn
rRoI~oSA.L.S E~on onc;A:N- i z.ar i on
or~- rn~ wnn~ ascmo~
3.1 LimitatIons of the Existing Institutions
Some of the problems facing the institutions of the
I water sector are outlined in Section 1.2 and some of theways in which they are addressing these problems are
I mentioned in Section 2.5. However to summarize the
I situation the water sector institutions are in a position ofsimply maintaining their current levels of service with
‘ little time to objectively view their problems or to plan
for the future.
The future holds greater problems for them in that
I their existing water source is being mined and thewastewaters are creating an increasing environmental and
I health hazard.They have to work from a base which is lacking in
I resources in a number of areas; physical systems of waterdistribution and wastewater collection that have grown in a
U disjointed fashion; inadequate, non—existent or disappeared
I records; unclear areas of authority and responsibility fordifferent activities; insufficient human resources to
I operate the systems effectively nor determine strategies toserve future developments; and consistent lack of financial
resources to provide sufficient funds to pay for
improvements and extensions to the systems.
U

IIIIII

— 40 -
The problems faced by the water sector in San Luis
Potosi are not untypical of many towns and cities in Mexico.
Mexico city itself was identified as facing severe water
shortages some time ago and its critical time Is yet to come
despite intensive measures to combat the problem (Durazo and
Farvolden, 1989; and Hunt, 1990). Ciudad .Juarez on the
border with the United States of America has been the
subject of research to find solutions to its problems of
over—exploitation of aquifers and disposal of wastewaters
(Lloyd and Màrston, 1985), Both Guadalajara and Monterrey
face problems of water shortage, (SEDUE, 1988b).
At a national level the CNA has been created to find
solutions to the problems facing these cities and Is now
addressing many of the deficiencies in national and regional
water management in Mexico that have been reported elsewhere
(Guarduno, 1985). San Luis Potosi, In the long term, will
need to develop other sources of water to meet future needs.
In that case large scale projects may be a solution
(Garduno, 1985).
In their current state the water sector institutions
at local level are ill prepared to operate such systems but
it is surely important that they develop towards such a
capability. 1± they do not do so they will be reliant upon
the national body to provide solutions and resources and
they will remain dependent rather than become autonomous.
With the Imminent requirements to separate the
operating authorities from the municipalities now is a
suitable time to plan an appropriate institution capable of
serving the city In the long term.


-41 —
3.2 Future Developments Affecting the Institutions
Likely areas of future developements in the urban
area are shown In Figure 1.2, these may not be certain but
it illustrates the need for water sector planning to be
flexible.
It can be seen from the plan that the municipalities
will merge even more into a single urban area (If they are
not so at the moment). In fact there are suggestions for
the formation of a “greater conurbation” which will include
parts of 5 municipalities — San Luis Potosi, Soledad de
Graciano Sanchez, Mexquitlc, Cerro San Pedro and Villa de
Zaragoza (Norlega-Crespo, 1991).
A future water source is unlikely to exist in the
immediate surroundings and it is not yet known from where a
supply will come. Figure 3. 1 shows the locations of
possible aquifers that could be developed, the choice will
determine how best to manage the water distribution system
at the moment and how to develop it to take advantage of any
new source.
At the moment the distribution system is based upon
the surface water source supplying from the west, the
“thermal zone” boreholes in the south and other boreholes
throughout the urban area. The main pipelines of the
distribution system of size 10” and above cover a
significant proportion of the city but not in any clearly
definable way, I.e. they do not constitute a logical
branched or looped system.

I

Legend
o
Aquifers
State boundaries
—-.-- Main roads
Source : Ginfos,1991a
Figure 3.1 Possible Future Water Sources
— .— —
/
/
/ —
f
State ofSan Luis Potosj
NParaiso CafladaVerde
/
El Palmar
//
/I
Periasco ‘~
\
I
I
\
\
f‘II. /
I ()I.
State ofZacatecas /~
1\
\
/\~
N
S.-San Vicente
~1’
/
—. __•5\
I”
/
/
/
— .-_. —
//
/
//
/
s’-.. T~ajuato
/I
/
/
El Fuerte-Vi]Jela/ -S.
I N5
‘~1/


- 43 -
Figure 3.2 and 3.3 show the skeleton of the system
described above, other important features and possible
strategic plans incorporating a new water source.
The main points to be noted are as follows:
a) A new service reservoir should be constructed at the
same elevation as the existing treated water tanks
at the treatment plant in order to command the city
from the same hydraulic level. It is unlikely that
there is available land in this area so a location
may need to be found to the south or west of the
city.
b) If the new transmission route approaches from the
same side of the city as the new reservoir can be
located, then the main can deliver directly to that
reservoir.
c) If the new route approaches from the opposite side
to the reservoir then the main can serve a
transmission/distribution function with the load
centre between the source and the storage. This
arrangement will usually be the most economical
(Steel and NcGhee, 1Q85).
d) Tentative routing of a transmission main needs to be
considered at an early stage to allow its
construction to be a part of future developments.
e) Infilling of the apparent gaps in the system to
build towards a looped, branched or ring—main system
should be planned so that construction can be
achieved as the future developments are completed.


- I -
2~~TIi
o ~m,1I i —~
~< :-- ~ -.~L--i~:::—_ —~=~
~- ~— ‘—~‘-~sr - -~EE~ -: ~z;I:~~ ~Tj’ 1.- -~
~ —:--~- ~-JL~- ~ i-=_-~:_?~ = --~--_~ - - - — 5-’ ~
- .. ~ -~r~r~-~ - - J-~— ‘c.~-~“!~—i~_— ~_~- 5— - — — ~~—±~:- ~,
~ ~~:_•~~ ~ ~/e-~?‘ ~ - ~—-. — 5, -~ — ~ — 1~_- - ‘- ~Z~$~7 ~ ~
S_~ ~ -~- ~r’~— - 5 5- -~s~-. i ——~~~=• ..~ — —~T~- ~—- - -~ --
.—, , ~ / ~ / ~.— ~ — S.—. —L___——.————-— — — — —. —. —- - .~, ~-~&___- ~- -_I S. ,~Ei—~_ - ~j:: ~
- -.4~P:~4~~ 1— ~ — •~~r’•~.:=~ — —S.--— - ~--—~ — —
-c-,- — ~- . -- - / . t ~- - — 1 ~ - —— ~— -~ —-S. ~ ~ ~_ -; - ~ --~~~~11-_-------T-- - — - —---—-~~~ —- -
~r~:4;~~rL -. ± -J*~ ~E~--~-:~-- ~--~-
- - ~ .- - --~ ~zE~ ~ -~-S. ~ ~-‘~-r .---- —- -— — ~— —c.-.. ~
. - - — - -~ ~ S — S. — ~ ~ -~.-~~-i: ~— S.- i::::~~ -~ ~7•___ ~ — ~C —- ~
~ --__- - - ~ ~ -~E~ ~ - :~ It - -JJ_S.j~.,~~ ~- ~ ~ — - ~~1~i_ -—
- S 5— •—~ -~ 1 ~ -~ ~ ~ —-S ~ -
II I_I___1 -~ ~ ~: —;:~ ~ -~~=j~-~r! — =- ~y~- ~ —‘i p ~— ~ ~-~-‘~— — ~ ~, L:i_____z___
~ i~ - - ~ ~-
~ ~
— / ~ ~ —& - ~ - -~ ~ ~ - - -~ —: —c--c -~
- . ~— . -~ ~3!:~- ~ :~~‘ - — —S.---- —--i — —~
~ ~ ~ .. —- S •~~~- I~~_ -—
Existing servicereservoir at —
treatment plant -
-5- _pi
Legend
Service reservoirExisting mainsNew mainsMunicipal boundary
____________ ~~—~.---— -S.--- -
-- ___
L ~ ~
---5
— j__-__ ~-
— ._-._— ---
_3. --5-------


-•i:--1.~ ~J --—-S.-~---- -- —-‘S.-------------~- - j - ~_~S.
- --:- —-Newsuppiy 1 - - - I - -~ -- -:
- -- - - - from north-west - - — - - -- - -- ---~ -: —
- - — of the city -— I ;.. - New supply I~ N----::~-.-- - - - - ~-_ Transmission/distribution, - - -~ . from north-east. -- - - -
- -- - ~ :—- main - - -- -- of the city -- — -
— <-T -TT ——~-~_- - —i - — - - --
- — - -- - ——--- / - - - - - --- - -.- - -- -~ — — -- —- m -
S.- - —— - S. - - — -- - S.— - - — - - - ~ — - 1 — - ~__.----: - — -- I I I— ~_— -- - ~ - —-- -
I ~-_~ . ----s- ~-.-~ ~:—~ ~ - -- — —~
2S.~~~S. -~ ~ ~~:- - -------=:~-=_ -~ - - ~ - -- --S.~- h—
~ - ~ -~:TI-:--r -~ ~ -‘~ ~ -~ - -~-~==~ — — —— ~-
~_~Th_%-~--== ii_-~~-- ~-;:
(i~ _
a ~~~-i— — ~- ~ ~—-- -- - -- ~ -- ~ ~ ‘~j~ _________
~ ~
S5~- S.- _ ~ ~
- ~ ___ -- S — ~ .~r ~ -I:S.-~~~
-;-~•:-S~ ~ ~ ~~T— ~--~:-
Municipal boundary ~ I~~re
t~-~ —~
~ ~ —~~ ~
U,,’


- 46 -
Planning by national or regional bodies may well be
able to provide solutions to the locating of a new source
but it is important that the local authority has the
capacity to plan its own requirements.
Similar considerations need to be given to the
discharge of wastewaters. As increasing quantities of
domestic wastewaters drain into the existing disposal system
it will need to have adequate capacity to pass them and
suitably sized treatment works to treat them to acceptable
standards.
The management of wastewaters cannot be seen in
isolation from that of stormwater. Despite the low rainfall
in the region (average 359mm/y) (Ginfos, lQQla) the
intensity of rainstorms can be high — on 11 June 1991 the
average yearly rainfall fell in a 24 hour period.
So with increasing urban development, and therefore,
impermeable areas, greater emphasis needs to be placed on
the provision or storm water drainage.
Currently the main drainage routes of the Rio
Santiago and Rio Espanita are inadequate at times of intense
rainfall. The Rio Santiago has been substantially paved
through the urban area to create a main road but this soon
reverts to a river during heavy storms. This occurred
during the author’s field trip and is illustrated in Figure
3.4. After some of the heaviest rains for many years El
Peaje, San Jose and Canada De Lobos dams were full and
spilling water. Further downstream the “Rio Santiago” road
was flooded and impassable to traffic and the Rio Espanita
was flowing lull, the latter was then discharging into the

I

Figure 34 Road Section of the Rio Santiago in Flood
-S.

I

- 48 -
Tanque Tenorlo which was full and overtopping its
surrounding bunds. The irrigation ditches fed from the
Tanque Tenorio join the canalised Rio Santiago farther
downstream and there is nowhere for the water to go!
Normally this would be to the city’s advantage if it was
able to treat and re—use its wastewaters~ at times of heavy
rains it has the potential to be a disaster.
It should also be noted that the lack of drainage
for stormwaters has other Implications. Since the water
distribution system has a pressure range from 25m to Om (see
Table 2.1) there are times when the mains will be
susceptible to infiltration from shallow groundwaters. It
is known that the shallow aquifer is contaminated and, as
can be seen in Figure 3.4, surface waters during times of
flood will undoubtedly contain solid waste and probably
faecal matter. The water entering the distribution system
from boreholes is currently untreated and not disinfected.
This situation creates a serious public health hazard and
concerns more than one of the existing organizations.
The majority of future growth will occur on the
outskirts of the city, see Figure 1.2. Not all the
wastewater and stormwater iron these areas can be allowed to
drain towards the existing system. It will not be able to
cope.
It is essential therefore that knowledge of the
spare capacity and functioning of the existing drainage
system be determined and strategic plans be developed along
the lines of perhaps interceptor sewers or separate drainage
areas.


- 49 -
It is not known how extensive flow records are for
the main drainage routes of the city, but the two rivers are
both regulated by dams so there should be some information
available to aid such planning.
Current design practice in the Public Works
Department for surface water drainage of new developments
uses a rainfall intensity of 25 mm/h in the Rational Method
for calculation of peak run—off (ESI, 1985). It is felt
that this figure should be reviewed. Standard practice in
Britain uses 50 mm/h for small developments (.85%, 1~85) and
the rainfall intensity in Mexico was observed to be as high
as in Britain.
Therefore, with the urban areas merging to become a
single city but with the wastewaters currently draining
across and discharging into different municipalities it is
felt that the future developments affecting the city require
some changes to the organization of the water sector, to
improve both water supply and sanitation.
3.3 A Single Authority for San Luis Potosi
The analysis of the existing institutions of the
water sector, the future pressures that will be put on their
currently stretched resources and the expected changes to
the structure of the local water departments have led to the
proposal that — the organizations required for the
management of the water supply and sanitation services in
the two municipalities from September of this year (1991) be
merged to create a single institution.


- 50 —
The merits of this proposal are as follows;
a) It is apparent that although two municipalities
exist there is only one urban area. This merging of
boundaries will increase with further urban
development and it is inefficient to have separate
organizations duplicating certain functions to
achieve the same end.
b) Gui reni lv ihere is one source of watei stippi y I he
deep aquifer. Any future supply is more than likely
to be derived from outside the boundary of the city,
both municipalities theresore face the same problem
of shortage and will probably find they have to
share the same long term solution. Two
organizations merely create unnecessary
administrative delay.
c) The wastewaters generated by domestic and industrial
water use in the separate munic~paflties already
impact upon each area. The problem of wastewater
cannot be dealt with in iso]aI.ion A large
proportion of the effluent from San l”is Potosi is
discharged in the municipality of Soledad de
Graciano Sanchez, only one body can effectively
manage this problem if one area is not to benefit to
the detriment of the other.
d The organizations directly involved in the operation
of the water supply and sanitation in the
municipalities are at different stages of
development: they each have their stren~ths and
weaknesses: they each have similar programmes of

II
I

- 51 -
works at the present timet there is potential that
the water sector would benefit from their merger.
Both municipalities have responsibilities for
certain functions in urban and rural areas, for two
organizations to maintain the support structure for
this is clearly an inefficient use of resources.
against such a proposal must be
The legal framework would be necessary to create a
single body, it is considered that the CNA have the
authority to implement such a change.
The smaller municipality may resent a merger with
its larger, economically and politically stronger,
neighbour; however suitable negotiations should be
able to prepare all agencies for the change.
The different service levels in the municipalities
would need to be taken into account in designing a
suitable tariff structure with possible needs for
cross—subsidising.
The change itself would probably be considered a
quite radical move by all parties concerned and they
may not be prepared for this much change. However
change is about to come anyway. It would be better
to take the right step now than to take halfway
measures.
Finally the current members of, and those outside
of, the trade unions would need to be considered.
The system needs to be less politicized than at
e)
Arguments
considered
a)
b)
c)
d)
e)


- 52 -
present so that the records and information about
the services are seen as much a part of the
infrastructure as the physical facilities.
An organizational structure for a single institution
I to manage the water supply and sanitation services in SanLuis Potosi, Soledad de Graciano Sanchez and the surrounding
I rural areas is presented in Figure 3.5.The organization would obtain the majority of its
personnel from the existing bodies responsible for the
I present separate disciplines, i.e. two water departments,two sewerage departments and the JEAPA.
I An external body, probably the CNA, would best bepromoted to advise and assist in the establishment of the
I organization. It would have to involve itself in an audit
U of the available personnel to assess the strengths andweaknesses of the organization and appoint new managing
I engineers in key positions within the organization.The amalgamation of currently separate organizations
is bound to cause difficulties and some conflicts of
interest. Promotion of enthusiastic and efficient persons
from within the present structures should encourage an
Iatmosphere of motivation. It could serve the institution
best if the important post of General Manager was filled
I from outside of the current organizations.
III


— —-,
1Comision1Nacional L..~eiAgua~ -
‘S
___________ I I~1etering Treatment WorkshopProduction. Plant StoresDistrict and Eq’jipmentConsumption
J
I--I
Figure 3.5 Organizational Structure of a Single Institution

I

— 54 -
The organization structure in Figure 3.5 shows the
water distribution system, sewerage system and service
connections managed by district. Initially an important
division should be along the existing municipal boundary —
this would allow the existing organization to continue to
function as now but under the umbrella of a new general
manager. Some degree of competitiveness could be introduced
at this stage by the use of performance targets to encourage
efficient practices and procedures.
The size of the organization may need reducing in
the long term as it aims for improved efficiency. The
current size of the San Luis Potosi water department is
about 1400 consumers/employee and 310 connections/employee
COmbs, 19~18) which compares to 1700-2500 and 660-970
respectively for some English water companies (QFP/AT, 19!?1).
At the time of implementation of a new organization
and revised tari±xs (and in the case of sanitation services,
newly imposed tariffs) it would be difficult to determine
the efficient size. Determining staffing levels and tariff
structures might wisely be set as priority tasks. This
should also include a fair tariff structure for treated
wastewater re—used for agricultural purposes. Also the
current programme of works as outlined in Section 2.5 would
have to be reviewed with respect to new requirements and
initiatives.
The changeover to a single organization would be a
stressful and difficult time, there would be many problems
and initially it would probably appear that more problems
were being created than solved. However in the long term a


— 55 —
single autonomous body running the water sector must be
preferred if San Luis Potosi is going to be able to survive
the imminent problems of water supply shortage and
unsanitary wastewater disposal.


- 55 -
cnni~r~ I~onr~
a. ~ s~ooF~J~~r.’rt.csi~-oit i N’sr I rn r I O~flL.
a~ v aoi~n~:rrr
4.1 Components of an Institutional Development Programme
The imminent re—organization of the water supply and
sanitation departments to create independent bodies able to
set realistic tariffs provides an opportunity for a more
radical change — the creation of a single institution to
manage the water sector in San Luis Potosi, as described in
Section 3.3.
The process of assessing output measures in Section
2.2 indicates that a full Institutional Assessment may be
warranted. This ludgement combined with the proposed
amalgamation of the water sector organizations leads to the
second key recommendation of this report, that the new
institution with a long-term future should be developed and
strengthened by means of a suitable, self—implemented
project (Franceys, 1990).
Although experience <Edwards, 1988) suggests that
effective institutional development projects are not common,
three important factors relating to the external environment
are conducive to potential success:
a) Local Government is supporting current reforms, and
the CNA would support the changes as they have been
considering the need for a single institution.
b) The consumers are demanding better services,
population growth demands expansion, and the

I
III
I

- 57 -
“problem of water” appears as the first item of the
current television campaign of one of the candidates
for governor.
c) Economic factors will dictate that unless improved
water services and wastewater disposal methods are
introduced the local economy may suffer.
Whilst a full Institutional Development Programme
can be considered for the proposed single organization it is
felt that a productive exercise is to concentrate on one
section of the organization for which a reasonable amount of
information is available.
The drinking water department of San Luis Potosi
municipality is the largest of the four organizations and
would contribute the greatest numbers to the proposed
organization. It has certain programmes of work at the
moment that could be incorporated into a development
programme, or form the basis of one, and lessons learned
during implementation would extend readily to include the
system in the neighbouring municipality.
Therefore it is proposed to identify a project that
can be implemented by the Water Supply Section.
The institutional development programme should
consider the five project goal areas suggested by Edwards
(1988), namely:
a) Management development.
b) Systems and procedures development.
c) Commodities.


- 58 —
d) Training systems development and skill training.
e) Structural and organizational adjustment.
Of these, the proposed change to a single
organization accounts for point (e. satisfactorily, although
this should not be an end in itself and structural changes
should be made cautiously.
It is felt that the other four points can be
addressed effectively by a project based upon a programme of
reduction and control of unaccounted—for water.
Such a programme requires “a continual repetition of
a series of simple, logical processes and tasks to obtain
increasingly accurate detailed data that facilitates ever
more efficient detection of deficiencies” (Jeffcoate and
Saravanapavan, igar,
Project goal (b) above will be met by the carrying
out of steps such as checking basic data, surveying actual
consumption, mapping and/or re—mapping, checking un—metered
consumption and reviewing meter—reading procedures. The
systems and procedures developed will be more effective if
prepared by the staff themselves rather than imposed from
outside.
Project goal (c) will be met by testing and
maintaining the existing equipment and facilities,
installing new or repaired equipment as required, and
introducing new apparatus as an essential component of the
programme such as portable flow meters with recording
charts, listening sticks, micro—computers and vehicles.


- 59 -
ProJect goal Cd) will be met by the systematic
introduction or new methods and skills on a district by
district basis, starting with a pilot area. The learning
process will also spread to and from the staff of the two
municipalities as each will have their own particular areas
of strength.
Project goal (a) will be met in a number of ways.
The development of new systems and procedures should provide
management with information to allow it to function more
effectively. The use of performance indicators and targets
should be introduced at an appropriate level of detail and
breadth of view. Some management training will be necessary
and the important aspect of incentives will need to be
considered. However, it is felt that there is currently a
key leader in each of the water departments who is
committed to improving efficiency and introducing new ideas
to improve the service provided to the consumer. It is in
these key leaders that the willingness to change can be
identified (Edwards, 1988) and through them, the institution
developed.
In addition to providing the elements of an
institutional development programme the reduction and
control of unaccounted—for water will go some way towards
relieving the urgency with which a new source of supply
needs to be won. Whilst a reduction in wastage cannot be
thought of as an alternative “source” it may postpone the
date when a new supply will need to come on stream.
Leak reduction efforts have also been found to be a
quick and cost-effective solution to a city’s drinking-water


- 60 -
shortages (AWVA, 1987) and. can reveal other distribution
problems that would otherwise go unnoticed.
It is not expected that sophisticated hydraulic
analyses will be carried out, but large amounts of data will
be collected and will need to be processed and stored. Such
data bases provide the foundations for future computer
applications such as Network Analysis and it would be wise
to involve the Engineering Faculty at the University at an
early stage.
It is understood that there is not a specific
computer program, such as the UK’s WATNET, that is being
used for teaching of network analysis. It is suggested
therefore that the water department and the UASLP obtain
computer programs for both water distribution networks and
sewer hydraulics, for example those promoted by the World
Bank (UNDF, 1987; See Appendix D). It would be possible to
begin to devise suitable training programmes to provide a
source of skilled graduates for the time when the
organization is able to start constructing computer models
of its systems.
4.2 A Programme of Reduction and Control of Unaccounted—
f or Water
It is proposed above that the elements of an
institutional development programme can be found in a
project for the water supply section of the single
institution based on a programme of UFW reduction and
control.


- 61 -
It is recommended that the working guidelines of the
World Bank be followed (feffcoate and Saravanapavan, 1987),
the report is available in Spanish (See Appendix D).
The programme itself cannot be started here but
initial observations, suggestions and examples are presented
to show how the programme could readily be implemented in
San Luis Potosi.
4.2.1 Estimate of UFW
The first step is to compare total water production
and consumption. The departments’ estimates for leakage are
32% for San Luis Potosi and 39-54% for Soledad de Graciano
Sanchez (Ginfas, 1991a and b).
At the present time neither supply is fully metered
for production and only San Luis Potosi has near full
coverage of consumer meters, so only estimates can be made.
Table 4.1 presents a calculation of UFW from the basic data
available in the source, it can be seen that the results
differ slightly from the quoted leakage rates.
The amount of UFW is presented in various forms, and
a fuller explanation of the appropriateness of these is
given elsewhere (Jeffcoate and Saravanapavan, 1987).
Percentage of water produced is the common form used
worldwide, in Europe litres per property per hour is
becoming popular and thought to be more meaningful and cubic
metres per property per billing period (in this case, every
2 months) is suggested as an interesting approach.

I

- 62 —
Table 4.1 Est1n~tes of Unaccounted—for Water
Total water produced:
surface water sources
boreholes ______
Total water consumed:
domestic
commercial
industrial, general
industrial, specific
other ________
653 1/s
E 20 l/prop.h
28 &‘/prop.bim
Source: Ginf 06, 1991a and b
61%
247 1/s
37 l/prop.h
54 m~/prop.bim
Basic data checks such as the above showing UFW
levels above 25% indicate that a preliminary investigation
for UFW is justified (Jeffcoate and Saravanapavan, 1987).
4.2.2 Production Meters
The second step is to check the reliability of
production figures. Flow meters have been installed at 45
of the 70 boreholes in San Luis Potosi and it is planned
SLP SGS
117 1/s
1725 lLs..
1842 1/s 402 1/s
902 1/s 155 1/s
147 1/s —
74 1/s —
58 1/s —
8 1/s —
1189 1/s 155 1/s
UFW 35%


- 63 -
that all 20 boreholes in Soledad de Graciano Sanchez will be
so equipped in the near future. This will provide the
department with useful information, however some points
should be noted.
Some of the installations do not comply with
normally accepted criteria for straight sections of pipework
upstream and downstream of the meter (IF/ES, 1984; and
Jeffcoate and Pond, 1989), and this may lead to inaccurate
readings, compare Figures 4.1 and 4.2.
Also the pipework layouts at some of the borehole
locations do not allow for either removal of the flowmeter
without shutting off the pump or discharging to waste
through the flowmeter to check its accuracy. Reference to
two World Bank publications is recommended (Jeffcoate and
Pond, 1989; and feficoate and Saravanapavan, 1987), and
installations not yet started in San Luis Potosi and Soledad
de Graciano Sanchez should consider such design points as
necessary.
A good example of an installation is shown in Figure
4.1. This installation, Borehole No.27 at Fray Diego de la
Magdalena, includes a branch to receive a water level meter,
an air—valve, a pressure gauge, non—return valve, sampling
tap and flow meter. However it could usefully have a by-
pass or diversion—to-waste facility for checking the flow
meter.
Borehole No.15 at Slallejo, Figure 4.2, however is
not so good with a complicated pipework layout and no
appurtenances other than the flow meter.


- 64 -
Meter reading is carried out by a man stationed at
each well who records the volume supplied in each 24—hour
period, on a monthly form, which is processed by computer on
a monthly basis. Currently the only possible means of
determining daily flow variations is by specific observation
and this is not done. Only one meter has the capability of
a graphic record of flow against time.
It is felt that at present the reading of production
meters is carried out satisfactorily and is not susceptible
to malpractice.
4.2.3 Design of Districts
Division of the supply area into districts is the
next important step.
The distribution systems are ostensibly managed in
pressure zones related to a borehole or group of boreholes,
however the zones have indistinct boundaries and there is
said to be much transfer of water from one zone to its
neighbour. The status of any isolating valves is not fully
known and there is limited detailed mapping available.

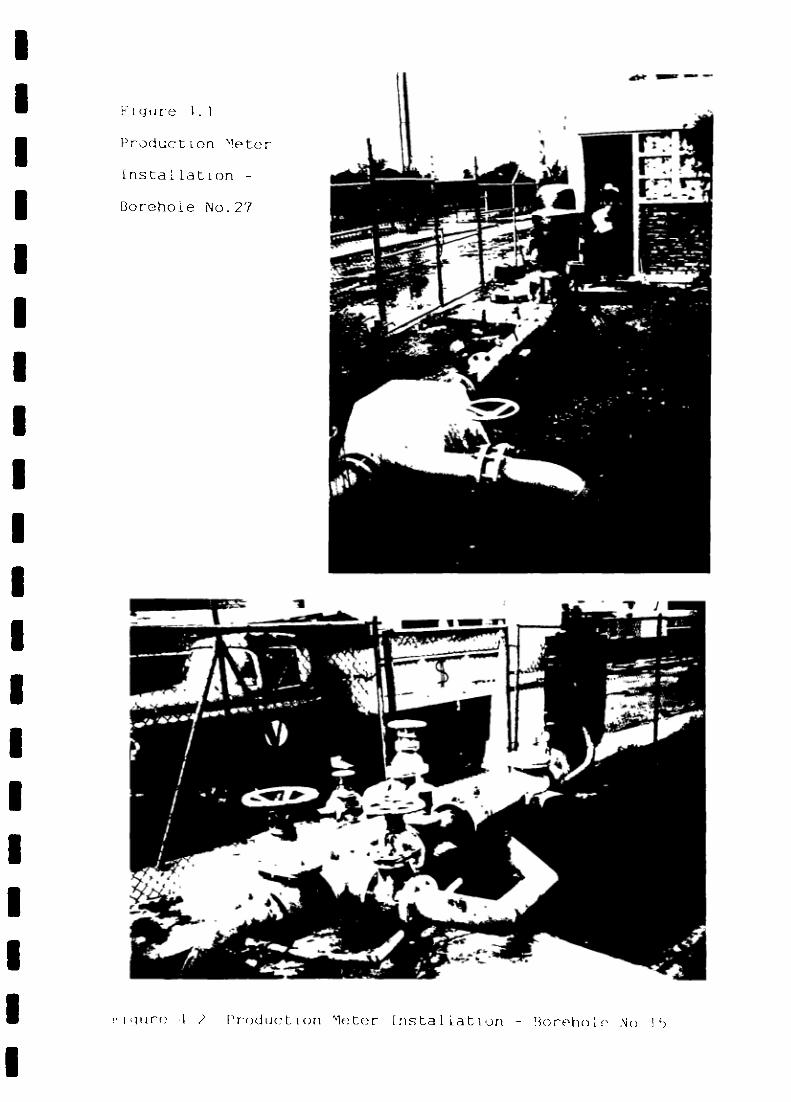
~‘Igure T. 1
Pr~jduct~on ~‘1eter
[nstaLlation -
Borehole No.27
cplrf) 1 2 F’r()dlJC t. ion ~ieter [ ns ta I [at ~ on — F3orE’ho 1 ~‘ No I 5

II
I

- 66 -
Districts should be defined based on information
concerning pressure levels, age of pipes, pipe material,
quality of construction and the frequency and nature of
known breaks (AWWA, 1987). The essential point though is
that each district must be able to be isolated, with flow
entering only through meters, either permanently or
temporarily.
Initially it is suggested that a pilot district
should be identified. The area of the city that is likely
to contain the most leaks is the old centre containing the
oldest pipes. This is also likely to be one of the more
difficult areas to investigate because of the scarcity of
records from times long past, the busy nature of the central
area in terms of traffic and noise and the likelihood of
difficulty in locating underground facilities in an area
that has seen many developments over the years. For these
reasons it would be wise to select an ‘easy’ area for the
pilot district f or training and practising purposes.
The systems lend themselves to being divided into
districts because of the distribution of boreholes across
the city, a recommended initial size is 5000 to 10,000
properties (Jeffcoate and Saravanapavan, 1987) which would
mean the two municipalities having between 15 and 30 such
districts. The consumer registration system is shown in
Figure 4.3 with the number of each region appearing on the
consumer’s bill, as shown in Figure 4.4. There are fifty or
so such regions so a district should encompass 2 or 3
consumer regions.


, ~ \ I~
~! ~
Regions 39,40 and 45do not appear
Source : Ginfos,1991a
Figure 4.3 Plan of Consumer Regions


= ~ —
i—. ~ LlN~TAMIENTODE 5F~NLU!S
_—,. lJ~~fl~ — ~!I~ 6. ~ ~.J.7 a.. ~~713u5
H. AYUNTAMIENTO DE LA CAPITAL DE SAN LUIS POTOSI, S.L.P.DEPARTAMENTO ADMINISTRATIVO DE AGUA POTABLE
11PLAN DE ~AN LOIS
Eli CUENTA MEDIDOR MESES
1Oi~~I—I Xx~XXx~ -
-
I~tUtS~ M~L~ L~~:1~/JIJL~
SR. USUARIO, CON ESTA FECHA LE ESTAMOS LIMITANDO SU SERVICIO DE AGUAPOTABLE BASADOS EN LA LEY DE A~UA,~Y EN EL CODIGO SANITARIO EN VIGORPOR TENER UN ADEUDO DE $ 9”~jO.L’0EN CASO DE QUE AL RECIBIR EL PRESENTE. ESTE CUBIERTO SU ADEUDO LE ROGAMOSDEJAR SIN EFECTU EL MISIvIO AL PRESENTAR DQCUMENTACION 0 PAGOS CORRES-PONDIENTES ~ ~~RT
1Cj~ ~. ~i~ESTRES ADEUDADOS 41.~TENTAMENt~E~DIRECCIONADMINISTRATIVA QEPARTAMENTO DE AGUA P.OTABLE
~ L_II’IuAC.IJr~, LAUS~R~rj~ CAR~3OAOICIONAL D~ ..1U,~UO.OIi
-9 IA?NOTIFICADOR EC~NTR~GAAVISO
Figure 4.4 Water Supply Consumer Registration
~:c ~ Icc ~
192_3 _t9o3~ 40FaC~ALhaT MESES
R9i 02~0~FECHA VENCIMIEN -
04/JUN9jSUS~.L~OANTERIOR
‘ SE~C~ COr.TR~-JC __________________~iIIiiti~i76 .~ j_~2~ 145
NOMBRE
DIRECCION
kANUEL MU
iO~i1___________ ____
PROMED~OM s 9EU SALOC,
ANTERION
-RECARGOS
_______ 9900 49400
L~1-0 r~05CARCOS
- YP~GOC 9~9~~flfl 494flfJ- SUSALOO- NLJEVO
U
__________ / \~-RE~FCO5~ 1 FAVOR
CONSLr.L 1 9600 I PAGAR
ANTES
I - OEL~~
OT~C~0~a- 81M.
_______ ADEUD.—~ 0
o onfl’~\
j.IS U ARIO

II

- 69 -
The district should be selected bearing in mind the
layout of the important mains, as shown in Figure 2.2, and
also that it would be wise to choose a district served by
boreholes with, relatively, long and reliable flow records.
Moreover, the current programme of creation ot monitoring
points throughout the San Luis Potosi system should be
examined to enable the district to be supplied solely
through such a monitoring point.
Finally, the guidelines suggest that an attempt
should be made to correlate consumption meter statistics
with the district boundary.
Bearing the above points in mind a pilot district is
proposed in Figure 4.5. The main features of the district
are illustrated, but pipelines of less than 4” diameter are
omitted for clarity.
The district is in the northern half of the city,
covers consumer regions 16 and 32 and is served by three
boreholes all fitted with flow meters.
Reasons ror selecting this area as an example are as
t 01 lows:
a) [he part of the city north of Avenida Carranza
(regions 1, 4, 14, 26 and north of these — see
Figures 2.2, 4.3 and 4.6) is served primarily from
boreholes whereas the southern part is served from
the long distribution main between San Leonel
reservoir and the treatment plant (Figure 2.2). It
is felt that it would be easier to trace mains from
the boreholes to be able to isolate the district.
Ihe area is or comparatively recent construction.


Legend
cii District
• Borehole with meter
• Borehole without meter
—— — Consumer region boundary
Municipal boundary
.~— 10” main
—•--— 8” main
6” main
~ 4” main


— 71 —
c) It has clear physical boundaries - the Rio Santiago
to the south and the railway line to the north. It
is felt that any mains crossing these clear
boundaries should be more readily detectable than
they would be crossing busy city streets. Figure
4.5 indicates one 6” main entering the district from
the south.
d) The three boreholes are fitted with meters and are
reported to supply about 60 1/s which should provide
adequate water for about 29,000 people or 7,000
households.
e) Some monitoring points have been prepared in the
area but only with adequate mapping and knowledge of
the boundaries of the district will it be known if
these have been well sited. This would need review
at an early stage.
f) Finally there is one area that could be included in
the district at the west end of region 16,
depending upon the nature of connections from the
10” main in that area. This is only presented as an
example but shows that district boundaries may need
correlation with consumer registers.
This selection is not restrictive and it might be
considered prudent for initial investigations and a pilot
district to be started in the industrial area where the
consumers of large quantities of water can often provide
substantial revenue to the water department. Although,


- 72 —
unfortunately at present there is a higher frequency of un—
metered boreholes in this area.
4.2.4 Consumption Meters
A survey of domestic consumption and a sample study
of accuracy or domestic meters is recommended in the
guidelines to compare with quantities determined irom meter
reading to determine the UFW attributable to under—
registration, non—metering, inaccurate metering and illegal
connections.
It must also be borne in mind that experience in
other countries has indicated that meter—reading procedures
can be susceptible to malpractice and this may be a
component of IJFW.
The organization of the city into regions is shown
in Figure 4.3 and a typical bill is shown in Figure 4.4.
The meter reading and billing procedure is carried
out on a bimonthly basis with the fifty or so regions of the
city dealt with in two halves. Half of the regions are
billed for January plus February, March plus April, etc.
while the remainder are billed for February plus March,
April plus May, etc. The meter reading team consists of
twelve men requiring that each man reads approximately 150
meters per day.
The accuracy of meter reading may benefit from a
sample survey and experience gained in the San Luis Potosi
municipality can be applied to the Soledad de Graciano


— 73 —
Sanchez municipality as it begins its programme of consumer
metering.
Perhaps the most important first step however in the
checking of consumption is to identify the high—use
consumers in the district and this should be carried out at
the same time as the checking of the production meters.
4.2.5 Mapping
An essential part or operating a water distribution
system well is the keeping of good records (Lackington,
1988).
Although full detailed large scale mapping of the
distribution system does not exist this does not prevent the
UFW programme from starting. However accurate mapping will
be required for UFW reduction and control to be effective in
the long term.
What is available, for the San Luis Potosi
municipality, is a register of valves ~n the city (TACSA,
jg~p>. ihe records are contained in 4 volumes and consist
of the foLlowing:
a) Inventory of borehole pumps and booster pumps,
motors etc.
b) Inventory of 1639 No. valve boxes, each having a
sheet as presented in Figure 4.6.
c) Plans of the distribution system at the following
scales:


,‘ ~
I
Diciembre 1989. wSource TACSA, 1989
H. AYUNTAMIENTO DEDIRECC/ON TECN/CA
CatastroRed de AquaR-2 -~
CAJA DE VALVULAS No. 1629:
-~
s.L:’~~AG’UA POTABLE~
~
Potable ~
1.25
~.•
Tt._~’°’ •J~Fob
8~
T.~.:*~1.40
.~—-•.,*--~-. —-•
~ ~~r-~~
I’ •~ -‘.r
~
•~—••~-~“--~--:•—•• :“--‘ -‘!~“‘-“‘
:1
- ~Corte-d.-Cajad.-V~vuIas
$: 6 LOSAS EN BUEN ESTADO, I\~LYULA BRIDADA DE •8 ‘EN ~JEN ESTADO.
Figure 4.6 Typical Valve Record Sheet


III
IIIIIIIIIIIIII


— 76 -
1 No. @ 1:20. 000 - showing the city divided into 52 zones
2 No. @ 1:7,500 - showing the city in 2 parts
10 ~4o. @ 1:5,000 — showing the city in 10 parts
42 No. ‘9 1:2,000 - these do not cover the entire city
The combination of the valve sheets and the plans
provide the beginnings of a data base for the system but
they are inadequate in a number of areas:
a) The 42 plans do not coincide with the 50 consumer
regions that the city is divided into.
b) The 42 plans are only available as prints, not as
transparencies which would be preferred.
c) The valves have been numbered sequentially from 1 to
1639, although each valve sheet has a region number
e.g. R-2 on Figure 4.6, the plans only show the
sequential valve number. It would have been
preferable to number the valves sequentially within
regions.
d) [he plans and valve sheets have no inrormation on
levels. Although the city is relatively flat this
information is necessary for any future network
analysis.
e) The plans do not show sufficient details of
pipelines. Figure 4.7 shows an area around one of
the boreholes but there is little information about
the system in an area that must contain other
junctions and appurtenances.
t) There is no inrormation recorded on the plans
regarding the pipe meterial.

I
I
I

— 77 —
Adequate mapping of the urban area at a scale of
1:1000 on 226 No. sheets with levels is available at the
Direccion General de Catastro (General Department of Land
Registry.. It is therefore recommended that any remapping be
carried out using transparencies at this scale. With valves
numbered sequentially within each district as defined in
Section 4.2.3 above. As mapping of the Soledad de Graciano
Sanchez area commences, the above mentioned deficiencies
should be avoided.
4.2.6 Method of Leakage Control
There are dirterent methods leakage control that can
be adopted (WAA, 1985), the World Bank guidelines start with
district metering. For the steps outlined in Sections 4.2.1
to 4.2.5 a team should be created from within the water
supply section of the new organization and much of the work
required will mesh with the routine tasks of the staff.
Additional efforts will be required however and many
of these will take place in the field.
The first requirements will be for a review of the
existing arrangement for leak detection and procedures for
reporting and making repairs. (Jeffcoate and Saravanapavan,
1987). Only passive leak detection is carried out at
present and it is not known how effective this is.
As in any project there will be a need for plant,
labour and materials. It is not known what equipment is
currently used or available, it is felt that stethoscopes

II

‘is -
should be used initially for soundings as they are a cheap,
robust and reliable instrument. (W,4A, 1985).
The manpower required will depend upon the need for
quick results. The guidelines (Jeffcoate and Saravanapavan,
1987) suggest a team of one inspector and one assistant can
perform 100 soundings per day. For the pilot district of
say 7,000 properties, 70 team—days would be required, say 3
teams occupied for about 5 weeks. The rate of sounding is
similar to the rate of meter reading (see Section 4.2.4) and
it is suggested that the sounding teams should cover the
district with the meter readers which will help in location
of service connections and finding stop—taps. It is also
suggested that a policy of involving the borehole watchman
in these teams be considered. By providing suitable
incentives he can be encouraged to have greater
responsibility for the immediate vicinity and become an
important link in the consumer/department relationship.
Finally, material requirements must be assessed.
There is little point in locating leaks to facilitate UFW
control if they are not repaired. A stocktake of repair
material should be undertaken at art early stage in the
programme and deficiencies remedied as best as possible.
Suitable training in all areas will be required but
initially the technical skills required are not too high and
not beyond the scope of the current workforce. With
suitable planning and managing) a pilot district should be
able to provide positive results which will be replicable
across the whole of the distribution systems.

— — — — — — — — — — — — — — — —

- 79 —
4.2.7 Use of Computers
Although sophisticated network analysis is not
expected at an early stage any data collation must be
planned accordingly to ensure sufficient information is
available.
Simple data bases will undoubtedly be required to
maintain records and registers.
As far as network analysis is concerned the
following information is required:
a) Pipes — material, age, condition, diameter, length,
friction coefficient (the Hazen—Williams ‘c’ value
or the effective roughness ‘k’ for the Colebrook—
White formula depending upon the program to be
used).
b) Nodes, i.e. junctions — ground elevations at the
node and at the highest and lowest ground supplied
from the node, demands at the node and supplies at
the node.
c) Sources, i.e. reservoirs — top and bottom water
levels, plan areas, elevation/storage character-
istics and inlet float valve details.
d) Pumping stations — head, flow and power
characteristics.
e) Other appurtenances — pressure reducing valves, non—
return valves, pressure sustaining valves, break
pressure tanks etc.
f) Demands — groups of consumers, individual consumers,
diurnal variations and peaking factors.

a a II. IU — — — — — — — —

so —
Some of this information will be readily available
or easily obtained, other may be more difficult to obtain.
As suggested in Section 4.1 involvement of the University
would be useful, ror instance using the hydraulics
laboratory to assess rriction coefficients of pipes.
4.2.8 Programme Implementation
The use of a programme of reduction and control of
unaccounted—for water has been proposed f or the water supply
section of the proposed single institution. Its aim is to
assist in developing and strengthening the institution in
key areas.
It would be possible to identify a similar project
for the sanitation section, perhaps a sewer survey followed
by an impermeable area survey leading to a Drainage Area
Plan tor the city. As in the UFW control project the
building or an adequate data base of the existing system is
perhaps the most vital task to be accomplished.
Neither of the ideas, UFW control or a sewer survey,
require great technical ability nor extensive financial or
material resources, merely the will to do it and managerial
skill to see them through.
There is also the possibility of assistance being
available through the current involvement of the British
Overseas Development Administration (ODA. As mentioned in
Section 2.6. SEDUE are currently implementing the
construction of two wastewater treatment plants and the ODA
have commissioned a tirm or Lonsulting Engineers to provide

— — — — — — — — — — — — — — — — — — — —
— 81 —
technical support in a number of areas. One aspect of this
support will be in the area of control of wastage of water.
It is perhaps through this arrangement that the
impetus for the programme can be found. The consultant
should be able to provide training for an adequate number of
local staff and likewise the institution should find a
sufficient number of motivated employees.
The external nature of the consultant might also
enable it to apply itself to the problem of lack of records
and retention of local knowledge of key operations.


- 82 —
I
-c::i~.U~ I QN~ A~N]D
(~C) I’LM~ ~ I) A~ 1 I C)N~
5. 1 Conclusions
Rapid industrialization and a fast growing
population are placing greater burdens upon the water supply
and wastewaster disposal systems of the urban areas of the
San Luis Potosi and Soledad de Graciano Sanchez
municipalities.
The deep aquifer that provides 93% of the water
supply is being mined at current rates of extraction and
insanitary methods of wastewater disposal are creating
environmental and public health hazards.
There are several existing organizations connected
with the water sector in the two adjacent municipalities but
the boundaries between their responsibilities, involvements
and interests are blurred. This is not conducive to
managing the system effectively.
The key organizations themselves are lacking in
performance In some areas and specifically their dearth of
adequate records and limited detailed knowledge of the
systems’ characteristics ln.hibit effective operation.
The future developments likely to occur are not only
going to place increasing pressure on the systems and the
organizations but they are also going to produce a single
urban area out of the two municipalities (if they have not
done so already)


— 83 -
This observation combined with the knowledge that
(i there is one important water resource at present (ii) a
future source of water is more than likely to be developed
uniquely for the whole of the urban population and (iii) the
environmental and public health hazards affect everybody,
lead to the most important conclusion and recommendation
that the existing organizations involved in providIng water
supply and sanitation services to the two municipalities be
merged to form a single institution.
5.2 Recommendations
In addition to the main recommendation above
proposing the creation of a single institution for the water
sector in San Luis Potosi other specific recommendatIons
arise from this report. These are summarised below.
An institutional development programme should be
introduced, based on existing committed managers and the
proposed restructuring, to improve the systems and
procedures in use, the human resources available and the
existing physical resources.
The institutional development programme proposed has
been limited in this report to one area — a programme for
the reduction and control of unaccounted—for water.
Examples of how the existing facilities and resources can be
used have been presented and recommendations specific to
those items are contained in Chapter 4.
It is suggested however that the following main
ideas be adopted by the water supply section:

II

34.
a) Obtain a copy/copies of the World Bank Working
Guidelines for Unaccounted—for Water, in Spanish.
cfeflcoate and Saravanapavan, l987~ (See Appendix
D’.
b) Obtain a copy/copies of the World Bank Working
Guidelines for Large Water Meters (feficoate and
Fond, 1989) (See Appendix D).
c) Review domestic consumption rates, especially in the
light of the CNA national campaign for the control
of wastage and efficient use of water.
d) Introduce the concept of districts to the system and
co—ordinate domestic meter records with them as
necessary.
e) Improve mapping of the distribution system and
generally strengthen the record keeping.
f) Obtain water distribution network analysis computer
programs such as those promoted by the World Bank.
(See Appendix D for details).
g) Introduce the concept of Performance Indicators in
appropriate areas as a management aid.
h) Record on plans the location and details of leaks,
bursts and repairs in the water distribution system.
This report has dealt primarily with the situation
pertaining in the urban area of the two existing
municipalities. It was recommended in Section 3.3 that the
single institution absorb the rural water supply and
sanitation body, the JEAPA. The existing municipal bodies
are responsible for their own rural areas and it is


- 85 -
therefore recommended that the extent or the coverage of the
proposed single institution be reviewed at state level with
reference to the CNA.
The creation of a single body to manage all aspects
of the water cycle in and around San Luis Potosi is
recommended. Specific recommendations have been formulated
to identify areas where the new institution can develop from
the existing resource base.
It is hoped that with those ideas the seemingly
great problem racing the city as regards its water supply
and wastewater disposal can be overcome by means of
effective management and sound engineering as San Luis
Potosi celebrates its 400th anniversary in l~92.
5.3 Achievements of the Project
The true achievements of this project will only
become apparent with time. It is the responsibility of the
parties concerned to adopt in part or in full any of the
main recommendations or other suggestions made in the
report.
The views expressed are the author’s personal ones
and are made from the position of an external observer.
rhis naturally has its benefits and its limitations. The
author wishes to emphasise the acknowledgement of those
organizations that opened their doors to him and accepted
his questioning.
The field trip provided invaluable experience -
visiting a formerly unknown area, conducting a study with


- 86 -
minimal back-up and attempting this within an unfamiliar
culture and using a different language.
It is felt that the proposals for a single
institution and the implementation of a programme for the
reduction and control of unaccounted—for water respond to
the interests expressed in the National Water Commission and
the Drinking Water Departments. The author would be
delighted to discover that the project has contributed to
the future development of San Luis Potosi.


8? -
flRE? ~C~S
American Water Works Association (1987);Leaks in Water Distribution Systems; AWWA, Denver.
BSI (1985);British Standard Code of Practice for BuildingDrainage ES 8301:1985 (Clause b.8); BSI, London.
Cullivan 0., Edwards D.B; McCaffery J; Rosenweig F. andTippett B. (1986);
Guidelines ror institutional Assessment, Water andWastewater Institutions, WASH Technical Report No.37; USAID, Washington.
Durazo J. and Farvolden R.N. (1989);The Groundwater Regime of the Valley of Mexico fromHistoric Evidence and Field Observations; J.Hydrology IIZ (1989), 171—190.
ECLA (1979);Water Management and Environment in Latin America,(Water Development, Supply and Management Vol.12);UN Economic Commission for Latin America, UNEF,Pergamon, Oxford.
Edwards D.B. (1988);Managing institutional Development Projects: Waterand Sanitation Sector, WASH Technical Report No.49;USA1D, Washington
Franceys R.W.A. (1990);Community and Management, course notes; WEDC,Loughborough.
Garduno H. (1985);Interregional Water Transfers in Mexico; fromGolubev G.N. and Biswas A.K. (1985); Large ScaleWater Transfers: Emerging Environmental and SocialExperiences; UNEP; Tycooly Pub. Ltd., Oxford, UK.
Ginfos (1991a);Estudio de Factibilidad Tecnico, Economico yFinanciero del Sistema de Agua Potable yAlcantarillado en San Luis Fotosi, S.L.P; Ginf OsS.A. de C.V., Mexico D.F.
Ginfos (199lb);Estudio de Factibilidad Tecnico, Economico yFinanciero del Sistema de Agua Potable yAlcantarillado en Soledad de Graciano Sanchez,S.L.P; Gintos S.A. de C.V., Mexico D.F.
Gobierno del Estado de San Luis Potosi (1991);Feriodico Oriclal del Estado; SLP.


P.3 -
Hunt S. (1990);Quest for Water; IRDC Reports, October 1990, 8—9.
Instituto Mexicano de Tecnologia del Agua, (1987);Estudio Geohidrologico del Valle de San Luis Potosiy Villa de Reyes; INTA, SARH & UASLP.
IWES (1984);Water Distribution Systems, Water Practice ManualNo.4, Chapter 8; IWES, London.
Jeffcoate P. and Pond R. (1989);Large Water Meters: Guidelines for Selection.Testing and Maintenance, Technical Paper No.111;World Bank, Washington.
Jeffcoate P. and Saravanapavan A. (1987);The Reduction and Control of Unaccounted—for Water,Working Guidelines, Technical Paper No.72; WorldBank, Washington.
Lackington ID. (1988);Solving Distribution Problems, Developing WorldWater, pp. 266—271; WEDC, LUT, Grosvenor PressInternational, Hong Kong.
Lloyd W.J and Marston R.A. (1985);Municipal and Industrial Water Supply in CiudadJuarez, Mexico; Water Resources Bulletin (AWWA) 21/5(1985), pp841-849.
Noriega—Crespo P. (1991);Personal communication.
OFWAT (1990);The Water Industry of England and Wales, Levels ofService Information 1989/90; Office of WaterServices, Birmingham.
Oldcorn R. (1989);Management; MacMillan, Basingstoke.
SEDUE (i988a);Problematica del Agua en San Luis Potosi; SEDUEAudiovisual, San Luis Potosi.
SEDUE (198db);Plan Maestro de Agua; SEDUE, San Luis Potosi.
Shearer D.M. (198b);Pertormance Comparisons Between Water Authorities;J. IWEM a, ppSOO—5O4.
Steel E.W. and McGhee f.J. (1985);Water Supply and Sewerage, Fifth Edition, Chapter 6;McGraw—Hi 11, Singapore.

I

- —
Tecnicos, Asesores y(i9tS9);
Constructores S.A. de C.V. (TACSA)
Estudio Dirigido a Complementar el Catastro Tecnicode la Red de Agua Potable de la Ciudad de San LuisPotosi; TACSA, Mexico.
Trade and Travel Publications Ltd (1988);South American Handbook 1989, chapter ‘Mexico’;Trade and Travel Publications Ltd, London.
UNDP (1987);UNDP Interregional Project INT/81/047: Developmentand Implementation of Low—cost Sanitation InvestmentProjects; World Bank, Washington.
UNICEF (1989);The State of the World’s Children 1989; OxfordUniversity Press, Oxford.
WAA (1985);
WHO (lQao);
Leakage Control Policy andAuthorities Association, London.
Practice; Water
Institutional Development in Community Water Supplyand Sanitation, CWS/86.9; World Health Organization,Geneva.


— 90 -
I would like to thank the following for their
considerable help, support and friendliness during my field
trip to San Luis Potosi.
Secretaria de Desarrollo Urbano y Ecologia
Arq. Pilar t~1oriega-Crespo
Direccion Tecnica de Agua Potable, San Luis Potosi
Ing. Ricardo Garza Blanc, Director Tecnico
Ing. Guillermo Escoto Mauricio
Arturo Salgador Orta
Direccion Adninistrativa de Agua Potable, San Luis Potosi
Lic. Gilberto Estrada Lara, Director Administrativo
Lic. Rodrigo de Artolozaga Noriega
Comision Nacional del Agua
Ing. Martin del Campo
Ing. Manuel Diaz Gonzalez
Ing. Margarita Romero
Ing. Myrna Tapia
Direccion de Obras Publicas, San Luis Potosi
Ing. Francisco de la Rosa Maldonado, Director de Obras
Publ icas

I

- 91 -
Departanento de Agua Potable, Soledad de Graciano Sanchez
Ing. Benito Romero
Universidad Autonona de San Luis Potosi
Ing. David Atisha Castillo, Director, Facultad de Ingenieria
Laboratorio de Hidraulica:
Salvador Martinez Hernandez
Julio Rivera Juarez
Jorge Alberto Rodriguez Robledo
In addition the advice of David Sims, Len Hutton and
Richard Franceys during the project period has been
invaluable and I am grateful to Eileen Kearins for helping
in the production of this report.
Finally I would like to acknowledge the assistance
and support of the tollowing without whom my year at WEDC
would not have been possible:
Bob Reed, my personal tutor, tor advising me to come
to WEDC.
The Overseas Development Administration for the APOS
award.
Sir William Halcrow and Partners Ltd for granting me
leave of absence to undertake the M.Sc.
Stewart Cale, of Knight Piesold and Partners to whom
I am grateful for the interest he has shown in my
career.


~~IBNJD I ~
IIII

II

A.
~ornn.&r I otr ~nos ~cr ioNs
Recent growth rates for Mexico as a whole are 2.2%
overall growth and 3.6% for urban growth (UNICEF, 198g).
The tables overleaf show that San Luis Potosi has a
higher than average growth for Mexico.

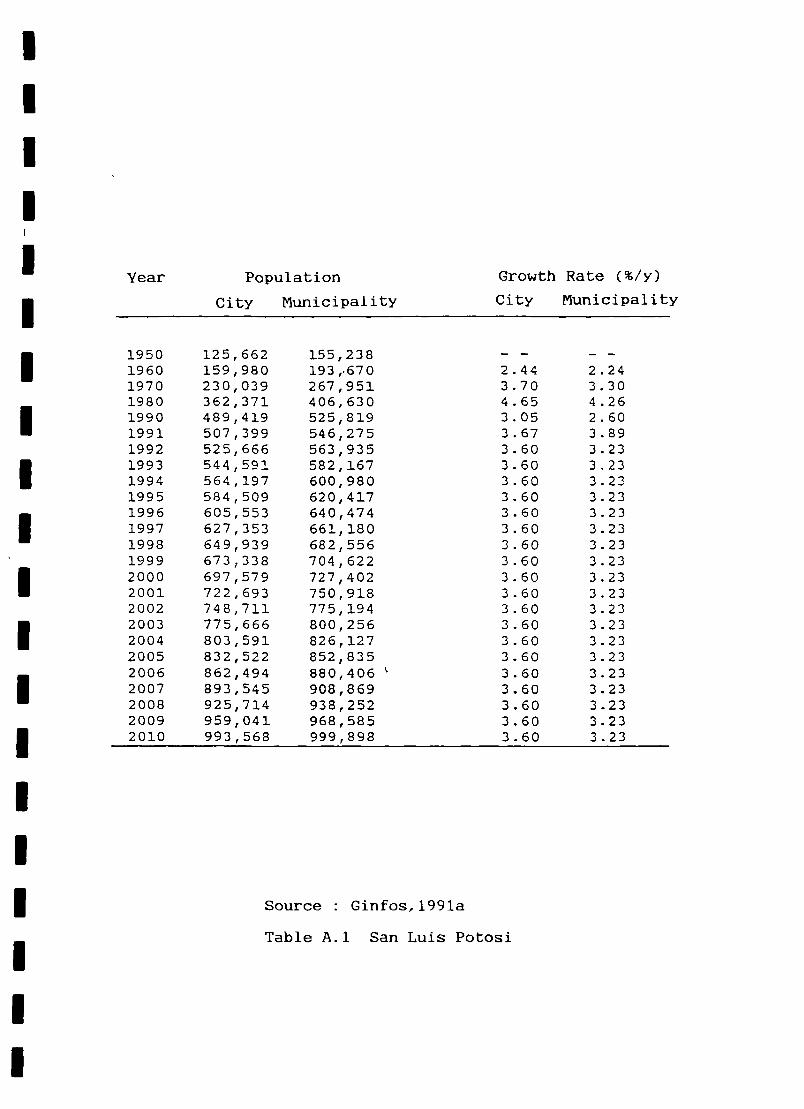
Year Population Growth Rate (~/y)
City Municipality
Source : Ginfos,1991a
City Municipality
1950 125,662 155,238 — — — —
1960 159,980 193,.670 2.44 2.241970 230,039 267,951 3.70 3.301980 362,371 406,630 4.65 4.261990 489,419 525,819 3.05 2.601991 507,399 546,275 3.67 3.891992 525,666 563,935 3.60 3.231993 544,591 582,167 3.60 3.231994 564,197 600,980 3.60 3.231995 584,509 620,417 3.60 3.231996 605,553 640,474 3.60 3.231997 627,353 661,180 3.60 3.231998 649,939 682,556 3.60 3.231999 673,338 704,622 3.60 3.232000 697,579 727,402 3.60 3.232001 722,693 750,918 3.60 3.232002 748,711 775,194 3.60 3.232003 775,666 800,256 3.60 3.232004 803,591 826,127 3.60 3.232005 832,522 852,835 3.60 3.232006 862,494 880,406 ‘ 3.60 3.232007 893,545 908,869 3.60 3.232008 925,714 938,252 3.60 3.232009 959,041 968,585 3.60 3.232010 993,568 999,898 3.60 3.23
Table A.1 San Luis Potosi


Year
i. ~ 51
199i1 99?1. 991
1 ~
1 ~
151111
I_I I_1 —.
I: 0-. iI 5 C
11:1
Cl c1
Source Ginfos,1991b
Population
1 i: .
i:e. o’:’o133. :~io1.4’:’, i. ~
146. 9741532.32
1 60 , 806167. 72]174. 592181 .407188. 11?194 . 7i:’3:oi, :c3207 947214. 421221.27~227,692234. 062240.244. 43
52. Cn3
City
Growth Rate (%/y)
c
4.?.i ~:4.54.I I
S
7
:~. 4
3. 1
_.
Table A.2 Soledad de Graciano Sanchez

II

APPSNfl I DC S
— WAP~& s:en-~r tA.flIFF’ s-rnuc-rtJR~
NService Affordability
~
The current (1991) tariff structure for the San Luis
\potosi municipality water supply is shown on the following
average consumption = 177 l/c.d
average household = 4. 18 persons
2-monthly household consumption = 177 x 4.18 x 60 +
1000 = 44 m’s’
2—monthly water bill = $ 550 x 44 = £ 24,200
minimum daily wage = £ 9865
(Noriega-Crespo, 1991)
2—monthly household income, assuming 2 wage earners
= $9865 x 2 x 5/7 x 60
= £ 846,000
Service affordability = 24200/846000 x 100
= 2.9% of minimum wage


Variable Tariffs Fixed Tariffs
1.—SERVICIO DOMESTICO:
a).— 0 — 10b).—~’ 10.01 — 2~c).— 2.0.21— 30d).— 30.01 — 40
e).— 40.01 — 50
f).— 50.01 — 100g).— 100.01 en adelante
2.—SERVICIO COMERCIAL:
a).—. 0—
b).— 10.01c).— 20.014—
30.01—e).-~f).J;~ ~50.OI~-~
•100.0~I 250.01 —
1).—~~50O.O1j).—1,000.OJ —
k).—2;500.0i
3.-SER\~IC1O INDUSTRIAL:
a).—~ ~O~— 2Yb).—~ ;26 — 50c).— 51— 100d).-~- ~01— 250c).— 251— 500f).-.-’ 501 — 1.00()g).— 1.001 — 2,500
h~.— 201 en adclane
lrnporte por M3
$ 35000$ 40000$ 450.00$ 500.00$ 550.00$ 600.00$ 700.00
~ 700.00$ 750.00$ 800.00$ 850.00
$ 900.00
S 950.00$ 1,000.00
$ 1.100-30
$ 1,200.00$ 1,300.00
$ 1,400.00
$ 900.00$ 1,050.00$ 1,100.00$ 1,200.00
S 1,300.00$ 1,400.00.S 1,500.00$ 1,700.00
~).—Prlzneza(zona residcncial)b) .—Segundac).—Tercera
SERV1CIO CO1’~1ERCIAL:
a).—Est2nquillosy pequeñosb).—~ornerciosruedianosc).—Grsmdes cornercios
SERV1CLO INDUSTRIAL:
2)~—Pequenas industrias
b).—Medianas industrias
c).—.Grandcs industrias-Serviclo 1i~duswa1 especial
$ 30,000.00$ 12,000.00$ 7,000.00
comercios $ 20,000.00$ 80,000.00.1 100,000.00
$ 40,000.00
• S 80,000.005 260,000.00$ 350,000.00
a).— 0— 50
b).— 51.— 100
lOL— 500
501 — 1,000
1,001 — 2,500
2,501 en adelante
$ 1,000.0(1
$ 1,200.00
5 1,400.00$ 1,600.00
$ 1,800.00
$ 2,000.00
Birnestral SERVIcIO DOM.ESTICO:
10
203040
50
100250500
11000
2,5005,000
4.—SERVICIO INI)USTRIAL ESPECIAL:
c).-,.
d )e)
f)—
Source Gobierno del Estado de San Luis Potosi, 1991
Table B.1 Water Supply Tariff Structure


aP’E~Rfln I X C
onoan i zair I 0& CflA.flrs OP’
ax x s-r i no n~ricerrs
The three organization charts shown overleaf relate
to the San Luis Potosi municipality drinking water
department. It was not clear which one had precedence over
the others.

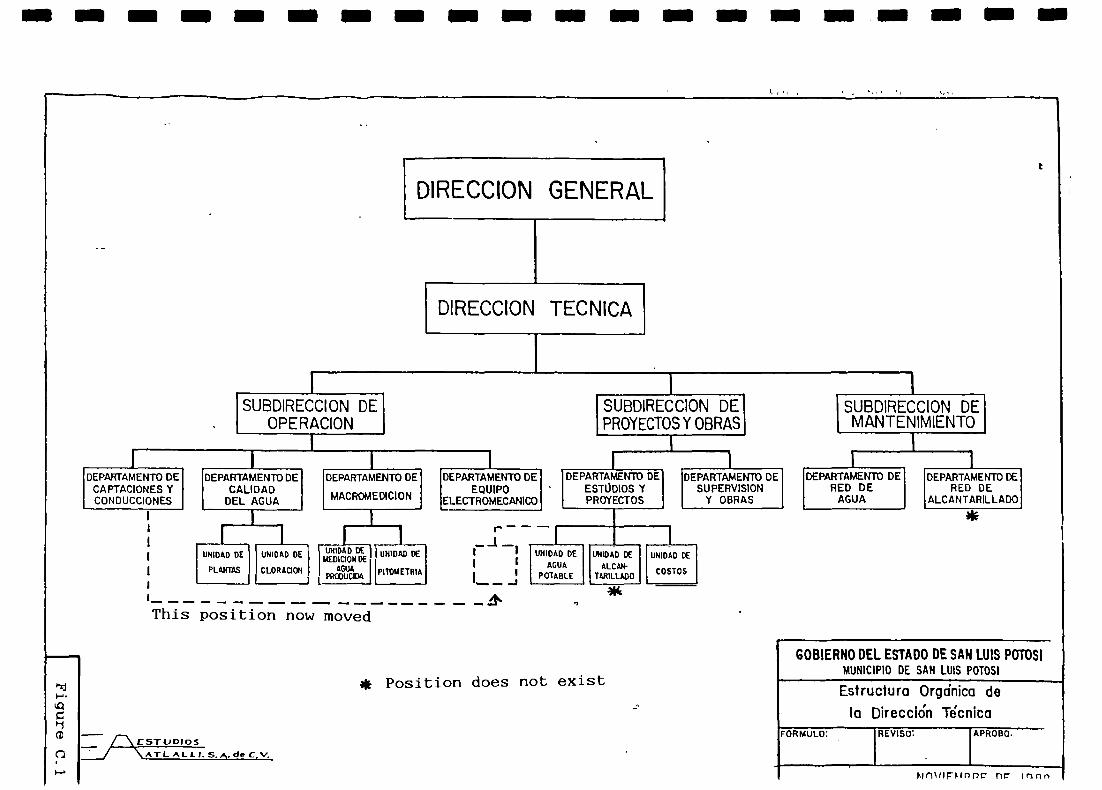
— — — — — — — — — — — — — — — — — — —
DEPARTAMEN1D DEESTUDIOS YPROYECTOS
___ I IIL~IIIDAD DE I 1UNIDAD t( II AGUA Ii AICA* I
POTABLE TARILLADO ( ~ I*
GOSIERNO DEL ESTADODE SAPI LUIS POTOSI
HUNICIPID DE SAN LUIS
Estructura Orgdnica de
Ia Direccl6n T~cnica
SUBDIRECCION DEPROYECTOSY OBRAS
SUBDIRECCION DEMANTENIM IENTO
UNlOAD DE ~ UNlOAD DE I UNlOAD Ut (uNIDAD UtI MEDIOONDEPLANTAS I I CLORACION J AGUA
F~COUCIDA
DEPARTAMENTO DESUPERVISION
Y OBRAS
L_i
DEPARTAMENTO DERED DE
AGUA
- - -~
I-..
IICDCD /LZ~Z. ~. ~. ... ~.
* Position does not exist
FORMULO: REVISO:
r~r- r~s)r)

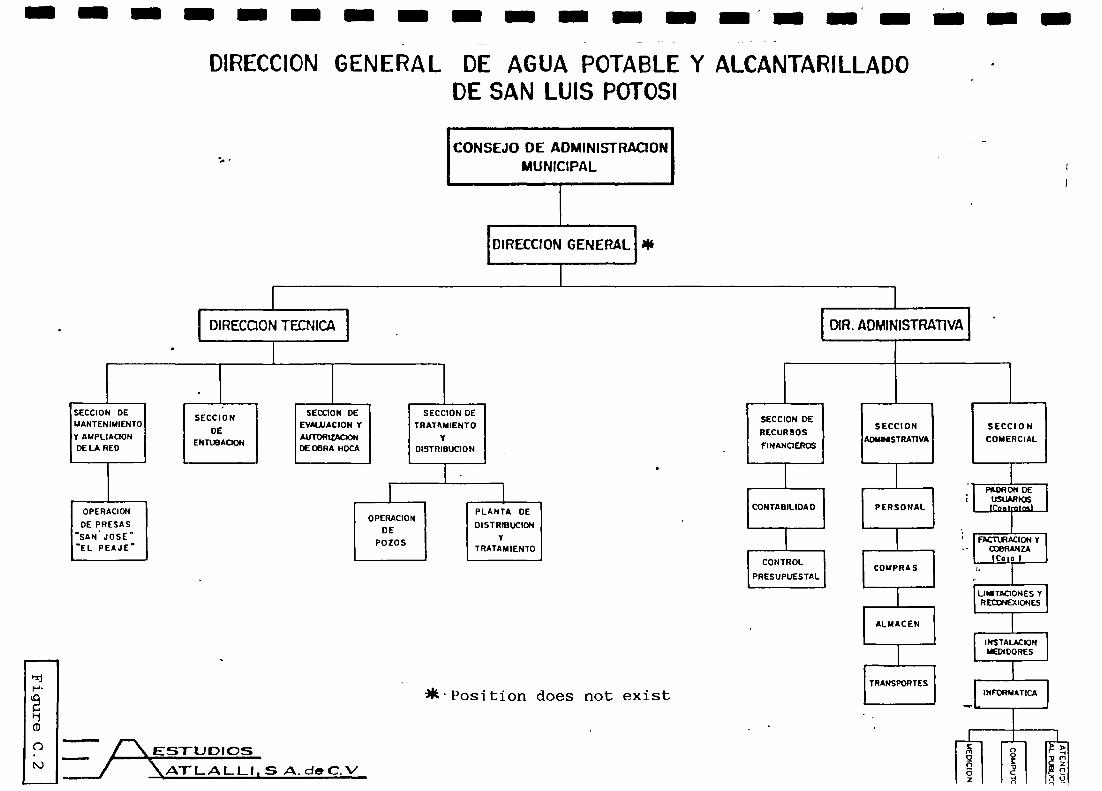
— — — — — — — — — — — — — —. — — — — — —
DIRECCION GENERAL DE AGUA POTABLE Y ALCANTARILLADODE SAN LUIS POTOSI
I II PLANTA o~ II OPERACIOF4 I II DISTRIBUCION II DE I i II Y I
Poros I____________ TRATAMIENTO]
_. f\ESTUDIOS
*Posjtion does not exist
\AyLALLI,S A.d~C.V


— — — — — — — — — — — — — — — — — — — —
RE GISTRO Y EVALUACIONDEL MANTOACUIFERO
CONTROLDE PRODUCC ION VDISTRIBUCION DEL SISTEMA
MAPITENIMIENTO
MACROMEDIDORES
I SUBDIRECCION GENERAL DE PLANEACIONINGENIERIA Y CONTROL DE OBRA I
SECCION TECNOLOGICA DE ANALISISY ESTUDIOS HIDRAULICOS DEL SISTENA
ING. GUILLERMO ESCOTO MAURICIO
UN1DAD DE ESTUDIOS HIDRAULICOS
II
11
RECARGAJ
II
I~T~CCIO~h1
IIRECUPERACIONI
IANALISIS DE INFORMACION
PRUEBASDE CAMPO
EVALUACIONDE FLUJOS
I CONFIGURACION ANALITICA
[DIAGNOSTICO F
I
I-”
IICD
9(A)
FALLASY A JUST~!j
I
I MODELO H~DROLOGICODEL MANTO ACUIFERO
ANALISIS DE INFORMACION]
I DIAGNOSTICOI
BANCODE DATOS


Aees1qn i )C n
A.I~nflBsSas ~‘on o:sr.a i t~a~i &o
iota. r a & I a.L.
D.1 World Bank Publications:
I NFOTEC
San Fernando No.37
Col. Toriello Guerre
Thalpan
Mexico D.F.
D.2 World Bank Computer Programs:
Carlo Rietveld
Sr. Engineer, Technology Advisory Group
Water and Urban Technologies and Assessment
Infrastructure Department
UMDP Interregional Project INT/81/047
at The World Bank
1818 H Street LW.
Washington
D.C. 20433
U. S. A.
The programs are available free of charge, the
following sheets give details of the 10 computer programs
and system requirements.


D.3 Other Computer Programs:
In Britain the following programs are produced by
the Water Research Centre:
WATNET - Water Network Analysis
WASSP - Wallingtord. Storm Sewer Package and
the address for further information
is
WRC Swindon,
P0 Box 85,
Frankland Road,
Blagrove,
Swindon,
Wiltshire SN5 8YR
England


TechnologyAdvisoryGroup
UNDP interregional Project INT/81/047: Development and implementation of Low-cost Sanitation Investment ProjectsExecuting AgencyTHE WORLD BANK1818 H StreetN W.Washington. D.C. 20433. U.S.A.
PROGRAM DESCRIPTIONS FORM B
Divider DisketteNumber Number Description
The micrOcomputer programs package contains programs on network design, financial screen-ing and statistical analysis as well as supplementary programsNetworkDesignPrograms -
1 1 BRANCH uses a linear programming algorithm and the Hazen-Wittiams flow equation for theoptimal least-cost design of branched water distribution networks It handles up to 50 pipes. 51nodes and 9 candidate pipe diameters, as well as muttiple sources, existing pipes, and capacityexpansion with parallel pipes. It calculates pipe diameters, hydraulic information, and Costs Theprogram is menu driven with direct on-screen entry and editing of data It is provided in compiledBASIC form to speed program execution time
2 1 LOOP uses Hardy-Cross analysis and the Hazen-Williams flow equation to simulate flows inlooped water distribution networks It enables the engineer to quickly search among severalalternative designs and easily find a very good or even optimal design II handles up to 500 pipes.400 nodes as well as multiple sources with fixed flows or fixed hydraulic gradients, it does nothandle booster pumping stations or pressure regulating valves It includes a cost-analysissubroutine The program is menu driven with direct on-screen entry and editing of data It isprovided in compiled BASIC form to speed program execution time
3 1 SEWER uses heuristic programming and the Manning flow equation tor th2 optimal design ofgravity sanitary sewer systems It is suitable for the design of small bore sewers as well aslarge-diameter conventional sewers and handles up to 100 pipes and 101 nodes The user mustselect candidate pipe sizes for which the program calculates slopes, vertical aliQnments,hydraulic gradients, velocities and similar characteristics The program is menu driven andwritten in BASIC It is provided in compiled basic to speed program execution time
4 2 FLOW uses a variation of Newton-Raphsons melhod for solving a system of non-linear equationsand either the Hazen-Williams or Manning flow equations (selected by the user) to simulate flowsin looped water distribution networks The program is particularly appropriate for designingnetworks for large cities It handles up to 500 pipes and 500 nodes as welt as multiple sourcesbooster stations, and pressure regulating valves Data entry musl be done through a separatetext editor ttis provided in compiled FORTRAN lorm to speed program execution timeFinancial Screening Program
5 3 SCREEN calculates the construction and equivalent annual costs of a proposed water systemdesign. Based on community data supplied by the user, it produces several indicators of protectaffordability The program is menu driven and written in BASIC
Statistical Analysis Program6 1 REGRESS is a multiple linear regression program that estimates the best fit linear model for data
provided by the user It handles data transformations and outputs, and calculates parameterestimates, correlation coefficients, I and F tests, scatter plots, prediction and confidence intervals,and residuals The program is menu driven and is written in BASIC It is provided in compiledbasic to speed up execution time
(~A joint United Nations Development Programmeand World yank contribution to theINTERNATIONAL DRINKING WATER SUPPLY AND SANITATION DECADE

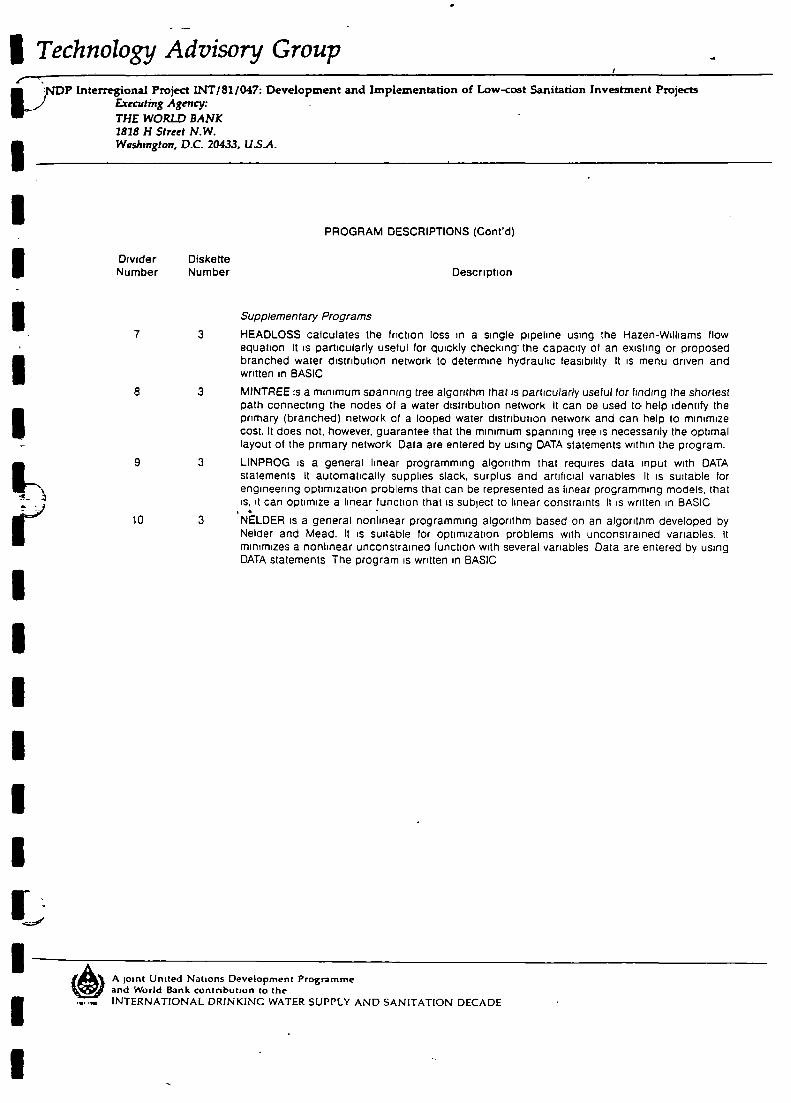
I TechnologyAdvisoryGroup
I ND? lnterregional Project 1NT1811047: Developmentand Implementation of Low-costSanitationInvestment Projects) ExecutingAgency: -
THE WORWBANK1818 H Street N.W.Washmgton,D.C. 20433,U.S.A.
7 3 HEADLOSS calculates the friction loss in a single pipeline using the Hazen-Williams flowequation It is particularly useful for quickly checking’ the capacity of an existing or proposedbranched water distribution network to determine hydraulic feasibility It is menu driven andwritten in BASIC
3 MINTREE is a minimum spanning tree algorithm that is particularly useful for finding the shortestpath connecting the nodes of a water distribution network It can be used t~help identify theprimary (branched) network of a looped water distribution network and can help to minimizecost, It does not, however, guarantee that the minimum spanning tree is necessarily the optimallayout of the primary network Data are entered by using DATA statements within the program.
9 3 LINPROG is a general linear programming algorithm that requires data input with DATAstatements It automatically supplies slack, surplus and artificial variables It is suitable forengineering optimization problems that can be represented as linear programming models, thatis, i( can optimize a linear function that is subtect to linear constraints It is written in BASIC
10 3 NELDER is a general nonlinear programming algorithm based on an algorithm developed byNelder and Mead. It is suitable for optimization problems with unconstrained variables. Itminimizes a nonlinear unconstrained function with several variables Data are entered by usingDATA statements The program is written in BASIC
(~)A1oint United Nattons Development Programme
and World Bank contribution to theINTERNATIONAL DRINKING WATER SUPPLY AND SANITATION DECADE
PROGRAM DESCRIPTIONS (Cont’d)
Divider Diskette
Number Number Description
Supplementas-y Programs
8


TechnologyAdvisoryGroup
PROGRAM SYSTEM REQUIREMENTS
Hardware
1 All programs are designed to run on the IBM Personal Computer (IBM/PC) and compatible microcomputers
2 The programs for “BRANCH”. “LOOP,” and “FLOW” require 256K Random Access Memory (RAM), white the otherprograms require only 128K RAM.
3. The microcomputer should be equipped with at least one floppy disk-drive, monochrome or color monitor, andparallel printer
4 Graphics capability is not required for any of the programs, although graphics are supported by the program
“REGRESS”
Software:1 The programs and data files are recorded on three 5-1/4 inch double-sided diskettes for PC-DOS version 1 0 andabove.2 The uncompited programs in BASIC must be used with an IBM/PC or compatible version of BASIC
3 ‘The FORTRAN program “FLOW” cannot be modified by the user without a FORTRAN compiler
4 The compiled programs “LOOP:’ “BRANCH” “SEWER,” and “REGRESS” can be run directly from PC-DOS orMS-DOS BASIC is not necessary
NOTEThe programs currently available will not run on other types of micro-computers A user may wish to transfer theprograms onto suitable diskettes for other microcomputers by entering the program listings of the uncompiled versionsinto the computer manually and making any necessary changes for its version of BASIC or FORTRAN
UNDPInterregional Project INT/81/047:Development and Itnpiementatton of Low-costSanitationInvestmentProjectsExecutingAgency.THE WORLDBANK1878H Street N.W.Washington. D.C. 20433. U.S.A.
FORM C
$$
p
(~A loint United Nations Development Programmeand World Bank contribution to theINTERNATIONAL DRINKING WATER SUPPLY AND SANITATION DECADE


