43
ASIAN CENTURY FUTURES INITIATIVE 2016 ASIA FUTURE FELLOWS PROGRAM FOR UNDERGRADUATES – ESSAYS Regional Outlook Paper: No. 52, 2017
ASIAN CENTURY FUTURES INITIATIVE 2016 ASIA FUTURE FELLOWS PROGRAM FOR UNDERGRADUATES – ESSAYS
Regional Outlook Paper: No. 52, 2017

Griffith Asia Institute
Regional Outlook
Asian Century Futures Initiative: 2016 Asia Future Fellows program for
undergraduates – Essays

The Australia-China Trade and Investment Relationship
ii Regional Outlook
About the Griffith Asia Institute
The Griffith Asia Institute produces innovative, interdisciplinary research on key developments in the politics, economics, societies and cultures of Asia and the South Pacific.
By promoting knowledge of Australia’s changing region and its importance to our future, the Griffith Asia Institute seeks to inform and foster academic scholarship, public awareness and considered and responsive policy making. The Institute’s work builds on a 40 year Griffith University tradition of providing cutting-edge research on issues of contemporary significance in the region. Griffith was the first University in the country to offer Asian Studies to undergraduate students and remains a pioneer in this field. This strong history means that today’s Institute can draw on the expertise of some 50 Asia–Pacific focused academics from many disciplines across the university. The Griffith Asia Institute’s ‘Regional Outlook’ papers publish the Institute’s cutting edge, policy-relevant research on Australia and its regional environment. They are intended as working papers only. The texts of published papers and the titles of upcoming publications can be found on the Institute’s website: www.griffith.edu.au/asiainstitute “Asian Century Futures Initiative: 2016 Asia Future Fellows program for undergraduates – Essays”, Regional Outlook Paper No. 52, 2017
Asian Century Futures Initiative Griffith University was established over 40 years ago with a strong focus on the Asian region as one of its founding principles. We were the first university to develop and offer a degree in Modern Asian Studies and many of our discipline areas are heavily engaged in Asia-relevant research. In our short history we have forged successful partnerships with some of the region’s premier institutions. We have established significant research collaboration with key institutions, particularly in China, with partnerships in environment/water sciences, nanotechnology, material science, medical sciences, and social sciences. Given this historical commitment, Griffith is ideally placed geographically and intellectually to capitalise on the dramatic shift of economic power to the Asian region in recent years. Preparing for and adjusting to this change, will make considerable political, economic and social demands on Australians and universities have a key role to play in assisting the process. Griffith University is committed to continue making a substantial contribution to the education and development of an Asia-capable Australia and to be a thought leader in more deeply engaging the countries of Asia. The Griffith Asian Century Futures Initiative is the University’s strategic commitment to enhancing our engagement with Asia and the near Pacific and to consolidate our reputation as one of Australia’s most Asia-engaged universities. The Griffith Asia Institute has been successfully leading the Asia agenda through our series of high profile Dialogue events in partnerships with government, universities, industry, and leading international think tanks.

Regional Outlook iii
Contents Introduction ................................................................................................................................................. 4 1. The Australia-China Trade and Investment Relationship ....................................................... 2
Introduction........................................................................................................................................... 2 Advent of the Bretton Woods System ........................................................................................ 2 The Redemption of Neo-liberalism ............................................................................................... 3 The Emergence of the Australia-China Relationship ............................................................... 4 The Current State of the Australia-China Relationship .......................................................... 7 Reform and Development of the Chinese Economy ............................................................... 9 Trade, GDP and the GFC ............................................................................................................... 11 China’s Response to the GFC ....................................................................................................... 11 Australia’s Response to the GFC ................................................................................................. 12 Evaluation and Analysis .................................................................................................................. 13 Conclusion .......................................................................................................................................... 15 Bibliography ........................................................................................................................................ 15
2. A Comparative Study of the Accessibility and Quality of Public Healthcare Services in Rural and Urban Regions of China and Australia ................................................................ 22 Introduction........................................................................................................................................ 22 Availability ........................................................................................................................................... 22 Accessibility ........................................................................................................................................ 23 Affordability (Insurance Policies) ................................................................................................ 25 Summary ............................................................................................................................................. 26 Conclusion .......................................................................................................................................... 28 Bibliography ........................................................................................................................................ 28
3. Education Inequality: A Comparison of Urban and Rural Primary Schools in China and Australia ...................................................................................................................................... 31 Introduction........................................................................................................................................ 31 Background ........................................................................................................................................ 31 Education Systems .......................................................................................................................... 32 Indicators of Quality Education.................................................................................................... 32 Australia: Rural Versus Urban ....................................................................................................... 33 China: Rural Versus Urban ............................................................................................................. 34 The Future of Education Equality ................................................................................................ 35 The Future of Education in Australia .......................................................................................... 36 The Future of Education in China ................................................................................................ 36 Conclusion .......................................................................................................................................... 36 Bibliography ........................................................................................................................................ 37

The Australia-China Trade and Investment Relationship
iv Regional Outlook
Introduction
Building on the success of the 2009–2013 Australia China Futures Dialogues, The Griffith Asia Institute, Griffith University and the Office of International Relations and the Centre for Australian Studies, Peking University have committed to the development of a new ‘Asian Century Futures Initiative’ to deepen intellectual cooperation between the two institutions and to contribute to the improvement of the Sino–Australian relationship in the twenty-first century. As part of the Asian Century Futures Initiative, Griffith University and Peking University have established the Asia Future Fellows Program for Undergraduates. This program follows on from the successful ‘Australia–China Future Dialogues Emerging Leaders’ Dialogues’. It aims to enhance opportunities for Griffith and Peking University undergraduate students to enrich their studies, experience a different culture, and make personal and future professional connections. The program comprises 20 Asia Future Fellows, ten undergraduate students from each university. It consists of two one-week sessions, the first held in Brisbane and the second in Beijing. Both sessions involve a range of activities for all Fellows, including seminars, government and industry briefings and cultural activities. The Asia Future Fellows concluded the Brisbane session by forming groups to write a paper that they worked on and presented at the second session held in Beijing. Each group consisted of two students from Peking University and two from Griffith University. This group work provided cross-cultural work experience that also fostered friendship by ensuring regular contact among group members throughout the year. The reader should keep in mind that these essays are written by undergraduate students, and some of whom are non-native English speakers. For some essays, each group member has written a part of the essay. The students’ essays follow.
The Australia-China Trade and Investment Relationship
2 Regional Outlook
1. The Australia-China Trade and Investment Relationship
Domenic McEwan, Nicholas McLean, Ziyu Wang, Xin Yuan and James Phillips
Introduction
The world economy has experienced economic globalisation over the past several decades with technological advancements and market liberalisation being the catalyst (OECD, 1999). Since the dissolution of the Bretton Woods Fixed Exchange Rate System, there has been an exponential increase in the international flow of funds and economic interdependence (Makin, 2002). The spread of neoclassical economics gradually altered government policies, influencing the removal of trade impediments such as tariffs, regulations and quantitative restrictions (IMF, 2008). Within this context, China and Australia are two prominent countries that have experienced significant economic growth, despite very different economic and political agendas.
Advent of the Bretton Woods System
In the last two centuries, the world economy has undergone an intensive globalisation process, due to various drivers such as technological change, growth of the public sector and market liberalisation (OECD, 1999). The latter touches upon one of the principal catalysts: the changing nature of the international monetary system. In 1944, the conclusion of the Bretton Woods Conference established the first global system for monetary and exchange rate management. The Bretton Woods model was premised on the ideology of ‘embedded liberalism’. In his seminal article, ‘International Regimes, Transactions, and Change: Embedded Liberalism in the Postwar Economic Order’ Ruggie asserts that embedded liberalism was the pragmatic compromise between the competing interests of free trade and domestic stability: ‘[U]nlike the economic nationalism of the thirties, it would be multilateral in character; unlike the liberalism of the gold standard and free trade, its multilateralism would be predicated upon domestic interventionism’ (Ruggie, 1982). Thus emerged a balancing act between trade liberalisation and welfare expansion (Lee, 2010). The architects of the Bretton Woods System, Harry White and John Keynes, devised the creation of two new international financial institutions: International Monetary Fund (IMF) and International Bank for Reconstruction and Development (IBRD). The IMF monitored exchange rates, providing credit to offset short-term trade deficits and encouraging international trade. Comparatively, the IBRD provided developmental aid to underdeveloped post-war economies. These institutions established a framework that enabled a fixed exchange rate system. Within this system, member states agreed to fix the value of their national currencies to the USD, which in turn was convertible to gold. During the 1950-60s, international trade expanded rapidly, with merchandise exports between non-communist countries growing by 290% (Ashworth, 1987). However, as Steil notes, the Bretton Woods system ultimately failed due to the lack of a ‘mechanism to ensure that the United States would operate a monetary policy consistent with maintaining adequate gold stocks’ (Steil, 2013). In 1971, the Nixon administration terminated the USD’s convertibility into gold, leading to the collapse of the Bretton Woods system (Ghizoni, 2013). Following the 1973

Regional Outlook 3
Smithsonian Agreement, a floating exchange rate regime replaced fixed exchange rates; all major currencies floated against the USD, with their value determined by the free market (Schifferes, 2008). The deregulation of currency and financial markets resulted in the increased mobility of capital flows, driving a new era of financial globalisation (Schmukler, 2004). Neoliberalism emerged as the prevailing paradigm: market-driven economies, burdened by little governmental oversight, would lead to economic prosperity. Thus, the IMF and newly formed World Bank Group (WBG) became mechanisms by which neoliberal philosophies could be spread to the developing world (Beeson & Islam, 2005).
The Redemption of Neo-liberalism
Following the dissolution of the Bretton Woods system, Neoliberal ideologies spread rapidly into various regions across the globe - especially former communist countries and developing countries in the Asia-Pacific (Jones, 2012). This economic ideology has been the main driver behind economic globalisation that has supported freedom from strict regulation and promoted a state of interdependence (Wikan, 2015). The elimination of government-imposed restrictions on goods, services, capital and people has proven to be beneficial for the developing countries of the Asia-Pacific (Ibid). During the early 1980s, strong advocates in the North Atlantic and Western Europe pushed for market liberalisation and fiscal discipline to be incorporated into development and trade policy (Lee, 2010). This continued into the late 1980s with the creation of the Washington Consensus. These were a set of policy prescriptions that focused on tax reforms, deregulation of markets, privatisation of state owned enterprises and enhancing property rights (Ibid). The focus on enhancing property rights had the objective of ensuring security of exporters across the world, which bolstered confidence in international trade facilitating its growth (Richards, 2004). The increase in business confidence through safe trade resulted in international trade within the Asia-Pacific region growing at a more accelerated rate than the developed world (World Bank, 2016). It is depicted in the diagram below that the Chinese economy had gained from this economic orthodoxy change, as its exports and therefore GDP grew exponentially (Ibid).
Figure 1: International Trade Rates.
Source: (World Bank, 2016)
The Australia-China Trade and Investment Relationship
4 Regional Outlook
Implementation of the Washington Consensus and market liberalisation within the Asia-Pacific region over the past 30 years has seen exponential growth, which has resulted in vast improvements to the quality of living. Both Australia and China are members of the Asia-Pacific Economic Cooperation (APEC), a forum of 21 countries in the region that help facilitate economic growth, cooperation, trade and investment (APEC, 2016). Since the inception of the APEC forum in 1989, it has proven to be one of the most economically diverse regions in the world, accounting for approximately 40% of the world’s population, 57% of world GDP and 49% of world trade (RMIT, 2016). Faster GDP growth in developing countries has increased their rate of convergence with developed countries in terms of per capita income in recent decades (APEC, 2016). However, developing economies are still much poorer than developed countries, with millions remaining in poverty even in the most dynamic developing economies (World Trade Organisation, 2014). Thus, GDP growth has moved hand in hand with integration in the world economy.
The Emergence of the Australia-China Relationship
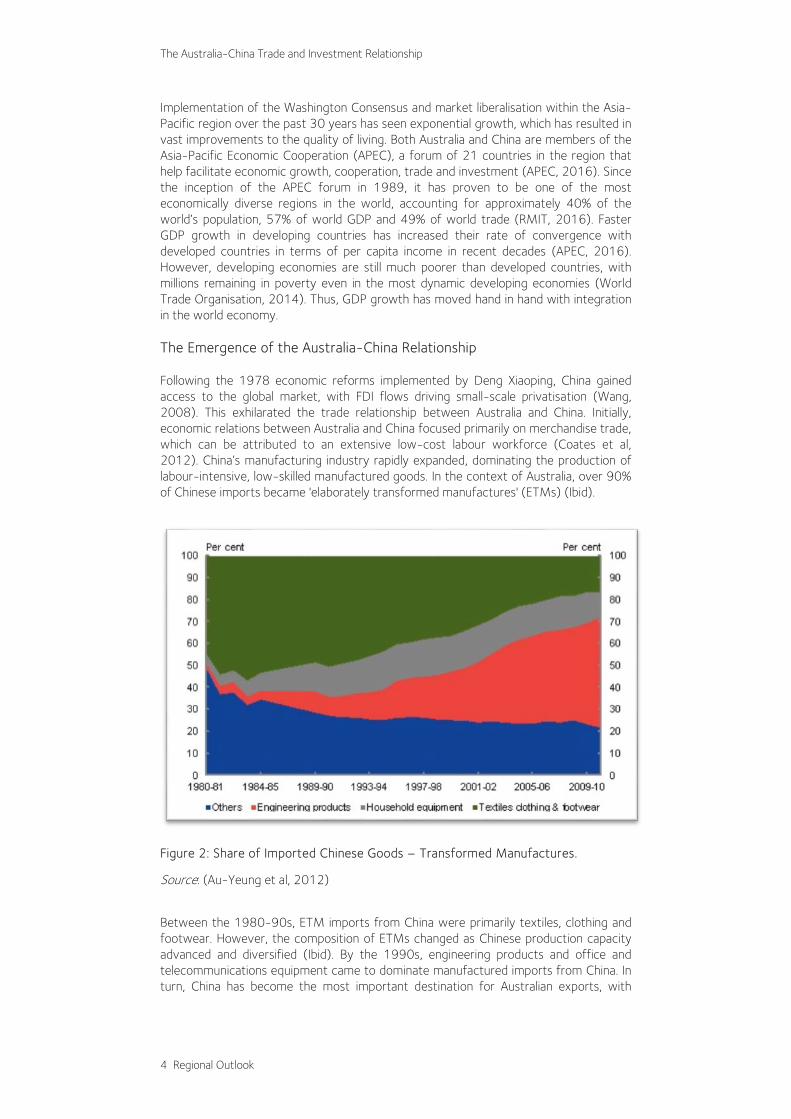
Following the 1978 economic reforms implemented by Deng Xiaoping, China gained access to the global market, with FDI flows driving small-scale privatisation (Wang, 2008). This exhilarated the trade relationship between Australia and China. Initially, economic relations between Australia and China focused primarily on merchandise trade, which can be attributed to an extensive low-cost labour workforce (Coates et al, 2012). China’s manufacturing industry rapidly expanded, dominating the production of labour-intensive, low-skilled manufactured goods. In the context of Australia, over 90% of Chinese imports became 'elaborately transformed manufactures' (ETMs) (Ibid).
Figure 2: Share of Imported Chinese Goods – Transformed Manufactures.
Source: (Au-Yeung et al, 2012)
Between the 1980-90s, ETM imports from China were primarily textiles, clothing and footwear. However, the composition of ETMs changed as Chinese production capacity advanced and diversified (Ibid). By the 1990s, engineering products and office and telecommunications equipment came to dominate manufactured imports from China. In turn, China has become the most important destination for Australian exports, with

Regional Outlook 5
China’s share of Australia’s total merchandise trade increasing almost five-fold, from 5% to 24% (Au-Yeung et al, 2012; Liu & McDonald, 2010).
The growth in China’s manufacturing industry required the creation of a stable manufacturing base, resulting in the migration of labour from rural to urban areas (Wu & Li, 1996). China’s urbanisation rate rapidly grew from 19% in 1980 to 42% in 2005 (Au-Yeung et al, 2012). Due to the twin processes of urbanisation and industrialisation, China has developed a significant demand for mineral resources (Liu & McDonald, 2010). Consequently, Australia’s resource sector has shifted to accommodate this China-led commodities boom (Roberts et al, 2016). A prime example is Australia’s trade in coal and iron ore (Department of Foreign Affairs and Trade, 2011; Bingham & Perkins, 2012).
Figure 5: Composition of Australia’s exports to China.
Source: (Department of Foreign Affairs and Trade, 2011).
Figure 3: China’s Share of Australia’s total merchandise.
Source: (Au-Yeung et al, 2012)
Figure 4: China’s Urbanisation Rate.
Source: (Au-Yeung et al, 2012)

The Australia-China Trade and Investment Relationship
6 Regional Outlook
Australia’s coal exports consist of both thermal and metallurgical coal variants (Minerals Council of Australia, 2014). Both types had substantial increases to both volume and prices. From 2001 – 2011, thermal coal trade volumes increased 70%, with a price increase of 90%; volume of metallurgical coal exports increased 25%; with a price increase of 230% (Department of Foreign Affairs and Trade, 2011). China’s demand for this mineral had a marked effect on the size of China’s share of
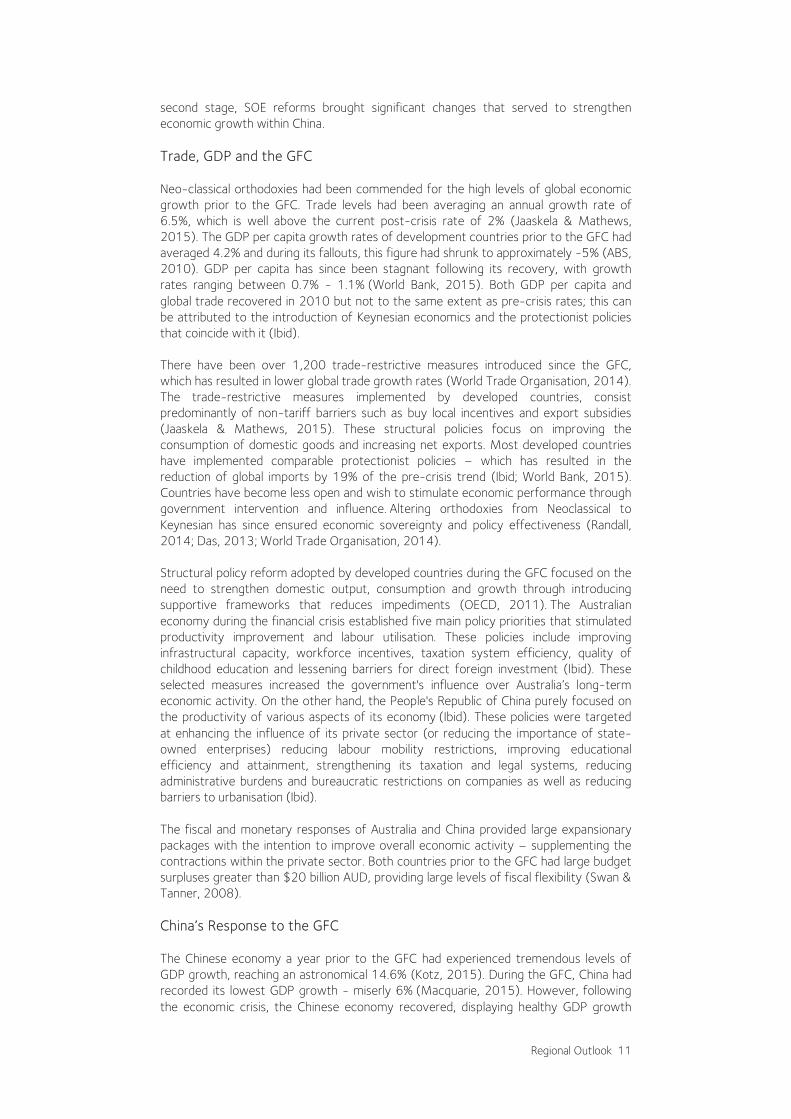
Australia’s export market. From 2007-11, China’s share of thermal coal exports rose from 1.5% to 12.7%. Similarly, China’s share of metallurgical coal exports rose from 0.9% in 2008 to 8.1% in 2011 (Ibid). Primarily, the importance of the Australia-China trade relationship is illustrated by iron ore exportation (Dou, 2013). The average growth of the value of Australian iron ore exports is 31.9% per annum, compared with total Australian exports that grew 8.4% on average per annum; resulting in an increase from $5.2Billion in value in 2001 to $64.1Billion in 2011 (Department of Foreign Affairs and Trade, 2011)
The volume of iron ore exports has increased from 157 million tonnes (Mt) in 2001 to 438 Mt in 2011, indicating an average annual growth 11.1%; comparatively, the
Figure 8: Exports of Iron ore.
Source: (Department of Foreign Affairs and Trade, 2011).
Figure 9: Growth in Iron ore volumes and average price.
Source: (Department of Foreign Affairs and Trade, 2011).
Figure 6: Growth in Thermal coal volumes and average prices.
Source: (Department of Foreign Affairs and Trade, 2011).
Figure 7: Growth in Metallurgical coal volumes and average prices.
Source: (Department of Foreign Affairs and Trade, 2011).
Regional Outlook 7
average price of iron ore has increased 23.4% on average per annum from 2004-2011, despite initial price falls of 5.1% during 2001-2004 (Ibid) China has been Australia’s largest market for iron ore consecutively since 2004, accounting for 68.7% in 2011. Furthermore, export values have increased 46.4% on average since 2001, while export volumes have increased 24.4% on average (Ibid). Over the last decade, Australia has been the largest source of imports of iron ore to China, accounting for 44.1% of total imports of iron ore in 2011 (Bingham & Perkins, 2012; Department of Foreign Affairs and Trade, 2011).
The Current State of the Australia-China Relationship
The volume of trade between Australia and China has grown rapidly in recent decades. Australia is China's sixth largest trading partner; comparatively, Australia is ranked as its fifth largest supplier of imports and tenth largest customer for exports (Holmes, 2012). An overwhelming 25% of Australia’s imported manufactured goods are from China, with thermal coal comprising 13% of Australian exports to China (Hooke, 2016). The two-way value of trade between both countries over the 2014-15 financial year was valued well above $150 billion AUD - accounting for 23% of Australia's total trade within the global economy (Department of Foreign Affairs and Trade, 2016). It is expected that China in 2020 will surpass America as the foremost economy in terms of GDP (Giles, 2014; SPF-CSIS joint commission, 2013). Not only are the two economies interconnected via the physical trade of goods and services, but there is also a relationship between the countries with regard to investment. Chinese foreign direct investment (FDI) into Australia’s asset market has been growing rapidly over recent years as they seek to improve their quality of investment and return on their funds (Department of Foreign Affairs and Trade, 2016). However, this has caused concerns within the Australian populace; Australian perspectives on foreign entities owning large blocks of real estate and industries have tended to be overtly negative. Such can be seen with the Greenland Holding Group – China’s largest state-backed real estate group that has more than $1.6 billion worth of Australian properties (Johnanson, 2014; Greenland Group, 2016). Australia currently has a large current account deficit, signifying a large trade deficit with a high flow of interest payments out of the country (Husana, 2016). This deficit needs to be counteracted by an increase in the capital account (the increase in foreign direct investment) by a similar amount (RBA, 2016; Gittons, 2016). This situation is unstable for the Australian economy, with a comprehensive reassessment of how to mitigate this deficit required in the coming years. As Australia and China continue to invest in one another’s asset markets, the relations and interactions between the two countries become a key focus point.
The Australia-China Trade and Investment Relationship
8 Regional Outlook
The Australian securities market and exchange rate are directly affected by trends in the Chinese economy. For example, Blackmores, a leading Australian natural health company, was a benefactor of the improving Chinese economy – gaining a share price increase of 400% last year (Chappell, 2016). However, with the $1.3 billion Yuan devaluation that occurred in the last quarter of 2015, the Australian securities market was negatively impacted (Macquarie, 2015). Most of the market dropped over 10% in a matter of days and even the exchange rate had depreciated by over 1.5% (Macquarie, 2015). The Australian securities market has since recovered, but this example demonstrates the economic interdependence between the two countries and the important need for an amicable, collaborative relationship between both partners. In 2015, the Australian government decided to enhance economic relations with China through the implementation of a free trade agreement (FTA). The China Australia Free Trade Agreement (CHAFTA) came into force on the 20th December 2015, aiding in the facilitation of trade and investment between the two countries. The objective of CHAFTA is to gradually reduce trade impediments between both countries as they seek to utilise one another for economic and social gains (Department of Foreign Affairs and Trade, 2016; Trade & Investment Queensland, 2016). The expectation is that a new trade agreement will provide a stable platform for continued growth of the economic relationship between both countries. The FTA makes Australian goods more competitive in the growing Chinese market that is demanding western products - particularly those from Australia. This has been done through the reduction of trade impediments such as tariffs and quotas on Australian goods into the country (Department of Foreign Affairs and Trade, 2016). The reduction in these tariffs, in conjunction with the declining exchange rate, will enhance the competitiveness of Australian exporters, which will ultimately help reduce its current account deficit (Vidot, 2015; Trade & Investment Queensland, 2016). CHAFTA will provide preferential market access for Australian exporters by reducing the trade impediments on over 95% of Australian goods upon its full implementation in 2019 (Trade & Investment Queensland, 2016). This will provide Australia with a competitive advantage over major exporting competitors in the North Atlantic and Western Europe (Ibid). This will help stimulate growth and productivity for a range of firms that seek to provide the Chinese market with beef, lamb, barley, horticulture, processed foods and leathers. Further, this will reduce tariffs across certain periods of time with the most evident being a 30% tariff reduction on horticultural products and 14% reduction on wine over a four-year period (Vidot, 2015; Trade & Investment Queensland, 2016). This places Australia in an ideal position to capitalise on the growing middle class of China.
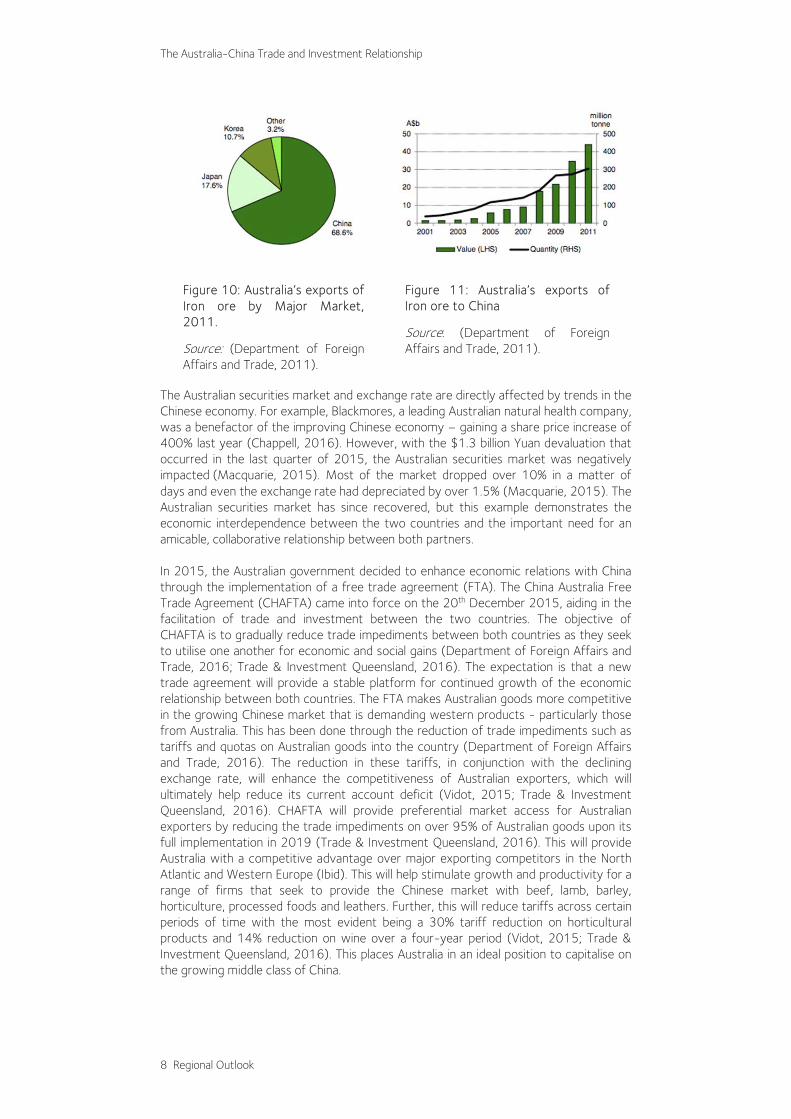
Figure 10: Australia’s exports of Iron ore by Major Market, 2011.
Source: (Department of Foreign Affairs and Trade, 2011).
Figure 11: Australia’s exports of Iron ore to China
Source: (Department of Foreign Affairs and Trade, 2011).

Regional Outlook 9
This agreement also entices Chinese investors into Australia to boost economic growth; higher the levels of capital and investment, the faster the economy will grow (Mishkin & Eakins, 2012). This can be explained in the Solow Swan Model; capital is a function of investment and investment is a function of output. Through additional levels of investment, capital will rise resulting in further improvements in national output (Ibid). There may be interest repayments abroad, however the economy will make more profits than without the investment as well as grow at a much faster rate. This trade reform between both countries will not only seek to enhance the trade of goods between both countries but also the transfer of services and information in key areas such as tourism, health and aged care, education, engineering, urban planning and construction as well as legal and financial services (Trade & Investment Queensland, 2016). The induction of this FTA can be attributed to China’s quest to develop and enhance its overall economic performance following WWII.
Reform and Development of the Chinese Economy
Following the establishment of the People’s Republic of China in 1949, the country has undergone several stages of reforms and development that has shaped its economy and society. Under Mao Zedong’s planned economy model, China pursued strict egalitarianism (Whyte, 2012). In 1978, Deng Xiaoping initiated a series of economic reforms in order to transform China into a market economy (Smitha, 2015). Measures launched by Deng profoundly reshaped China. The objective was to gradually allow market forces to enter the Chinese planned economy and usher in a dynamic, modern socialist market economy (Ibid). China’s transformation from a poor, under-developed and mainly agrarian economy into the second largest economy in the world in terms of GDP, has been achieved in a very short period of time (The World Bank, 2016; Lin, 2014). These reforms, initiated 35 years ago, are still ongoing. For example, the reform of State-Owned-Companies (SOE) is one of the key issues of Xi Jinping’s current economic policy. In the Third Plenary Session of the 11th Central Committee of the Party in December 1978, Xi launched a new policy highlighting economic growth. This policy was characterised as “reforming and opening China” (China Briefing, 2013). Additionally, it prioritised the growth of particular regions. This milestone initiated a series of reforms that have greatly transformed the Chinese economy. These reforms were first carried out in rural zones. They led to the progressive de-collectivisation of farming activities and the launch of entrepreneurship initiatives, preparing China for economic transformation (Gurel, 2014). Major achievements included the implementation of the “household responsibility system” and the creation of “township and villages enterprises”. The reforms were then extended to urban areas, aimed at reviving certain industries. In 1978, Deng identified two core problems. First, the Maoist strategy relied largely on highly capital-intensive heavy industry, which was against China’s natural endowment; generally characterised as a large pool of cheap labour. Second, a broad part of the industrial production was generated by SOEs, which were inefficient: 78% in 1978 (Brandt, Ma & Rawski, 2014). Based on these observations, Deng adopted reforms aimed at transforming China as an export manufacturing country, with a more efficient pool of SOEs. Since 1978, reforms to the Chinese economy have produced tremendous developments. According to Ravaillon and Chen, since 1981 the proportion of population living in poverty fell from 53% to 8% in 2001 (see Figure 1). Poverty reduction was particularly impressive during the first period of reforms, until the mid-1980s (Ravallion & Chen, 2007).

The Australia-China Trade and Investment Relationship
10 Regional Outlook
Figure 12: Evolution of poverty in China since 1980:
Source: (Ravallion, M. & Chen, S., 2007) Deng additionally identified two major problems in the Maoist industrial strategy. One was related to the heavy industry focused development strategy, which contradicted Chinese strengths (cheap and populous labour) and fed weaknesses (a capital-scarce economy) (Lin & Zhang, 1998). The other one concerned the SOEs, which represented 78% of the industrial production in 1978 (Brandt, Ma & Rawski, 2014). Due to the planned economy system, they had few incentives to improve their efficiency. Indeed, their responsibility was to meet “specific output targets with an agreed number of employees and payroll, and with assigned allocations of both capital goods and intermediate inputs” (Li & Putterman, 2008). Thus, a series of reforms impacting SOEs was carried out gradually. From 1979 to 1992, market mechanisms were introduced, following a model similar to reforms in the agricultural sector. Output targets were maintained, but SOEs were encouraged to produce above the plan; the surplus was then sold at unregulated prices (Ibid). This change explained that a growing part of a SOE’s production was based on their autonomous decision-taking abilities instead of a pre-fixed plan. In the mid-1990s, the transformation of SOEs gained a new momentum, under the guideline “grasping the large and letting go of the small” introduced at the 15th CPC National Congress and implemented by Premier Zhu Rongji (Zhu, 2003). This transformed these enterprises drastically. SOEs in strategic industries such as steel, oil and chemical were consolidated and restructured; others in non-strategic sectors such as textile were either bankrupt or privatised. These reforms restructured the Chinese SOE landscape, ending the “iron rice bowl” and led to a massive wave of lay-offs (Lee, 1998). The contribution of these reforms to China’s economic boom is still controversial, as Chinese economic growth was mainly due to the development of dynamic export and private sectors. However, most studies agree on their vital support to the Chinese boom by providing other economic sectors with key inputs for production (Li & Putterman, 2008). In summary, during the era of economic reforms starting from 1978, China underwent two very distinct stages of economic development. The first period lasting until the mid-1980s was marked by agricultural reforms, which managed to significantly decrease poverty in rural areas, thus improving the situation of the rural populace. During the
Regional Outlook 11
second stage, SOE reforms brought significant changes that served to strengthen economic growth within China.
Trade, GDP and the GFC
Neo-classical orthodoxies had been commended for the high levels of global economic growth prior to the GFC. Trade levels had been averaging an annual growth rate of 6.5%, which is well above the current post-crisis rate of 2% (Jaaskela & Mathews, 2015). The GDP per capita growth rates of development countries prior to the GFC had averaged 4.2% and during its fallouts, this figure had shrunk to approximately -5% (ABS, 2010). GDP per capita has since been stagnant following its recovery, with growth rates ranging between 0.7% - 1.1% (World Bank, 2015). Both GDP per capita and global trade recovered in 2010 but not to the same extent as pre-crisis rates; this can be attributed to the introduction of Keynesian economics and the protectionist policies that coincide with it (Ibid). There have been over 1,200 trade-restrictive measures introduced since the GFC, which has resulted in lower global trade growth rates (World Trade Organisation, 2014). The trade-restrictive measures implemented by developed countries, consist predominantly of non-tariff barriers such as buy local incentives and export subsidies (Jaaskela & Mathews, 2015). These structural policies focus on improving the consumption of domestic goods and increasing net exports. Most developed countries have implemented comparable protectionist policies – which has resulted in the reduction of global imports by 19% of the pre-crisis trend (Ibid; World Bank, 2015). Countries have become less open and wish to stimulate economic performance through government intervention and influence. Altering orthodoxies from Neoclassical to Keynesian has since ensured economic sovereignty and policy effectiveness (Randall, 2014; Das, 2013; World Trade Organisation, 2014). Structural policy reform adopted by developed countries during the GFC focused on the need to strengthen domestic output, consumption and growth through introducing supportive frameworks that reduces impediments (OECD, 2011). The Australian economy during the financial crisis established five main policy priorities that stimulated productivity improvement and labour utilisation. These policies include improving infrastructural capacity, workforce incentives, taxation system efficiency, quality of childhood education and lessening barriers for direct foreign investment (Ibid). These selected measures increased the government's influence over Australia’s long-term economic activity. On the other hand, the People's Republic of China purely focused on the productivity of various aspects of its economy (Ibid). These policies were targeted at enhancing the influence of its private sector (or reducing the importance of state-owned enterprises) reducing labour mobility restrictions, improving educational efficiency and attainment, strengthening its taxation and legal systems, reducing administrative burdens and bureaucratic restrictions on companies as well as reducing barriers to urbanisation (Ibid). The fiscal and monetary responses of Australia and China provided large expansionary packages with the intention to improve overall economic activity – supplementing the contractions within the private sector. Both countries prior to the GFC had large budget surpluses greater than $20 billion AUD, providing large levels of fiscal flexibility (Swan & Tanner, 2008).
China’s Response to the GFC
The Chinese economy a year prior to the GFC had experienced tremendous levels of GDP growth, reaching an astronomical 14.6% (Kotz, 2015). During the GFC, China had recorded its lowest GDP growth - miserly 6% (Macquarie, 2015). However, following the economic crisis, the Chinese economy recovered, displaying healthy GDP growth

The Australia-China Trade and Investment Relationship
12 Regional Outlook
and unemployment figures - averaging 9.26% and 4.1% respectively (Kotz, 2015). This can be attributed to the expansionary fiscal response of the Chinese Central Government, which provided a RMB 4 trillion stimulus package. This fiscal action has a dominant focus on investment in comparison to various developed countries, which have sought to increase consumption (McKissack & Xu 2011). The investment in infrastructure and other aspects were introduced in the most timely and cost effective manner. The Chinese government, despite the debt crisis, had sought to utilise credit expansionary methods, having funded over 60% of this fiscal measure with debt (Ibid). Critics have argued that the implemented stimulus perpetuates the Chinese economy’s unsustainable build-up of debt, capital and growth in exports. They compare China’s current financial instability to other growing economies in the 20th century, such as Brazil and Japan (CPDS, 2007). The comparison drawn is that these economies had utilised policies that manipulated artificially low interest rates in order to grow the economy through additional capital (Matthews, 2016). In conjunction with these high levels of capital accumulation, the People’s Republic of China has sought to further enhance the growth of its export sector through maintaining its fixed exchange rate policy. Given an economy as large as China, having large swings in GDP growth is not ideal when attempting to create liberalising economic reforms; stable growth is a necessity (Macquarie, 2015). With the demand for Chinese goods slowing and the growth of the economy not being as high as its post-GFC rates, it was an intelligent move by the central bank to devalue the currency by 3% in late 2015 (Ibid). This aided in stimulating export demands, as Chinese goods are now relatively cheaper in comparison to global competitors. This is a wise choice as it seeks to continue focusing on urbanising its economy - growing domestic demand for Chinese produced goods and services. Until China believes its economy is self-sufficient, it will not move to a floating exchange and interest rate (Xinhua, 2016). Since there are high levels of exports due to the strategic choices made by the Chinese Central bank and Government, there has been an increase in capital flows into and out of China since the GFC - well above the rest of the global economy (James, McLoughlin & Rankin, 2014). Economists suggest China should liberalise its exchange rate and interest rate to prevent asset bubbles and destabilizing capital flows, as well as inducing higher output growth (Yueh, L. 2012). However, this would be for the sole betterment of western countries; the Chinese economy is currently utilising sound structural, fiscal, trade and monetary responses in order to develop its economy to become the world’s most influential country by 2020 (Macquarie, 2015). Through the continuation of China’s strong exports and trade surplus, its nation has a rather strong capital account surplus which is providing Australia with much needed capital flows known as direct foreign investment (Ibid).
Australia’s Response to the GFC
Scholars have suggested that Australia was least affected by the GFC out of all developed economies (Brown & Davis, 2009). This is attributed to the Australian mining boom, strong terms of trade, and the government’s stimulus response (Priestley, 2010). Once the effects of the GFC became prevalent, there was a global effort to stimulate growth and stabilise the economy through reducing the cash rate close to 0% (CEDA, 2012; Swain, 2009). Australia was unlike most economies, as it found itself battling high levels of inflation well into the third quarter of 2008 (CEDA, 2012). In the following eight months, the Central Bank had reduced the cash rate from 7.25% to 3% (Ibid). Australia’s interest rates remained above the world standard, which enticed foreign investors, providing the country with higher levels of capital, income and output. Additionally, this aided in fuelling consumer confidence and the competitiveness of exports and the importation of competing goods.

Regional Outlook 13
The Australian economy prior to the GFC had a budget surplus of $21.7 billion – providing large levels of fiscal flexibility (Swan & Tanner, 2008). China was in a similar situation due to its positive trade balance providing a strong means of funding its government expenditure (McKissack & Xu, 2011). Without this budget surplus, the fiscal actions undertaken by the Australian Government may not have been as effective and could have resulted in unsustainable debt levels now evident in the Greek and Spanish economies (CEDA, 2012; Li & Spencer, 2014; Berg, 2014). Australia’s rapid fiscal response provided a $42 billion stimulus package that improved economic growth and output – preventing a technical recession (CEDA, 2012; Groenewold, 2016; Hagan & Gruen, 2010; Swan & Tanner, 2008). The government also utilised debt financing through issuing $25 billion worth of Government securities to help fund this response (Groenewold, 2016; Swan & Tanner, 2008). Approximately 15% of expenditure from the stimulus package was used to acquire imported goods; however, every dollar spent of the $26 billion in cash handouts had directly generated an additional 75 cents in GDP (Hagan & Gruen, 2010). These fiscal actions increased the money supply, national income and output during this period. This resulted in 0.5% growth when the economy was forecasted to shrink by 2%, safeguarding 200,000 jobs and consumer confidence (Groenewold, 2016; Hagan & Gruen, 2010; Emmerson, 2010; CEDA, 2012; McDonald & Morling, 2011). The Australian economy during the GFC experienced approximately 5% unemployment – 3% lower than other developed countries (CEDA, 2012). The response of the Australian economy to the GFC had prevented a technical recession and guaranteed faster economic recovery in comparison to other developed countries. Australia was protected from the worst of the GFC because of its policy response, strong terms of trade and resource trade with China. However, the resources boom is winding down and Australia’s stimulus response has created significant public debt, as well as a budget deficit. This has left the Australian economy in a vulnerable position with the government’s AAA credit rating at risk (Chung, 2016; Taylor & Costello, 2016). Another challenge that faces the Australian economy is the long-standing current account deficit, as the country has a shortfall of national savings in relation to the investment demand (Riley, 2012). If it were not for the accumulated international debt being primarily private, and the government budget having been in surplus for many years, Australia would have been exposed to damaging downturns in international investor confidence (Haran et al, 2013). The Free Trade Agreement forged between Australia and China will help swing the Balance of Payments for both countries in a positive manner, as they seek to transition into a new phase of economic development (Macquarie, 2015).
Evaluation and Analysis
The future of the macroeconomic environment is uncertain, as countries are unaware of the current implications of the accumulation of international debt. Relationships between economies have varied, with the United Kingdom having sought to separate from the European Union, whilst Australia has pursued a closer economic partnership with China. The signing of the CHAFTA may appear to not have a large influence on the current economy as of yet but it is a slow implementation of tariff and trade impediment reductions to ensure there are minimal shocks to either economy. This will prove to be beneficial for countries as China is seeking to stabilise swings in GDP while attempting to establish liberalising economic reforms (Macquarie, 2015). Through enhanced liberalised economic reforms, such as increasing the number of privately owned enterprises, the country will seek to further urbanise its economy. This rate of urbanisation has more than doubled since the introduction of neoliberal orthodoxies in the global marketplace during the 1970s (The Treasury, 2010).

The Australia-China Trade and Investment Relationship
14 Regional Outlook
China’s large levels of economic growth since 1979 can be attributed to its rapid urbanisation reforms established by the central government (Ibid). There have been predictions that the urbanisation rate of China will continue to grow on an accelerated rate, increasing by 25% over a 30-year period (Ibid). This is promising despite the current GDP growth rates decelerating slightly. The Chinese economy will be forced to continue investing in infrastructure due to this large-scale urbanisation. This will maintain demand for Australian minerals despite the current economic downturn. Various Australian firms that export products to China will continue to reap the rewards long into the foreseeable future. The large-scale urbanisation predicted to occur in China would result in a large increase in the middle class, which in turn places a demand on the Chinese government to import high quality goods. As the Chinese government seeks to urbanise the economy, it will also seek to reduce the number of state owned enterprises (SOEs) due to their lack of efficiency and productivity. As China seeks to adopt more liberal economic reforms, its exchange rate will foreseeably float in the future as its rate of urbanisation reaches an ideal level. Once its middle class is large enough and the exchange rate is altered, the economy will fully earn a ‘developed’ status. The large population size of China makes it a credible potential buyer of higher quality products, as more citizens continue to enter the middle class bracket. The current middle class of China is expected to be greater than 200 million people and this is expected to grow rapidly over the coming years due to current and expected robust urbanisation rates (Pei, 2016; The Treasury, 2010). This large increase in the middle class will prove to be almost akin to the buying power of the entire European Union, as its current middle class is greater than 600 million (Pezzini, 2012). As China’s strong consumer base is established there will be a reduction in China’s trade surplus, as they will seek to import goods from countries such as Australia. In turn, this will result in an improvement to Australia’s current trade deficit. Glimpses of this can be seen with companies such as Blackmores being able to increase sales within the region from $2 million in 2014 to $130 million in 2016 (Chappell, 2016). This can be attributed to the Chinese population having a distinct preference for natural remedies when sick (Ge, He & Hu, 2014). As the middle class continues to grow and tariffs on Australian goods decline; the Chinese consumer base will increase its consumption of Australian manufactured goods. This will help reduce Australia’s current unstable current account deficit over the coming years (Antenero, 2016). CHAFTA will ultimately provide the Australian economy with a smooth entry point over the coming years to target and reach the growing middle class of China with its exports. China’s current high levels of direct investment in Australian industries provide businesses with a means of funding for productive capital and equipment (Alfaro et al, 2006). Through capital accumulation, Australia will be able to enhance its productivity as it can produce higher qualities and quantities of goods well into the future (Ibid). This positively improves Australian GDP and income even after deducting the net repayments of this means of debt funding. Ultimately this higher level of output will aid in improving the trade balance and current account of Australia over the coming decades. As productivity is enhanced through additional capital and the exchange rate depreciates, Australian high quality goods will become relatively more competitive in comparison to other countries (Thirlwell, 2015). The Chinese market may view Australia products to be more expensive than goods sold by developing countries, but as the middle class grows, its demand for higher quality products will also (China Business Review, 2009).

Regional Outlook 15
Prior to the introduction of the CHAFTA, Australia was China’s fifth largest importer (Holmes, 2012). Since then, there has been an evident increase in consumer demands within China for Australian produced goods such as cereal, formulas, vitamins and supplements (Vidot, 2015; Trade & Investment Queensland, 2016). CHAFTA enables Australia to exploit this growing demand more fully by slowly reducing trade impediments on different products over durations as short as 4 years and potentially as long as 30 years (Ibid). The products that potentially will see gradual tariff reductions over 30 years will undoubtedly see continual growth in demand in China as this will coincide with its expected 73% in rate of urbanisation (The Treasury, 2010; SPF-CSIS joint commission, 2013).
Conclusion
The Australia-China trade and investment relationship is one of historical entwinement, retrospectively and undoubtedly prospectively. Following the dissolution of the Bretton Woods system, the proliferation of neoliberal ideologies lessened the impediments to international trade, driving growth within formally slow-moving markets, particularly the Asia-Pacific region. Within such a dynamic economic environment, the volume of trade between Australia and China increased exponentially. The expansion of China’s manufacturing industry led to a rapid rate of urbanisation, necessitating widespread infrastructure development that resulted in a higher demand for mineral resources. Thus, the exportation and importation of Australian coal and iron ore constitutes the bedrock of the current Australia-China trade relationship. This foundation served to mitigate the effects of the GFC and provided a basis for negotiations on CHAFTA. The China-Australia Free Trade Agreement (CHAFTA) provides a new dimension to the economic relationship between the two countries, providing a gradual shift away from commodities to high quality products. Under CHAFTA, the removal or reduction of tariffs and other trade impediments will have two broad prospective benefits. Firstly, CHAFTA will operate in conjunction with China’s ongoing economic reforms by facilitating free trade and market liberalisation. In turn, the burgeoning growth of China’s middle class will heighten demand for high quality products, increasing consumption of Australian goods. The second benefit builds upon the expected demand for Australian products: direct investment in Australian industries. Capital accumulation will enable Australian businesses to enhance production capacity, boosting the competitiveness of Australian goods within the global market, ultimately offsetting Australia’s current account deficit and positively altering the trade balance. Conclusively, the Australia-China trade and investment relationship is mutually beneficial: visible in the past, evident in the present and demonstrable well into the future
Bibliography
Alfaro, L., Chanda, A., Kalemli-Ozcan, S., & Sayek, S. (2006, August). How Does Foreign Direct Investment Promote Economic Growth? Exploring the Effects of Financial Markets on Linkages. Retrieved from Havard Business School: http://www.hbs.edu/faculty/Publication%20Files/07-013.pdf
Antenero, A. (2016, February 12). China and Australia trade: Six Chinese sectors that present opportunities for Australian companies and producers. Retrieved from International Business Times: http://www.ibtimes.com.au/china-australia-trade-six-chinese-sectors-present-opportunities-australian-companies-producers
APEC. (2016). Achievements and Benefits. Retrieved from Asia-Pacific Economic Cooperation: http://www.apec.org/About-Us/About-APEC/Achievements%20and%20Benefits.aspx
Appleton, S., & Song, L. (2009, December 17). Growing out of Poverty: Trends and Patterns of Urban Poverty in China 1988-2002. World Development, 38(5),

The Australia-China Trade and Investment Relationship
16 Regional Outlook
665-678. Retrieved from World Development: http://dx.doi.org/10.1016/j.worlddev.2009.11.016
Ashworth, William A. (1987). A Short History of the International Economy Since 1850. London: Longman.
Australian Bureau of Statistics. (2010, September 15). 1370.0 - Measures of Australia's Progress, 2010. Retrieved from Australian Bureau of Statistics: http://www.abs.gov.au/ausstats/[email protected]/Lookup/by%20Subject/1370.0~2010~Chapter~International%20comparisons%20(5.1.6)
Au-Yeung, W., Keys, A., & Fischer, P. (2012). Australia-China: Not just 40 years. Treasury.gov.au. Retrieved 6 November 2016, from http://www.treasury.gov.au/PublicationsAndMedia/Publications/2012/Economic-Roundup-Issue-4/HTML/article1
APEC. (2016). Achievements and Benefits. Retrieved from http://www.apec.org/About-Us/About-APEC/Achievements%20and%20Benefits.aspx
Beeson, M. & Islam, I. (2005). Neo-liberalism and East Asia: Resisting the Washington Consensus. Journal of Development Studies, 41(2), 197-219.
Berg, C. (2014, August 26). The cold calculations of the GFC stimulus. Retrieved from The Australian Broadcasting Channel: http://www.abc.net.au/news/2014-08-26/berg-the-cold-calculations-of-the-gfc-stimulus/5696150
Brandt, L., Ma, D., & Rawski, T. G. (2014). From Divergence to Convergence: Reevaluating the History Behind China’s Economic Boom. Journal of Economic Literature, 52(1), 45–123.
Brown, C., & Davis, K. (2009). Australia’s Experience in the Global Financial Crisis. Bingham, F., & Perkins, B. (2012). Australia’s Coal and Iron ore exports 2001 to 2011.
Department of Foreign Affairs and Trade. Retrieved from http://www.treasury.gov.au/PublicationsAndMedia/Publications/2010/Economic-Roundup-Issue-2/Report/China-growth-and-urbanisation
Chappell, T. (2016, June 1). Understand China, says Blackmores CEO. Retrieved from: http://www.news.com.au/finance/business/breaking-news/understand-china-says-blackmores-ceo/news-story/3332225062431af592adf9f624a32d36
China Briefing. (2013, November 11). Introduction to China’s Plenary Sessions and the CPC Central Committee. Retrieved from China Briefing: http://www.china-briefing.com/news/2013/11/11/introduction-to-chinas-plenary-sessions-and-the-cpc-central-committee.html
China Business Review. (2009, January 1). Understanding China’s Middle Class. Retrieved from China Business Review: http://www.chinabusinessreview.com/understanding-chinas-middle-class/
Chung, F. (2016, 7 July). S&P puts Australia on credit watch. news.com.au. Retrieved from http://www.news.com.au/finance/economy/australian-economy/sp-puts-australia-on-credit-watch/news-story/b8a7f8ae8ab451cdf45874d701087348
Coates, B., Horton, D., & McNamee, L. (2012). China: prospects for export-driven growth. Treasury.gov.au. Retrieved 8 November 2016, from http://www.treasury.gov.au/PublicationsAndMedia/Publications/2012/Economic-Roundup-Issue-4/HTML/article4
Daly, H. E. (1992). Allocation, distribution, and scale: towards an economics that is efficient, just, and sustainable. Ecological Economics, 6(3), 185–193.
Das, S. (2013, October 1). The new economic nationalism. Retrieved from Australian Broadcasting Channel: http://www.abc.net.au/news/2013-09-30/das-the-new-economic-nationalism/4988690
Department of Foreign Affairs and Trade (DFAT). (2011). Australia’s Coal and Iron ore exports 2001 to 2011. Retrieved from DFAT, Canberra: https://dfat.gov.au/about-us/publications/Documents/australias-coal-and-iron-ore-exports-2001-to-2011.pdf
Department of Foreign Affairs and Trade (DFAT). (2016). Department of Foreign Affairs and Trade. Retrieved from ChAFTA - Benefits for Australian business:

Regional Outlook 17
http://dfat.gov.au/trade/agreements/chafta/fact-sheets/Pages/chafta-benefits-for-australian-business.aspx
Dou, D. (2013). The Australian Economy in China’s Shadow. Thechinastory.org. Retrieved 3 November 2016, from https://www.thechinastory.org/agenda2013/the-australian-economy-in-chinas-shadow/
Emmerson, R. (2010, February 2). 12 months later, did the stimulus cash splurge work? Retrieved from Adelaide Now: http://www.adelaidenow.com.au/news/months-later-did-the-stimulus-cash-splurge-work/story-e6frea6u-1225825689061
Ge, S., He, T.-T., & Hu, H. (2014, September 13). Popularity and customer preferences for over-the-counter Chinese medicines perceived by community pharmacists in Shanghai and Guangzhou: a questionnaire survey study. Chinese Medicine, 9. doi:10.1186/1749-8546-9-22.
Ghizoni, S. (2013). Nixon Ends Convertibility of US Dollars to Gold and Announces Wage/Price Controls. Retrieved from Federal Reserve History: http://www.federalreservehistory.org/Events/DetailView/33
Giles, C. (2014). China poised to pass US as world’s leading economic power this year. Financial Times. Retrieved from Financial Times: https://www.ft.com/content/d79ffff8-cfb7-11e3-9b2b-00144feabdc0
Gittons, R. (2016, August 20). Australia and China, a partnership facing massive change. The Sydney Morning Herald: http://www.smh.com.au/business/comment-and-analysis/australia-and-china-a-partnership-facing-massive-change-20160819-gqweig.html
Greenland Group. (2016). Retrieved November 1, 2016, from Greenland Holdings: http://www.greenlandaustralia.com.au/en/greenland-group/
Groenewold, N. (2016). Australia and the GFC: Saved by the astute fiscal policy? Retrieved from The University of Western Australia - Business School: http://www.business.uwa.edu.au/__data/assets/pdf_file/0018/2254050/12-28-Australia-and-the-GFC,-Saved-by-Astute-Fiscal-Policy.pdf
Gurel, B. (2014, February 2014). Changing Relations of Production in Chinese Agriculture from Decollectivization to Capitalism. McGill Sociological Review, 4, 6 - 92. Retrieved from McGill University: https://www.mcgill.ca/msr/msr-volume-4/changing-relations-production-chinese-agriculture
Hagan, P., & Gruen, N. (2010, August 18). Repaying the fiscal stimulus. Retrieved from Lateral Economics: http://www.lateraleconomics.com.au/outputs/Waste.pdf
Haran, M., McCord, M., Hutchison, N., McGreal, S., Adair, A., Berry, J., & Kashyap, A. (2013). Financial structure of PPPs deals post‐GFC: an international perspective. Journal of Financial Management of Property and Construction, 18(2), 184-203. doi:10.1108/JFMPC-07-2012-0028.
Holmes, A. (2012). Australia’s economic relationships with China. Retrieved from Parliament of Australia: http://www.aph.gov.au/About_Parliament/Parliamentary_Departments/Parliamentary_Library/pubs/BriefingBook44p/China
Hooke, R. (2016). China. Retrieved from FB Rice: http://www.fbrice.com.au/region/International/China.aspx
Husana, R. (2016, June 10). Australia Balance of Trade. Retrieved from Trading Economics: http://www.tradingeconomics.com/australia/balance-of-trade
Jaaskela, J., & Mathews, T. (2015, September). Explaining the Slowdown in Global Trade. Retrieved from The Reserve Bank of Australia: http://www.rba.gov.au/publications/bulletin/2015/sep/pdf/bu-0915-5.pdf
Johnanson, S. (2014, October 11). Chinese investors are pushing into Melbourne and Sydney. Retrieved From: The Sydney Morning Herald: http://www.smh.com.au/business/chinese-investors-are-pushing-into-melbourne-and-sydney-20141010-113q7x.html
Jones, D. S. (2012). Masters of the Universe: Hayek, Friedman, and the Birth of Neoliberal Politics. Retrieved From Princeton University Press: http://press.princeton.edu/titles/9827.html
The Australia-China Trade and Investment Relationship
18 Regional Outlook
Kotz, D. M. (2015). The Rise and Fall of Neoliberal Capitalism. Retrieved From Harvard University Press: http://www.hup.harvard.edu/catalog.php?isbn=9780674725652
Kroeber, A. R. (2016). China’s economy: what everyone needs to know. New York: Oxford University Press. Retrieved from: https://global.oup.com/academic/product/chinas-economy-9780190239039?cc=au&lang=en&
Kader-Abdel, K. (2013, March). What Are Structural Policies? Finance and Development, 50(1). Retrieved from International Monetary Fund: http://www.imf.org/external/pubs/ft/fandd/2013/03/basics.htm
Lardy, N. R. (1978). Economic growth and distribution in China. Cambridge: Cambridge University Press. Retrieved from http://trove.nla.gov.au/work/11518648?selectedversion=NBD1083166
Lee, H. (2010). The compromise of embedded liberalism and government credibility, Ottawa: Canadian Political Science Association. Retrieved from: https://www.cpsa-acsp.ca/papers-2010/Lee-Hyunji2.pdf
Lee, K. M. (1998). Beyond the iron rice bowl: Chinese occupational welfare in market transition, London School of Economics and Political Science. London: ProQuest. Retrieved from http://etheses.lse.ac.uk/1483/1/U109440.pdf
Li, S. M., & Spencer, A. (2014, July). Effectiveness of the Australian Fiscal Stimulus Package: A DSGE Analysis. Retrieved from The University of Melbourne - Department of Economics: http://fbe.unimelb.edu.au/__data/assets/pdf_file/0007/1157038/SHUYUN_MAY_LI_-_ADAM_SPENCER.pdf
Li, W., & Putterman, L. (2008). Reforming China’s SOEs: An Overview. Comparative Economic Studies, 50(3), 353–380. http://link.springer.com/article/10.1057/ces.2008.31
Liu, J. & McDonald, T. (2010). China: growth, urbanisation and mineral resource demand. Retrieved 10 November 2016, from: http://www.treasury.gov.au/PublicationsAndMedia/Publications/2010/Economic-Roundup-Issue-2/Report/China-growth-and-urbanisation
Lin, J. Y. (2014, May 22). China's Economic Miracle. Retrieved from The University of British Columbia: http://faculty.arts.ubc.ca/lhao/essays/Ford.html
Lin, J. Y., & Zhang, F. (1998, November 13). The Effects of China's Rural Policies on the. Retrieved from International Development Research Centre: https://idl-bnc.idrc.ca/dspace/bitstream/10625/30543/8/118115.pdf
Macquarie. (2015). China devalues its currency – is this good for Australia? Retrieved from Macquarie: http://www.macquarie.com/au/business-banking/business-management/expertise/economic-update
Makin, A. J. (2002). International Macroeconomics. United Kingdom: Pearson Education Limited.
Matthews, C. (2016). Why China's Stimulus Package Was a Big Mistake. Fortune. Retrieved from Fortune: http://fortune.com/2016/01/15/why-chinas-stimulus-package-was-a-big-mistake/
McDonald, T., & Morling, S. (2011). Economic Roundup Issue 2, 2011. Retrieved from Australian Government - The Treasury: http://www.treasury.gov.au/PublicationsAndMedia/Publications/2011/Economic-Roundup-Issue-2/Report/Part-1-Reasons-for-resilience
McKissack, A., & Xu, J. (2011). Working Paper 2011-01: Chinese macroeconomic management through the crisis and beyond. Retrieved from The Treasury: http://www.treasury.gov.au/PublicationsAndMedia/Publications/2011/Chinese-Macroeconomic-Management-Through-the-Crisis-and-Beyond/working-paper-2011-01/Chinas-stimulus-package
James, E., McLoughlin, K., & Rankin, E. (2014, June). Cross-border Capital Flows since the. Retrieved from Reserve Bank of Australia: http://www.rba.gov.au/publications/bulletin/2014/jun/pdf/bu-0614-8.pdf

Regional Outlook 19
Miller, D. (2003). Market, State, and Community: Theoretical Foundations of Market Socialism. Online: Oxford Scholarship. doi:10.1093/0198278640.001.0001
Minerals Council of Australia. (2014). Coal Hard Facts. Retrieved from Minerals Council of Australia: https://www.whitehavencoal.com.au/investors/docs/coal-hard-facts-minerals-council-australia.pdf
Mishkin, F., & Eakins, S. (2012). Financial Markets and Institutions. Pearson. Naughton, B. (2006). The Chinese economy: transitions and growth. Cambridge, Mass:
MIT Press. https://mitpress.mit.edu/books/chinese-economy OECD. (1999). The Future of the Global Economy. Retrieved from Organisation for
Economic Co-operation and Development: http://www.oecd.org/futures/35394025.pdf
OECD. (2011, July). Pursuing Strong, Sustainable and Balanced Growth: Taking Stock of Structural Reform Commitments. Retrieved from Organisation for Economic Co-operation and Development: https://www.oecd.org/general/48972156.pdf
Onselen, L. V. (2013, October 15). Australia's GFC Fallout Merely Delayed. Retrieved from Macro Business: http://www.macrobusiness.com.au/2013/10/australias-gfc-fallout-merely-delayed/
Pei, M. (2016, May 26). China’s Middle Class Is About to Demand Big Changes. Retrieved from Fortune: http://fortune.com/2016/05/26/china-middle-class-changes/
Pezzini, M. (2012). An emerging middle class. Retrieved from Organisation for Economic Co-operation and Development (OECD): http://oecdobserver.org/news/fullstory.php/aid/3681/An_emerging_middle_class.html
Priestley, M. (2010). Australia, China and the Global Financial Crisis. Retrieved from Parliament of Australia: http://www.aph.gov.au/About_Parliament/Parliamentary_Departments/Parliamentary_Library/pubs/BriefingBook43p/australiachinagfc
Ravallion, M. & Chen, S. (2007). China's (uneven) progress against poverty. Journal Of Development Economics, 82(1), 1-42. http://dx.doi.org/10.1016/j.jdeveco.2005.07.003
Riley, T. (2012). Trends in Australiaʼs Trade and the Balance of Payments. Retrieved from University of Wollongong: https://business.uow.edu.au/content/groups/public/@web/@commerce/documents/doc/uow127014.pdf
Randall, G. (2014, January 10). The Political Economy of Global Transformation: Susan Strange, E.H. Carr and the Dynamics of Structural Change. Ottawa, Ontario, Canada. Retrieved from Princeton University: https://www.princeton.edu/~pcglobal/conferences/strange14/germain.pdf
RBA. (2016). Balance of Payments and External Position. Reserve Bank of Australia. Retrieved from Reserve Bank of Australia: http://www.rba.gov.au/chart-pack/balance-payments.html
Richards, D. G. (2004). Intellectual Property Rights and Global Capitalism: M. E. Sharpe Incorporated.
RMIT. (2016). The Australian APEC Study Centre. Retrieved from RMIT University: https://www.rmit.edu.au/about/our-education/academic-colleges/college-of-business/industry/australian-apec-study-centre
Roberts, I., Saunders, T., Spence, G., & Cassidy, N. (2016). China’s Evolving Demand for Commodities. In Structural Change in China: Implications for Australia and the World. Sydney: Reserve Bank of Australia. Retrieved from: http://www.rba.gov.au/publications/confs/2016/pdf/rba-conference-volume-2016-roberts-saunders-spence-cassidy.pdf
Robinson, G. (2009, February 4). Rudd's stimulus package: what will you get? Retrieved from Sydney Morning Herald: http://www.smh.com.au/articles/2009/02/04/1233423265116.html
Ruggie, J. (1982). International regimes, transactions, and change: embedded liberalism in the postwar economic order. International Organization, 36(02), p. 393.

The Australia-China Trade and Investment Relationship
20 Regional Outlook
Schifferes, S. (2008). How Bretton Woods reshaped the world. Retrieved from British Broadcasting Corporation: http://news.bbc.co.uk/2/hi/business/7725157.stm
Schmukler, S. L. (2004, June). Benefits and Risks of Financial Globalization: Challenges for Developing Countries. Retrieved from The World Bank: http://siteresources.worldbank.org/DEC/Resources/BenefitsandRisksofFinancialGlobalizationSchmukler.pdf
Smitha, F. E. (2015). Reforms under Deng Xiaoping. Retrieved from MACROHISTORY: WORLDHISTORY: http://www.fsmitha.com/h2/ch32prc.html
SPF-CSIS joint commission. (2013). The Future Economic Growth of China and Security in East Asia. Retrieved from Sasakawa Peace Foundation USA:
http://spfusa.org/wp-content/uploads/2015/02/3-Growth-of-China.pdf Steil, B. (2013). The Battle of Bretton Woods. Princeton: Princeton University Press. p.
132. Stephey, M. (2008). Bretton Woods System. Retrieved from Time:
http://content.time.com/time/business/article/0,8599,1852254,00.html Swain, R. (2009). RBA Economic Competition 2009: Policy Responses to the Global
Financial Crisis. Retrieved from Reserve Bank of Australia: http://www.rba.gov.au/education/economics-competition/2009/pdf/second-prize.pdf
Swan, W., & Tanner, L. (2008). Mid-Year Economic and Fiscal Outlook. Retrieved from Australian Government - Budget: http://www.budget.gov.au/2008-09/content/myefo/download/MYEFO_2008_09.pdf
The World Bank. (2016). China Country Overview. Retrieved from The World Bank: http://www.worldbank.org/en/country/china/overview
Taylor, P., & Costello, R. (2016, 3 July). Australia’s triple-A credit rating seriously put in question. Herald Sun. Retrieved from News.com.au: http://www.news.com.au/finance/economy/australian-economy/sp-puts-australia-on-credit-watch/news-story/b8a7f8ae8ab451cdf45874d701087348
The Treasury. (2010). China: growth, urbanisation and mineral resource demand. Economic Roundup(2). Retrieved from Australian Government - The Treasury: http://www.treasury.gov.au/PublicationsAndMedia/Publications/2010/Economic-Roundup-Issue-2/Report/China-growth-and-urbanisation
The Treasury. (2012). Australia-China: Not just 40 years. Economic Roundup(4). Retrieved from Australian Government - The Treasury: http://www.treasury.gov.au/PublicationsAndMedia/Publications/2012/Economic-Roundup-Issue-4/HTML/article1
The World Bank. (2015, January). GDP per capita growth (annual %). Retrieved from The World Bank: http://data.worldbank.org/indicator/NY.GDP.PCAP.KD.ZG/countries/1W-AU-US-OE-JP-GR?display=graph
Thirlwell, M. (2015, February 06). The dollar and competitiveness. Retrieved from Austrade: http://www.austrade.gov.au/News/Economics-at-Austrade/the-dollar-and-competitiveness
TIQ. (2016). China-Australia Free Trade Agreement. Brisbane: Trade & Investment Queensland.
Vidot, A. (2015). Australian farmers prepare to reap the benefits as China trade deal takes effect. ABC. Retrieved from the Australian Broadcasting Channel: http://www.abc.net.au/news/2015-12-18/agricultural-exporters-look-to-benefits-as-chafta-takes-effect/7039772
Wang, Z. (2008). Understanding Transition in China: Domestic Tensions, Institutional Adjustment and International Forces. Department of International Political Economy. SIS, Peking University, China. Retrieved from Princeton University: https://www.princeton.edu/~pcglobal/conferences/beijing08/papers/Wang.pdf
White, G. (2013, August 13). How Strong is Australia's Economy? Retrieved from The Conversation: https://theconversation.com/factcheck-how-strong-is-australias-economy-16716
Regional Outlook 21
Wikan, V. (2015, March 21). What is ‘Neo-Liberalism’ and How Does It Relate to Globalisation? Retrieved from E-International Relations: http://www.e-ir.info/2015/03/21/what-is-neoliberalism-and-how-does-it-relate-to-globalization/
Whyte, M. K. (2012, September). Current History: China’s Post-Socialist Inequality. Retrieved from Harvard University: http://scholar.harvard.edu/files/martinwhyte/files/whyte-current_history.pdf
World Bank. (2015, January). What Lies Behind the Global Trade Slowdown? Retrieved from The World Bank:
https://www.worldbank.org/content/dam/Worldbank/GEP/GEP2015a/pdfs/GEP2015a_chapter4_report_trade.pdf
World Bank. (2016). GDP Growth. Retrieved from The World Bank: http://data.worldbank.org/indicator/NY.GDP.MKTP.KD.ZG?end=2015&locations=Z4-AU-CN&start=1971
World Trade Organisation. (2014). The increasing importance of developing countries in the global economy. Retrieved from the World Trade Organisation: https://www.wto.org/english/res_e/booksp_e/wtr14-2b_e.pdf
Wu, H. & Li, Z. (1996). Research on rural-to-urban labour migration in the post-reform China (1st ed.). Adelaide, SA, Australia: Chinese Economy Research Unit, University of Adelaide.
Xinhua. (2016, August 15). China largely succeeds in RMB exchange rate reform. Retrieved from China.org: http://www.china.org.cn/business/2016-08/15/content_39090775.htm
Yueh, L. (2012). China’s Strategy towards the Financial Crisis and Economic Reform. Retrieved from The London School of Economics and Political Science: http://www.lse.ac.uk/IDEAS/publications/reports/pdf/SR012/yueh.pdf
Zhu, T. (2003). States in the Global Economy: Bringing Domestic Institutions Back In. Cambridge: Cambridge University Press. Retrieved from: http://www.politicaleconomy.cn/bc03zhu.pdf

A Comparative Study of the Accessibility and Quality of Public Healthcare Services in Rural and Urban Regions of China and Australia
22 Regional Outlook
2. A Comparative Study of the Accessibility and Quality of Public Healthcare Services in Rural and Urban Regions of China and Australia
Na
ncy Wei, Che Hooper and Shanshan Ling
Introduction
Australia and China share very strong economic and political ties, but how do their public healthcare systems compare? This report will look specifically at the differences in accessibility to public health services in rural and urban regions of China and Australia. Public health concerns the global population. It focuses on the control and minimization of calamitous events; of containing deadly infectious and preventable diseases. Public health aims to improve the living and working conditions that affect the health of us all. It equips the population with safe food, water, and sanitation – all to advance healthier lifestyles (Keleher, 2016). Access is a critical notion in health policy and health services research, however it can be difficult to define (Penchansky & Thomas, 1981). We will present it as a general concept that encapsulates a set of specific dimensions: availability, accessibility, affordability, acceptability, and quality of care.
Availability
Australia
The Australian Institute of Health and Welfare’s report on hospital statistics revealed that in 2014-15, although major cities had more than twice the amount of available hospital beds than regional areas (40,847 beds for major cities vs 17,718 beds for regional areas) and again, regional areas had roughly 10 times the number of beds than remote areas (1,775 beds for remote areas) (Australian Institute of Health and Welfare, 2016, p.26), the proportion of beds per amount of population remained roughly the same (2.5 beds for major cities, 2.8 beds for regional areas and 3.3 beds for remote areas per 1,000 individuals) (Australian Institute of Health and Welfare, 2016, p.26). This suggests that from purely an availability perspective, people living in all remoteness levels have equally available beds. However, there was a huge difference in the types of beds available across geographical areas, suggesting particularly a disadvantage towards people living in remote Australia. For example, of the 165 public rehabilitation units, only 2 of them were located in remote areas. Similarly, only 8 out of 153 oncology units and 1 out of 81 intensive care units were located in remote areas. Remote areas also had no access to neonatal intensive care units or in-vitro fertilisation units and had no psychiatric or Women’s and children’s hospitals (Australian Institute of Health and Welfare, 2016, p.36). Even without taking into account the accessibility of these remote healthcare facilities for patients, the numbers show a striking unavailability of healthcare services to Australians living in remote areas.

Regional Outlook 23
China
According to the 2015 China Statistical Yearbook, there are roughly the same amount of beds in medical institutions in urban and rural areas (3,169,800 beds for urban areas vs 3,431,334 beds for rural areas), however the number of beds per person in rural areas is less than half the amount in urban areas (7.84 beds per 1000 urban residents vs 3.54 beds per 1000 rural residents) (National Bureau of Statistics of China, 2015). The number of medical professionals in urban areas per capita is also much higher than in rural areas (9.70 per 1000 people in urban areas vs 3.77 per 1000 people in rural areas) (National Bureau of Statistics of China, 2015), establishing a disparity between health care availability in urban and rural areas of China. According to the World Health Organisation the lack of trained professionals in rural areas, alongside a lack of adequate facilities, leads to an absence of specialized care (e.g. emergence obstetrics and trauma centres) outside of urban areas (Office of the World Health Organization Representative in China, 2005, p.16). Hence, in assessing this raw data it becomes apparent that China and Australia may face similar issues in the lack of availability of certain health care services for their rural populations compared to urban areas.
Accessibility
Accessibility can be defined as the relationship between the locality of supply and the locality of clients, taking into consideration client travel time, resources, distance, waiting time and cost (Penchansky & Thomas, 1981). Barriers to accessibility can also include shortages of general practitioners, specialist services, and a range of other health services. This is more predominant in rural and remote areas, however can also present as an issue in urban areas (Roxon, 2009). It is a common trend in Australia and China for people living in rural areas to have less access to health services and travel greater distances to seek medical support (AIHW, 2014).
Travel Time
A study conducted in 2011 revealed the travel time of patients seeking care in China. Data was collected from the years 1989 to 2004 and measured according to the time in minutes it took to travel one way by bicycle from the patient’s home to a facility. Overall, a decrease in travel time was seen over the 15-year period, where most of the improvements were seen in urban hospitals; a decrease on average from 17 to 14 minutes. However, travel time to health clinics saw a substantial increase in travel time, from 5.6 minutes in 1989, to 9.1 minutes in 2004, as recorded in urban areas (Figure 1). Rural clinics also saw increases in travel time, yet were not as marked for urban clinics (Vedom & Cao, 2011). Nevertheless, travel time to clinics is almost half the travel time to hospitals. Chinese hospitals in urban and rural areas are considered to be proportionately accessible in regards to travel time, although there is a slight urban-rural gap in travel time to clinics, with rural residents being favoured (Vedom & Cao, 2011).
Figure 1: Changes in average travel time according to geographical indicators of accessibility to health care in China from 1989 to 2004
Source: (Vedom & Cao, 2011)
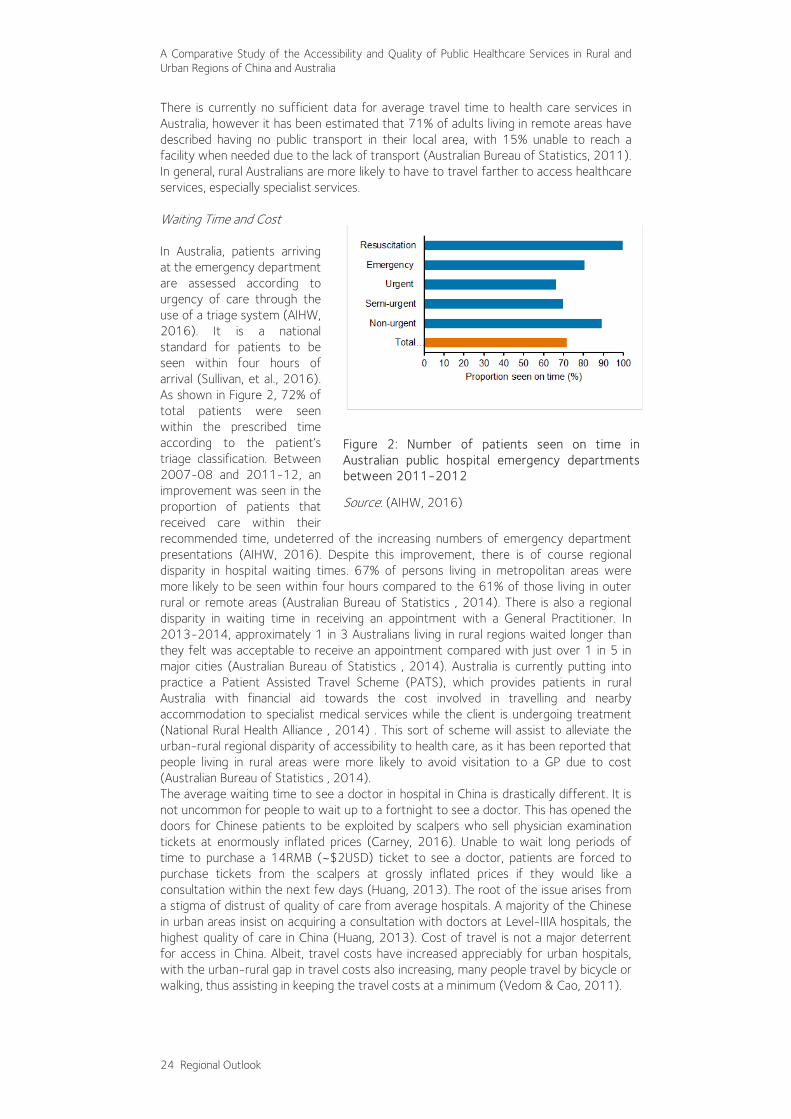
A Comparative Study of the Accessibility and Quality of Public Healthcare Services in Rural and Urban Regions of China and Australia
24 Regional Outlook
There is currently no sufficient data for average travel time to health care services in Australia, however it has been estimated that 71% of adults living in remote areas have described having no public transport in their local area, with 15% unable to reach a facility when needed due to the lack of transport (Australian Bureau of Statistics, 2011). In general, rural Australians are more likely to have to travel farther to access healthcare services, especially specialist services.
Waiting Time and Cost
In Australia, patients arriving at the emergency department are assessed according to urgency of care through the use of a triage system (AIHW, 2016). It is a national standard for patients to be seen within four hours of arrival (Sullivan, et al., 2016). As shown in Figure 2, 72% of total patients were seen within the prescribed time according to the patient’s triage classification. Between 2007-08 and 2011-12, an improvement was seen in the proportion of patients that received care within their recommended time, undeterred of the increasing numbers of emergency department presentations (AIHW, 2016). Despite this improvement, there is of course regional disparity in hospital waiting times. 67% of persons living in metropolitan areas were more likely to be seen within four hours compared to the 61% of those living in outer rural or remote areas (Australian Bureau of Statistics , 2014). There is also a regional disparity in waiting time in receiving an appointment with a General Practitioner. In 2013-2014, approximately 1 in 3 Australians living in rural regions waited longer than they felt was acceptable to receive an appointment compared with just over 1 in 5 in major cities (Australian Bureau of Statistics , 2014). Australia is currently putting into practice a Patient Assisted Travel Scheme (PATS), which provides patients in rural Australia with financial aid towards the cost involved in travelling and nearby accommodation to specialist medical services while the client is undergoing treatment (National Rural Health Alliance , 2014) . This sort of scheme will assist to alleviate the urban-rural regional disparity of accessibility to health care, as it has been reported that people living in rural areas were more likely to avoid visitation to a GP due to cost (Australian Bureau of Statistics , 2014). The average waiting time to see a doctor in hospital in China is drastically different. It is not uncommon for people to wait up to a fortnight to see a doctor. This has opened the doors for Chinese patients to be exploited by scalpers who sell physician examination tickets at enormously inflated prices (Carney, 2016). Unable to wait long periods of time to purchase a 14RMB (~$2USD) ticket to see a doctor, patients are forced to purchase tickets from the scalpers at grossly inflated prices if they would like a consultation within the next few days (Huang, 2013). The root of the issue arises from a stigma of distrust of quality of care from average hospitals. A majority of the Chinese in urban areas insist on acquiring a consultation with doctors at Level-IIIA hospitals, the highest quality of care in China (Huang, 2013). Cost of travel is not a major deterrent for access in China. Albeit, travel costs have increased appreciably for urban hospitals, with the urban-rural gap in travel costs also increasing, many people travel by bicycle or walking, thus assisting in keeping the travel costs at a minimum (Vedom & Cao, 2011).
Figure 2: Number of patients seen on time in Australian public hospital emergency departments between 2011-2012
Source: (AIHW, 2016)
Regional Outlook 25
Affordability (Insurance Policies)
Australia
The core of the medical insurance system in Australia is composed of 2 parts. The Australian government’s funding contributions at present includes the universal public healthcare scheme; Medicare (AIHW, 2016). The Medicare system was created so that free, or subsidised health care could be provided by health professionals. The system encompasses hospital, medical and pharmaceutical measures. This universal coverage scheme aims to provide all Australian’s across urban and rural regions the equity of access to satisfactory health care. Medicare does so by providing free treatment for patients in public hospitals. Other major elements of Medicare include subsidisation of various prescription medication under the Pharmaceutical Benefits Scheme, and rebates for health services that are listed on the Medicare Benefits Schedule (Department of Human Services, 2014). Persons may have Medicare coverage only, or a combination of public and private health insurance (PHIO, 2013). It is within the private health care system, where the disparity between rural and urban populations’ access to healthcare is apparent. Many rural and remote patients are unable to afford the cost of private health insurance (PHI), yet those that do have PHI are often appreciably under-assisted by a lack of access to private healthcare services in their local area. Another issue arises in the fact that rural Australian’s tend to experience poorer health outcomes overall, with higher rates of chronic disease than their urban counterparts, thus they simply cannot afford the rising cost of PHI, both in regards to annual cover, and also excess plus gap payments (RDAA, 2015). These issues were mirrored in the responses of a consumer survey performed by the Coalition. Out of 40,000 responses, over 75% of Australians living in rural and remote regions believed they were not receiving value for money from their PHI provider, in comparison to 68% of the population in major cities (Ley, 2016). Medicare as a universal health insurance system is highly respected in terms of providing basic medical needs for all citizens. However, to a certain extent this system creates a heavy patient burden with low efficiency. Some patients are required to wait for more than a year to receive elective surgery. Therefore, issues of equity between rural and urban PHI should be reflected on so as to encourage populations to participate, and subsequently reduce the pressure on the Medicare system.
China
China establishes basic medical insurance for people via the Urban Employee Basic Medical Insurance (UEBMI), Urban Resident Basic Medical Insurance (URBMI) and New Rural Cooperative Medical Scheme (NRCMS) (Uchimura, 2012). UEBMI is paid by the employing units and individuals to establish a medical insurance fund. After participants’ illness, treatment and medical expenses are incurred, the medical insurance will give some economic compensation in order to avoid or reduce the workers’ economic risk due to illness and treatment (Shafrin, 2013). In addition, the Government provides a high proportion of financial subsidies for the Urban Resident Basic Medical Insurance and New Rural Cooperative Medical Scheme. The NRCMS was implemented in hopes to minimize the disparity of health care costs between rural and urban regions. There is a correlation between low income and residing in rural areas, and with a low income, rural residents tend to avoid health services, and seek early discharge from hospitals (Kelaher & Dollery, 2003). Following the economic reform in China, it was estimated that less than 10% of the rural population was covered by insurance schemes from the late 1980s to 2000, while ~56% of urban residents were covered by some form of insurance. Government funded medical coverage decreased from 44% to 39% from 1998-2003, while there was an increase

A Comparative Study of the Accessibility and Quality of Public Healthcare Services in Rural and Urban Regions of China and Australia
26 Regional Outlook
in non-mainstream insurance, from 11% to 16%. This has resulted in stress on the affordability of health insurance and access for low income rural residents (Tang, et al., 2008).
Summary
The financial subsidy systems in both China and Australia have their specific backgrounds, such as population of the country. The economic development status decides the capability of providing medical and health services. In general, governments play the main role in the health insurance system, and the specific amount of financial input can affect the level of protection. Australia is a country with abundant resources and stable economic development, thus health insurance can be implemented for free or low-cost models of national health services. On the other hand, the pressure of an enormous population and economic development pressures in China make it difficult to implement the national health service model, however it is crucial to be able to achieve full coverage of basic medical insurance as soon as possible in China. China is trying to achieve the goal of universal health insurance, and has invested a wealth of financial support with remarkable results. Yet whether the government can establish a standard, long-term and institutional financial support mechanism at the national level, and whether the sources of financing can be stable and sustainable, will directly affect the fund balance and sustainable development of China's medical insurance system as a whole. Over-reliance on high input and ignoring the output and the results of the efficiency of China's medical security system is one of the causes of poor efficiency. Therefore, it is very important to establish and perfect the performance evaluation system of financial investment, strengthen the management of performance budget, increase the efficiency of tracing, and eliminate or reduce the wastage of medical insurance fund.
Acceptability (Attitudes Towards Healthcare)
In both China and Australia there could be perceived to be two ‘fields’ of medicine – western and alternative medicine, including traditional Chinese medicine. One study performed by (Chan et al., 2003) on Hong Kong Chinese, found that the group of people who were more likely to be sceptical of Western medicine tended to be female, older, from lower socioeconomic backgrounds and with lower education. This group had a greater amount of trust in traditional Chinese medicine. In contrast, an Australian study on complementary and alternative medicine use (Xue, Zhang, Lin, Da Costa, & Story, 2007) found that the group of people most likely to use alternative medicine in Australia were female, but tended to be younger than the Chinese group, with a greater level of education and from higher income households. Whilst the Hong Kong study asked participants to rank their trust of western verses Chinese herbal medicine, and the Australian survey asked simply for participation in western verses complementary medicine regimes, these two studies may be indicative of cultural differences. Another study done on a group of Hong Kong Chinese (Lam, 2001) showed that the Chinese population perceives traditional and western medicines as having different strengths and weaknesses and hence are sought for different conditions. Western medicine is thought of as faster-acting, stronger but with significant side effects. Traditional medicine on the other hand, is used more preferentially for milder conditions, to counteract the side effects of western medicine or if western medicine has failed to produce an improvement in the person. It is also believed that traditional medicines are “better in curing diseases completely” (p.764) and that western medicine leaves the “root of the disease” (p.764). Similar reasons may be driving the Australian population to use complementary medicine. A critical review of a wide range of research on
Regional Outlook 27
complementary medicine use in Australia (Reid, Steel, Wardle, Trubody, & Adams, 2016), found that a common theme among users were a desire to reduce the side-effects of western medicine or for use when conventional treatments had failed. Hence, although the demographics of the users of complementary/traditional Chinese medicine differ between China and Australia, the underlying reasons for its use may be the same.
Quality of Care
Quality of healthcare is a complex concept which can be defined in many ways. In a broader context, quality refers to the extent that health care services produce the desired outcome (AIHW, 2016). In assessing the quality of healthcare, the following characteristics must be considered:
• Structure of health care, referring to the conditions in which treatment is provided and level of training of health workers
• Process of care, referring to characteristics of what is done in giving and receiving care
• Outcome of care, referring to the effect of care on the patient’s health (Wilson & Goldschmidt, 1995)
China
The quality of care varies and facilities varies greatly in terms of size and services offered geographically. Hospitals in rural areas have markedly fewer beds and qualified medical personnel (Vedom & Cao, 2011). Rural areas feature two times less medical professionals, with the quality of care and degree of training also being considerably lower than that found in urban areas (Meng, 2007). A study performed in 2001 by Wang et al., discovered that around 70% of village doctors did not receive any formal medical education and acquired an average of only 20 months of medical training (Eggleston, Ling, Qingyue, Lindelow, & Wagstaff, 2007). Prior to the economic shift in policy in the late 1970s, village health providers were known as “barefoot doctors”. They received very basic modern medical training, with their main focus being disease prevention and treatment of common ailments. Following the economic shift, barefoot doctors were retitled to village doctors. Although they are required to pass formal examination before practicing, many village doctors do not have the appropriate training to manage treatments rather than preventative mechanisms. This has led to the increase in misdiagnoses in rural areas, along with ill-advised prescriptions (Valentine, 2005). There has been indication that quality of health care in China is improving, however these improvements appear to be primarily limited to urban areas and specific dimensions of quality (Zhuang & Tang, 2001). The quality of treatment at public hospitals differs immensely depending on location. Superlative treatments are usually found at the public city-level hospitals, followed by smaller district-level clinics (Just Landed, 2016). Patients are becoming more distrustful towards the quality of care of average hospitals and are insistent on consulting with physicians at Level III-A hospitals in urban areas so that they may receive the highest level of care possible (Huang, 2013).
Australia
The quality of care in Australia is at a high standard as the health care system ranks well internationally, which is indicated by the low rate of infant mortality and high average life expectancy (Armstrong, Gillespie, Leeder, Rubin, & Russell, 2007). Health care is both affordable and generally accessible to the population. The system is operated by trained professionals with high skill levels, and Australians can rationally expect a high level of care. The process of becoming a qualified medical practitioner in Australia is a long process, usually requiring a minimum of 10 years to become a General Practitioner, otherwise additional vocational training may require another 3-8 years (McNamara,
A Comparative Study of the Accessibility and Quality of Public Healthcare Services in Rural and Urban Regions of China and Australia
28 Regional Outlook
2012). The extensive level of training ensures that Australia’s physicians are able to provide the best quality of medical care. Despite high levels of care, the patients’ experiences of the health care system are less than idyllic. Access to healthcare, although quite comprehensive, is frequently delayed because public hospitals are recurrently in monetary deficit and have insufficient resources. There is an appreciable misdistribution and shortage of health workers, having the biggest impact on rural areas, and the care given is not the safest possible (Smallwood, 2006). Medical errors in Australia cost over $1 billion yearly (Richardson & McKie, 2007). The Quality in Australian Health Care Study revealed that around half of the errors are likely to be preventable (Wilson, et al., 1995). There has been inadequate data at both state and national levels, in the public and private sectors, and for in/out-of-hospital care to determine whether quality and safety policies has created improvements over the last decade. China and Australia have different issues that arise in discussion of the quality of care presented to their populations. A common trend however, is that rural areas in both countries feature health workforce shortages, which has a detrimental impact on the quality and safety of care that should be provided.
Conclusion
This paper attempted to evaluate the differences faced by rural and urban populations’ access to health care in Australia and China. “Access to health care” was broken down into five subgroups: availability, accessibility, affordability, acceptability, and quality of care. Accessibility took into account travel to services; indicating little difference in travel time for rural and urban Chinese populations, however Australian rural populations were sometimes unable to attend services due to transport problems. Waiting time to see a medical professional revealed that rural patients in Australia face longer waiting times, whereas there is a much higher cost of care in China if patients want a shorter waiting time. Assessing the availability of health care services showed that in both China and Australia, there is a lack of specialty services in rural areas. Quality of care in china was shown to be markedly lower in rural areas due to a lack of services and appropriate training of medical personal, whereas in Australia accessibility and distribution of health professionals in rural areas seemed to have the biggest impact on the decreased quality of care. Acceptability focused on the perceived differences in western vs traditional or alternative medicine with Australia and China showing different traditional/alternative medicine user demographics, although the underlying reasons for use may be similar. Affordability revealed that Australia’s public health sector was more equitable in terms of rural and urban access compared to China, however both countries presented with issues in the private health insurance schemes. Through the use of the five subgroups, there is a significant difference between the access to healthcare services in rural and urban populations of China and Australia, with urban areas tending to have greater access.
Bibliography
AIHW. (2014). Understanding Health and Illness . Retrieved from Australian Institute of Health and Welfare : http://www.aihw.gov.au/australias-health/2014/understanding-health-illness/
AIHW. (2016). Australia's health system. Retrieved from Australian Institute of Health and Welfare : http://www.aihw.gov.au/australias-health/2014/health-system/
Regional Outlook 29
AIHW. (2016). Definitions of safety and quality of health care. Retrieved from Australian Institute of Health and Welfare : http://www.aihw.gov.au/sqhc-definitions/
AIHW. (2016). Hospital performance: emergency department waiting times. Retrieved from Australian Institute of Health and Welfare: http://www.aihw.gov.au/haag10-11/hospital-performance-emergency-department-wait/
Armstrong, B. K., Gillespie, J. A., Leeder, S. R., Rubin, G. L., & Russell, L. M. (2007). Challenges in health and health care for Australia. The Medical Journal of Australia , 187(9), 485-489.
Australian Bureau of Statistics . (2011). The Health and Welfare of Australia's Aboriginal and Torres Strait Islander Peoples. Canberra: ABS.
Australian Bureau of Statistics . (2014). Regional and remote Australians face more health care barriers. Canberra: Commonwealth of Australia .
Australian Institute of Health and Welfare, (2016). Hospital resources 2014–15: Australian hospital statistics (pp. 19-27, 29-41). Canberra: AIHW.
Carney, M. (2016, June 18). Keeping the doctor away: China's scalpers exploiting hospital wait times. Retrieved from ABC News : http://www.abc.net.au/news/2016-06-18/keeping-the-doctor-away:-china's-scalpers/7522916
Chan, M., Mok, E., Wong, Y., Tong, T., Day, M., Tang, C., & Wong, D. (2003). Attitudes of Hong Kong Chinese to traditional Chinese medicine and Western medicine: survey and cluster analysis. Complementary Therapies in Medicine, 11(2), 103-109. http://dx.doi.org/10.1016/s0965-2299(03)00044-x
Department of Human Services. (2014). DHS Annual Report 2013-14 - Department of Human Services. Canberra : Australian Government.
Eggleston, K., Ling, L., Qingyue, M., Lindelow, M., & Wagstaff, A. (2007, September 20). Health service delivery in China: a literature review . Health Economics , 17 , 149-165.
Huang, E. (2013, May 30). It Isn't Getting Any Easier to Get a Doctor's Appointment in China. Retrieved from The Atlantic: http://www.theatlantic.com/china/archive/2013/05/it-isnt-getting-any-easier-to-get-a-doctors-appointment-in-china/276400/
Kelaher, D., & Dollery, B. (2003). Health Reform in China: An Analysis Of Rural Health Care Delivery . School of Economics . Armidale : University of New England.
Keleher, H. (2016). Understanding the Australian Health Care System. Chatswood, NSW, Australia: Elsivier.
Lam, T. (2001). Strengths and weaknesses of traditional Chinese medicine and Western medicine in the eyes of some Hong Kong Chinese. Journal of Epidemiology & Community Health, 55(10), 762-765. http://dx.doi.org/10.1136/jech.55.10.762
Ley, S. (2016, June 12). Coalition's plan for improved rural access to private health cover. Retrieved from liberal.org.au: https://www.liberal.org.au/latest-news/2016/06/12/coalitions-plan-improved-rural-access-private-health-cover
McNamara, S. (2012). Does it take too long to become a doctor? The Medical Journal of Australia, 196(8), 528-530.
Meng, Q. (2007). Developing and implementing equity-promoting health care policies in China. Shandong : Center for Health Management and Policy.
National Bureau of Statistics of China, (2015). China Statistical Year Book 2015. Beijing: China Statistics Press.
National Rural Health Alliance. (2014). Patient Assisted Travel Schemes. Deakin West: NRHA Inc.
Office of the World Health Organization Representative in China, (2005). China: Health, Poverty and Economic Development (pp. 6-8, 14-16). Beijing: World Health Organization.
Penchansky, R., & Thomas, J. W. (1981). The Concept of Access: Definition and Relationship to Consumer Satisfaction. Medical Care, 127-140.

A Comparative Study of the Accessibility and Quality of Public Healthcare Services in Rural and Urban Regions of China and Australia
30 Regional Outlook
PHIO. (2013). What is covered by Medicare? Retrieved from privatehealth.gov.au: http://www.privatehealth.gov.au/healthinsurance/whatiscovered/medicare.htm
RDAA. (2015, November 15). Review must consider the big barriers to private healthcare for rural Australians. Retrieved from Rural Doctors Association of Australia : http://www.rdaa.com.au/sites/default/files/public/Review%20must%20consider%20the%20big%20barriers%20to%20private%20healthcare%20for%20rural%20Australians%20--%20November%202015.pdf
Reid, R., Steel, A., Wardle, J., Trubody, A., & Adams, J. (2016). Complementary medicine use by the Australian population: a critical mixed studies systematic review of utilisation, perceptions and factors associated with use. BMC Complementary and Alternative Medicine, 16(1). http://dx.doi.org/10.1186/s12906-016-1143-8
Richardson, J., & McKie, J. (2007). Reducing the Incidence of Adverse Events in Australian Hospitals: An Expert Panel Evaluation of Some Proposals. Centre for Health Economics. Melbourne : Monash University .
Roxon, N. (2009, April 20). 5.2.3 Barriers to accessing health care access, Development of a new national women’s health policy consultation paper, Canberra, Australian Capital Territory , Australia: Commonwealth of Australia.
Shafrin, J. (2013, July 7). Health Reform in China. Retrieved from Healthcare Economist : http://healthcare-economist.com/2013/07/07/health-reform-in-china/
Smallwood, R. A. (2006, May 16). The safety and quality of health care: from Council to Commission. The Medical Journal of Australia , 184(10), 39-40.
Sullivan, C., Staib, A., Khanna, S., Good, N. M., Boyle, J., Cattell, R., Scott, I. A. (2016). The National Emergency Access Target (NEAT) and the 4-hour rule: time to review the target. The Medical Journal of Australia , 204(9), 354. Retrieved from Life in the fastlane: http://lifeinthefastlane.com/the-four-hour-rule-comes-to-australia/
Tang, S., Meng, Q., Chen, L., Bekedam, H., Evans, T., & Whitehead, M. (2008, October 31). Health System Reform in China 1: Tackling the challenges to health equity in China. The Lancet, 372(9648), 1493-1501.
Uchimura, H. (2012). Health Systems Reforms in China: What is Needed for the Next Step . IDE-JETRO.
Valentine, V. (2005, November 4). Health for the Masses: China's 'Barefoot Doctors'. Retrieved from npr.org: http://www.npr.org/templates/story/story.php?storyId=4990242
Vedom, J., & Cao, H. (2011). Health Care Access and Regional Disparities in China. Espace, populations, sociétés, 63-78.
Wilson, L., & Goldschmidt, P. (1995). Quality management in health care. Sydney: McGraw-Hill Book Company.
Wilson, R. M., Runciman, W. B., Gibberd, R. W., Harrison, B. T., Newby, L., & Hamilton, J. D. (1995). The Quality in Australian Health Care Study. The Medicine Journal of Australia.
Xue, C., Zhang, A., Lin, V., Da Costa, C., & Story, D. (2007). Complementary and Alternative Medicine Use in Australia: A National Population-Based Survey. The Journal of Alternative and Complementary Medicine, 13(6), 643-650. http://dx.doi.org/10.1089/acm.2006.6355
Zhuang, N., & Tang, S. (2001). Application and research on methods of adjustment of medical quality and case mix in measurement of hospital service efficiency. Journal of Health Resources, 4(3), 127-129.
Regional Outlook 31
3. Education Inequality: A Comparison of Urban and Rural Primary Schools in China and Australia
Introduction
This report aims to discover the difference in quality of education between rural and urban primary schools. In order to effectively compare primary education inequality between Chinese and Australian urban and rural areas, this paper will examine the following. Firstly, education systems in Australia and China will be discussed, followed by an explanation of the important indicators of equitable education. Thirdly and Fourthly, Australian and Chinese rural and urban schools will be compared. The term urban refers to schools located in the metropolitan urban and suburban areas of Australian and later in this report, China (Young et al., 1997). The term rural refers to those schools located in rural and remote areas Australia, and China (Young et al., 1997). Lastly, the future of education equality in Australia and China will be discussed.
Background
There is a real need to ensure educational equality for every individual regardless of gender, race, financial status, and geographical location (Young, 1994; Shahar, 2016). Article 26 of the Universal Declaration of Human Rights states that, “everyone has the right to education” (Hong et al., 2015). There is also a strong focus on ensuring that all boys and girls have access to and complete quality primary education, which is apparent in the United Nation’s Sustainable Development Goals. Goal 4 is to “ensure inclusive and equitable quality of education and promote lifelong opportunities for all” (United Nations, 2015). Individuals who are less educated are more likely to be economically and socially vulnerable (Hong et al., 2015). Ideally, individuals regardless of their location should have access to equal opportunities for success (Shahar, 2016). An individual’s lifelong opportunities are often the result of having equitable access to quality education (Hong et al., 2015). Although the importance of education equality is understood, there are severe disparities between rural and urban geographical locations in Australia and China (Loong & Groves, 2011; Hong et al., 2015). One of the outcomes from this disparity is an uneven distribution of academic achievement between rural and urban Australia (Young, 1994). Lower academic achievement may be linked to fewer opportunities for individual prosperity in the future. China’s large and dispersed population presents several challenges to providing equal access to education (Hong et al., 2015). Australia’s population is not as large as China’s, however it is dispersed and faces a number of challenges in providing equal education (Wilson, 2013). This paper will compare the inequality of primary education in rural versus urban locations of China and Australia and to provide insight to the current situation of educational disparity.
Education Inequality: A Comparison of Urban and Rural Primary Schools in China and Australia
32 Regional Outlook
Education Systems
Australia’s education system includes primary, secondary and tertiary levels (Australian Government: Department of Social Services, 2016). These education systems are managed at the state or territory level in terms of finances and regulations (Australian Government: Department of Social Services, 2016). School is compulsory for children aged between five and 15/17 depending on the state of residence. (Australian Government: Department of Social Services, 2016). In terms of cost to parents, public schooling is free and private schools are available for those who desire a different teaching philosophy. (Australian Government: Department of Social Services, 2016). In their early years of education children are taught language, mathematics and social skills. (Australian Government: Department of Social Services, 2016). Whereas, primary school students are taught a greater range of subjects including English, maths, science, society and environment, technology, and the arts. Generally, students attend a primary school in a location near their residence and spend 40 hours a week at school between 9am and 3pm. Most schools require a uniform, and food is bring or buy your own (Australian Government: Department of Social Services, 2016. Similarly, China also has a three-tier education system (Chauanyou, 2006). The nation’s education systems are jointly managed by The Ministry of Education and local education departments (Ministry of Education, 2015). The Ministry of Education is in charge of formulating education policies and leading the education reform directions, whereas the local education departments are responsible for enforcing these policies (Ministry of Education, 2015). Since the Compulsory Education Law of the People’s Republic of China was implemented in 1985 (Lan Rong & Shi, 2001), public primary school is free. Therefore, it is compulsory for Chinese parents to send their children to primary school. Despite this, private schools still require families to pay fees. The current system of curriculum focuses on Chinese, Mathematics, English, PE, Arts and Music (Chauanyou, 2006). Generally, students attend a school in a location near their residence. However, some parents will send their children further afield to receive a quality education. Students spend 50 hours a week at school between 8am and 6pm. These hours do not include the extra hours required to complete homework. The overall similarities between the two nations are evident. Both nations operate under a three tier system and have compulsory education from a child’s early years. The following section will outline the key indicators to effectively compare the quality of education between rural and urban schools.
Indicators of Quality Education
Throughout this section, indicators of quality education will be discussed. Indicators provide objective information that can effectively assess the quality of education (National Research Council, 2012). The most significant of these indicators include teacher to student ratio, enrolment, teacher qualifications and technology (Crowe et al., 2013). The first indicator of quality education is the teacher to student ratio (National Research Council, 2012, p.22). Within schooling systems, the overcrowded classrooms present a significant barrier in connecting with and teaching students (UNICEF, 2000). Therefore, as this ratio is the number of teachers divided by the number of students, a higher teacher to student ratio indicates better quality education (Crowe et al., 2013). The second indicator of successful student outcomes is student attendance (Wilson, 2013). Attendance influences learning, grades and is highly predictive of eventual educational attainment (National Research Council, 2012, p.27). UNICEF (2000) states that a child’s exposure and opportunity to learn from school, significantly influences achievement. Thirdly, the qualifications and quality of teachers is a vital indicator to assess the quality of education (Douglas, 2011). Not only is it important that teachers

Regional Outlook 33
have up-to-date knowledge, the qualifications of teachers vary in urban and rural areas presenting a variety of issues which will be discussed presently (Wilson, 2013). There are a number of ways to assess the quality of a teacher (Douglas, 2011). For the purpose of this report the focus will be on the level of higher education obtained. Lastly, the technology available to each student is a vital indicator for quality of education, thus the number of computers per student will be discussed. In an increasingly technological world, having access to technology is crucial in developing necessary skills as well as decreasing disparities (UNICEF, 2000). There is vast diversity in terms of the access to these resources, however there is certainty in the fact that technology is part of the educational process. These indicators are able to highlight areas of considerable strength and reveal areas of weakness within the schools. Not only, comparing these indicators encourages improvement and captures future aspirations for education (National Research Council, 2012).
Australia: Rural Versus Urban
Australians in rural communities face a number of barriers in terms of education (Yeung, 2013). The main issues for these young people include access to quality education and opportunities, and negative community attitudes towards education (Yeung, 2013). There is a shortage of teachers in remote areas of Australia (Emily: Teacher Registration Board, personal communication, November 11, 2016). Only 2.3% of the nation’s population of teachers work in remote schools, and 1.1% in very remote schools in Australia (ABS, 2013, Education and work: School Teachers, Figure: Location of Teachers (a) - 2001). Rural communities find it difficult to attract and retain higher quality teachers and as a result, students in a non-urban setting are less satisfied with their education (Yeung, 2013). However interestingly, in remote Australian communities it was discovered teacher quality is less about the level of higher education attained and more “based on the respect and acceptance shown to the local people” (Douglas, 2011, p. 24). In other words, educators who acknowledge and respect the local traditions and culture in rural locations are highly sought after (Douglas, 2011). Despite issues in attracting more highly educated teachers, the teacher to student radio in rural schools is better in rural locations (OECD 2013). This is evidenced by the difference between Marymount Primary (1:16) and Ntaria School (1:9) (see Table 5.1). However, there is an issue in terms of attendance in rural schools (Wilson, 2013). The attendance rate in rural schools is less than in urban schools (Douglas, 2011). Although students in rural schools face a number of barriers, it seems likely they also experience a number of benefits, two of these benefits will be discussed presently. Compared to a rural school the scene in an urban school is assumed to be more technologically advanced, and in some cases this may be true. However, it was discovered that when comparing urban and rural schools in Victoria the use of interactive whiteboards by rural teachers was significantly greater than teachers in urban schools (Loong & Groves, 2011). Another interesting finding is students in an urban setting rely less on the use of the internet than those in rural classrooms (Loong & Groves, 2011). This means, technology represents a significant opportunity to close the quality of education gap in the future. A note of caution about technological advancement is although it has the ability to improve education equality, it can also increase disparities and concerns (Fourlin & Lock, 2006). The gap may be increased as some isolated schools have issues with implementing technology as the resources for maintenance and software selection are not available (Fourlin & Lock, 2006). The second key benefit for rural students is the more favourable teacher to student ratio. Although there is a teacher shortage and attracting quality teachers remains a challenge, as rural and remote Australia has a smaller student population, students enjoy a higher teacher to student ratio compared with their urban peers.

Education Inequality: A Comparison of Urban and Rural Primary Schools in China and Australia
34 Regional Outlook
The table below includes data from an urban primary school, Marymount Primary (Brisbane Catholic Education, 2015) and rural primary school, Ntaria School. The comparison between these two schools adds value to this report by taking a real world look into the key differences reported in the relevant literature.
Table 1: Indicators for Australian urban and rural schools
Australia
Urban (Marymount Primary) Gold Coast, QLD (Brisbane Catholic Education, 2015)
Rural (Ntaria School) Hermannsburg, NT
Teacher:Student Ratio
1:16 1:9 (Northern Territory Government (b), 2014)
No. of computers for students
Prep to Year 3=1:3 Year 4-Year 6= 1:1
Data unavailable
Enrolment 997 167 (Northern Territory Government (b), 2014)
Teacher Qualifications
Master- 16 Postgraduate Diploma/Certificate- 6 Bachelor- 35 Diploma/Certificate- 7
15 full time teachers 4 part time teachers (Northern Territory Government (b), 2014) Minimum qualifications: Bachelor of Education/Teaching or a bachelor’s degree, plus a teaching qualification (Emily: Teacher Registration Board, personal communication, November 11, 2016).
Attendance 94% 62% (Australian Government, 2015, p.4) City/community population
533,660 600 (Douglas, 2011)
China: Rural Versus Urban
Within this report, the chosen schools to compare were the urban primary school attached to Peking University and the rural Wenhua School in the Hedong District. Geographically, 80% of primary schools are situated in urban areas of China (Chauanyou, 2006). Despite China’s compulsory education (Lan Rong & Shi, 2001), the gap in the quality of education is astonishing. Fortunately, the attendance rate of primary schools in rural and urban areas is almost the same, both at 99.7% (Ministry of Education Development Planning and Statistics Division, 2006). Children are entitled to receive education almost for free and parents will be punished if they refuse to send their children to primary schools. In terms of the student-teacher ratio, Peking University has a 1:11 ratio, whereas Wenhua School 18 students per 1 teacher. Although this is not a drastic difference, it emphasises the increased workload for rural teachers and lack of personalised attention for children. Teacher qualifications are one of the key indicators in determining quality and participation rates of school children (Chauanyou, 2006). Despite this, there is a noticeable difference in the qualifications of urban and rural teachers. At the primary school adjacent to Peking university, the teachers all have a master’s degree (The Primary School Attached to Peking University, n.d). Whereas, in the rural school, majority of the teachers have a degree lower than a bachelor's. This is due to the lack of incentives for rural teachers in China, which results in remote rural areas finding it
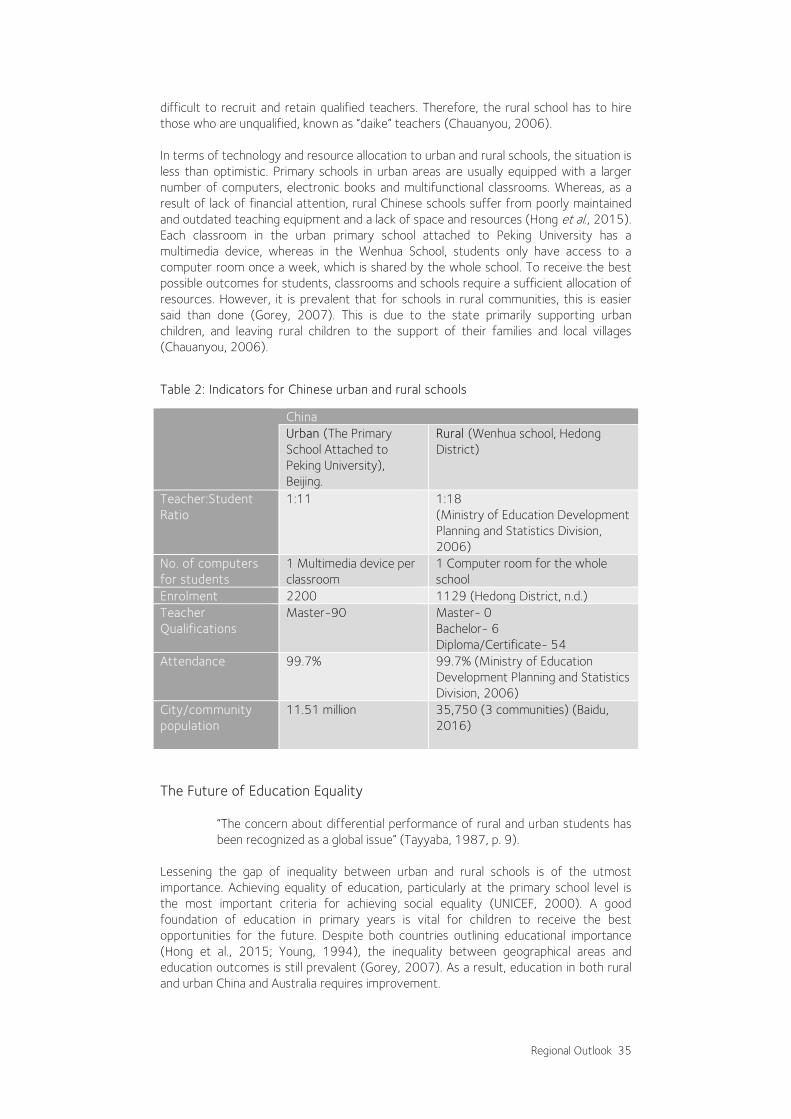
Regional Outlook 35
difficult to recruit and retain qualified teachers. Therefore, the rural school has to hire those who are unqualified, known as “daike” teachers (Chauanyou, 2006). In terms of technology and resource allocation to urban and rural schools, the situation is less than optimistic. Primary schools in urban areas are usually equipped with a larger number of computers, electronic books and multifunctional classrooms. Whereas, as a result of lack of financial attention, rural Chinese schools suffer from poorly maintained and outdated teaching equipment and a lack of space and resources (Hong et al., 2015). Each classroom in the urban primary school attached to Peking University has a multimedia device, whereas in the Wenhua School, students only have access to a computer room once a week, which is shared by the whole school. To receive the best possible outcomes for students, classrooms and schools require a sufficient allocation of resources. However, it is prevalent that for schools in rural communities, this is easier said than done (Gorey, 2007). This is due to the state primarily supporting urban children, and leaving rural children to the support of their families and local villages (Chauanyou, 2006).
Table 2: Indicators for Chinese urban and rural schools
China Urban (The Primary School Attached to Peking University), Beijing.
Rural (Wenhua school, Hedong District)
Teacher:Student Ratio
1:11 1:18 (Ministry of Education Development Planning and Statistics Division, 2006)
No. of computers for students
1 Multimedia device per classroom
1 Computer room for the whole school
Enrolment 2200 1129 (Hedong District, n.d.) Teacher Qualifications
Master-90
Master- 0 Bachelor- 6 Diploma/Certificate- 54
Attendance 99.7% 99.7% (Ministry of Education Development Planning and Statistics Division, 2006)
City/community population
11.51 million 35,750 (3 communities) (Baidu, 2016)
The Future of Education Equality
“The concern about differential performance of rural and urban students has been recognized as a global issue” (Tayyaba, 1987, p. 9).
Lessening the gap of inequality between urban and rural schools is of the utmost importance. Achieving equality of education, particularly at the primary school level is the most important criteria for achieving social equality (UNICEF, 2000). A good foundation of education in primary years is vital for children to receive the best opportunities for the future. Despite both countries outlining educational importance (Hong et al., 2015; Young, 1994), the inequality between geographical areas and education outcomes is still prevalent (Gorey, 2007). As a result, education in both rural and urban China and Australia requires improvement.

Education Inequality: A Comparison of Urban and Rural Primary Schools in China and Australia
36 Regional Outlook
The Future of Education in Australia
It is clear there is a need to drastically improve the quality of education in both rural and urban locations of Australia and China (Wilson, 2013). The vital step to take is to implement a long-term strategic goal for all rural and remote schools that integrates local culture with the national curriculum (Wilson, 2013). An effective strategic plan will address the indicators identified earlier as being crucial for success. As part of this long-term strategy the main priority to improve the quality of education in the future is to hire highly effective leaders and highly skilled teachers (Douglas, 2011; Wilson, 2013). The first step to creating a successful school is to hire an excellent principle with strong leadership skills (Douglas, 2011; Wilson, 2013). In a research paper by Douglas (2011) it was discovered when a new principle with strong leadership skills was introduced to Ntaria School, enrolments increased by 30% and attendance rates by 8.4% in 2009 (p. 36). In addition to strong leadership, hiring the right people to be teachers is fundamental to achieving positive student outcomes (Northern Territory Government of Australia (b), 2014). Teaching remote school requires specific attributes and requires commitment from highly skilled teachers (Northern Territory Government of Australia (b), 2014). Through the hiring of effective leaders and teachers, improvements are likely to be seen in the following indicators: teacher to student ratio, attendance rate and, qualifications and quality of teachers. In a comparison between rural and urban schools in Victoria it was discovered, teachers in urban schools do not use interactive teaching technologies as well as their rural educator counterparts do. In the future there needs to be a focus on teacher training for the use of interactive teaching technologies in urban schools (Loong & Groves, 2011). On a national scale, similar to developing a long-term strategic goal, the first recommendation made by Angus et al., (2007) in their research paper is “All Australian governments should endorse a comprehensive statement articulating the special purpose of primary schools” (p.106). This signifies the need for recognition of the importance of primary school education from the highest levels of government in each state and territory.
The Future of Education in China
The goal of implementing compulsory and equal education is yet to be seen within rural and remote areas of China (Lan Rong & Shi, 2001). As a result, it is clear that improvements need to be set in place for the prospering future of Chinese education. Due to the limited amount of resources in rural China, qualified teachers are not attracted to these areas (Chauanyou, 2006), which impacts on what is taught and the quality of education. With increased financial support, rural schools can attempt to attract qualified urban teachers by increasing pay and having a higher-quality teaching environment. In addition to increased financial investment, the Chinese government should offer incentives to all areas lacking in opportunity (Lan Rong & Shi, 2001). However, despite the growing gap in education, any type of reform has slipped down on the Chinese government’s priority list (Lang Rong & Shi, 2001). Not only will this gap impact millions of children, the vast inequality could affect the political environment, as well as the stability of the country. Therefore, it is necessary that the Chinese leadership take the problems in the educational systems seriously. As education is the cornerstone of social progress and a fundamental aspect of development (UNESCO, 2010), the system must be enhanced if a nation is to improve.
Conclusion
This paper set out to compare education inequality between Chinese and Australian urban and rural primary schools. Through discussing the education systems, the importance of indicators and analysing data from urban and rural schools, a thorough

Regional Outlook 37
comparison was made. The findings of the comparison show significant disparities between rural and urban schools, for both Australia and China. The findings suggest that urban schools are advantaged in majority of the indicators, with rural schools being disadvantaged. Overall, though there are significant differences between the Australian and Chinese educational landscape, the way forward is surprisingly similar. To achieve equality of education in rural and urban locations in both nations two ingredients are needed. The first is full support and recognition from the government is needed where a long-term strategic plan is developed. Secondly, incentives for high quality principals and teachers in schools are needed to attract them to rural locations. These two steps are the first to be taken on the path to an equitable future for education in rural and urban schools alike.
Bibliography
Angus, M., Olney, H., & Ainley, J. (2007). In the balance: The future of Australia’s primary schools. Australian Primary Principals Association. Retrieved from http://www.appa.asn.au/wp-content/uploads/2015/08/In-the-balance.pdf
Australian Bureau of Statistics. ABS. (a). (2013). Australian Social Trends, 2003, (Catalogue no. 4102.0). Retrieved from: http://www.abs.gov.au/ausstats/[email protected]/7d12b0f6763c78caca257061001cc588/459c3882fad473a2ca2570eb0083be84!OpenDocument
Australian Government. (2015). Remote School Attendance Strategy: Interim Progress Report. Retrieved from: https://www.dpmc.gov.au/sites/default/files/publications/remote-school-attendance-strategy-interim-progress-report.pdf
Baidu. (2016). Sanhe Street. Retrieved from: http://baike.baidu.com/link?url=pkZfXsZTWna22sppFzf97E3tDsazAC96RsLq1PpfO1-w5J5ABlLtPbM2OPvQvnFRdstp8TQpF5HWvlzbREJQ3oRf1qfzTf08H_kjmVcachztDYtz56bS4ttiNYegh9IB
Brisbane Catholic Education. (2015). Annual School Reporting- 2015: Catholic Education, Archdiocese of Brisbane, Retrieved from: http://www.marymountprimary.qld.edu.au/Parents/Documents/School%20Reporting%202016.pdf
Chauanyou, B. (2006). Policies for compulsory education disparity between urban and rural areas in China. Frontiers of Education in China. 1(1), 40-55. doi: 10.1007/s11516-005-0003-y.
Commonwealth Department of Education, Science and Training. (2002). Striving for quality: Learning, teaching and scholarship (DEST no. 6891.HERC02A). Canberra, Australia: Author.
Crowe, M., Clay, O.J., Martin, R.C., Howard, V.J, Wadley, V.G., Sawyer, P., & Allman, R.M. (2013). Indicators of Childhood Quality of Education in Relation to Cognitive Function in Older Adulthood. The Journal of Gerontology, 68(2), 198-204. doi:10.1093/gerona/gls1.
Douglas, J. (2011). Learning from country: the value of country visits in remote schools for community engagement and natural and cultural resource management. Retrieved from: http://www.nintione.com.au/resource/NintiOneResearchReport_69_Thevalueofcountryvisitsinremoteschools.pdf
Forlin, C. & Lock, G. (2006). Employing technologies to engage students with diverse needs in rural school communities. Australian Journal of Teacher Education. 31(1), 31-43. doi: 10.14221/ajte.2006v31n1.4.
Education Inequality: A Comparison of Urban and Rural Primary Schools in China and Australia
38 Regional Outlook
Hedong District (n.d.). Haojiang District, Shantou City, Mandarin School. Retrieved from http://st.souxuexiao.com/xueli-1552098/
Hillman, K. (2005). The first year experience: The transition from secondary school to university and TAFE in Australia. Retrieved from: http://www.acer.edu.au/documents/LSAY_lsay40.pdf
Hong, X., Liu, P., Ma, Q., & Luo, X. (2015). The way to early childhood education equity - policies to tackle the urban-rural disparities in China. International Journal of Child Care and Education Policy, 9(1), 1-23. doi:10.1186/s40723-015-0008-9.
Lan Rong, X. & Shi, T. (2001). Inequality in Chinese Education. Journal of Contemporary China. 10(26), 107-124. doi:10.1080/10670560124330.
Loong, E., Doig, B. & Groves, S. (2011). How different is it really? – rural and urban primary students’ use of ICT in mathematics. Mathematics Education Research Journal, 23(2), 189-211. doi:10.1007/s13394-011-0011-6.
Ministry of Education Development Planning and Statistics Division. (2006). National Statistics Development Report on Education Development. (15), 18-25. Retrieved from: http://english.moe.gov.tw/ct.asp?xItem=14518&ctNode=11432&mp=1
Ministry of Education. (2015). 2014 National Education Development Statistics Bulletin. China Geological Education. 24 (4). Retrieved from: http://english.moe.gov.tw/ct.asp?xItem=14530&ctNode=11432&mp=1
National Research Council. (2012). Key National Education Indicators: Workshop Summary. Washington, DC: The National Academies Press. doi:10.17226/13453
Northern Territory Government of Australia (a). Teaching Jobs: Remote Teachers (2014). Retrieved from http://www.teaching.nt.gov.au/remote/
Northern Territory Government of Australia (b). (2014). Teaching Jobs: Teaching in the Territory. Retrieved from http://www.teaching.nt.gov.au/
Shahar, T.H.B. (2016). Equality in Education - Why we must go all the way. Ethic Theory Moral Practice, 19(1), 83-100. doi:10.1007/s10677-015-9587-3
Tayyaba, S. (1987). Rural‐urban gaps in academic achievement, schooling conditions, student, and teachers' characteristics in Pakistan. International Journal of Educational Management, 26(1), 6-26. doi:http://dx.doi.org/10.1108/09513541211194356.
The Primary School attached to Peking University (n.d). Retrieved from: http://bdfx.xnw.com/qun/channel.php?act=qun_weibo_detail&wid=2295990&qid=1000532&channel_id=1012416
UNESCO. (2010). Outline of China’s National Plan for Medium and Long-term Education Reform and Development (2010-2020). Retrieved from: http://www.unesco.org/education/edurights/media/docs/488a1a76a59a99af62619f856ab0de3d92907093.pdf
UNICEF. (2000). Defining Quality in Education. Retrieved from: http://www.unicef.org/education/files/QualityEducation.PDF
United Nations. (2015). Transforming Our World: The 2030 Agenda for Sustainable Development. Retrieved from: https://sustainabledevelopment.un.org/content/documents/21252030%20Agenda%20for%20Sustainable%20Development%20web.pdf
Wilson, B. (2013). A Share in the Future: Review of Indigenous Education in the Northern Territory. The Education Business. 1-304 Retrieved from: https://www.nt.gov.au/__data/assets/pdf_file/0020/229016/A-Share-in-the-Future-The-Review-of-Indigenous-Education-in-the-Northern-Territory.pdf
Yeung, A.S., Craven, R.G., & Ali, J. (2013). School Psychology International, 34(4) 405-427. doi:10.1177/0143034312446890.
Young, D. (1994). A comparison of student performance in Western Australian schools: rural and urban differences. Australian Educational Researcher. 21(2), 87-105. Retrieved from: http://search.informit.com.au.libraryproxy.griffith.edu.au/documentSummary;dn=950403179;res=IELAPA

Regional Outlook 39
Young, D.J., Fraser, B.J. & Woolnough, B.E. (1997). Factors affecting student career choice in science: an Australian study of rural and urban schools. Research in Science Education. 27(2), 195-214. doi:10.1007/BF02461316.


