59
A Benefits Analysis of the Existing Plants Emissions and Capture (EPEC) Program June 28, 2011 DOE/NETL-2012/1570 OFFICE OF FOSSIL ENERGY

A Benefits Analysis of the Existing
Plants Emissions and Capture (EPEC)
Program
June 28, 2011
DOE/NETL-2012/1570
OFFICE OF FOSSIL ENERGY

EPEC Program Benefits Analysis
Disclaimer
This report was prepared as an account of work sponsored by an agency of the United States Government. Neither the United States Government nor any agency thereof, nor any of their employees, makes any warranty, express or implied, or assumes any legal liability or responsibility for the accuracy, completeness, or usefulness of any information, apparatus, product, or process disclosed, or represents that its use would not infringe privately owned rights. Reference therein to any specific commercial product, process, or service by trade name, trademark, manufacturer, or otherwise does not necessarily constitute or imply its endorsement, recommendation, or favoring by the United States Government or any agency thereof. The views and opinions of authors expressed therein do not necessarily state or reflect those of the United States Government or any agency thereof.

EPEC Program Benefits Analysis
A Benefits Analysis of the Existing Plants Emissions
and Capture (EPEC) Program
DOE/NETL – 2012/1570
NETL Contact:
Charles Zelek
Division Director
Office of Program Planning and Analysis – Benefits Division
Jose Benitez
General Engineer
Office of Program Planning and Analysis – Benefits Division
National Energy Technology Laboratory
www.netl.doe.gov

EPEC Program Benefits Analysis
Prepared by:
Energy Sector Planning and Analysis (ESPA)
Bill Babiuch
MRIGlobal
Lessly Goudarzi
OnLocation, Inc.
Kara Callahan
OnLocation, Inc.
Randall Jackson
West Virginia University
Sergio Rey
Arizona State University
DOE Contract Number DE-FE0004001

EPEC Program Benefits Analysis
Acknowledgments
This report was prepared by Energy Sector Planning and Analysis (ESPA) for the United States Department of Energy (DOE), National Energy Technology Laboratory (NETL). This work was completed under DOE NETL Contract Number DE-FE0004001. This work was performed under ESPA Task 342.01.
The authors wish to acknowledge the excellent guidance, contributions, and cooperation of the NETL staff, particularly:
• Charles Zelek • Michael Matuszewski • John Wimer • Lisa Nichols
ESPA also wishes to acknowledge the valuable input provided by Dale Keairns and colleagues of Booz Allen Hamilton, Inc.Booz Allen Hamilton, Inc.Booz Allen Hamilton, Inc., but notes that this acknowledgement does not necessarily indicate their endorsement of the results.

EPEC Program Benefits Analysis
This page intentionally left blank.

EPEC Program Benefits Analysis
i
Table of Contents
Executive Summary .........................................................................................................................1
1 Introduction ...................................................................................................................................4
2 Methodology .................................................................................................................................5
3 Findings.........................................................................................................................................7
3.1 Energy Expenditures ..........................................................................................................7
3.2 Employment Impacts .........................................................................................................8
3.3 Carbon Dioxide Emissions ..............................................................................................10
3.4 Low Carbon Generation Capacity....................................................................................11
3.5 Carbon Transport and Storage .........................................................................................14
4 Conclusion ..................................................................................................................................20
Appendix A – Carbon Capture, Transport and Storage Network Model ......................................21
Appendix B – NEMS-CCUS Model Assumptions ........................................................................29
Appendix C– Econometric Input-Output Model ...........................................................................40
References ......................................................................................................................................46

EPEC Program Benefits Analysis
ii
List of Exhibits
Exhibit ES-1 Annual Savings in Energy Expenditures from Achieving NETL R&D Goal .......... 1 Exhibit ES-2 Power Sector Annual CO2 Emissions with CO2 Tax Policy ..................................... 3 Exhibit ES-3 CCUS Electricity Capacity ....................................................................................... 3 Exhibit 2-1 Carbon Capture, Transport, and Storage Network Modeling Framework .................. 5 Exhibit 2-2 Coal and Natural Gas Prices to Power Sector .............................................................. 6 Exhibit 3-1 Annual Savings in Energy Expenditures from Achieving NETL R&D Goal ............. 7 Exhibit 3-2 Power Sector Annual CO2 Emissions ........................................................................ 10 Exhibit 3-3 CO2 Tax vs. CES Credit Price ................................................................................... 11 Exhibit 3-4 CO2 Tax Case............................................................................................................. 12 Exhibit 3-5 Clean Energy Standard Case...................................................................................... 13 Exhibit 3-6 Capacity Lost Due to Retirements and CCUS Deratings by 2035 ............................ 14 Exhibit 3-7 CO2 Tax with NETL R&D Goal: Cumulative Injection by Site ............................... 16 Exhibit 3-8 2025 Carbon Transportation and Storage GIS ........................................................... 17 Exhibit 3-9 2030 Carbon Transportation and Storage GIS ........................................................... 18 Exhibit 3-10 2035 Carbon Transportation and Storage GIS ......................................................... 19 Exhibit A-1 Pipeline Cost per Mile .............................................................................................. 24 Exhibit A-2 Law & Bachu CO2 Injectivity Model Overview ....................................................... 25 Exhibit A-3 CO2 Injectivity as a Function of CO2 Mobility ......................................................... 26 Exhibit B-1 Program Time Horizon Improvements for Capital Cost ........................................... 31 Exhibit B-2 Program Time Horizon Improvements for Fixed O&M Costs ................................. 31 Exhibit B-3 Program Time Horizon Improvements for Variable O&M Costs ............................ 32 Exhibit B-4 Program Time Horizon Improvements for Heat Rate ............................................... 32 Exhibit B-5 Annual Heat Rate Improvement................................................................................ 33 Exhibit B-6 Capital Cost Improvement ........................................................................................ 35 Exhibit B-7 TS&M Cost ............................................................................................................... 36 Exhibit B-8 Learning Curves ........................................................................................................ 37 Exhibit B-9 Program Goal Vectors Used in NEMS-CCUS Model .............................................. 38 Exhibit B-10 Cost Savings Vectors: NEMS-CCUS Model vs. Standalone NETL R&D Goal .... 39 Exhibit C-1 Conway Type Solution Flow Chart for ECIO .......................................................... 41

EPEC Program Benefits Analysis
iii
List of Tables
Table ES-1 Cumulative Direct, Indirect and Induced Employment Impact in CES Case .............. 2
Table 3-1 Cumulative Direct, Indirect and Induced Employment Impact in CES Case ................ 8
Table 3-2 Cumulative Direct, Indirect, and Induced Impact on Compensation in CES Case ........ 9
Table 3-3 New Low-Carbon Generation Capacity in CO2 Tax Case ........................................... 12
Table 3-4 New Low-Carbon Generation Capacity in CES Case .................................................. 13
Table 3-5 Capture – Transport – Storage Data ............................................................................. 15
Table 3-6 Carbon Dioxide Transport Pipeline Data ..................................................................... 15
Table A-1 University of California Davis Study: Year 2000 USD to Year 2007 USD ............... 23
Table B-1 Improvements of 600 MW Power Plant with 10,000 Btu/kWh Heat Rate.................. 30
Table C-1 Annual Capital Expenditure in Billions of Dollars: 2010-2035 .................................. 42
Table C-2 Annual Value of Service Provided in Billions of Dollars: 2010-2035 ........................ 43
Table C-3 Industry Sectors ........................................................................................................... 44
Table C-4 Most Substantial Direct Impacts .................................................................................. 45

EPEC Program Benefits Analysis
iv
This page intentionally left blank.

EPEC Program Benefits Analysis
v
Acronyms and Abbreviations
ARI Advanced Resources International
CCPI Clean Coal Power Initiative
CCS Carbon capture and storage
CCUS Carbon capture, utilization and storage
CES Clean Energy Standard
CO2 Carbon dioxide
COE Cost of electricity
CTS Capture, transport, and storage
ECAR Eastern Central Area of Responsibility
EIA Energy Information Administration
EMM Electricity market module
EPEC Existing Plants, Emissions, and Capture
ERCOT Electric Reliability Council of Texas
GW Gigawatt
GWh Gigawatthour
IGCC Integrated gasification combined cycle
KGL Kerry-Graham-Lieberman
KWh Kilowatthour
MIT Massachusetts Institute of Technology
MMT Million metric tons
MW Megawatt
NEMS National Energy Modeling System
NETL National Energy Technology Laboratory
NGCC Natural gas combined cycle
PC Pulverized coal
R&D Research and development
RD&D Research, development, and demonstration
SERC Southeastern Electricity Regulatory Commission
TS&M Transport, storage, and monitoring

EPEC Program Benefits Analysis
vi
This page intentionally left blank.
EPEC Program Benefits Analysis
1
Executive Summary
The overall goal of NETL’s Existing Plants, Emissions, and Capture (EPEC) program is to develop carbon capture, utilization and storage (CCUS) technologies that limit the increase in the cost of electricity generation to 35 percent of that generated by an equivalent greenfield plant without CCUS (hereafter referred to as the “NETL R&D Goal” in this report). If this goal is achieved and a climate change policy is enacted, this study estimates that the EPEC program could significantly benefit the nation’s economy, environmental quality, and energy security.
Economic Benefits
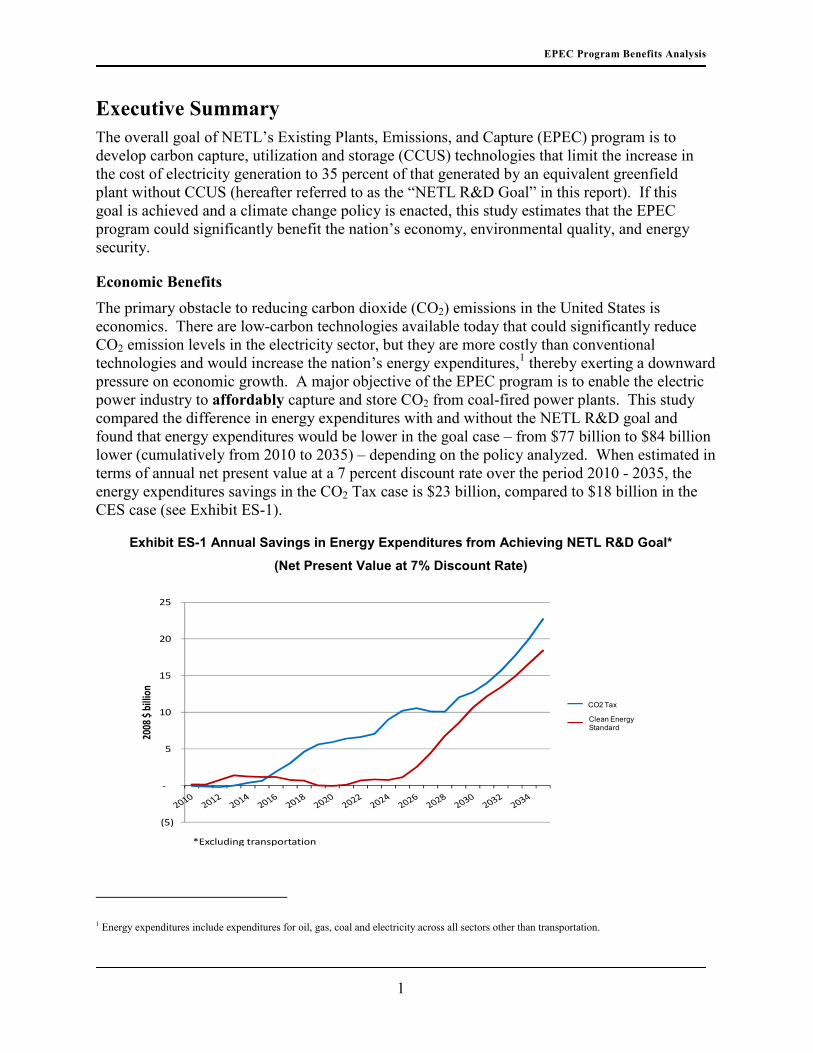
The primary obstacle to reducing carbon dioxide (CO2) emissions in the United States is economics. There are low-carbon technologies available today that could significantly reduce CO2 emission levels in the electricity sector, but they are more costly than conventional technologies and would increase the nation’s energy expenditures,1 thereby exerting a downward pressure on economic growth. A major objective of the EPEC program is to enable the electric power industry to affordably capture and store CO2 from coal-fired power plants. This study compared the difference in energy expenditures with and without the NETL R&D goal and found that energy expenditures would be lower in the goal case – from $77 billion to $84 billion lower (cumulatively from 2010 to 2035) – depending on the policy analyzed. When estimated in terms of annual net present value at a 7 percent discount rate over the period 2010 - 2035, the energy expenditures savings in the CO2 Tax case is $23 billion, compared to $18 billion in the CES case (see Exhibit ES-1).
Exhibit ES-1 Annual Savings in Energy Expenditures from Achieving NETL R&D Goal*
(Net Present Value at 7% Discount Rate)
1 Energy expenditures include expenditures for oil, gas, coal and electricity across all sectors other than transportation.
(5)
-
5
10
15
20
25
2008
$ b
illio
n
CTX
CES
*Excluding transportation
CO2 Tax
Clean Energy Standard

EPEC Program Benefits Analysis
2
In addition to mitigating the economic burden of reducing energy-related CO2 emissions in the United States, achieving EPEC’s program goal would also have a positive impact on employment, with the cumulative impact being approximately 800,000 jobs added to the economy (see Table ES-1). Most of these jobs would be linked to the construction cycles related to retrofitting/building CCUS power plants and pipelines, so the bulk of these jobs will occur in the post-2025 years when the majority of the CCUS-related construction takes place.
Table ES-1 Cumulative Direct, Indirect and Induced Employment Impact in CES Case,
Gross, 2012-2035
Description Goal/CES Case
No Goal/CES Case
Difference
Construction Phase
New & Retrofit 832,373 536,545 295,828
Pipeline 109,035 79,646 29,389
Total 941,408 616,191 325,217
O&M 904,412 621,901 282,511
Total Direct 1,845,820 1,238,092 607,728
Indirect & Induced 183,947
Total 791,675
Environmental Benefits
The electric power sector emits more than 2,000 million metric tons (MMT) of CO2 annually, with electricity generated from coal accounting for approximately 80 percent of these emissions. The EPEC program is developing and demonstrating CCUS technologies to affordably and efficiently capture CO2 for subsequent utilization or storage that would otherwise be emitted from coal-fired power plants. This study estimates that CO2 emissions from coal-fired power plants will decline from 1,823 MMT in 2010 to 276 MMT in 2035 if the NETL R&D goal is met and a CO2 Tax is enacted (Goal/CO2 Tax case). In the case without the NETL R&D goal, coal-fired power plants continue to emit about 1,000 MMT of CO2 in 2035 even with a CO2 Tax policy in place (No Goal/CO2 Tax case) (see Exhibit ES-2). In other words, even though 85 percent of today’s coal capacity would be in place in 2035 in the Goal/CO2 Tax case, due in large-part to the retrofitting of existing plants with CCUS technologies, CO2 emissions from these plants would be 85 percent less than the CO2 emissions generated by the fleet of coal-fired power plants today.

EPEC Program Benefits Analysis
3
Exhibit ES-2 Power Sector Annual CO2 Emissions with CO2 Tax Policy
Energy Security Benefits
The United States has abundant coal resources and coal-fired power plants produce about half of the nation’s electricity and account for 313 gigawatts (GW) of the power sector’s 1,018 GW of total electricity capacity. This study forecasts that achieving the NETL R&D goal will enable coal-fired power plants to continue to be a key part of the nation’s electricity sector, even if a climate change policy is enacted to reduce greenhouse gas emissions. The model estimates that, depending on the policy, between 120 and 188 GW of net (derated) retrofitted coal-fired CCUS capacity will be available by 2035 if the goal is met, compared to 30 to 79 GW if the goal is not realized (see Exhibit ES-3). The amount of existing capacity retrofitted with CCUS technologies is dependent upon the cost reductions achieved by the EPEC program’s activities, as well as the design of the climate change policy.
Exhibit ES-3 CCUS Electricity Capacity
0
50
100
150
200
250
2025 2030 2035 2025 2030 2035
De
rate
d C
ap
aci
ty (
Gig
aw
att
s)
CO2 Tax Case
Natural Gas CCUS
Retrofit CCUS
New Coal CCUS
CO2 Tax w/out
NETL R&D Goal
CO2 Tax w/
NETL R&D Goal
0
50
100
150
200
250
2025 2030 2035 2025 2030 2035
De
rate
d C
ap
aci
ty (
Gig
aw
att
s)
Clean Energy Standard Case
Natural Gas CCUS
Retrofit CCUS
New Coal CCUS
CES w/out
NETL R&D Goal CES w/
NETL R&D Goal
0
500
1000
1500
2000
2500
Mil
lio
n M
etr
ic T
on
s o
f
CO
2 E
qu
iva
len
t
Without NETL R&D Goal and With CO2 Tax
Petroleum Natural Gas Coal Total
0
500
1000
1500
2000
2500
Mil
lio
n M
etr
ic T
on
s o
f
CO
2 E
qu
iva
len
t
With NETL R&D Goal and With CO2 Tax
Petroleum Natural Gas Coal Total
EPEC Program Benefits Analysis
4
1 Introduction
The National Energy Technology Laboratory’s (NETL) Existing Plants, Emissions, and Capture (EPEC) program is investing in a research, development, and demonstration (RD&D) portfolio to develop carbon capture, utilization and storage (CCUS) technologies that will enable power plant owners to affordably and efficiently store carbon dioxide (CO2). By cost-effectively capturing CO2 before it is emitted into the atmosphere and permanently storing it in geological formations, coal can continue to be a primary fuel source for electricity generation in the United States without restricting economic growth.
CCUS refers to four primary steps: (1) CO2 capture, (2) transport, (3) utilization, and (4) storage. The CO2 capture technologies that can be applied to coal-based power plants are pre-combustion, post-combustion, and oxy-combustion. Pre-combustion capture is applicable to integrated gasification combined cycle (IGCC) power plants, while post- and oxy-combustion capture could be applied to conventional pulverized coal-fired power plants. After the CO2 is captured at the power plant, it is compressed and transported to either a permanent storage site, such as depleted oil or gas field, saline formation, or unmineable coal seam, or it may be utilized to enhance the recovery of oil from an existing well before the CO2 is permanently stored underground.1
NETL estimates that using today’s commercially available CCUS technologies would add around 80 percent to the cost of electricity for a new pulverized coal (PC) plant, and around 35 percent to the cost of electricity for a new advanced gasification-based plant. NETL’s efforts are supporting activities to reduce these costs to a less than 35 percent increase in the cost of electricity for new PC power plants (hereafter referred to as the “NETL R&D Goal”).
This report estimates the potential impacts of the EPEC program achieving its 35 percent cost goal. It does so by using a Carbon Capture, Transport, and Storage (CTS) Network Model that interacts with an integrated NEMS-CCUS model that is based on the AEO2010 Version2 of the Energy Information Administration’s (EIA) National Energy Modeling System (NEMS). Three cases were run to analyze the deployment of coal-fired power plants with CCUS: (1) Reference case, (2) CO2 Tax case, and (3) Clean Energy Standard (CES) case. The CO2 Tax case and CES case were included in this study because coal-fired power plant owners are unlikely to install CCUS technologies unless some type of carbon management policy is in effect that enables the owners to recoup the added cost of the CCUS technologies. Each case was run with and without the NETL R&D goal to estimate the impacts of the EPEC program, for a total of six model simulations.
• No Goal/Reference
• Goal/Reference
1 CO2 transported from a power plant to an oil well for enhance oil recovery (i.e., utilization) was not modeled in this study.
2 This refers to the version of NEMS used to produce the Annual Energy Outlook 2010 forecast published by EIA.
• No Goal/CO2 Tax
• Goal/CO2 Tax
• No Goal/CES
• Goal/CES.
EPEC Program Benefits Analysis
5
2 Methodology
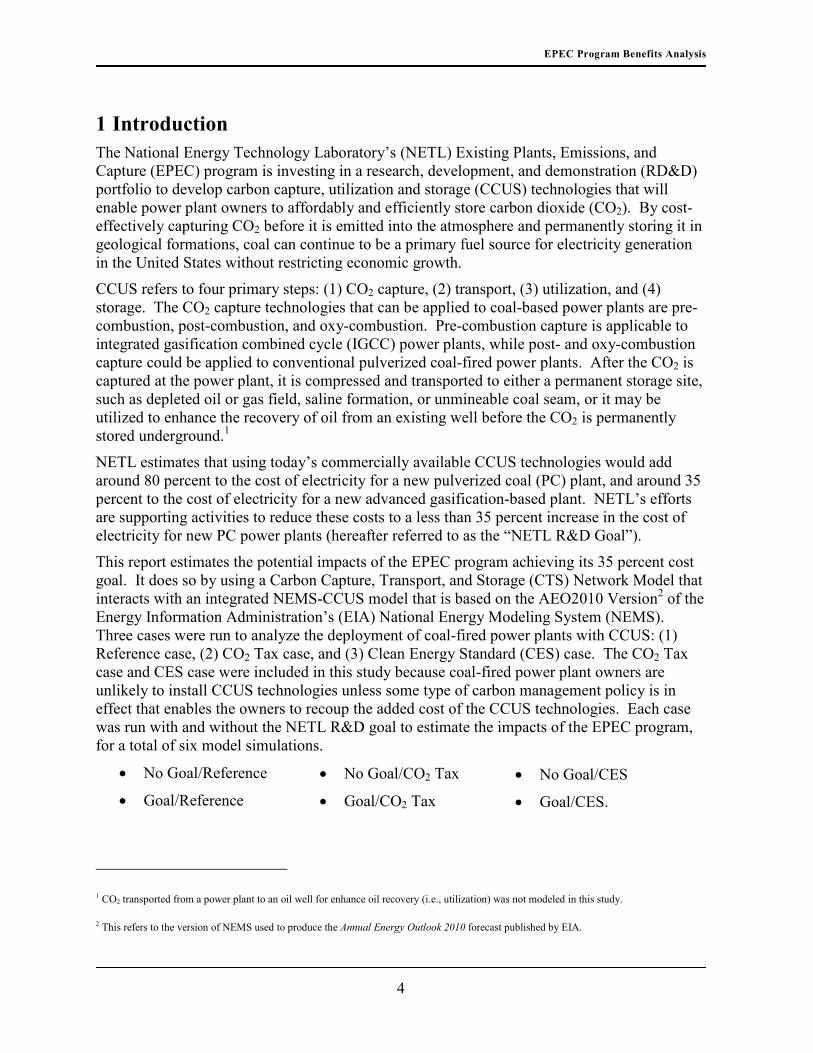
NEMS is an energy system simulation model developed by EIA for use in Annual Energy Outlook projections, as well as requests for analysis from Congress and federal agencies. The model performs annual simulations to forecast the composition of the U.S. energy economy through 2035. NETL developed the CTS Network Model for this study to estimate the CO2 transport and storage costs using site-specific data. This model interacts with the NEMS-CCUS Electricity Market Module (EMM) by providing CCUS costs for capacity planning and tracks the CO2 captured by CCUS plant generation (see the model framework diagram below and Appendices A and B for more details on the CTS Network Model and NEMS-CCUS).
Exhibit 2-1 Carbon Capture, Transport, and Storage Network Modeling Framework
The NETL R&D goal of developing CCUS technologies that limit the increase in the cost of electricity generation (COE) to 35 percent of that generated by a PC plant without CCUS was incorporated into NEMS-CCUS as percentage reductions in the following components:
• Capture capital costs = 50 percent • Fixed O&M costs = 20 percent • Variable O&M costs = 80 percent • Energy (heat rate) penalty = 50 percent • Transport, storage and monitoring cost = 20 percent.
The Reference case for this study is based on the AEO2010 Reference case and the model is run with and without the NETL R&D goal to estimate the impact of the EPEC program activities on the deployment of coal-fired power plants with CCUS in the electricity sector.
The CO2 Tax case is based on the CO2 price used in the EIA Kerry-Graham-Lieberman (KGL) basic cap-and-trade case published in July 2010, and the model is run with and without the NETL R&D goal. The tax starts at $23 per tonne of CO2 in 2013 and reaches $66 per tonne by 2035, growing at five percent annually to reflect the assumed discount rate for banking in the

EPEC Program Benefits Analysis
6
KGL case published by EIA. The NEMS-CCUS model factors the CO2 tax into the delivered price of each fossil fuel based on its carbon content. Coal prices are impacted more than natural gas prices because it has a larger carbon content; i.e., coal-fired electricity generation averages 2.095 pounds of CO2 per kilowatthour (kWh) compared to natural gas-fired electricity generation which averages 1.321 pounds of CO2 per kWh (EIA, 2000). Coal prices increase about 300 percent by 2035 compared to the Reference case and natural gas prices increase by 32 percent (see Exhibit 2-2). CCUS plants pay only 10 percent of the CO2 tax imposed on the fuel price because it is assumed that CCUS plants capture 90 percent of the CO2 that would otherwise be emitted into the atmosphere by the power plant.
Exhibit 2-2 Coal and Natural Gas Prices to Power Sector
The CES case for this study was based on the Obama administration’s goal of 80 percent “clean” generation by the year 2035. The standard is defined as credits issued (expressed in kWh) as a percent of electricity sales and reaches 80 percent by 2035. In this respect it is similar to placing a cap on emissions. Clean sources are defined as coal or natural gas plants with CCUS, nuclear, renewables, and natural gas combined cycle plants (NGCC). CES credits are issued to each generator based on the technology’s average CO2 emissions reduction relative to a conventional coal plant. Thus coal and natural gas CCUS plants get 0.9 credits per kWh generated, nuclear and renewables get 1.0 credits, and NGCC plants receive 0.5 credits per kWh. Credits are traded between generators and a marginal clearing price (credit price) is determined within the NEMS-CCUS model. In the end, credit purchases and sales are reflected in electricity prices.
0.0
2.0
4.0
6.0
8.0
10.0
12.0
14.0
2010 2015 2020 2025 2030 2035
20
08
$ p
er
tho
usa
nd
cu
bic
fe
et
Delivered Natural Gas Price
to Power Sector
Reference
CTX_NoGoal
CTX_Goal
0.0
30.0
60.0
90.0
120.0
150.0
180.0
2010 2015 2020 2025 2030 2035
20
08
$ p
er s
ho
rt t
on
Delivered Coal Price
to Power Sector
CO2 Tax w/out
NETL R&D Goal
CO2 Tax w/ NETL
R&D Goal
Reference
Delivered Coal Price
to Power Sector
Delivered Natural Gas Price
to Power Sector

EPEC Program Benefits Analysis
7
3 Findings
3.1 Energy Expenditures
Under any carbon policy, energy prices are likely to be higher than a business-as-usual case that treats emissions as an externality because there is an added cost in keeping the CO2 from being emitted into the atmosphere. In this study, energy expenditures1 are compared with and without the NETL R&D goal for each policy. The total energy savings over the 2010 – 2035 period are larger under the CO2Tax policy than the CES policy. In the case of the CO2 Tax, the cumulative difference between the energy expenditures of the No Goal/CO2 Tax case and Goal/CO2 Tax case is $84 billion over the 25 year period, compared to $77 billion in the CES case. When estimated in terms of annual net present value at a 7 percent discount rate over the period 2010 - 2035, the energy expenditures savings in the CO2 Tax case is $23 billion, compared to $18 billion in the CES case (see Exhibit 3-1). The larger net present value savings in the CO2 Tax case is driven by the higher cost per tonne of carbon in many years (and in particular the early years) that increases the economic advantage of carbon capture, which is then accelerated by the assumed achievement of the NETL R&D goal. While the NETL R&D goal is the same in the two policy cases, the relatively lower equivalent cost per tonne of carbon in the CES case undermines the economic pressure to capture and store CO2, thereby yielding lower savings than the CO2 Tax case.
Exhibit 3-1 Annual Savings in Energy Expenditures from Achieving NETL R&D Goal*
(Net Present Value at 7% Discount Rate)
1 Energy expenditures include expenditures for oil, gas, coal and electricity across all sectors other than transportation.
(5)
-
5
10
15
20
25
2008
$ b
illio
n
Savings in Energy Expenditures (Goals v. No Goals)*
CTX
CES
*Excluding transportation
CO2 Tax
Clean Energy Standard

EPEC Program Benefits Analysis
8
3.2 Employment Impacts
Climate change policy is also likely to impact employment levels in carbon-intensive portions of the U.S. economy, such as the coal-fired power plant industry. This study estimated the employment impacts of achieving the NETL R&D goal under the CES policy using an econometric input-output model developed by West Virginia University and NETL.1 The cumulative employment impacts are 791,675 jobs from 2012 to 2035 (i.e., the jobs total is the delta between the No Goal/CES case and the Goal/CES case for that period). A number of jobs are created throughout the 2012-2016 period, but their number is small and can be attributed virtually entirely to the direct case differences.
During the construction phase, jobs are created to build new power plants and pipelines. However, these jobs are not permanent because they exist only until the construction phase is completed. It is important to note though, that new jobs replace ones that end as a result of the construction cycles, since new plant construction, retrofitting, and pipeline construction continues throughout the employment impact analysis period (i.e., 2012 to 2035).
Employment in the new CCUS industry begins once the new or retrofitted plants begin operation. As more plants come online, the O&M employment increases correspondingly throughout the period. During the impacts horizon, a net impact of 607,728 direct jobs can be attributed to construction and operations (see Table 3-1). A decline of 141,804 jobs in the traditional power generation sector partly offset these direct impacts.2 If these are treated as direct substitutions, the direct jobs created revert to an estimated 465,924.
Table 3-1 Cumulative Direct, Indirect and Induced Employment Impact in CES Case,
Gross, 2012-2035
Description Goal/CES Case
No Goal/CES Case
Difference
Construction Phase
New & Retrofit 832,373 536,545 295,828
Pipeline 109,035 79,646 29,389
Total 941,408 616,191 325,217
O&M 904,412 621,901 282,511
Total Direct 1,845,820 1,238,092 607,728
Indirect & Induced 183,947
Total 791,675
1 See Appendix C for an overview of the econometric input-output model.
2 The decline of 141,804 jobs occurs because as the new plants come on-line they supply increasingly larger proportions of the total electricity demand. For “no decline” in jobs to result, total demand would have to rise at least enough to offset the new electricity supply (i.e, generation from new facilities). In other words, there is a shift from old to new production methods, meaning that new gains are in part old declines.

EPEC Program Benefits Analysis
9
Indirect and induced jobs result from the increase in production needed to satisfy demand due to the intermediate demand of the directly affected industries, from suppliers through the supply chain, and from demand generated by incomes earned in all affected industries. The cumulative indirect and induced employment impacts of achieving the NETL R&D goal over the entire horizon is183,947 jobs, resulting in a cumulative total of almost 800,000 jobs from 2012 to 2035 (see Table 3-1).
The temporal distribution of job impacts is not uniform. The annual employment impact during 2012-2016 is virtually zero since there is no difference between the No Goal/CES case and the Goal/CES case during those years. As the investment that occurs in the Goal/CES case begins to diverge from the No Goal/CES case, more and more jobs are created. Over the twenty years of positive impacts, the average annual jobs impact is just over 39,500. The maximum impact of 86,500 occurs in 2028.
The total compensation impact mirrors the patterns in the total average employment impact since labor income is a direct function of employment.1 From 2012 to 2035, the annual compensation impact exhibits the same overall increasing trend as employment. During the analysis period, as with employment, compensation impacts experience two peaks and two troughs and reach their highest level of $5.3 billion in 2028. The average annual compensation impact from 2016 through 2035 is $2.6 billion.
In Table 3-2, the direct compensation impact is $43.0 billion. The indirect and induced impacts total $8.1 billion. A direct income loss of $13.8 billion is linked to the 141,804 jobs lost in the traditional power generation sector, resulting in an adjusted direct impact on compensation of $29.2 billion.
Table 3-2 Cumulative Direct, Indirect, and Induced Impact on Compensation in CES Case,
Million Dollars, 2012 – 2035
Description Goal/CES Case
No Goal/CES Case
Difference
Construction Phase
New & Retrofit 39,954 25,754 14,200
Pipeline 5,234 3,823 1,412
Total 45,188 29,577 15,611
O&M 87,728 60,324 27,404
Total Direct 132,916 89,901 43,015
Indirect & Induced 8,108
Total 51,123
1 Compensation refers to direct payments to labor.

EPEC Program Benefits Analysis
10
3.3 Carbon Dioxide Emissions
Annual CO2 emissions from the power sector were similar in all cases except the Goal/CO2 Tax case , which further reduces emissions about 50 percent due to the large number of CCUS retrofits after 2025 (see Exhibit 3-2). In fact, CO2 emissions in the power sector fall well below the KGL target after 2025 in the Goal/CO2 Tax case due to the large-scale retrofitting of existing coal-fired power plants with CCUS technology. Under the CO2 Tax policy, the annual emissions per GWh of coal generation declines by over 55% in 2035 when comparing the Goal/CO2 Tax case with the No Goal/CO2 Tax case. In contrast, CO2 emissions in the CES case is essentially “capped” so retrofits replace other low-carbon electricity generation options instead of further reducing emissions. However, the annual emissions per GWh of coal generation in 2035 under the CES policy still declines about 10% when comparing the Goal/CES case with the No Goal/CES case.
Exhibit 3-2 Power Sector Annual CO2 Emissions
This study converted the CES credit prices to dollars per tonne of CO2 to compare them directly with the tax schedule used in the CO2 Tax case to better understand the economic impacts of the two policies. The CO2 tax starts out higher than both the No Goal/CES case and Goal/CES case, but then dips below it in 2019 (see Exhibit 3-3). It rises above the Goal/CES case around 2025 and surpasses the No Goal/CES case after 2031. By 2035, the CO2 tax is about 13 percent higher than the CES price for the No Goal/CES case and more than double the price of the Goal/CES case. In other words, while a CO2 tax policy results in a larger reduction of CO2 emissions in the electric power sector than a CES policy, the cost to reduce each metric tonne of CO2 is higher – increasing from about $40 per tonne in 2025 to $65 per tonne in 2035 in the CO2 Tax case – while staying at about $30 per tonne in the Goal/CES case in that period. This is primarily a result of lower cost retrofit CCUS technology being available to meet the clean energy standard after 2020 due to the NETL R&D goal being met.
CES
0
500
1,000
1,500
2,000
2,500
3,000
2010 2015 2020 2025 2030 2035
Po
we
r S
ect
or
Em
issi
on
s (m
mtC
O2
pe
r y
ea
r)
Annual Emissions
CO2 Tax Cases
0
500
1,000
1,500
2,000
2,500
3,000
2010 2015 2020 2025 2030 2035
Annual Emissions
CES Cases
Reference
NoGoal
Goal
KGL_CO2
Reference
No R&D Goal
R&D Goal
KGL CO2
Annual Emissions
CES CaseAnnual Emissions
CO2 Tax Case

EPEC Program Benefits Analysis
11
3.4 Low Carbon Generation Capacity
The results of the model runs with and without the NETL R&D goal for the AEO2010 Reference case are identical because these cases lack an economic driver to add CCUS technology to a power plant given there is no climate change policy in effect in this case. However, two gigawatts (GW) of new coal with carbon capture are stimulated due to investment tax credits for CO2 sequestration granted under the Energy Improvement and Extension Act of 2008 and funding through the Clean Coal Power Initiative (CCPI). A total of four 500 megawatt (MW) plants are assumed to be built, two plants in 2016 and two in 2017, in the southeast (SERC) region. No plants are retrofitted with CCUS and no additional new carbon capture capacity is built.
The results of the model runs in the climate change policy cases indicate that between 45 and 60 percent of existing coal capacity would be good candidates for CCUS retrofit if the NETL R&D goal is met. In the CO2 Tax case, achieving the NETL R&D goal results in 217 GW of net (derated) CCUS capacity by 2035 and these plants are able to capture almost 1,500 million metric tons (MMT) CO2 annually. As illustrated in the graphs below (see Exhibit 3-4), most of these plants are retrofitted after 2025.
In the Goal/CO2 Tax case for the period 2025 to 2035, the majority of new low-carbon generation capacity is existing coal-fired power plants that are retrofitted with CCUS technology (see Table 3-3). In the No Goal/CO2 Tax case, however, nuclear and renewable energy options (biomass IGCC and other renewables1) dominate the new low-carbon generation mix and few existing coal-fired power plants are retrofitted with CCUS technology until 2035.
1 Other Renewables include solar, wind, and geothermal electricity generation capacity.
0.0
10.0
20.0
30.0
40.0
50.0
60.0
70.0
2010 2015 2020 2025 2030 2035
2008
$ p
er
me
tric
to
nn
e C
O2
CO2 Tax
CES_NoGoal
CES_Goal
CES w/out NETL
R&D Goal
CES w/ NETL
R&D Goal
CO2 Tax
Exhibit 3-3 CO2 Tax vs. CES Credit Price

EPEC Program Benefits Analysis
12
Exhibit 3-4 CO2 Tax Case
Table 3-3 New Low-Carbon Generation Capacity in CO2 Tax Case
(Change from Reference Case)
No Goal/CO2 Tax Case Goal/CO2 Tax Case
2025 2030 2035 2025 2030 2035
New Coal CCUS 0% 0% 3% 0% 2% 4%
Retrofit CCUS 0% 1% 21% 61% 72% 63%
Natural Gas CCUS 0% 0% 0% 0% 2% 5%
Nuclear 18% 29% 24% 11% 9% 13%
Biomass IGCC 29% 21% 13% 11% 6% 5%
Other Renewables 53% 50% 38% 17% 9% 10%
Under the CES policy, CCUS capacity is built with and without the NETL R&D goal. Total CCUS capacity built in the Goal/CES case is 135 GW by 2035, or about 60 percent more capacity than in the No Goal/CES case (see Exhibit 3-5). No natural gas plants with CCUS are built under the CES policy, although a small amount was added in the later years in the Goal/CO2 Tax case.
The Goal/CES case and No Goal/CES case reflect differences in the mix of least-cost generation chosen to meet the standard. In the case of new low-carbon electricity generation capacity, about a third of the capacity in the No Goal/CES case is existing power plants retrofitted with CCUS technology, rising to slightly more than 50 percent in the Goal/CES case (see Table 3-4). This is a significant contrast from the CO2 Tax policy in which very little retrofit CCUS capacity was added in the No Goal/CO2 Tax case. This is because the CES sets an annual low-carbon generation target that must be met regardless of the cost of the low-carbon options, thus some CCUS plants are retrofitted in the No Goal/CES case even though the technology is more costly than in the Goal/CES case. However, when the cost of CCUS technology is reduced due to NETL’s R&D advances, additional plants are retrofitted with CCUS, when compared to the No Goal/CES case.
0
300
600
900
1,200
1,500
1,800
2025 2030 2035 2025 2030 2035
Mil
lio
n M
etr
ic T
on
s C
O2
Annual CO2 Captured and Stored
Natural Gas CCUS
Retrofit CCUS
New Coal CCUS
CO2 Tax w/out
NETL R&D Goal
CO2 Tax w/
NETL R&D Goal
0
50
100
150
200
250
2025 2030 2035 2025 2030 2035
De
rate
d C
ap
aci
ty (
Gig
aw
att
s)
CCUS Capacity
Natural Gas CCUS
Retrofit CCUS
New Coal CCUS
CO2 Tax w/out
NETL R&D Goal
CO2 Tax w/
NETL R&D Goal

EPEC Program Benefits Analysis
13
Exhibit 3-5 Clean Energy Standard Case
Table 3-4 New Low-Carbon Generation Capacity in CES Case
(Change from Reference Case)
No Goal/CES Case Goal/CES Case
2025 2030 2035 2025 2030 2035
New Coal CCUS 0% 0% 2% 0% 2% 6%
Retrofit CCUS 37% 38% 34% 56% 58% 55%
Natural Gas CCUS 0% 0% 0% 0% 0% 0%
Nuclear 14% 14% 14% 10% 13% 15%
Biomass IGCC 9% 14% 16% 0% 3% 5%
Other Renew 40% 34% 34% 34% 24% 19%
Under both policies, coal and gas electricity generation capacity is lost due to a combination of retirements of conventional coal and natural gas (mostly steam plants) as well as coal capacity lost in the CCUS retrofit process (i.e., CCUS deratings). There are fewer retirements of conventional coal and natural gas plants in the Goal case than the No Goal case for each policy (Exhibit 3-6). Further, the large number of existing coal-fired power plants retrofitted with CCUS technology in the Goal/CO2 Tax case results in an increase loss of capacity due to deratings (Exhibit 3-6), but results in more CO2 captured and stored (Exhibit 3-4) and less energy expenditures (See Section 3.1 Energy Expenditures). It should also be noted that the derating per plant will be less for the plants in the Goal cases than the No Goal cases because the power plants in the Goal cases are assumed to be more efficient as a result of NETL’s R&D.
0
50
100
150
200
250
2025 2030 2035 2025 2030 2035
De
rate
d C
ap
aci
ty (
Gig
aw
att
s)
CCUS Capacity
Natural Gas CCUS
Retrofit CCUS
New Coal CCUS
CES w/out
NETL R&D Goal CES w/
NETL R&D Goal
0
300
600
900
1,200
1,500
1,800
2025 2030 2035 2025 2030 2035
Mil
lio
n M
etr
ic T
on
s C
O2
Annual CO2 Captured and Stored
Natural Gas CCUS
Retrofit CCUS
New Coal CCUS
CES w/out
NETL R&D
CES w/
NETL R&D Goal

EPEC Program Benefits Analysis
14
Exhibit 3-6 Capacity Lost Due to Retirements and CCUS Deratings by 2035
3.5 Carbon Transport and Storage
Two key elements of CCUS are the transport and storage of CO2 from the power plant to a geological storage site where it will be monitored to verify that it does not leak back into the atmosphere. In this study, the CO2 that is captured at the coal-fired power plants tends to be stored locally – within 100 miles of the power plant, on average – thus significantly more intraregional pipelines are built than interregional (see Table 3-5). In each policy case (i.e., CO2 Tax and CES), a larger number of pipelines and storage sinks are utilized in the NETL R&D cases than the No Goal cases because more power plants are capturing CO2 in the Goal cases.1
The CTS Network Model used in this study has the capability to either build a dedicated pipeline to transport the CO2 from the power plant to the storage site, or utilize a trunk line that enables multiple power plants to connect to this pipeline, which then transports the CO2 to a storage sink. This study found that the economics of a nearby sink outweigh the economies of scale achieved by accessing a trunk line. In general, a dedicated pipeline is 3 times more likely to be used over a trunk line to transport the CO2 (see Table 3-6). The average pipeline distances are 95 miles for dedicated lines and roughly twice that for trunk lines (188 miles).
1 See Appendix C for an overview of the econometric input-output model.
0
30
60
90
120
150
180
BAU CTX_NoGoal CTX_Goal CES_NoGoal CES_Goal
Cu
mu
lati
ve
Ca
pa
city
(G
igaw
att
s)and CCS Deratings by 2035
CCS Deratings
Natural Gas
Conv Coal
BAU CO2 Tax
w/out
NETL R&D
Goal
CO2 Tax
w/ NETL
R&D Goal
CES
w/out
NETL R&D
Goal
CES
w/ NETL
R&D Goal
CCUS Deratings
Natural Gas
Conv Coal
EPEC Program Benefits Analysis
15
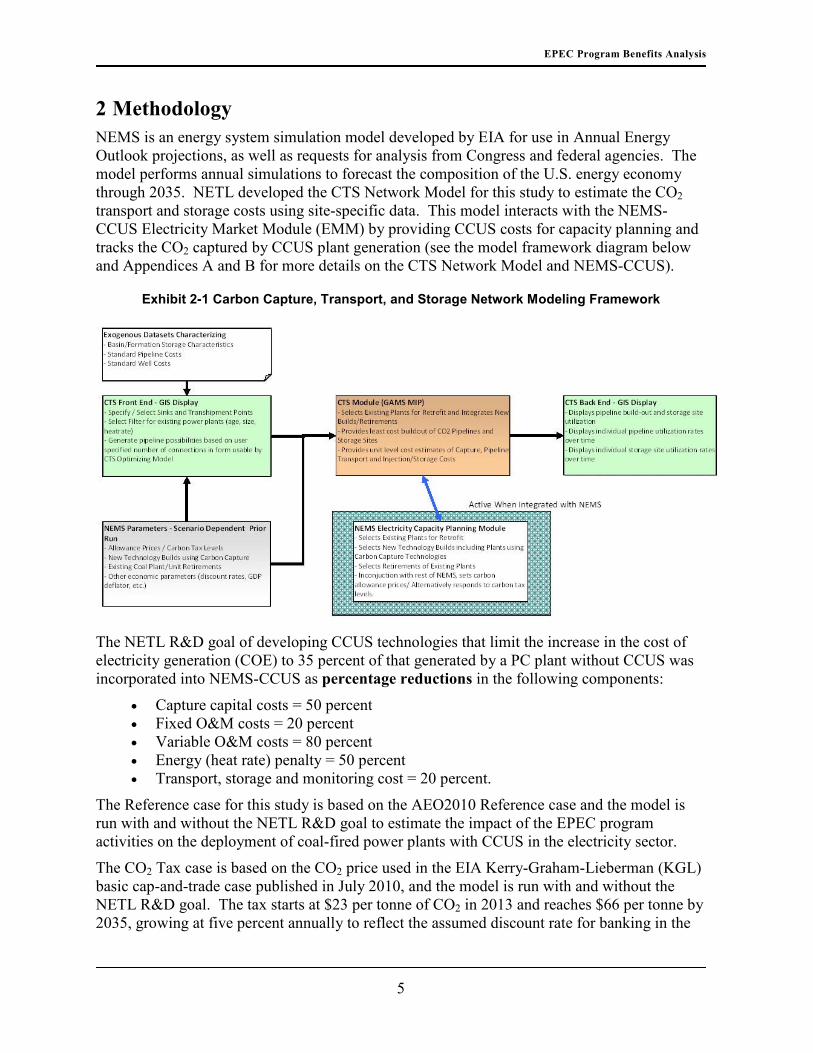
Table 3-5 Capture – Transport – Storage Data
Table 3-6 Carbon Dioxide Transport Pipeline Data
*19 possible nodes
Despite the desirable geological characteristics of the Gulf Coast sinks, sinks in Pennsylvania and Kentucky (Ohio River Valley) receive the most CO2 in the NEMs-CCUS runs, in part due to the high concentration of coal-fired power plants in that region of the country that are retrofitted with CCUS technology in this study (see Exhibit 3-4 for data from Goal/CO2 Tax case). In terms of regions, the highest concentration of CO2 capture is in ECAR (Eastern Central Area of Responsibility) followed by SERC (Southeastern Electricity Regulatory Commission) and ERCOT (Electric Reliability Council of Texas). See Exhibit 3-7 for a breakout of the amount of CO2 injected by site.
No Goal/CES
Case
Goal/CES
Case
No Goal/CO2
Tax Case
Goal/CO2
Tax Case
Total Possibility
Set
Plant Retrofits (Gross GW) 113 157 43 243 322
New Builds (Gross GW) 6 16 6 14
Year of Initial Retrofit/Build 2020 2020 2030 2024
Storage Sinks 20 26 17 28 30
Pipelines
Intraregional 71 122 35 181
Interregional 22 35 8 62
No Goal/CES
Case
Goal/CES
Case
No Goal/CO2
Tax Case
Goal/CO2
Tax Case
Pipelines 93 157 43 243
Intraregional 71 122 35 181
Interregional 22 35 8 62
Dedicated Pipelines 67 114 36 148
Intraregional 52 89 28 113
Interregional 15 25 8 38
Plants using trunklines 26 43 7 95
Intraregional 19 33 7 68
Interregional 7 10 0 27
Nodes Accessed* 8 12 3 17

EPEC Program Benefits Analysis
16
Exhibit 3-7 CO2 Tax with NETL R&D Goal: Cumulative Injection by Site
The three graphs of the United States below (Exhibits 3-8, 3-9, and 3-10) illustrate how the capture-pipeline-storage network develops over time in Goal/CO2 Tax case. The 2025 map shows the first movers to CCUS technology, which are primarily in the ECAR, SERC and ERCOT regions. In the 2030 map, there is five times the amount of CO2 transported and stored annually compared to 2025 and pipelines exist in most regions of the nation (see 2030 map of the US). In the 2035 time horizon most of the additional CO2 volume comes from new CCUS power plants and the bulk of the transshipment points and sinks are utilized in the network.
0 200 400 600 800 1000 1200 1400
NC
WY-PR
KS
CA
MI
WY-GR
WA
TX-P
LA-G2
TX-B
MT
ND
SC
IN
MS
CO
LA-G1
NM
FL-CL
UT
TX-G
IL
TN
TX-N
DE
MO
KY
PA
million metric tonnes
Inje
ctio
n S
ite
s

EPEC Program Benefits Analysis
17
Exhibit 3-8 2025 Carbon Transportation and Storage GIS, CO2 Tax – NETL R&D Goal Case
Note: The annual CO2 volume in the figure above differs from the annual CO2 captured and stored in 2025 in Exhibit 3-4 because the
total in the figure above assumes the capacity factor for all power plants is 75 percent. In the NEMS runs that generated the data in
Exhibit 3-4, the model dispatches the coal plants and the resultant capacity factors vary, sometimes significantly. In order to inform the
CTS Network model to build pipelines that would be useful at or near maximum flows, we chose to use the 75 percent capacity factor to
estimate the flow amounts from each unit. Thus, the carbon emitted estimate from the NEMS runs, which were used for Exhibit 3-4,
varies from the carbon estimates based on the CTS Network model, which is presented above.

EPEC Program Benefits Analysis
18
Exhibit 3-9 2030 Carbon Transportation and Storage GIS, CO2 Tax – NETL R&D Goal Case
Note: The annual CO2 volume in the figure above differs from the annual CO2 captured and stored in 2030 in Exhibit 3-4 because the
total in the figure above assumes the capacity factor for all power plants is 75 percent. In the NEMS runs that generated the data in
Exhibit 3-4, the model dispatches the coal plants and the resultant capacity factors vary, sometimes significantly. In order to inform the
CTS Network model to build pipelines that would be useful at or near maximum flows, we chose to use the 75 percent capacity factor to
estimate the flow amounts from each unit. Thus, the carbon emitted estimate from the NEMS runs, which were used for Exhibit 3-4,
varies from the carbon estimates based on the CTS Network model, which is presented above.

EPEC Program Benefits Analysis
19
Exhibit 3-10 2035 Carbon Transportation and Storage GIS, CO2 Tax – NETL R&D Goal Case
Note: The annual CO2 volume in the figure above differs from the annual CO2 captured and stored in 2035 in Exhibit 3-4 because the
total in the figure above assumes the capacity factor for all power plants is 75 percent. In the NEMS runs that generated the data in
Exhibit 3-4, the model dispatches the coal plants and the resultant capacity factors vary, sometimes significantly. In order to inform the
CTS Network model to build pipelines that would be useful at or near maximum flows, we chose to use the 75 percent capacity factor to
estimate the flow amounts from each unit. Thus, the carbon emitted estimate from the NEMS runs, which were used for Exhibit 3-4,
varies from the carbon estimates based on the CTS Network model, which is presented above.

EPEC Program Benefits Analysis
20
4 Conclusion
The EPEC program is investing in a portfolio of activities to research, develop, and demonstrate CCUS technologies that limit the increase in the cost of electricity generation to 35 percent of that generated by an equivalent greenfield PC plant without CCUS. If this goal is achieved and a climate change policy is enacted, this study estimates that the EPEC program could provide significant benefit to the nation’s energy security, environment quality, and economy.
On the economic front, the EPEC program is working with other elements of NETL’s Strategic Center for Coal and industry partners to cost-effectively capture and store CO2 before it is emitted into the atmosphere so that coal can continue to be used to generate electricity without restricting economic growth in the process. When the energy expenditures in the No Goal cases are compared with the NETL R&D goal under a CO2 Tax policy and a CES policy, this study estimates that the expenditures are as much as $84 billion lower in the Goal cases, with the bulk of this cumulative savings coming about in the 2025-2035 period when the majority of coal-fired power plants would be retrofitted with CCUS technologies. In addition to benefiting the U.S. economy by lowering energy expenditures, achieving the NETL R&D goal could result in about 800,000 gross jobs being added to the U.S. economy as workers are hired to retrofit existing power plants with CCUS technologies and construct new CCUS plants and pipelines. The direct payments to these workers over the 2012 to 2035 period would sum to $43 billion, with the indirect and induced impacts totaling $8 billion.
On the environmental quality front, the large reduction in CO2 emissions that will result from retrofitted existing power plants with CCUS technologies will enable the EPEC program to be a major contributor to DOE’s efforts to partner with industry to develop clean energy technologies that can significantly reduce the CO2 footprint of the United States. In fact, this study found that even while 85 percent of today’s coal capacity could be in place in 2035 if the NETL R&D goal is met and carbon policy is enacted, the coal fleet would emit 85 percent less CO2 emissions than today’s fleet because a large number of the power plants are viable candidates for being retrofitted with CCUS technologies.
On the energy security front, the availability of low-cost CCUS options to retrofit coal-fired power plants will help ensure that the United States can continue to use its abundant coal resources to generate electricity. For example, this study estimates that between 120 and 188 GW of retrofitted coal-fired CCUS capacity would be online by 2035 if the NETL R&D goal is met and carbon policy is enacted, compared to 30 to 79 GW if the goal is not realized.
In conclusion, achieving the NETL R&D goal would significantly reduce the economic burden of enacting a climate change policy in the U.S. by driving down the costs associated with CCUS technologies and enabling coal-fired power plants to remain a key part of the nation’s electricity sector and carbon mitigation strategy.

EPEC Program Benefits Analysis
21
Appendix A – Carbon Capture, Transport and Storage Network
Model
A model was developed for this study that calculates the carbon transportation and storage costs involved in capturing carbon dioxide (CO2) at coal-fired power plants and sequestering in a geological formation somewhere in the United States (i.e., the CTS Network Model). This first section of the appendix clarifies the transport cost methodology used in the CTS Network Model. The second section presents the calculations used to determine injection rates (and subsequently, well numbers) for the CO2 storage sites.
CO2 Pipeline Transport Cost Calculation
This study draws upon four reports that focus on the transportation and storage of CO2 (Note: the name in quotes will be how the study is referred to in the CTS Network Model methodology discussion below:
• “MIT Study”: Herzog, Howard and Holly Javedan. January 2010. Development of a Carbon Management Geographic Information System (GIS) for the United States;
Final Report. Massachusetts Institute of Technology. NETL Contract DE-FC26-02NT41622.
• “Heddle, et al. Study”: Heddle, Gemma, Howard Herzog and Michael Klett. 2003. The Economics of CO2 Storage. Laboratory for Energy and the Environment, Massachusetts Institute of Technology. MIT LFEE 2003-03 RP.
• “NETL Paper”: Tarka, Thomas J. and John G. Wimer. March 2010. Quality Guidelines for Energy Systems Studies: Estimating CO2 Transport, Storage &
Monitoring Costs. Office of Systems Analysis & Planning, NETL. DOE/NETL-2010/1447.
• “UC Davis Study”: Parker, Nathan. 2004. Using Natural Gas Transmission Pipeline Costs to Estimate Hydrogen Pipeline Costs. Institute of Transportation Studies, University of California, Davis, CA.
In brief, the CTS Network Model adopts the NETL Paper/UC Davis Study transport cost calculations.
The MIT Study refers to work contracted to Massachusetts Institute of Technology (MIT) by NETL to investigate CO2 pipeline costs utilizing GIS technology. This paper cites earlier work done at MIT’s Laboratory for Energy and the Environment by Heddle et. al. as the source for its pipeline construction cost equation.
The NETL Paper refers to a paper published in 2010 by the Office of Systems Analysis and Planning at NETL that focuses on transport and storage costs for CO2. This paper cites work done at University of California, Davis’s Institute of Transportation Studies by Nathan Parker (2004) as the source for its pipeline construction cost equations.
Both the MIT/Heddle papers and the NETL/UC Davis papers assume natural gas pipeline construction costs to be an appropriate proxy for CO2 pipeline costs. Further, both MIT/Heddle and NETL/UC Davis rely on nearly the same historical cost data published in

EPEC Program Benefits Analysis
22
multiple issues of the Oil & Gas Journal by Warren True1 (NETL/UC Davis using a slightly longer historical period for their analysis). Each study performs regression analyses on the natural gas pipeline cost equations to develop cost equation(s) for the CO2 pipelines.
The original data, published by True, disaggregates the pipeline construction costs into components: materials, labor, miscellaneous and right of way costs. The MIT/Heddle approach consolidates the component costs into a total cost and performs the regression analysis on this total, resulting in a single linear equation for the pipeline cost estimate:
Pipeline Cost = $33,853 *D * L
Where:
D = pipe diameter (inches)
L = pipe length (miles)
Year 2000 USD
The UC Davis approach performs regressions on each of the component costs, deriving a separate equation for each component:
Material Costs = (330.5D2 + 687D + 26,960) * L + 35,000
Labor Costs = (343D2 + 2,074D + 170,013) * L + 185,000
Miscellaneous Costs = (8,417D + 7,324) * L + 95,000
Right of Way Costs = (577D + 29,788) * L+ 40,000
Where:
D = pipe diameter (inches)
L = pipe length (miles)
Year 2000 USD
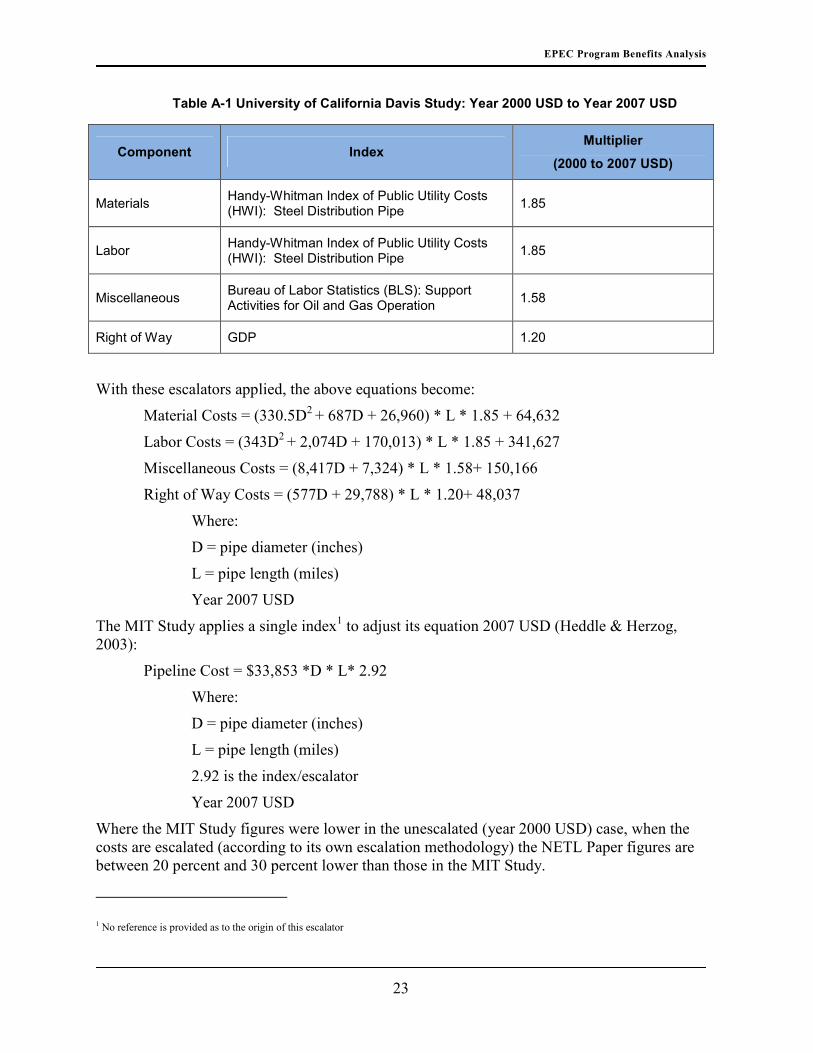
If the two approaches are compared at this point, the results using the MIT Study calculation are roughly between 10 percent and 20 percent lower than those the UC Davis Study calculations. However, each study applies escalators to adjust the equations to 2007 USD. The NETL Paper takes the equations presented in the UC Davis Study and escalates them from Year 2000 USD to Year 2007 USD using a component-specific index (Table A-1).
1 Warren True’s studies are listed in the References section of this document.
EPEC Program Benefits Analysis
23
Table A-1 University of California Davis Study: Year 2000 USD to Year 2007 USD
Component Index Multiplier
(2000 to 2007 USD)
Materials Handy-Whitman Index of Public Utility Costs (HWI): Steel Distribution Pipe
1.85
Labor Handy-Whitman Index of Public Utility Costs (HWI): Steel Distribution Pipe
1.85
Miscellaneous Bureau of Labor Statistics (BLS): Support Activities for Oil and Gas Operation
1.58
Right of Way GDP 1.20
With these escalators applied, the above equations become:
Material Costs = (330.5D2 + 687D + 26,960) * L * 1.85 + 64,632
Labor Costs = (343D2 + 2,074D + 170,013) * L * 1.85 + 341,627
Miscellaneous Costs = (8,417D + 7,324) * L * 1.58+ 150,166
Right of Way Costs = (577D + 29,788) * L * 1.20+ 48,037
Where:
D = pipe diameter (inches)
L = pipe length (miles)
Year 2007 USD
The MIT Study applies a single index1 to adjust its equation 2007 USD (Heddle & Herzog, 2003):
Pipeline Cost = $33,853 *D * L* 2.92
Where:
D = pipe diameter (inches)
L = pipe length (miles)
2.92 is the index/escalator
Year 2007 USD
Where the MIT Study figures were lower in the unescalated (year 2000 USD) case, when the costs are escalated (according to its own escalation methodology) the NETL Paper figures are between 20 percent and 30 percent lower than those in the MIT Study.
1 No reference is provided as to the origin of this escalator

EPEC Program Benefits Analysis
24
Since the CTS Network Model uses 2007 dollars as a cost basis, comparing the MIT and NETL escalated figures is most appropriate. While the variance between the two calculations is great when each uses its own escalation methodology, if the method of escalation is normalized, the variance is relatively small. A weighted average escalator is calculated using the relative costs of the transportation components with labor and materials accounting for approximately 76 percent and miscellaneous costs and right of way accounting for 20 percent and 4 percent of the total cost, respectively. This escalator is then applied to the MIT year 2000 cost figures to derive a year 2007 dollar figure that is roughly comparable to the NETL year 2007 cost figures. As Exhibit A-1 illustrates, the resulting costs (in the shaded area) are close – within about 10 percent in most cases.
The approach taken in the UC Davis Study and NETL Paper has a distinct advantage over the MIT methodology. The disaggregation of the cost components allows for a finer adjustment of the key costs, allowing each major cost component to (appropriately) move independently of the other. Applying a single index could either over state or under-state the actual cost to construct a pipeline. While both the MIT Study and NETL Paper calculations produce similar results (when escalators are normalized) the NETL Paper methodology allows for better specificity in defining the actual costs and allowing for their escalation. The CTS Network Model has therefore adopted the NETL Paper/UC Davis Study transport cost calculations.
The rate of injection (which determines the number of wells required) and depth are the primary determinants of the cost to sequester the CO2. While depth of an injection site is taken from geologic studies/data of the area, injection rates are calculated and depend upon the geologic characteristics of the injection site. There is a wide range of variation in these characteristics, resulting in injection rates and costs that can vary by four orders of magnitude across the geologic (storage) basins in the United States (Eccles, 2009).
Exhibit A-1 Pipeline Cost per Mile
CO2 Storage Characteristics/Injection Rates
For the injection rate calculation, the CTS Network Model relies upon a methodology published by Law and Bachu (2009) under contract with NETL. This methodology is based on the basic relationship for calculating CO2 injectivity, downhole injection pressure, and the

EPEC Program Benefits Analysis
25
number of wells required for a given CO2 flow rate derived by Law and Bachu (1996). It requires inputs for CO2 downhole injection pressure, reservoir pressure, thickness, depth, and permeability. Exhibit A-2 provides the overview of the model, which will be described below in greater detail.
Given the depth of the reservoir, the downhole injection pressure (Pinj) is assumed to be equal to the reservoir fracture pressure, which by default is set to be Pinj (psi) = 0.6*depth (feet).
Exhibit A-2 Law & Bachu (1996) CO2 Injectivity Model Overview
Model Calculations
Viscosity Calculation
The viscosity of the CO2 (µ) at the reservoir conditions is estimated using correlations from McCollum (2006) that assumes the CO2 viscosity is a function of the pressure and temperature of the reservoir. The reservoir temperature is estimated assuming a surface temperature of 15ºC and a geothermal gradient of 25 ºC /km. The reservoir pressure (Pres) is estimated using the following formula from Law and Bachu (2009):
Pres (psi) = 0.435*depth (feet).
Absolute Permeability Calculation
Next, the absolute permeability (ka) is found from (Law and Bachu, 1996)
ka= (permh x permv)0.5
Where:
ka = absolute permeability (mD)
kh = horizontal permeability (mD)
kv = the vertical permeability and is equal to 0.3 times the horizontal
permeability (mD)

EPEC Program Benefits Analysis
26
Injectivity Calculation
A relationship, derived by Law and Bachu (1996), is used to determine CO2 injectivity from CO2 mobility. This relationship is shown in Exhibit A-3.
Exhibit A-3 CO2 Injectivity as a Function of CO2 Mobility
First mobility is calculated:
mobility = ka/µ,
and from that, CO2 injectivity is calculated:
injectivity = 0.0208*mobility
Where:
injectivity = the mass flow rate of CO2 that can be injected per unit of reservoir
thickness (thickness) and per unit of downhole pressure difference (Pinj – Pres)
(t/d/m/MPa)
mobility = CO2 mobility (mD/cp)
y = 0.0208x
0.10
1.00
10.00
100.00
10 100 1000 10000
CO2injectivity (t/d/m/MPa)
CO2 mobility (md/cp)
CO2 Injectivity as a Function of CO2 Mobility
Exhibit A-3

EPEC Program Benefits Analysis
27
Injection Rate Calculation (and well number)
Given the CO2 injectivity, the CO2 injection rate per well (QCO2/well) and then the number of wells required (N) for a given CO2 flow rate (m) could be found from:
QCO2/well = injectivity x h x (Pinj – Pres)
N = m / QCO2/well
Where:
QCO2/well = CO2 injection rate per well (tonne/day)
h = reservoir thickness (m)
Pinj = downhole injection pressure (MPa)
Pres = initial reservoir pressure (MPa)
m = given CO2 flow rate (tonne/day)
N = number of wells required for a given CO2 flow rate
Model Inputs
Most inputs for depth, permeability and formation thickness were provided by NETL (Grant, 2010), based on work done by ARI for NETL. Where data were missing, information from the Bureau of Economic Geology (n.d.) was used.
Comparison to Other Studies
Two other methodologies were referenced with regard to injection rate calculations:
• Eccles (2009)
• MIT (2009).
The Eccles (2009) and Law and Bachu (2009) methods are predicated on the assumption that CO2 (in super-critical state) injection rates are limited by the injection-induced pressure that would cause hydraulic fracturing. However, Eccles calibrates its model to a single CO2 sequestration pilot project (Nagaoka, Japan) with a fairly low injection rate, then further constrains its model to make it even more conservative. Conversely, the method developed by ARI takes a more liberal approach, basing the injection of CO2 at super-critical conditions into a liquid-filled, possibly infinite aquifer over a given period. Ranking the outputs of each method, the Eccles method is most conservative, estimating that an average aquifer with a depth of 1350 meters, permeability of 22 mD and a thickness of 65m, 50 – 80 tonnes of CO2/day could be injected.
1 The Law and Bachu method evaluates the injection rate to be much higher: 1000 – 1500 tonnes of CO2/day. The ARI method estimates injection rates to be
1 “Average aquifer” in this instance is defined as having a depth of 1350 meters, a thickness of 65m and permeability of 22 mD.

EPEC Program Benefits Analysis
28
higher still: approximately three times the Law & Bachu rate: between 2900 and 4900 tonnes of CO2/day.
With few operational sites, significant uncertainty remains with regard to the range and bounds of geologic carbon sequestration. In addition, geophysical characteristics of potential storage sites vary significantly among and even within storage sites, leading to a wide range (up to several orders of magnitude) of estimated injection rates and, therefore, costs. Selection of a methodology for the CTS Network Model was based on objective analysis of the methods along with advice from NETL to adopt the Law & Bachu method as it was developed under contract to NETL.

EPEC Program Benefits Analysis
29
Appendix B – NEMS-CCUS Model Assumptions
The National Energy Modeling System (NEMS) is a computer-based, energy-economy modeling system of U.S. through 2035 that was designed and implemented by the Energy Information Administration (EIA) of the U.S. Department of Energy (DOE). NEMS projects the production, imports, conversion, consumption, and prices of energy, subject to assumptions on macroeconomic and financial factors, world energy markets, resource availability and costs, behavioral and technological choice criteria, cost and performance characteristics of energy technologies, and demographics. NEMS can be used to analyze the effects of existing and proposed government laws and regulations related to energy production and use; the potential impact of new and advanced energy production, conversion, and consumption technologies; the impact and cost of greenhouse gas control; the impact of increased use of renewable energy sources; and the potential savings from increased efficiency of energy use; and the impact of regulations on the use of alternative or reformulated fuels (EIA, 2009).
NEMS is designed to represent the important interactions of supply and demand in U.S. energy markets. In the United States, energy markets are driven primarily by the fundamental economic interactions of supply and demand. Government regulations and policies can exert considerable influence, but the majority of decisions affecting fuel prices and consumption patterns, resource allocation, and energy technologies are made by private individuals who value attributes other than life cycle costs or companies attempting to optimize their own economic interests. NEMS represents the market behavior of the producers and consumers of energy at a level of detail that is useful for analyzing the implications of technological improvements and policy initiatives (EIA, 2009).
NEMS is a modular system. Four end-use demand modules represent fuel consumption in the residential, commercial, transportation, and industrial sectors, subject to delivered fuel prices, macroeconomic influences, and technology characteristics. The primary fuel supply and conversion modules compute the levels of domestic production, imports, transportation costs, and fuel prices that are needed to meet domestic and export demands for energy, subject to resource base characteristics, industry infrastructure and technology, and world market conditions. The modules interact to solve for the economic supply and demand balance for each fuel. Because of the modular design, each sector can be represented with the methodology and the level of detail, including regional detail, appropriate for that sector. The modularity also facilitates the analysis, maintenance, and testing of the NEMS component modules in the multi-user environment (EIA, 2009).
NETL modified the AEO10 version of NEMS for this study to integrate the CTS Network Model outputs and account for the NETL R&D goal (the modified model is referred to as NEMS-CCUS).

EPEC Program Benefits Analysis
30
Algorithm to Adjust New Power Plant Costs to EPEC Program Goal
The EPEC program is investing in an RD&D portfolio to develop carbon capture, utilization and storage (CCUS) technologies that will enable power plant owners to affordably and efficiently capture and transport CO2 to utilization and/or storage sites. NETL’s R&D goal is supporting activities to reduce the costs of CCUS when applied to new and retrofitted power plants. This section describes how the costs associated with these technologies were adjusted in order to evaluate them using the NEMS-CCUS model. The cost adjustments for retrofits were different than those for the new IGCC plants with CCUS and advanced combined cycle plants with CCUS. Further, costs reductions in the transport and storage functions associated with the NETL programs were also implemented.
Treatment of Costs Associated with Retrofitting Carbon Capture to Existing Coal Plants
The EPEC program has established targets for cost and energy use improvements associated with retrofitting existing coal-fired power plants. For the NEMS-CCUS model simulation, these improvements are assumed to be achieved over a 10 year period beginning in 2020, and to follow a linear path of annual incremental reductions until the goal is achieved.
Each existing power plant was modeled individually for this study, however, for purposes of illustration of the program improvements for this document, a hypothetical power plant is used. A hypothetical 600 MW power plant with a 10,000 Btu/kWh heat rate would see the improvements shown in Table B-1.
Table B-1 Improvements of 600 MW Power Plant with 10,000 Btu/kWh Heat Rate
Unit
Pre Program
Post Program
Capital Cost $/kW 1,304 652
Fixed O&M Cost million$/yr 3 2.34
Variable O&M Cost $/tonne 8 1.62
Post Retrofit Heat Rate Btu/kWh 13,500 11,750

EPEC Program Benefits Analysis
31
The improvements over the program time horizon are illustrated in Exhibits B-1, B-2, B-3, and B-4.
Exhibit B-1 Program Time Horizon Improvements for Capital Cost
Exhibit B-2 Program Time Horizon Improvements for Fixed O&M Costs
-
200
400
600
800
1,000
1,200
1,400
20
15
20
16
20
17
20
18
20
19
20
20
20
21
20
22
20
23
20
24
20
25
20
26
20
27
20
28
20
29
20
30
$/
kWCapital Cost
Capital Cost
-
0.5
1.0
1.5
2.0
2.5
3.0
3.5
20
15
20
16
20
17
20
18
20
19
20
20
20
21
20
22
20
23
20
24
20
25
20
26
20
27
20
28
20
29
20
30
Fixed O&M Costs
Fixed O&M Costs

EPEC Program Benefits Analysis
32
Exhibit B-3 Program Time Horizon Improvements for Variable O&M Costs
Exhibit B-4 Program Time Horizon Improvements for Heat Rate
-
1.0
2.0
3.0
4.0
5.0
6.0
7.0
8.0
9.0
20
15
20
16
20
17
20
18
20
19
20
20
20
21
20
22
20
23
20
24
20
25
20
26
20
27
20
28
20
29
20
30
Variable O&M Costs
Variable O&M Costs
10500
11000
11500
12000
12500
13000
13500
14000
20
15
20
16
20
17
20
18
20
19
20
20
20
21
20
22
20
23
20
24
20
25
20
26
20
27
20
28
20
29
20
30
Btu
/kW
h
Heat Rate
Heat Rate
EPEC Program Benefits Analysis
33
Treatment of Cost Associated with Carbon Capture on New IGCC and New Advanced
Combined Cycle Plants
In NEMS, there are only two plant types that are assumed to have carbon capture: the integrated gasification combined cycle (IGCC) plants and a version of advanced carbon capture (CC) plants. As was the case with retrofitting existing coal power plants, the efficiency and capital costs associated with the these plants were adjusted to capture the assumed impact of the EPEC program on these costs.
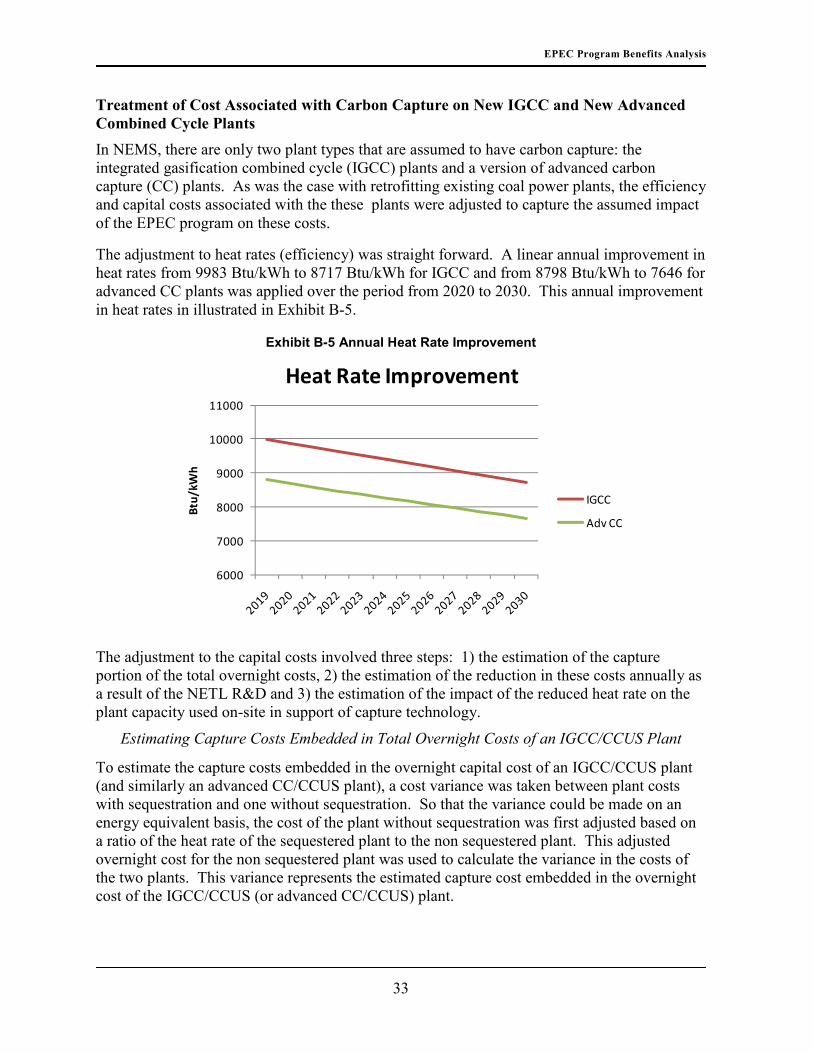
The adjustment to heat rates (efficiency) was straight forward. A linear annual improvement in heat rates from 9983 Btu/kWh to 8717 Btu/kWh for IGCC and from 8798 Btu/kWh to 7646 for advanced CC plants was applied over the period from 2020 to 2030. This annual improvement in heat rates in illustrated in Exhibit B-5.
Exhibit B-5 Annual Heat Rate Improvement
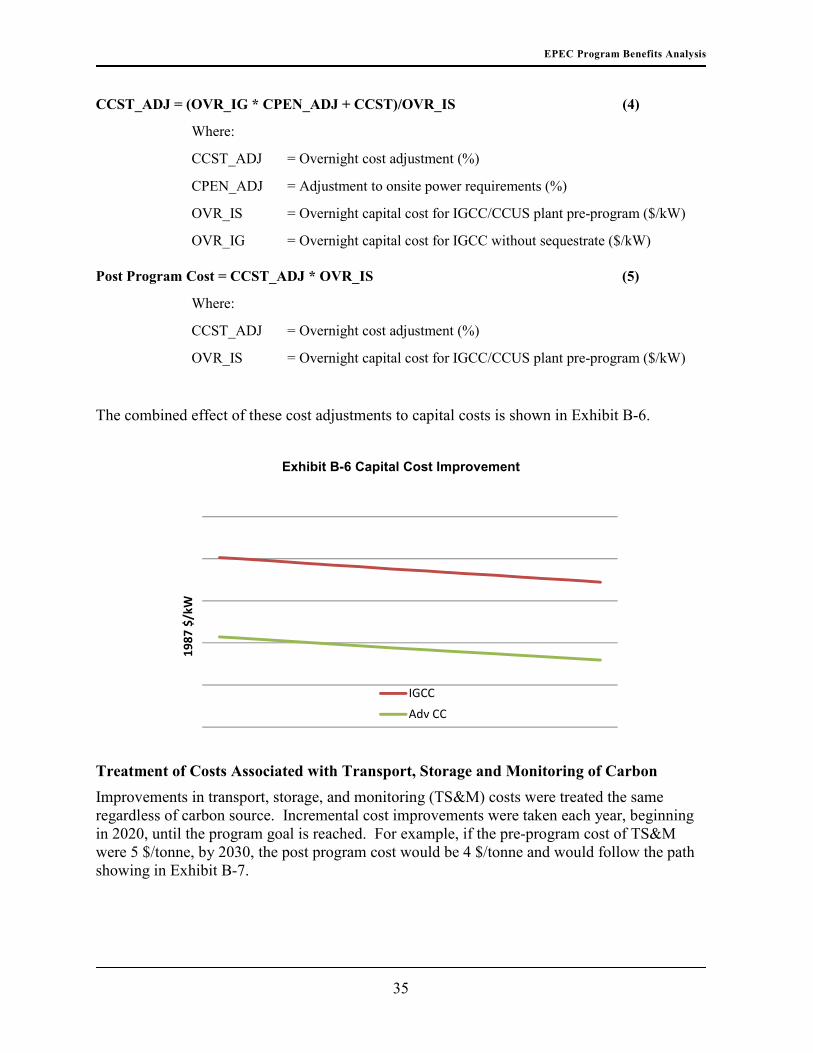
The adjustment to the capital costs involved three steps: 1) the estimation of the capture portion of the total overnight costs, 2) the estimation of the reduction in these costs annually as a result of the NETL R&D and 3) the estimation of the impact of the reduced heat rate on the plant capacity used on-site in support of capture technology.
Estimating Capture Costs Embedded in Total Overnight Costs of an IGCC/CCUS Plant
To estimate the capture costs embedded in the overnight capital cost of an IGCC/CCUS plant (and similarly an advanced CC/CCUS plant), a cost variance was taken between plant costs with sequestration and one without sequestration. So that the variance could be made on an energy equivalent basis, the cost of the plant without sequestration was first adjusted based on a ratio of the heat rate of the sequestered plant to the non sequestered plant. This adjusted overnight cost for the non sequestered plant was used to calculate the variance in the costs of the two plants. This variance represents the estimated capture cost embedded in the overnight cost of the IGCC/CCUS (or advanced CC/CCUS) plant.
6000
7000
8000
9000
10000
11000
Btu
/kW
h
Heat Rate Improvement
IGCC
Adv CC

EPEC Program Benefits Analysis
34
Estimating Reduction in Capture Costs Associated with the Program Goal
The program goal was applied to the estimated capture cost (described, above) in a manner identical to the retrofit costs. A linear decline in costs was applied annually over the program period such that by 2030, the estimated capture cost was 50 percent of the pre-program cost.
Estimating the Reduction in Capture Costs Associated with a Reduction in On-site
Power Use for Capture Technology
The capture costs were further adjusted to account for the reduction of on-site power that is required as the program goal is met. The adjustment energy requirement over time is based on the ratio of the heat rate of sequestered plant (which improves over time) to that of the non sequestered plant which is static.
The following equations illustrate the adjustment to the capture costs for new IGCC/CCUS plants.
HT_RT_ADJ = HR_IG/HR_IS * (1 – GoalHR(t)) + GoalHR(t) (1)
Where:
HT_RT_ADJ = Heat rate adjustment (%)
HR_IG = Heat rate of IGCC without sequestration (Btu/kWh)
HR_IS = Heat rate of IGCC with sequestration (Btu/kWh)
GoalHR(t) = Amount HR is reduced in year t (%)
CCST = (OVR_IS – OVR_IG * HR_IS/HR_IG) * GoalCCST(t) * HT_RT_ADJ (2)
Where:
CCST = Overnight capital cost for an IGCC/CCUS plant ($/kW)
OVR_IS = Overnight capital cost for IGCC/CCUS plant pre-program ($/kW)
OVR_IG = Overnight capital cost for IGCC without sequestrate ($/kW)
GoalCCST(t) = Amount capital cost is reduced in year t
HT_RT_ADJ = Heat rate adjustment (%)
CPEN_ADJ = HT_RT_ADJ * HR_IS/HR_IG (3)
Where:
CPEN_ADJ = Adjustment to onsite power requirements (%)
HT_RT_ADJ = Heat Rate Adjustment
HR_IG = Heat rate of IGCC without sequestration (Btu/kWh)
HR_IS = Heat rate of IGCC with sequestration (Btu/kWh)
EPEC Program Benefits Analysis
35
CCST_ADJ = (OVR_IG * CPEN_ADJ + CCST)/OVR_IS (4)
Where:
CCST_ADJ = Overnight cost adjustment (%)
CPEN_ADJ = Adjustment to onsite power requirements (%)
OVR_IS = Overnight capital cost for IGCC/CCUS plant pre-program ($/kW)
OVR_IG = Overnight capital cost for IGCC without sequestrate ($/kW)
Post Program Cost = CCST_ADJ * OVR_IS (5)
Where:
CCST_ADJ = Overnight cost adjustment (%)
OVR_IS = Overnight capital cost for IGCC/CCUS plant pre-program ($/kW)
The combined effect of these cost adjustments to capital costs is shown in Exhibit B-6.
Exhibit B-6 Capital Cost Improvement
Treatment of Costs Associated with Transport, Storage and Monitoring of Carbon
Improvements in transport, storage, and monitoring (TS&M) costs were treated the same regardless of carbon source. Incremental cost improvements were taken each year, beginning in 2020, until the program goal is reached. For example, if the pre-program cost of TS&M were 5 $/tonne, by 2030, the post program cost would be 4 $/tonne and would follow the path showing in Exhibit B-7.
19
87
$/k
W
IGCC
Adv CC

EPEC Program Benefits Analysis
36
Exhibit B-7 TS&M Cost
CCUS Technology Leaning Curve Assumptions
A key feature of NEMS is the representation of technology and technology improvement over time. Five of the sectors—residential, commercial, transportation, electricity generation, and refining—include extensive treatment of individual technologies and their characteristics, such as the initial capital cost, operating cost, date of availability, efficiency, and other characteristics specific to the particular technology. For example, technological progress in lighting technologies results in a gradual reduction in cost and is modeled as a function of time in these end-use sectors. In addition, the electricity sector accounts for technological optimism in the capital costs of first-of-a-kind generating technologies and for a decline in cost as experience with the technologies is gained both domestically and internationally. In each of these sectors, equipment choices are made for individual technologies as new equipment is needed to meet growing demand for energy services or to replace retired equipment (EIA, 2009).
In the electricity model of NEMS, learning factors which represent gains in efficiency and/or reduction in costs are regularly employed to represent technology improvements achieved over time. There currently exist such learning factors for the CCUS component of new power plants, representing three scenarios (listed by degree of impact, low to high): conventional, evolutionary, and revolutionary (Exhibit B-8). The treatment of these learning curves, when evaluating the impacts of the NETL R&D goal, is discussed below.
3.0
3.5
4.0
4.5
5.0
5.5
6.0
20
15
20
16
20
17
20
18
20
19
20
20
20
21
20
22
20
23
20
24
20
25
20
26
20
27
20
28
20
29
20
30
$/
ton
ne
T, S & M

EPEC Program Benefits Analysis
37
Exhibit B-8 Learning Curves
The NEMS learning curves apply a trajectory of cost savings based on capacity doubling levels. Thus, at each doubling of new build gigawatts, savings is achieved by the amount prescribed by the learning factor. The progression of the trajectory is constrained so that the revolutionary and evolutionary curves do not exceed 50 percent, and the conventional curve does not exceed 20 percent.
The NETL R&D goal has been translated into cost reduction vectors matching the cost variables in the NEMS-CCUS model (Exhibit B-9). It was assumed that cost reductions would begin in 2020 and follow an annual linear progression until program they are met in 2030, after which no further reductions would be applied. In some cases (e.g. fixed capture costs) the weighted average of two elements were combined to produce a program goal vector that could be directly applied to the NEMS-CCUS model variable. In other cases (e.g. TS&M costs), the cost impact related to the program goal was applied directly to the variables.
-
0.20
0.40
0.60
0.80
1.00
0 2 4 6 8 10 12 14 16 18 20 22 24
Sa
vin
gs
Co
eff
icie
nt
Doublings
Conventional
Evolutionary
Revolutionary

EPEC Program Benefits Analysis
38
Exhibit B-9 Program Goal Vectors Used in NEMS-CCUS Model
A baseline or business-as-usual and a program goal case are defined. A learning curve is typically used when any carbon scenario is run in NEMS and so, for both the business-as-usual case and the program goal cases, the conventional learning curve is invoked. For the business-as-usual case, the conventional learning curve was used through the entire time horizon. In the program goal cases, the conventional learning curve was followed until 2020, at which point the program goal trajectory was applied to cost levels that had been achieved through the learning curve. Exhibit B-10 illustrates the interplay between the learning curve and the NETL R&D goal (Note: this is strictly an illustration, and not an actual example of what cost discounting will be).
0%
10%
20%
30%
40%
50%
60%
70%
80%
90%
20
19
20
20
20
21
20
22
20
23
20
24
20
25
20
26
20
27
20
28
20
29
20
30
20
31
20
32
20
33
20
34
20
35
Co
st r
ed
uct
ion
(%
)
Fixed Capture
Variable Capture
T, S & M
Fuel (Heat Rate)

EPEC Program Benefits Analysis
39
Exhibit B-10 Cost Savings Vectors: NEMS-CCUS Model vs. Standalone NETL R&D Goal
(Illustrative purposes only)
20
12
20
14
20
16
20
18
20
20
20
22
20
24
20
26
20
28
20
30
20
32
20
34
Sa
vin
gs
Co
eff
icie
nt
Model (learning curve +
program goals)
Specified
1.0

EPEC Program Benefits Analysis
40
Appendix C– Econometric Input-Output Model
An Econometric Input-Output (ECIO) model was used in this study that consists of a macroeconomic model of the US national economy and an inter-industry model that reflects the interdependence of all the industries in the economy. These two components have three modules and several sub-modules of interrelated equations for the whole US economy and 33 industrial sectors. The three modules are a macro econometric module, an industrial (input-output) module, and an employment module.
The ECIO uses the FairModel1 to estimate the national macroeconomic growth path, including various components of final demand. Aggregate final demand components are transformed to disaggregated industry-level final demands, and then drive the industry output module. Industrial output is estimated using Conway-type coupled estimation methods. Industrial output is used to estimate industrial employment and income. The new labor income from the industrial module and non-labor income from the FairModel are combined to create new levels of disposable income. A feedback loop connects the new income level back to consumption expenditure to close the model. Exhibit C-1 below depicts the linkage schema for solving the integrated ECIO model.
The model uses data from different data sources to construct the input-output and econometric components of the model. The FairModel uses quarterly data from 1952:1 through 2010:2 of 297 variables (162 endogenous and 135 exogenous variables) in 27 stochastic equations and 135 identities descriptive of the U.S. economy. The values of the 162 endogenous variables are determined within the FairModel. The data sources for the dataset used in the FairModel are from National Income and Product Accounts (NIPA), Flow of Funds Accounts, Bureau of Labor Statistics, Census Bureau, and the Board of Governors of the Federal Reserve.
From the FairModel, 14 GDP components are projected and serve as input to the industrial output module (IO component of the overall model). The final demand components comprise three consumption (durable, nondurable, and service), seven investment (three residential, three nonresidential, and inventory investment), three categories of government expenditures, and exports. This forecasted aggregate final demand time series is translated to industrial final demand using fixed share of industrial final demand of the base year (2008) as translator. The industrial output and the employment modules also use the following data:
• Benchmark 2002 and annual 2008 input-output data from the Bureau of Economic Analysis;
• Industrial output, value added, and employment data from Gross-Domestic-Product-by-Industry Accounts of the Bureau of Economic Analysis.
1 The “FairModel” is a macroeconomic model developed by Ray Fair that captures the interdependence and interaction of the six major sectors of the US economy: households (h), firms (b), financials (f), international (r), federal (g) and state and local governments (s). The key output of the model is the projection of the components of final demand that serve as input to the inter-industry model.

EPEC Program Benefits Analysis
41
Detailed case data were derived from the NEMS runs completed for this study. Tables C-1 and C-2 compare annual data of capital expenditures and value of services provided (used as output levels for the CCUS industry) which are the major components of the two cases. The difference between the two cases is $66.02 billion in capital expenditure and $175.81 in output value.
Exhibit C-1 Conway Type Solution Flow Chart for ECIO
StartTemporary Solution =
Solution t - 1
Consumption
Total FD
Benchmark IO Output (Z) Estimates
Output X = f(Z)
Employment and Labor Income Equations
Other FD from Fair Model
Non-labor income from Fair Model
Disposable Income
Consumption
New Solution = Temporary Solution?
Finished?
Yes
t = t+1StopYes No
Temporary Solution = New Solution
No

EPEC Program Benefits Analysis
42
Table C-1 Annual Capital Expenditure in Billions of Dollars: 2010-2035
Year
No Goal/CES Case Goal/CES Case
New Plants
Retrofit Pipeline Total New Plants
Retrofit Pipeline Total
2010 0.0 0.0 0.0 0.0 0.0 0.0 0.0 0.0
2011 0.0 0.0 0.0 0.0 0.0 0.0 0.0 0.0
2012 0.7 0.0 0.0 0.7 0.7 0.0 0.0 0.7
2013 2.0 0.0 0.0 2.0 2.0 0.0 0.0 2.0
2014 3.1 0.0 0.0 3.1 3.1 0.0 0.0 3.1
2015 2.4 0.0 0.0 2.4 2.4 0.0 0.0 2.4
2016 0.7 0.4 0.0 1.1 0.7 1.0 0.0 1.6
2017 0.0 2.0 0.0 2.0 0.0 3.9 0.0 3.9
2018 0.0 4.5 0.0 4.5 0.0 7.8 0.0 7.8
2019 0.0 6.2 0.0 6.2 0.0 10.1 0.0 10.1
2020 0.0 6.3 0.1 6.4 0.0 9.4 1.0 10.4
2021 0.0 6.4 0.6 7.0 0.0 9.1 1.6 10.7
2022 0.0 7.3 1.4 8.7 0.0 9.1 0.7 9.8
2023 0.0 7.6 0.8 8.3 0.0 8.9 0.6 9.6
2024 0.0 7.3 0.3 7.6 0.0 8.9 1.2 10.1
2025 0.0 6.8 1.0 7.8 0.5 9.7 0.6 10.8
2026 0.0 5.7 0.5 6.2 1.8 9.4 1.1 12.3
2027 0.0 4.8 0.8 5.7 3.7 9.1 0.8 13.6
2028 0.0 5.5 0.6 6.1 4.8 8.6 0.5 13.9
2029 0.5 5.7 0.7 6.9 5.2 8.0 1.1 14.3
2030 1.6 5.0 0.3 6.9 4.6 7.7 1.3 13.7
2031 3.1 4.4 1.3 8.7 3.3 7.7 0.7 11.7
2032 3.2 3.6 0.9 7.8 1.0 6.2 1.9 9.1
2033 1.9 2.2 0.9 4.9 0.0 4.0 1.2 5.1
2034 0.5 0.5 1.3 2.2 0.0 1.1 1.0 2.1
2035 0.0 0.0 0.7 0.7 0.0 0.0 1.2 1.2
Total 19.7 92.1 12.1 123.9 33.9 139.6 16.6 190.1
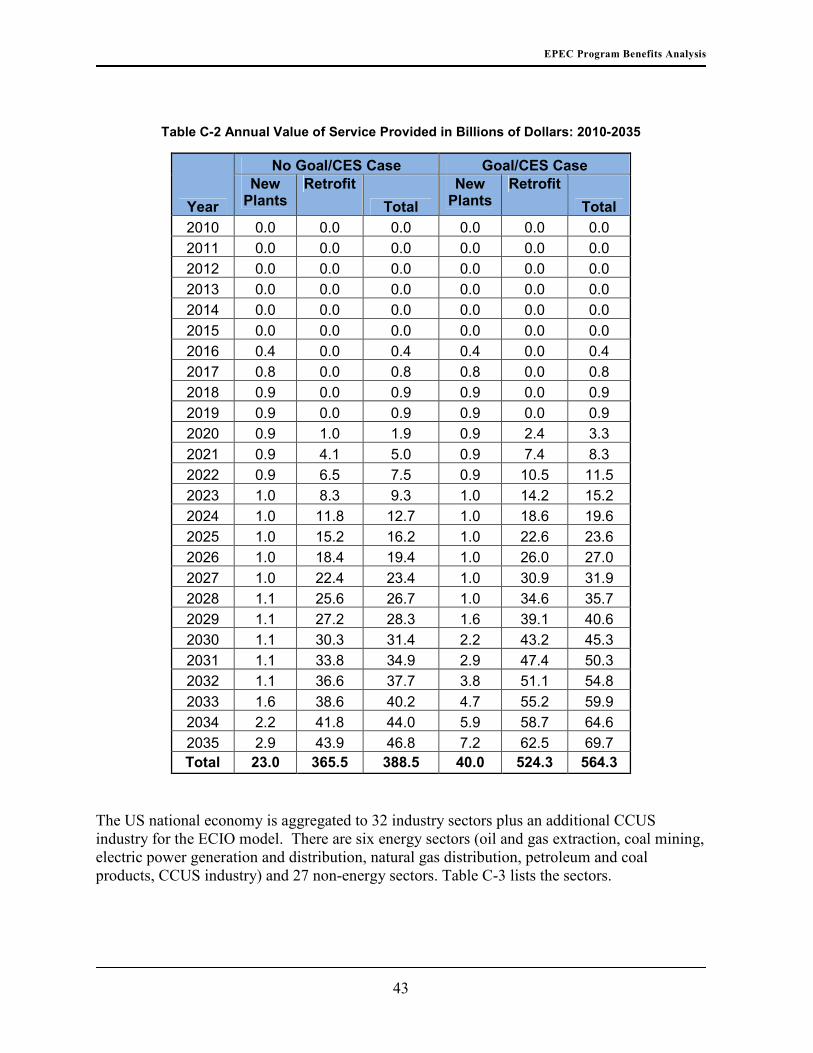
EPEC Program Benefits Analysis
43
Table C-2 Annual Value of Service Provided in Billions of Dollars: 2010-2035
Year
No Goal/CES Case Goal/CES Case New Plants
Retrofit
Total
New Plants
Retrofit
Total
2010 0.0 0.0 0.0 0.0 0.0 0.0
2011 0.0 0.0 0.0 0.0 0.0 0.0
2012 0.0 0.0 0.0 0.0 0.0 0.0
2013 0.0 0.0 0.0 0.0 0.0 0.0
2014 0.0 0.0 0.0 0.0 0.0 0.0
2015 0.0 0.0 0.0 0.0 0.0 0.0
2016 0.4 0.0 0.4 0.4 0.0 0.4
2017 0.8 0.0 0.8 0.8 0.0 0.8
2018 0.9 0.0 0.9 0.9 0.0 0.9
2019 0.9 0.0 0.9 0.9 0.0 0.9
2020 0.9 1.0 1.9 0.9 2.4 3.3
2021 0.9 4.1 5.0 0.9 7.4 8.3
2022 0.9 6.5 7.5 0.9 10.5 11.5
2023 1.0 8.3 9.3 1.0 14.2 15.2
2024 1.0 11.8 12.7 1.0 18.6 19.6
2025 1.0 15.2 16.2 1.0 22.6 23.6
2026 1.0 18.4 19.4 1.0 26.0 27.0
2027 1.0 22.4 23.4 1.0 30.9 31.9
2028 1.1 25.6 26.7 1.0 34.6 35.7
2029 1.1 27.2 28.3 1.6 39.1 40.6
2030 1.1 30.3 31.4 2.2 43.2 45.3
2031 1.1 33.8 34.9 2.9 47.4 50.3
2032 1.1 36.6 37.7 3.8 51.1 54.8
2033 1.6 38.6 40.2 4.7 55.2 59.9
2034 2.2 41.8 44.0 5.9 58.7 64.6
2035 2.9 43.9 46.8 7.2 62.5 69.7 Total 23.0 365.5 388.5 40.0 524.3 564.3
The US national economy is aggregated to 32 industry sectors plus an additional CCUS industry for the ECIO model. There are six energy sectors (oil and gas extraction, coal mining, electric power generation and distribution, natural gas distribution, petroleum and coal products, CCUS industry) and 27 non-energy sectors. Table C-3 lists the sectors.

EPEC Program Benefits Analysis
44
Table C-3 Industry Sectors
Code Sector Code Sector
INDIO01 Agriculture, forestry, fishing, and hunting
INDIO18 Retail trade
INDIO02 Oil and gas extraction INDIO19 Air, rail and water transportation
INDIO03 Coal mining INDIO20 Truck transportation
INDIO04 Mining, except coal, oil and gas
INDIO21 Pipeline transportation
INDIO05 Support activities for mining INDIO22 Transit and sightseeing transportation and transportation support services
INDIO06 Electric power generation and distribution
INDIO23 Warehousing and storage
INDIO07 Natural gas distribution INDIO24 Information
INDIO08 Water, sewage and other systems
INDIO25 Finance, insurance, real estate, rental, and leasing
INDIO09 construction INDIO26 Professional, scientific, and technical services
INDIO10 Primary and Fabricated metals
INDIO27 Management of companies and enterprises
INDIO11 Machinery INDIO28 Administrative and Support and Waste Management and Remediation Services
INDIO12 Motor vehicles and Other transportation equipment
INDIO29 Educational services, health care and social assistance
INDIO13 Other Durable Manufacturing
INDIO30 Arts, entertainment, recreation, accommodation, and food services
INDIO14 Other NonDurable Manufacturing
INDIO31 Other Services (except Public Administration)
INDIO15 Petroleum and coal products
INDIO32 Government and Non-NAICS
INDIO16 Chemical, Plastics and rubber products
INDIO33 CCUS Industry
INDIO17 Wholesale trade
The investment and operation of the CCUS technology impacts the overall economy by first directly impacting the relevant industry sectors. The direct expenditures incurred in construction and operation and maintenance (O&M) in deploying CCUS technology are matched to ECIO sectors. Table C-4 shows the sectors that are most substantially impacted directly during the construction and O&M phases of the new and retrofitted power plants. The construction of pipelines impacts more than half of the sectors with the biggest direct effect on other durable and nondurable manufacturing, and chemical, plastics and rubber products.
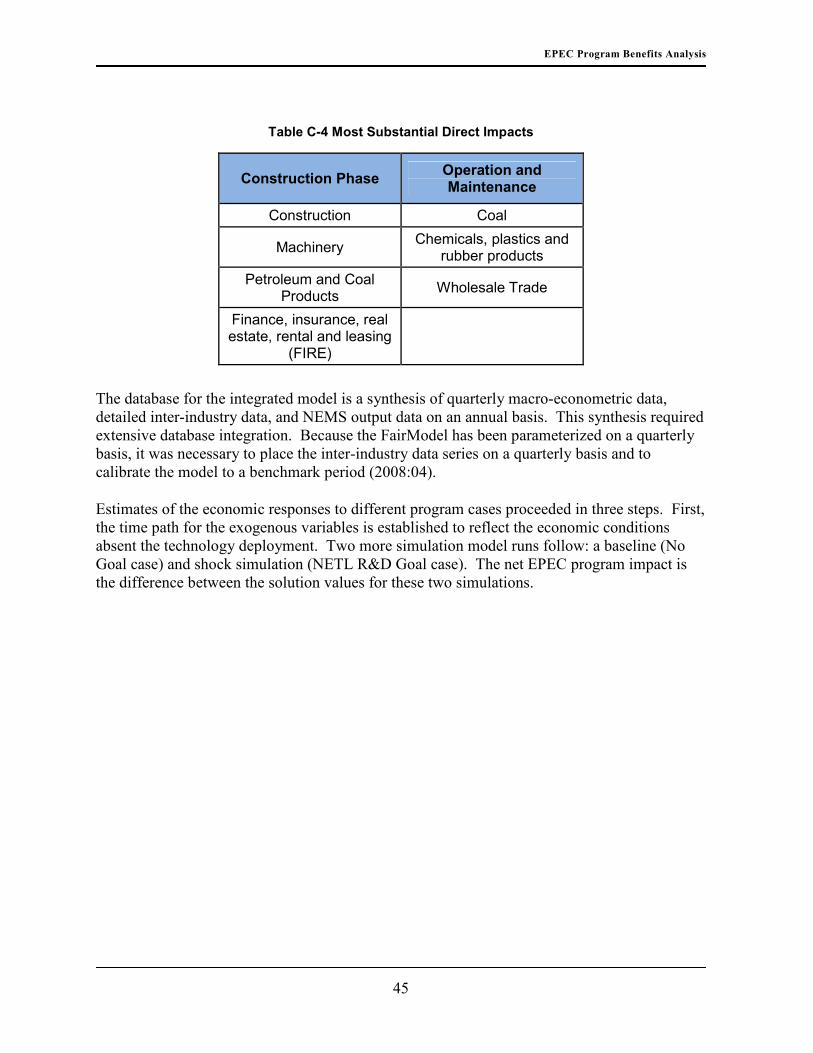
EPEC Program Benefits Analysis
45
Table C-4 Most Substantial Direct Impacts
Construction Phase Operation and Maintenance
Construction Coal
Machinery Chemicals, plastics and rubber products
Petroleum and Coal Products
Wholesale Trade
Finance, insurance, real estate, rental and leasing
(FIRE)
The database for the integrated model is a synthesis of quarterly macro-econometric data, detailed inter-industry data, and NEMS output data on an annual basis. This synthesis required extensive database integration. Because the FairModel has been parameterized on a quarterly basis, it was necessary to place the inter-industry data series on a quarterly basis and to calibrate the model to a benchmark period (2008:04).
Estimates of the economic responses to different program cases proceeded in three steps. First, the time path for the exogenous variables is established to reflect the economic conditions absent the technology deployment. Two more simulation model runs follow: a baseline (No Goal case) and shock simulation (NETL R&D Goal case). The net EPEC program impact is the difference between the solution values for these two simulations.

EPEC Program Benefits Analysis
46
References
Bureau of Economic Geology/Gulf Coast Carbon Center. (n.d.). Bureau of Economic Geology/Gulf Coast Carbon Center. Retrieved August 2010, from Bureau of Economic Geology/Gulf Coast Carbon Center: http://www.beg.utexas.edu/gccc/
Eccles, J. K. (2009). Physical and economic Potential of Geological CO2 Storage in Saline Aquifers. Environmental Science and Technology , 43 (6), 1962-1969.
Grant, Tim. (September 2010). National Energy Technology Laboratory (NETL). Porosity-Permeability Values_National_090110.xlsx. Pittsburgh, PA, USA: NETL.
Heddle, G., H. Herzog, and M. Klett. (2003). The Economics of CO2 Storage. Laboratory for Energy and the Environment, Massachusetts Institute of Technology. MIT LFEE 2003-03 RP.
Herzog, H. and H. Javedan. (January 2010). Development of a Carbon Management
Geographic Information System (GIS) for the United States; Final Report. Massachusetts Institute of Technology. NETL Contract DE-FC26-02NT41622.
Law, D. and S. Bachu. (1996). Hydrogeological and numerical analysis of CO2 disposal in deep aquifers in the Alberta sedimentary basin. Energy Convers. Mgmt. , 37:6-8, 1167-1174.
Law, D. and S. Bachu. (2009). Carbon management GIS: CO2 Injection Cost Modeling. Massachusetts Institute of Technology, Carbon Capture and Sequestration Technologies Program. Cambridge: Massachusetts Institute of Technology.
Massachusetts Institute of Technology (2009). Carbon Capture and Sequestration Technologies Program, “Carbon Management GIS: CO2 Injection Cost Modeling” for National Energy Technology Laboratory, U.S. Department of Energy, Contract DE-FC26-02NT41622.
McCollum, D. (2006). Techno-Economic Models for Carbon Dioxide Compression,
Transportation and Storage and Correlations for Estimating Carbon Dioxide Densisty and
Viscosity. University of California, Davis, Institute of Transportation Studies. Davis: University of California, Davis.
Parker, N. (2004). Using Natural Gas Transmission Pipeline Costs to Estimate Hydrogen Pipeline Costs. Institute of Transportation Studies, University of California, Davis, CA.
Tarka, T. J. and J. G. Wimer. (March 2010). Quality Guidelines for Energy Systems Studies: Estimating CO2 Transport, Storage & Monitoring Costs. Office of Systems Analysis & Planning, NETL. DOE/NETL-2010/1447.
True, Warren R. (1993). U.S. interstate pipelines begin 1993 on upbeat. Oil & Gas Journal; Nov 22, 1993; 91, 47; ABI/INFORM Global 43 – 66.

EPEC Program Benefits Analysis
47
True, Warren R. (1994). Current pipeline costs. Oil and Gas Journal; Nov 21, 1994; 92, 47;ABI/INFORM Global pg. 46-48.
True, Warren R. (1995). U.S. interstate pipelines ran more efficiently in 1994. Oil & Gas
Journal; Nov 27, 1995; 93, 48; ABI/INFORM Global pg. 39 – 58.
True, Warren R. (1996). U.S. pipelines continue gains into 1996. Oil & Gas Journal; Nov 25, 1996; 94, 48; ABI/INFORM Global pg. 39 – 58.
True, Warren R. (1997). Construction plans jump; operations skid in 1996. Oil & Gas
Journal; Aug 4, 1997; 95, 31; ABI/INFORM Global pg. 33 – 55.
True, Warren R. (1999). U.S. pipelines experience another tight year, reflect merger frenzy. Oil & Gas Journal; Aug 23, 1999; 97, 34; ABI/INFORM Global pg. 45 – 69.
True, Warren R. (2000). More construction , higher costs in store for U.S. pipelines. Oil & Gas
Journal; Sep 4, 2000; 98, 36; ABI/INFORM Global pg. 68 – 88.
True, Warren R. (2001). Profitable 2000, higher demand push U.S. natural gas construction plans. Oil & Gas Journal; Sep 3, 2001; 99, 36; ABI/INFORM Global pg. 66 – 85.
True, Warren R. (2002). Fed data show solid 2001 for US pipeline companies, more gas capacity planned. Oil & Gas Journal; Sep 16, 2002; 100, 38; ABI/INFORM Global pg. 52 – 75.
True, Warren R. (2003). US pipeline companies solidly profitable in 2002, scale back construction plans. Oil & Gas Journal; Sep 8, 2003; 101, 34; ABI/INFORM Global pg. 60 – 90.
U.S. Energy Information Administration (EIA). (2000). Carbon Dioxide Emissions from the Generation of Electric Power in the United States. Retrieved on September 15, 2011, from http://205.254.135.24/cneaf/electricity/page/co2_report/co2report.html


