A CASE STUDY OF THE ISO13567 CAD LAYERING STANDARD FOR AUTOMATED QUANTITY MEASUREMENT IN HONG KONG SUBMITTED: September 2003 REVISED: January 2004 PUBLISHED: February 2004 at http://www.itcon.org/2004/1/ EDITOR: B.-C. Björk Tao-chiu Kenny Tse, PhD Candidate and Demonstrator, Dept of Building and Real Estate, The Hong Kong Polytechnic University email: [email protected]Kam-din Andy Wong, Associate Professor, Dept of Building and Real Estate, The Hong Kong Polytechnic University email: [email protected]SUMMARY: Computer-Aided Design (CAD) is widely utilized in the Hong Kong construction industry. However, quantity surveyors and contractors are still extracting material quantities manually from paper drawings. This process is often criticized as mechanical, labour-intensive and time-consuming. On the other hand, it is the most reliable method as the existing automated methodologies cannot be effectively and efficiently applied under the manifold CAD drafting standards. To alleviate the problem, this research proposes an automated solution that adopts the ISO13567 CAD drafting standard. The system has been tested in an air cargo terminal project in Hong Kong. The results indicate that the proposed solution is on average 10 times faster than the manual approach. It achieves a measurement accuracy of up to 99% for a correctly structured CAD drawing. Nevertheless, there are barriers that undermine the results and hence the use of the system in practice. The outcomes of this research have been presented to the Construction Industry Review Committee of the Hong Kong Government. Following a consultation study commissioned by the Government, a local CAD drafting standard called the CAD Standard for Works Projects (CWSP) was launched in September 2002. As enforced by the corresponding contract provisions, project parties to public works contracts are now sticking to CSWP, and thus practical use can be made of the proposed system after the necessary modifications have been made. KEYWORDS: CAD drawings, ISO 13567, Measurement 1. INTRODUCTION In the 1970s, advances in computing hardware created several breakthroughs, including the introduction of a Graphical User Interface that displays graphical entities on screen. This new feature, together with fairly large and expensive computers, formed the prime platform on which the idea of Computer-Aided Design (CAD) was invented (Li 1995). In addition to design and drafting, several authors also predicted that the advent of CAD would lead to the automatic generation of bills of quantities (Rycroft 1980, Campion 1980, Cox 1983, Brandon 1983 and Wexler 1986). In 1986, Reading University was commissioned by the Royal Institution of Chartered Surveyors to undertake a study into CAD opportunities for quantity surveying (McGeorge 1989). This further strengthened the possibility of computerized quantity measurements based on CAD drawings. In line with the dramatic growth of information technology in the 1990s, there has been a continuing enhancement of CAD systems. Several quantity take-off systems have also launched from time to time (Hemmett 1984, Kelly 1991, Bentley 1997, Elstree 1997, CICA 1998). Although CAD systems are now essential software applications in the construction industry, the application of computerized quantity measurement systems is rare in quantity surveying in Hong Kong. As observed, consultants and contractors still rely on manual measurements though even they are under increasing pressure to measure the quantities for lower fees and under tighter schedules. This breaks the seamless computerized workflow from CAD drafting, through measurement, to the automatic generation of bills of quantities. ITcon Vol. 9 (2004); Tse and Wong, pg. 1
Transcript
A CASE STUDY OF THE ISO13567 CAD LAYERING STANDARD FOR AUTOMATED QUANTITY MEASUREMENT IN HONG KONG
SUBMITTED: September 2003 REVISED: January 2004 PUBLISHED: February 2004 at http://www.itcon.org/2004/1/ EDITOR: B.-C. Björk
Tao-chiu Kenny Tse, PhD Candidate and Demonstrator, Dept of Building and Real Estate, The Hong Kong Polytechnic University email: [email protected]
Kam-din Andy Wong, Associate Professor, Dept of Building and Real Estate, The Hong Kong Polytechnic University email: [email protected]
SUMMARY: Computer-Aided Design (CAD) is widely utilized in the Hong Kong construction industry. However, quantity surveyors and contractors are still extracting material quantities manually from paper drawings. This process is often criticized as mechanical, labour-intensive and time-consuming. On the other hand, it is the most reliable method as the existing automated methodologies cannot be effectively and efficiently applied under the manifold CAD drafting standards. To alleviate the problem, this research proposes an automated solution that adopts the ISO13567 CAD drafting standard. The system has been tested in an air cargo terminal project in Hong Kong. The results indicate that the proposed solution is on average 10 times faster than the manual approach. It achieves a measurement accuracy of up to 99% for a correctly structured CAD drawing. Nevertheless, there are barriers that undermine the results and hence the use of the system in practice. The outcomes of this research have been presented to the Construction Industry Review Committee of the Hong Kong Government. Following a consultation study commissioned by the Government, a local CAD drafting standard called the CAD Standard for Works Projects (CWSP) was launched in September 2002. As enforced by the corresponding contract provisions, project parties to public works contracts are now sticking to CSWP, and thus practical use can be made of the proposed system after the necessary modifications have been made.
KEYWORDS: CAD drawings, ISO 13567, Measurement
1. INTRODUCTION In the 1970s, advances in computing hardware created several breakthroughs, including the introduction of a Graphical User Interface that displays graphical entities on screen. This new feature, together with fairly large and expensive computers, formed the prime platform on which the idea of Computer-Aided Design (CAD) was invented (Li 1995). In addition to design and drafting, several authors also predicted that the advent of CAD would lead to the automatic generation of bills of quantities (Rycroft 1980, Campion 1980, Cox 1983, Brandon 1983 and Wexler 1986). In 1986, Reading University was commissioned by the Royal Institution of Chartered Surveyors to undertake a study into CAD opportunities for quantity surveying (McGeorge 1989). This further strengthened the possibility of computerized quantity measurements based on CAD drawings. In line with the dramatic growth of information technology in the 1990s, there has been a continuing enhancement of CAD systems. Several quantity take-off systems have also launched from time to time (Hemmett 1984, Kelly 1991, Bentley 1997, Elstree 1997, CICA 1998). Although CAD systems are now essential software applications in the construction industry, the application of computerized quantity measurement systems is rare in quantity surveying in Hong Kong. As observed, consultants and contractors still rely on manual measurements though even they are under increasing pressure to measure the quantities for lower fees and under tighter schedules. This breaks the seamless computerized workflow from CAD drafting, through measurement, to the automatic generation of bills of quantities.
ITcon Vol. 9 (2004); Tse and Wong, pg. 1
2. OBJECTIVES AND METHODOLOGY Under a Teaching Company Scheme between the Department of Building and Real Estate of The Hong Kong Polytechnic University and Chubb Hong Kong Limited (Fire Engineering Division), this research aimed to identify the technical problems of various computerized quantity measurement systems and develop a fully automated measurement system that can measure quantities of building services elements directly from CAD drawings. Problems other than technical, such as financial and administration difficulties, are not within the scope of research although they do constitute obstacles in spreading use of automated quantity measurement. It is also worth mentioning that two-dimensional (2D) CAD drafting is commonly adopted in plans, elevations and sections in Hong Kong. This imposes a physical limitation on the measuring of non-linear elements (e.g., the volume of walls on a plan) and elements that do not physically exist in CAD database (e.g., the length of a vertical pipe on a plan). Therefore, the proposed model excludes the measurement of these elements. However, the possibility of extending the underlying techniques to cover this area will be discussed at the end of the paper. The Teaching Company, Chubb Hong Kong Limited, provided real-life project information including CAD drawings and bills of quantities for the development of the system. The proposed system was then evaluated in terms of time and quality in an air cargo project, ‘HACTL SuperTerminal 1’, located at the Hong Kong’s Chek Lap Kok Airport. Restrictions on the implementation of the system and recommendations for improvement are identified and formulated respectively.
3. AUTOMATED MEASUREMENT MODELS 3.1 Object-Based Measurement Models One of the earliest attempts in automated measurement can be traced back to the simple object-based CAD model for the Scottish Special Housing Association Project developed by Edinburgh University in the late 1970’s (Alexander & Fletcher 1979). Under this model, drawings are input by selecting standard components/objects, e.g., windows, doors, staircases, external walls, etc, which have attributes such as length, width and height. Based on the lists of components built earlier into the CAD system, the quantities can be sent to a data processing bill program for the manipulation and production of bills of quantities. However, Alexander and Fletcher (1979) pointed out that the architecture is highly restricted due to the limited number of standard components. If an architect wants to alter a design, the easiest way is by means of manual variations. Therefore, the system is only suitable for simple, standard houses. Besides, this approach only generates quantities for standard components that may incorporate many detailed sub-components. Thus, it is not detailed and accurate enough to represent the contents of the work in the drawings. As a result, quantity surveyors must adjust and break down the quantities during the final process of producing the bill. Although there has been a move towards more sophisticated object-based CAD systems such as MicroStation’s Triformer and Autodesk’s Architecture Desktop that have a quantity take-off function, these systems cannot cater to the common practice of using non-object based AutoCAD drawings.
3.2 Digitized Measurement Models As an alternative to the object-based model, many UK software houses have launched digitized measurement models such as CATOPro, Digico, Digipen, Manifest, Open House, QS Elite, Q-Script, Techsonix, Wessex Take Off, and so forth (CICA 1998). In these models, drawings are produced using general drafting commands rather than a list of standard components. Hence, the freedom to design and draft are not diminished. The quantities are taken off by tracing over the elements on the printouts via the programmed digitizers. The computer will then make a calculation, e.g. the length of a pipe from its start point to its end point, and store the quantity. In other words, digitizers replace the scale rulers and computers perform the calculations. But the digitized measurement models also have certain drawbacks. First, they duplicate the effort of inputting the design information into the CAD system during the processes of design and measurement. Second, both CAD and paper drawings for measurement, e.g. plans, elevations and sections, are physically two-dimensional (as are the points digitized into the system). This differs from object-based models in which three-dimensional information can be incorporated into the objects. Thus, quantity surveyors are still required to interpret the third dimension manually, and then input it into the system during the digitizing process. The multiple effect is that the digitizing process is often criticized as taking even longer than the traditional manual approach.
ITcon Vol. 9 (2004); Tse and Wong, pg. 2
3.3 Automated Measurement Model Elstree Computing Limited (UK) already rounded its billing package off with direct links to AutoCAD, via a new automated measurement package, namely CADMeasure (Elstree 1997). Instead of duplicating the input of object locations via the digitizers, this automated model makes direct use of the original electronic CAD files for measurement (Walker 1996). The rationale behind the files is that different kinds of elements in the drawings, e.g. reinforced concrete walls, windows, doors, fire services, sanitary fittings, etc., can be commonly structured in CAD format in terms of layers, colours, linetypes and so on, that can be fully coded in order to represent the descriptions of the elements. This technique replaces the function of a digitizer to answer the questions of ‘where’ and ‘what’, and hence the quantities can be quickly and directly extracted. Due to the limitation of 2D CAD drafting, users are still required to manually input the third dimensions (e.g., the height of a pile cap on a 2D plan). Even for 2D items, the whole CAD drawing must be well defined and structured; i.e., identical CAD building objects must be on the same layers, and have the same colours and/or linetypes. Since most of the CAD systems allow individual draftsmen to define CAD layers by whatever structures and names desired, draftsmen always encounter difficulties in using drawings created by others. As stated by Li (1996), ‘The layer names set in the drawing may be meaningless or hard to understand. Although many well-established companies have created their own in-house CAD standards, exchanges of CAD data between various disciplines in a project does occur and is necessary. Under this circumstance, many script files have to be written since a script file can only deal with one standard. It is technically possible but not convenient to write and maintain too many script files. More importantly, the writing of script files usually requires the technical involvement of software houses. This means that users have to pay long-term running costs. These limitations are the reason why this model has not been widely adopted in Hong Kong, but it is still a valuable piece of software for the production of building services bills where over 75% of the items are shown and measured 2D (Tse & Wong 1998), provided that a common CAD drafting standard is adopted in the construction industry.
4. ISO13567 CAD LAYERING STANDARD A consistent CAD drafting standard benefits not only automated measurement but also a number of applications. Björk et al. (1997) states that a common CAD standard ‘… will in fact facilitate the migration to new technologies like product modelling’. As added by Li (1995), it would also aid the development of international multi-media CAD conferencing, artificial intelligence design and drafting and integrated architectural /engineering /construction designs and built systems. The International Alliance for Interoperability (IAI) appreciates that certain types of information technology, including CAD measurements, have not been widely implemented in the construction industry. The main reason is ‘.... due to the lack of existing standards for allowing software tools to share information’ (IAI 1997). As a consequence of this, the International Organization for Standardization proposed an International Standard ISO 13567 in September 1996 (Björk et al. 1997). According to the working group ISO/TC10/SC8/WG13, the scope of ISO 13567 is ‘... to establish the general principles of layer structuring within CAD files ... for the purpose of controlling visibility and managing and communicating CAD file data ....’ and to ‘... cover the organization of layers as applied to construction projects’ (Björk et al. 1997). The name of the layer is divided into ten fields, each with a fixed number of alphanumeric characters. The first three fields are mandatory, and the remaining fields are optional (FIG. 1).
A B C D E F G H I J Fields (refer to notes) S F 5 8 2 1 A A E - N I - - - 1 3 C 2 3 U S E R Codes
Mandatory Optional Notes: A - Agent B - Element C - Presentation D - Status E - Sector F- Phase G - Project H - Scale I - Work package J - User define FIG. 1: Layer naming structure of ISO13567
Among various fields in ISO 13567, the mandatory ELEMENT field plays a significant role for automated measurement models like CADMeasure. The six-faceted syntax is long enough to break down building services elements in adequate detail. The standard stipulates the use of reserved codes for the presentation and status fields. Although there are no reserved codes for the other fields, existing coding tables/classification systems are
ITcon Vol. 9 (2004); Tse and Wong, pg. 3
encouraged to be used where appropriate. To facilitate the compilation of an ISO13567-compatible layer name, a layer management interface was tailor-made for an architectural, structural and planning consulting company according to the experiences from a Swedish pilot implementation. Details of this international standard as well as the pilot implementation experiences have been described by Björk et al. (1997).
5. PROPOSED AUTOMATED MEASUREMENT SYSTEM With the introduction of ISO13567 to CAD drafting and the automated measurement model, it is possible to achieve the seamless extraction of quantities directly from CAD drawings. To start with, the proposed model was initially developed for measuring quantities of building services. It aims to resolve the limitations of the automated measurement models as described in section 3.3. The concept of defining measurable components in AutoCAD is two-fold. First of all, the component classes (according to a specific building classification system) are structured in term of CAD layers. The fragmented CAD entities representing the components should be drawn on the right layers. Since it is common to use “Block” to define symbols such as fire hydrants and sprinkler heads, they should also be inserted in the corresponding layers. Thus, the system also makes use of the concept of object-based measurement to identify and count the number of blocks. As depicted in FIG. 2, it consists of a Layer Management Prototype (LAMP), a Block Insertion Prototype (BIP) and a Computer-Aided Measurement Prototype (CAMP).
Design
Idea
n
FIG. 2: Workflow of the proposed auto
5.1 Layer Management PrototSimilar to the Swedish pilot implemenrequired ISO13567 standard. By typin(LMD) is called up on top of the Automanagement dialogue. Therefore, it is FIG. 3). Excluding the ‘New’ and ‘Rencurrent, on/off, thaw/freeze and unlockLMD. By clicking on the ‘New’ or ‘ReDialogue (LCRD). The theoretical framIn line with the Hong Kong Standard Mapplication deploys the ‘sector’ field toplant room. The ‘status’ field is also deadopted for the sake of simplicity. Theboxes. Each list box contains the correrooted in CIB/Sfb Table 1. To preventboxes are opened up one by one, proviboxes. The selection of an item calls oname facet(s) in LCRD. There is anothone quoted in brackets) following the Ithe ‘OK’ button is chosen, the new layLMD’s layer list box. The coding tableAppendix C.
ITcon Vol. 9 (2004); Tse and Wong, pg. 4
AutoCAD
Draftsma
Operated within AutoCAD
m
yptatg ‘CAeaa/lnaee
spl sisp illden aerSOers
LAMP
a
eiolaD
symocm
wtheoxood s s
nfo
BIP
ted measurement model
(LAMP) n, LAMP is designed for drafting CADmp’ in the command window, LAMP’s. The layout of this dialogue is based o for AutoCAD users to become familia
e’ buttons, changing existing or settingk), colours and linetypes invokes the sae’ button, the system opens up LAMP
ork of ISO 13567 is transformed to thisod of Measurement for Building Servic
parate the elements of building servicesyed in order to identify the variations. T-faceted ELEMENT field is representednding element subsets under the proposgical groupings of the hierarchical data that an item other than ‘General’ is choub-routine to display its associated codub-routine that compiles an abbreviated 13567 layer name. Once a required layame together with the element descriptir the element, agent and sector fields ar
CAMP
StandardizedElectronic Drawing
r t
’
e
e,
e
eo
Paper Drawing
drawings that ad Layer Managemn the original Au with LAMP’s Lhe status of newme functions as s Layer Creating interactive dialos (HKIS 1993),
internally, externhe other optiona by the same numd classification, the second to thesen in their prece to the correspon
element descripr is created or ren is transferred
e attached in App
ElementalQuantity
here to the ent Dialogue toCAD layer-MD (see layers (i.e., in the original /Renaming gue format. the ally or in a l fields are not ber of list
which is sixth list ding list ding layer
tion (i.e., the named and back to endix A to
Default AutoCAD layer indicator LAMP function icon
FIG. 3: Working screens of the Layer Management Prototype (LAMP)
ITcon Vol. 9 (2004); Tse and Wong, pg. 5
5.2 Block Insertion Prototype (BIP) With the default functions of AutoCAD, an existing block is inserted into a drawing using the ‘INSERT’ command. The name of the block must be typed manually either via the command window or the text box. If element codes are used as the names of blocks, users may need to check the codes from a manual (e.g., ball float valve = ‘58*3A-’) before inserting it. This is rather more inefficient than just typing ‘ballfloatvalve’ or similar words that are more accessible to users. To alleviate this problem, the Image Tile Menu of AutoCAD (Autodesk 1998) was adopted as the basis for the evolution of a Block Insert Prototype (BIP) (see FIG.4). When the BIP function icon is selected or the command ‘BIP’ is input in the command window, the Main Menu Dialogue (MMD) is activated. Under the proposed fire services element classification, fittings and equipment are categorized according to systems and types. MMD displays these categories in the image icons, along with a list box on the right containing the associated category codes. Clicking on a category will highlight its code, and vice versa. As mentioned, a block should be inserted to a layer in which it belongs to. For instance, a gate valve in the sprinkler system should be inserted to layer 582---. The gate valve code (58*3F-) is the block name and it is not necessary to create this layer. The block names/codes are defined provisionally for testing the system and would be redefined before embedding similar elements in other building services systems. When a category in the main menu dialogue is highlighted, double clicking it or choosing the ‘OK’ button opens up its sub-menu. Although main menu and sub-menus use the same dialogue framework provided by AutoCAD, the contents and actions of the image icons are somehow different. With the exception of the upper-right image icon that allows for returning back to MMD, other icons contain the block images together with brief descriptions. When a block is highlighted, double clicking it or choosing the ‘OK’ button closes all BIP dialogues and automatically invokes the default AutoCAD ‘INSERT’ command. With BIP, blocks can be easily inserted without knowing and typing the element codes. In this example, there are more than twenty blocks in the group general pipework equipment. They can be browsed with the ‘Next’ and ‘Previous’ buttons or using the scroll bar in the list box.
Left: Select a “Block” category.
Right: Select a block.
FIG. 4: Working screens of the Block Insertion Prototype (BIP)
ITcon Vol. 9 (2004); Tse and Wong, pg. 6
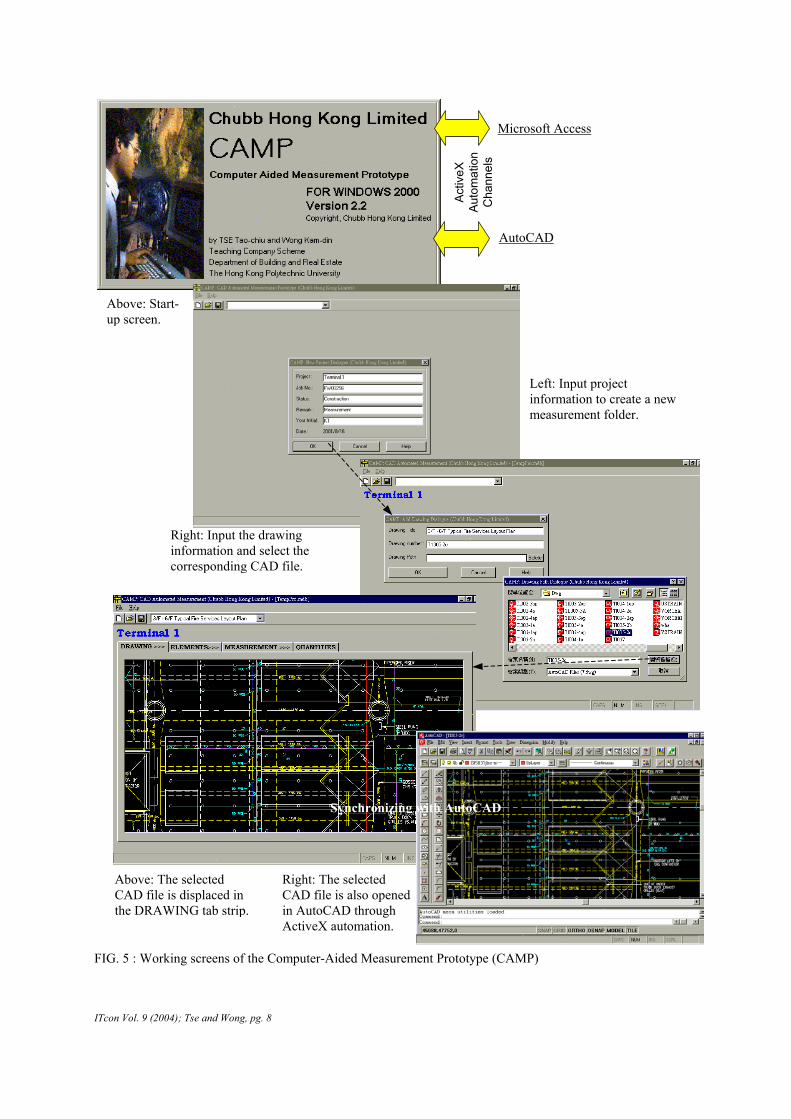
5.3 Computer-Aided Measurement Prototype (CAMP) The Computer-Aided Measurement Prototype (CAMP) is a stand-alone piece of software that carries out automatic measurements (FIG. 5 & FIG. 6). Once CAMP is opened up, a drawing from an existing project should then be selected for measurement. The selected drawing is opened in the DRAWING Tab Strip as well as in AutoCAD. This allows the users to check whether the drawing is the correct one. If so, then the users should move on to select the elements that need to be measured in the ELEMENTS Tab Strip. The selection methodology is exactly the same as creating layers with the Layer Control/Renaming Dialogue. CAMP measures all of the items contained in a particular element hierarchy. For example, by choosing ‘582---’ (Mechanical services>Fire services> Sprinkler system), CAMP will measure all of the pipework, fittings and equipment of a fire services system. The scope of the measurement can be limited (specified forward) or expanded (specified backward). Forward-specification has the merit of speeding up the automation process, since CAMP searches for each defined element in a drawing. The Agent, Presentation, Status and Sector fields are considered as the secondary searching criteria, provided that they are observed when inputting the drawing.
When an element group is selected, the measurement parameters are shown in the MEASUREMENT tab strip. The ‘CAD Links’ table tabulates CAMP’s taking off parameters for those elements selected in AutoCAD. These include the ‘Entity type’ associated with the prescribed ‘Layer name’ and ‘Block name’. In addition, CAMP does provide optional ‘Colour’, ‘Linetype’ and ‘Linetypescale’ parameters to be incorporated in a measurement. Since unit rates and units are both essential parts along with element descriptions and quantities in bills of quantities, they are also included in the table connected with an access database. That means the measurement parameters as well as the unit rates can be set or modified in that database. The total amount of those selected elements can be automatically calculated if the rates have been input. The default values are shown when an element group is selected in the ITEM tab strip, but users can change the values to suit particular needs. The table can be browsed using the scroll bars or the ‘Browse’ buttons. In addition to the table, a graphical presentation is also attached for each element. It is changed along with the highlighted row in the table. The searching parameters, together with the graphical presentations, provide not only flexibility but also security for the users about what will be measured in an AutoCAD drawing. The measurement area can be set to either ‘All’ or ‘Window’. By default, ‘All’ is selected, and the ‘Pick’ button and the four ‘X’, ‘Y’ coordinate text boxes are disabled. They are enabled only if ‘window’ is selected. A window area can be supplied by directly inputting the ‘X’, ‘Y’ coordinates of the first and second corners in a drawing. Alternatively, clicking the ‘Pick’ button automatically switches CAMP to AutoCAD. The command window of AutoCAD prompts for the picking of the two corners. Once the corners are picked, the command window switches back to CAMP. The coordinates then appear in the corresponding text boxes. The area of measurement is also calculated based on these coordinates. Measurements are actually ready to be made when the MEASUREMENT tab is turned on, provided that all default settings are appropriate for a measurement. This is done by choosing the ‘Start Measurement’ button. A new table with the same name as the drawing number is first created in ‘TempPro.mdb’ for storing and saving the measurement results. A layer named ‘measurement’ is also created in the opened AutoCAD drawing. The two sets of coordinates are then imported to the measurement program if ‘Window’ is selected. After that, the program reads the required measurement parameters from each of the rows on the table. Meanwhile, the progress is shown in the status bar. All measured elements are copied to the ‘measurement’ layer for the purpose of checking.
Once a measurement routine for an element is completed, the total quantity, along with the element code, description, unit and unit rate are appended to the measurement result table in ‘TempPro.mdb’. The amount for that element is automatically calculated. For simple access, this table is embedded in the QUANTITIES tab strip. With respect to the scope of this research, it is not intended to include many database management functions in CAMP. Therefore, the table is in the form of a snap-shot (read-only). Nevertheless, it can also be manipulated from within Microsoft Access by clicking the ‘Edit’ button. The process of measuring other drawings is the same as described. Each measured drawing has its own quantity table in ‘TempPro.mdb’. This temporary new project file can be saved and subsequently opened in CAMP.
ITcon Vol. 9 (2004); Tse and Wong, pg. 7
Microsoft Access
Activ
eX
Auto
mat
ion
Cha
nnel
s
Above: Start-up screen.
Right: The selected
in AutoCAD through ActiveX automation.
CAD file is also opened
FIG. 5 : Working screens of the Computer-Aided Measurement Prototype
ITcon Vol. 9 (2004); Tse and Wong, pg. 8
AutoCAD
Left: Input project information to create a new measurement folder.
Synchronizing with AutoCAD
Right: Input the drawing information and select the corresponding CAD file.
Above: The selected CAD file is displaced in
p.the DRAWING tab stri
(CAMP)
Right: Review the CAD Links of the selected elements and set the measurement area.
FIG. 6 : Working screens of the Computer-Aided Measurement Prototype (CA
ITcon Vol. 9 (2004); Tse and Wong, pg. 9
Left: Select theelements for measurement.
Left: The QUANTITIES tab
elements in a bill of quantity format.
strip displays the measured
MP) (Cont’d)
6. EVALUATING THE SYSTEM
The evaluation of the proposed system was conducted at Chubb’s site office at HACTL SuperTerminal 1. Two experienced on-site CAD draftsmen were responsible for the production of working and as-fit drawings. LAMP and BIP were installed in the two draftsmen’s computers (Stations A and B) for CAD drafting and standardization. CAMP was separately installed in an additional computer (Station C) with AutoCAD and MicroSoft Access. Since most of the CAD drawings were over 1.44 M bytes, file transmission from Stations A and B to Station C relied on ‘Direct Cable Connections’ and a switch box between them (see FIG. 7).
The SuperTerminal has a basement (Level –1), a ground floor (Level 0) and seven typical floors (Levels 1 – 7). Due to the large plan area, the design consultant initially divided a floor into three CAD drawings (zones 1, 2 and 3) with a paper size of ‘A0’ and in the scale of 1:200. Chubb’s draftsmen further divided and scaled them up to four ‘A1’ drawings in 1:100 for construction purposes. As a result, there were 108 CAD fire services layout plans (9 floors x 3 zones x 4 sheets). All of these drawings were initially drawn in accordance with a consultant’s layer naming and structuring standard. Level –1 is a plant basement that has a number of plant rooms connected by a services tunnel. Level 0 is the ground floor. Level 1 to Level 7 are typical floors, each of which have similar fire services installations. In comparison, a typical floor has approximately five times more fire service elements than the basement floor.
The evaluation focused on the overall performance of the system in terms of time and quality as compared to the manual approach. In order to investigate the effect of drawing complexity on the proposed system, the simplest drawing (Level –1) and the most complicated drawing (Level 3) were selected as the test samples. Switch A/B
Drawings Drawings Bill of Quantities FIG. 7: System configuration of the proposed system at the site office of HACTL SuperTerminal 1
6.1 Speed The durations of measurement based on the manual approach and the proposed system were recorded on site. Manual measurement time is defined as the net time (excluding any breaks) of manual measurement, whereas CAMP measurement time indicates the actual time including loading software, making measurements and printing the quantities. Since CAD drawings must be input in compliance with the proposed ISO 13567 adaptation, the CAMP measurement time also includes the extra time involved in standardizing the drawings using LAMP and BIP.
The result for less complicated drawings (Level –1) ranged from 15 minutes to 27 minutes (averaging 21 minutes, see FIG. 8). On the other hand, CAMP consistently finished the measurement in 5 minutes. Thus, CAMP was 4.2 times (21/5) faster than the manual approach. When tackling more complicated drawings in Level ‘3’, the manual measurement time ranged from 67 minutes to 118 minutes (averaging 86 minutes). By contrast, CAMP only required 6 minutes. Hence, CAMP was 14.3 times (86/6) faster than the manual approach. The results indicate that the greater the complexity of the drawing, the more time was saved by CAMP. However, the extra CAD drawing standardization time should not be overlooked prior to using CAMP. For each
ITcon Vol. 9 (2004); Tse and Wong, pg. 10
fire services layout plan, the CAD drawing structuring time ranged from 32 minutes to 52 minutes (averaging 41 minutes) in Level ‘-1’, and from 128 minutes to 153 minutes (averaging 137 minutes) in Level ‘3’. As a result, the overall efficiency of the whole automated methodology was lower than the manual approach by 46% (21/(5+41)) in Level ‘-1’ and 60% (86/(6+137)) in Level ‘3’.
According to the draftsmen, the extra drafting time was mainly spent on structuring pipework; i.e., each pipe size must be on separate layers for measurement. In their traditional drafting practice, only one ‘LINE’ (one pair of start point and end point) entity is used, no matter whether the whole pipeline has one or several pipe sizes and grades. If five different sizes are to be separated in a pipeline, an extra four pairs of start points and end points should be input. Besides, extra time is required to change the pipe layers. This problem mainly occurs in sprinkler systems where pipework drafting is extensive. In other words, a meaningful application of CAMP relies purely on ‘structured drawings’. Due to the restructuring process, the current overall operation time of the proposed system is more or less the same as that using the manual approach.
Case 1: Less complicated drawings (Level -1)
521
41
0
5
10
15
20
25
30
35
40
45
50
Manual Method Proposed Automated Method
Min
utes LAMP+BIP
CAMP
Case 2: More complicated drawings (Level 3)
86
6
137
0
20
40
60
80
100
120
140
160
Manual Method Proposed Automated Method
Min
utes LAMP+BIP
CAMP
FIG. 8: Comparison of measurement durations between the manual method and the proposed system
6.2 Accuracy The accuracy of the proposed system was measured by comparing the measured quantities to the actual quantities. Since the quantities measured by the manual approach may contain errors, they cannot represent the actual quantities. In this connection, the two draftsmen were carefully briefed with a special measurement task. Each of them took off the numbers of pipework fittings one by one and measured the lengths of the pipework with the aid of AutoCAD’s ‘Distance’ function. The results generated by them were counter-checked, and further measurement and checking was carried out until the discrepancies were cleared.
As shown in Table 1, the overall measurement accuracy of CAMP for pipework in level ‘-1’ is more than 99% (–0.12%) compared to the target quantities. The errors occurring in the 32 mm pipe group (-1.83%) and 40mm pipe group (+1.10%) were due to incorrect layering and/or the unmeasured gaps inside the sprinkler heads, as the target quantities denote the overall length including associated fittings, according to the Hong Kong Standard Method of Measurement for Building Services. In other pipe groups, positive or negative measurements were only due to incorrect layering. By contrast, the manual approach produces an overall measurement accuracy of 82% (+17.55%). Unlike CAMP, the result in every pipe group is on the positive side. The same phenomenon also occurred in Level ‘3’. According to the estimators, they usually over-measure pipework in order to offset the risks of their estimations. But the results indicate that this strategy is somewhat conservative. From the perspective of quantity surveying, building quantities in the same set of tender drawings should be constant among tenderers. With other bidding elements (rates, preliminary, attendance, etc.) being equal, a higher accuracy of measurement would increase the possibility of a tender award, in these cases where tenderers do their own measurement. Although the CAMP’s measurement accuracy was excellent in Level ‘-1’, it dropped to 97% (-3.12%) in Level ‘3’. In particular, the deviation from the benchmarks (column) in the 32 mm pipe group increased to -21.86%. Since sprinkler heads in Level ‘3’ were some five times more numerous than in Level ‘-1’, the quantities of 32 mm pipes increased in a similar scale. Hence, errors due to missing sprinkler gaps should not be the main cause for this high deviation. An in-depth analysis of the CAD drawings was carried out. It was revealed that four-fifths of the deviation was due to incorrect layering. TABLE 1: Comparison of measurement quality between the manual method and the proposed method
In Level ‘-1’, CAMP counted almost 100% of the quantity of equipment. The –0.70% deviation of the 72°c sprinkler head was caused by using a ‘circle’ and not the corresponding ‘block’. Basically, the same equipment types as measured in Level ‘-1’ can also be counted in Level ‘3’. But the results in Level ‘3’ were unexpected. The system only counted 71% of all items, of which 43% were incorrectly sized due to non-compliance. In other words, only 40% (71% x 57%) of all of the equipment in Level ‘3’ were correctly counted. This quality is even worse than that in pipework measurement. According to the draftsmen, there were an extensive number of variations and progress accelerations during the trial run. They had to revise and issue all of the relevant drawings. Otherwise, delays in completing the project would have caused a huge amount in liquidated damages. Thus, they could not fully structure equipment as well as pipework in Level ‘3’. For this reason, the quality of the measurements of these elements was far below the standard. The results demonstrate CAMP’s high accuracy but it also depends on the quality of drafting, which is prone to human errors.
TABLE 2: Comparison of measurement quality between the manual method and the proposed method Case 2: More complicated drawings (Level 3)
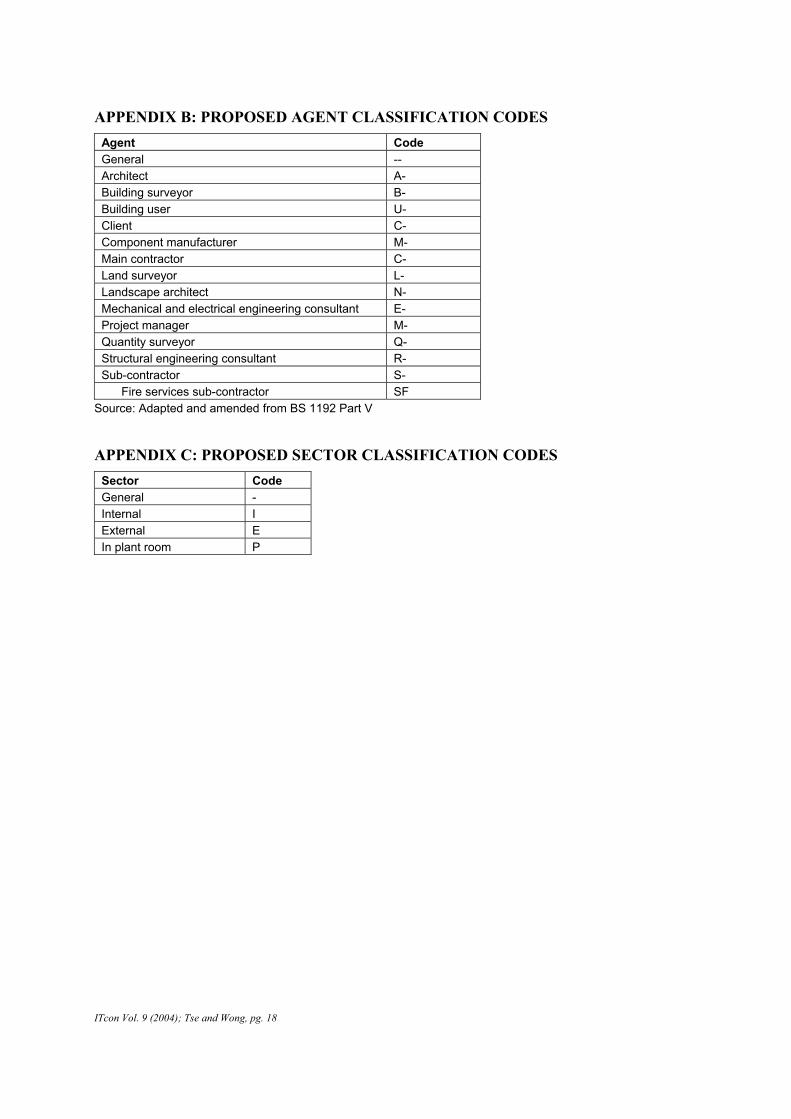
7. POST-RESEARCH ACTIONS The results revealed the significance of using a common CAD drafting standard for automated measurement as well as other downstream applications of CAD data. The problems associated with inconsistent CAD drafting standards and the results of this research project were subsequently communicated to the Construction Industry Review Committee (CIRC) of the Hong Kong Government in October 2000 (Wong 2000). Following a consultation study, CIRC admits that ‘The industry should give priority to setting common standards and develop a common data infrastructure for seamless electronic communication among stakeholders’ (CIRC, 2001). Follow-up actions were then taken up by the Environmental, Transport and Works Bureau (ETWB) of the Hong Kong Government in response to this recommendation. In September 2002, ETWB officially announced the implementation of the CAD Standard for Works Projects (CSWP) (ETWB 2002). As shown in FIG. 9, the layer-naming convention of CSWP is an abridged version of ISO 13567. It only consists of three fields, namely, agent responsible, element and user definable, of which the first two are mandatory. In particular,
ITcon Vol. 9 (2004); Tse and Wong, pg. 12
the ELEMENT field of CSWP only has four facets and the codes for the first three facets have been prescribed (FIG. 10).
FIG.9: Layer naming convention of CSWP FIG. 10: Extract of the CSWP element coding tables Source: ETWB (2002)
According to the technical circular, all project parties to public works contracts awarded on or after 15 October 2002 must follow CSWP to produce CAD drawings. This has been made a contract provision and is now in place in all public works contracts (ETWB 2002). It is envisaged that CSWP will become the local de-facto CAD standard as public works contribute almost 50% of the gross value of construction output in the Hong Kong construction industry (ETWB 2003). As such, modification to the proposed automated measurement system has been started and a new version of the whole system will be launched in due course.
8. CONCLUSION & FUTURE RESEARCH The proposed quantity measurement solution adopts the international CAD drafting standard (i.e., ISO 13567) to resolve the limitations of existing automated measurement model. The trail run indicated that the system can directly extract 2-D fire services quantities of structured CAD drawings without the need for script files. In term of speed, it was approximately 10 times faster than the manual approach. Nonetheless, this benefit was offset by the extra time required to standardize the drawings before starting the measurement. With regard to quality, it achieved a measurement accuracy of up to 99% as compared to 82% with the manual approach. However, the accuracy of the proposed solution decreases as incorrect CAD drafting increases, i.e. the elements are drawn on wrong layers. The system did not handle this problem due to the limited scope of research. It currently relies on “best drafting practice”, which requires individual companies to enhance CAD training for draftsmen. Future research may focus on the mechanism to make the CAD drafting processes more reliable, faster and less vulnerable for human errors. For example, an artificial intelligent function could be built to identify the sizes of pipelines based on the nearby dimension texts and then carry out automatic layer separation. It is also essential to promote a standardized CAD drafting practice and to educate the parties concerned. However, building services design and quantity measurement are separately performed by building services engineers and quantity surveyors respectively. It would be difficult for engineers to follow the required standard without justified advantages. Apart from inventing other ISO 13567 applications for disciplines other than quantity surveying, it is suggested that Governments and clients could take the lead in enforcing the standard. A successful case is the implementation of ISO 9000 series by the Hong Kong Housing Authority. Although the Hong Kong Government finally decided to use CSWP instead of ISO 13567, there are similarities and hence the proposed solution can be modified for the local industry.
9. ACKNOWLEDGEMENTS This research project was funded by Chubb Hong Kong Limited and the Hong Kong Polytechnic University under a Teaching Company Scheme. An abridged version of this paper can also be found in the Proceedings of the European Conference on Information and Communication Technology Advances and Innovation in the Knowledge Society.
10. REFERENCES
ITcon Vol. 9 (2004); Tse and Wong, pg. 13
Alexander, J. and Fletcher, A. (1979). Computer-aided quantity surveying and design for Scottish housing, Chartered Quantity Surveyor, Vol. 1, No. 5, pp. 137-140.
Bentley (ed.) (1997). MicroStation. at http://www.bentley.com
Björk B.C., Lownertz, K. and Kiviniemi, A. (1997). ISO DIS 13567 – The proposed international standard for structuring layers in computer aided building design, Electronic Journal of Information Technology in Construction, Vol. 2, pp.1-23, http://www.itcon.org/
Brandon, P. (1983). The writing on the wall. Chartered Quantity Surveyor, Vol. 5, No. 10, pp.378-379.
Campion, D. (1980). A computer-aided drafting/scheduling system in a medium-sized architectural practice. The Quantity Surveyor, Vol. 3, No. 5, pp. 209-212.
CICA (ed.) (1998). Software Directory 1998. Construction Industry Computing Association – London.
CIRC (ed.) (2001). Construct for Excellence – Report of the Construction Industry Review Committee, Construction Industry Review Committee, Hong Kong.
Cox, D. (1983). CAD and the quantity surveyor. Chartered Quantity Surveyor, Vol. 5, No. 11, pp. 33-35.
Elstree (ed.) (1997). CATOPro Catalogues. Elstree Computing Limited – UK
ETWB (2002) (ed.) Environment, Transport and Works Bureau (ETWB) Technical Circular (Works) No. 39/2002 – Electronic Dissemination of Tender Documents and Electronic Submission of Tender Returns on Removable Media. The Government of the Hong Kong Special Administrative Region.
ETWB (2003) (ed.). e-Tendering of Public Works Contracts. at http://www.etwb.gov.hk.
Hemmett, F.J. (1984). Computers in measurement. The Building Economist, Vol. 23, No. 2, pp.14-16.
HKIS (ed.) (1993). Hong Kong Standard Method of Measurement for Building Services. The Hong Kong Institute of Surveyors.
IAI (ed.) (1997). Domain Projects for IFC R3.0 - Building Services. International Alliance for Interoperability – Finland (Nordic Chapter), at http://www.iai-international.org/iai_international/
Li, R. (1995). Review in the application of CADD in AEC projects – The Hong Kong experience. HKIA Journal, Vol. 2, No.1, pp.73-77.
Li., H.M. (1996). Computer application in construction industry. Unpublished dissertation, Department of Building and Real Estate, The Hong Kong Polytechnic University, Hong Kong.
McGeorge, D. (1989). Impact of computer aided design on the QS profession. The Building Economist, Vol. 27, No. 4, pp.11-13.
Rycroft, E. (1980). Everyone has heard of the silicon chip. The Quantity Surveyor, Vol. 36, No. 11, pp.238-244.
Tse, T.C. and Wong, K.D. (1998). A study of quantity surveying practices in the building services sector of Hong Kong. Asian Pacific Building and Construction Management Journal, Vol. 4, pp. 9-14.
Walker, L. (1996). CAD Measure. Eltress Company Ltd. – UK
Wong, K.D. (2000). Presentation to the IT Group of the Construction Industry Review Committee. Unpublished presentation, 7th October 2000, Hong Kong.
Wexler, H. (1986) Past, present and future of quantity surveying. The Building Economist, Vol. 30, No. 4, pp. 2-5.
ITcon Vol. 9 (2004); Tse and Wong, pg. 14
APPENDIX A: PROPOSED FIRE SERVICES ELEMENT CLASSIFICATION CODE TABLE A1: Common pipework fittings and equipment
(58*2*A) 15 mm (58*2*B) 20 mm (58*2*C) 25 mm (58*2*D) 32 mm (58*2*E) 40 mm (58*2*F) 50 mm (58*2*G) 65 mm (58*2*H) 80 mm (58*2*I) 100 mm (58*2*J) 150 mm (58*2*K) 200 mm (58*2*L) 250 mm (58*2*M) 300 mm (58*2*N) 350 mm (58*2*O) 400 mm (58*2*P) 450 mm
(58*3*A) 15 mm (58*3*B) 20 mm (58*3*C) 25 mm (58*3*D) 32 mm (58*3*E) 40 mm (58*3*F) 50 mm (58*3*G) 65 mm (58*3*H) 80 mm (58*3*I) 100 mm (58*3*J) 150 mm
(58*3J-) Air release valves (58*3K-) Water hammer arrestors
(58*3*A) 15 mm (58*3*B) 20 mm (58*3*C) 25 mm (58*3*D) 32 mm (58*3*E) 40 mm (58*3*F) 50 mm
(58*3*D) 32 mm (58*3*E) 40 mm (58*3*F) 50 mm (58*3*G) 65 mm (58*3*H) 80 mm (58*3*I) 100 mm (58*3*J) 150 mm (58*3*K) 200 mm (58*3*L) 250 mm (58*3*M) 300 mm
(58*3Q-) Flow switches (58*3IF) 50 mm (58*3IG) 65 mm (58*3IH) 80 mm (58*3II) 100 mm (58*3IJ) 150 mm (58*3IK) 200 mm
(5854--) Gas suppression equipment (5854A-) Gas discharge nozzles (5854B-) CO2 gas cylinders (5854C) FM200 gas cylinders (5854D-) Inergen gas cylinders
(5854*A) 24 kg (5854*B) 45 kg (5854*C) 65 kg (5854*D) 80 kg (5854*E) 96 kg
ITcon Vol. 9 (2004); Tse and Wong, pg. 16
TABLE A3: Portable fire fighting equipment (58----)Mechanical Services(CI/SfB Table 1, see Appendix 5.3) (58----)Fire Services(CI/SfB Table 1, see Appendix 5.3) (586---) Portable fire fighting equipment (5861--) Portable fire extinguishers
(5861A-) Water (5851AA) 6 kg (5851AB) 9 kg
(5861B-) Foam (9 kg) (5861C-) CO2 Gas
(5861CA) 2 kg (58651CB) 5 kg (5861CC) 6 kg
(5861D-) Power (5861DA) 1 kg (5861DB) 2 kg (5861DC) 3 kg (5861DD) 6 kg (5861DE) 9 kg
(5862--) Fire blankets (5863--) Sand buckets
TABLE A4: Fire detection and alarm systems
(6----)Electrical Services (rooted in CI/SfB Table 1) (68----)Protective Services (681---) Fire detection and alarm systems (6811--) Detection devices
(6811A-) Heat detectors (6811AA) Fixed temperature (6811AB) Liner heat (6811AC) Rate of rise
(6811B-) Smoke detectors (6811BA) Ionization (6811BB) Mini beam (6811BC) Photoelectric
(6811C-) Spark detectors (6811D-) Flame detectors
(6812--) Alerting devices
(6812A-) Alarm bells, 150 mm (6812B-) Alarm bells, 230 mm
(6813--) Other devices (6813A-) Break glass unit (6813B-) Computer sets (6813C-) Control modules (6813D-) Isolator modules (6813E-) Monitor modules (6813F-) Micro switches (6813G-) Relay units (6813H-) Water level switches
(6813HA) One point (6813HB) Two points (6813HC) Three points
(6814--) Control panels
(6814A-) Drencher control panels (6814B-) Fire detection control panels (6814C-) Fire alarm control panels (6814D-) FH/HR pump control panels (6814E-) Gas suppression control panels (6814F-) Sprinkler pump control panels (6814G-) Submersible control panels
ITcon Vol. 9 (2004); Tse and Wong, pg. 17
APPENDIX B: PROPOSED AGENT CLASSIFICATION CODES Agent Code General -- Architect A- Building surveyor B- Building user U- Client C- Component manufacturer M- Main contractor C- Land surveyor L- Landscape architect N- Mechanical and electrical engineering consultant E- Project manager M- Quantity surveyor Q- Structural engineering consultant R- Sub-contractor S- Fire services sub-contractor SF
Source: Adapted and amended from BS 1192 Part V
APPENDIX C: PROPOSED SECTOR CLASSIFICATION CODES Sector Code General - Internal I External E In plant room P