42
© 1993 Gordon C. Bruner II OFFICE OF SCALE RESEARCH Technical Report #9305 A Census of Multi-Item Scales Used in Marketing Research by Dr. Gordon C. Bruner II

© 1993 Gordon C. Bruner II
OFFICE OF SCALE RESEARCH
Technical Report #9305
A Census of Multi-Item Scales Used in Marketing Research
by
Dr. Gordon C. Bruner II


© 1993 Gordon C. Bruner II
1
A CENSUS OF MULTI-ITEM SCALES USED IN MARKETING RESEARCH The multi-item psychometric scale is a commonly used
measurement tool in contemporary marketing research in both
academia and industry. Yet, past studies have typically
observed that individual measures have been reported with
minimal evidence of psychometric quality (Heeler & Ray, 1972,
p. 369; Kassarjian, 1971, p. 415; Jacoby, 1978, p. 91; Peter
1979, p. 16; Peter, 1981, p. 16). Even less is known about
marketing-related scaled measures as a whole or how their use
and properties vary across the sub-disciplines within the
field.
The problem in the 1960s and 1970s was the over usage of
single-item scales and the lack of scales developed
specifically for use in marketing (Kassarjian, 1971, p. 415;
Peter 1981, p. 138). However, the 1980s presented a different
problem: while there is a sense that progress was made in
terms of scale development and usage there is little
comprehensive knowledge about how far the field progressed in
the nature and quality of that usage. In a review of the
period, Malhotra expressed concern about the quality of the
scales being developed and used (1988, p. 20). Many
assumptions are made about our field's measures and this study
was conducted in an effort to shed some much needed empirical
light on these issues.

© 1993 Gordon C. Bruner II
2
Background
The need for better scale development and scale
usage in published research literature has been a problem
restraining research in many fields for years. As early as
1938, Buros deplored the state of scientific research, citing
the lack of critical test reviews, both in professional
journals and in textbooks. In 1975 he reiterated, "It is my
considered belief that most standardized tests are poorly
constructed, of questionable or unknown validity, pretentious
in their claims, and likely to be misused more often than not"
(p. xvii).
This poor state of research is perpetuated every time a
scale with questionable validity and/or reliability is
utilized. Buros censured researchers who published scales
without citing critical reviews or validity information
concerning the scale.
Chun, Cobb, and French (1975) note that naive researchers
believe scale construction is easy, resulting with inadequate
scales adding to the plethora of single-use measures. Only
about 30% of the published psychological scales have been
utilized more than once (Chun, Barnowe, Wykowski, Cobb, &
French, 1972). In a similar study in sociology, 72% of the
scales cited in the literature were used only once (Bonjean,
Hill, & McLemore, 1967). This high level of scale development
yet high degree of one-time usage indicates a lack of learning
by researchers which further suggests a sense of futility and
© 1993 Gordon C. Bruner II
3 Buros (1970) suggests that "convenient" scales can
wasted effort in published research efforts.
Borrowing Scales
Scale design can be very difficult for the researcher. As
a result, quality of scales and standardization of research
often is worse when the researcher devises new scales than
when the researcher builds upon existing scales (Shaw &
Wright, 1967).
Borrowing of highly reliable and valid scales is
encouraged to save time, increase the quality of research and
better enable researchers to expand/refine existing research
(Chun et al., 1975; Sudman & Bradburn, 1982; Green, Tull, &
Albaum, 1988). However, Anastasi (1985) warns that use of
borrowed scales requires a knowledge of the domain and context
of prior studies and how they relate to the current study. She
indicates many misuses of borrowed scales stem from the
researcher wanting quick answers and taking shortcuts.
Frequent use of a scale appears to be more a matter of
convenience for many researchers rather than a matter of the
scale's reliability and validity. High frequency of scale
usage has been found to be associated with the test and
scoring key published in the article, with correlation tables
being published, and with published scale reliability. One
should note, however, that low validity reliability scales are
reused just as frequently as high reliability validity scales
(Chun, Cobb, French, & Seashore, 1973).
© 1993 Gordon C. Bruner II
4
inhibit progress unless researchers build upon the scale and
seek continued improvements in the scale. Shaw and Wright
(1967) advocate borrowing the best available scale, but the
scale should be carefully applied due to differing underlying
assumptions in the new research setting.
Marketing Scale Reviews
As the review above indicates, examinations of scale
usage in psychology have been a common source of discussion.
In contrast, there have been very few efforts in marketing to
understand and describe the scales researchers are using.
One of the first empirical assessments was by Peter
(1979). He reviewed 400 articles in the area of consumer
behavior from five sources for a period in the mid-1970s.
Detailed examination was limited to the nineteen studies which
included some form of reliability assessment. In another
study, Peter (1981) surveyed more than 450 articles from one
source for the years 1973 to 1979. His concern was with
twelve studies in which construct validation was specifically
addressed.
A much larger analysis was made by Churchill and Peter
(1984; Peter & Churchill, 1986). They reviewed 6,484
articles, notes, and papers from seven sources for the period
of 1964 to 1982. The analysis reported in Churchill and Peter
(1984) was concerned with the effect of research design on
scale reliability and was based upon 154 uses of scales from
101 studies. Peter and Churchill (1986) used 162 measures,

© 1993 Gordon C. Bruner II
5
The first two hypotheses are rather straight forward
though there is no known empirical data to support them. That
is, the field of marketing is assumed to have made increasing
use of multi-item scales over the 1980s and the scales
gradually improved in reliability over time. These seem to be
reasonable expectations based upon the impact of certain key
articles published in the 1970s and early 1980s which
advocated greater development of scales intended for use in
marketing (Kassarjian, 1971), greater use of multi-item scales
(Jacoby, 1978; Peter, 1979), and greater attention to
apparently from the same set of studies, to examine a model of
the relationships among research design variables and various
types of validity.
More recently, Edris and Meidan (1990) reviewed eleven
marketing sources published between 1966 and 1986. Their
investigation concerned itself with the reliability of
measurement in 100 studies which involved psychographic
research.
Purpose of the Study
Given the lack of recent thorough examination of one of
our field's most used types of measures, this study was
conducted. A few of the relationships examined by Churchill
and Peter (1984) will be retested here, particularly those
which were found to be significant. The majority of
hypotheses composing this study, however, have not been tested
previously in any known marketing-related study.

© 1993 Gordon C. Bruner II
6
reliability and validity (Churchill, 1979; Peter, 1981).
These articles most likely affected the journal editors and
reviewers first which in time influenced the body of
submissions made to marketing journals. Given this
information, the following two hypotheses are proposed:
H1: Scale usage has increased in marketing over time.
H2: The internal consistency of scales used in
marketing has increased over time.
The internal consistency of a scale as estimated by
coefficient alpha is mainly influenced by the number of items
composing a scale and the degree of covariation among them
(DeVellis 1991, p. 86). The latter effect is due to the fact
that the formula for calculating coefficient alpha allows the
variance terms in the numerator to increase arithmetically
with the number of added items while the covariance terms in
the denominator increase geometrically (e.g., Peter, 1979, p.
9). Most pertinent here is that such a finding was reported
by Churchill and Peter (1984) with respect to the group of
scales they examined. This leads to the following hypothesis:
H3: The number of scale items and level of internal
consistency are positively correlated.
While acknowledging suggestions to the contrary (Bocker,
1988; Jacoby & Matell, 1971), it appears that reliability
typically increases as the number of scale points increase
(Nunnally, 1978, p. 595). After reviewing the available
literature, Cox (1980) also concluded that increasing the

© 1993 Gordon C. Bruner II
7
number of scale points tends to help reliability but he added
that the potential for improvement is likely to be minor
compared to other factors. Again, the most relevant finding
was by Churchill and Peter (1984) who reported a significant
positive association for the measures in their database.
Therefore, the following hypothesis is presented:
H4: The number of response alternatives and level of
internal consistency are positively correlated.
An unexpected finding of Churchill and Peter (1984) was a
negative relationship between sample size and reliability.
A related issue involves the ratio of respondents to scale
items. Peter (1979) points out that sampling errors are
related positively to the number items and negatively to the
number of subjects. Thus, when the sample size and/or the
ratio of respondents to items are low, chance is likely to
affect inter-item correlations (DeVellis, 1991, p. 78). Given
this, it has been suggested that there should be at least five
to ten times as many respondents as items (Comrey, 1988;
Nunnally, 1978, p. 279; Tinsley & Tinsley, 1987). The extent
to which scale usage has been affected by these findings and
suggestions is unknown but it seems reasonable to test the
following two hypotheses:
H5: Sample size and internal consistency are negatively
correlated.
H6: The ratio of sample size to number of scale
items is five or greater for the majority of scale

© 1993 Gordon C. Bruner II
8
The assumption is made by many researchers that the
majority of scales used in marketing have been borrowed from
other fields. This opinion may have been fostered by
statements such as those of Kassarjian (1971, p. 415) when he
criticized the misadaptation and misapplication by marketers
of scales developed in other disciplines. Peter's (1981, p.
138) observation a decade later is even clearer; he stated
that over half of the studies he examined used multi-item
scales developed in other fields. However, it is reasonable
to assume that as scale usage became more prevalent in
marketing that the degree of borrowing scales from outside the
field decreased and usage of scales developed within marketing
increased. Further, as concern for scale quality increased in
the 1980s it is likely that authors were more likely to
clearly indicate the origin of the scales they used. Given
these assumptions and observations the following hypotheses
are proposed:
H7: The percent of scales originated within marketing
studies has increased during the 1980s.
H8: The percent of scales borrowed from previous
marketing research has increased during the 1980s.
H9: The percent of scales used in marketing studies but
developed outside of marketing decreased during the
1980s.
H10: The percent of scales used in marketing studies of
unknown origin decreased during the 1980s.

© 1993 Gordon C. Bruner II
9
Quantity and Quality of Scale Usage By Journal
There is little doubt that perceptions of journal quality
vary among academicians and practitioners (Browne & Becker
1985; Fry, Walters, & Scheuermann, 1985; Luke & Doke, 1987).
While rank ordering was not exactly the same, the consistent
finding across these three studies was that the three journals
perceived to be of the highest quality and importance were
Journal of Marketing (JM), Journal of Marketing Research
(JMR), and Journal of Consumer Research (JCR). The next most
important journals (of those included in this study's domain)
were Journal of the Academy of Marketing Science (JAMS),
Journal of Advertising (JA), and Journal of Advertising
Research (JAR).
What is not known is whether there are significant
differences in the quantity and quality of scaled measures
reported in the various journals. Differences might come from
a number of sources such as the age of the journal, its
mission, its intended audience, the editors, and the level of
rigor used by reviewers. Over time, these factors influence
perception of the journals which in turn effect the nature of
submissions. It is expected that journals which have images
of higher quality publish articles containing scales with
higher reliability than those journals with less high
perceptions. Given these expectations the hypothesis below
follows:
H11: JM, JMR, and JCR have reported scales with higher

© 1993 Gordon C. Bruner II
10
mean internal consistency than have JAMS, JA, and
JAR.
While the quantity of scales reported in the journals is
likely to vary, there is no clear basis to support a specific
directional hypothesis, especially if one considers the scale
usage per article published rather than in total. Therefore,
the following hypothesis is stated in null form:
H12: There is no significant difference among journals
in their mean number of scales reported per article
published.
Scale Usage By Construct Groups
Three of the most frequently studied areas within
marketing are consumer issues, advertising issues, and
organizational issues (Malhotra 1988).1 Likewise, most of the
scales reported in marketing journals can be identified as
belonging to one of these three broad categories. Given those
groups, some differences in scale properties and usage may be
identifiable and relevant. However, there is no known
empirical evidence which indicates that the consumer,
advertising, and organizational scales are psychometrically
different from each other. Therefore, each of the hypotheses
below is stated in its null form.
H13: There is no difference in the number of scales
which have been used to measure consumer,
advertising, and organizational constructs.
H14: There is no difference in the mean levels of

© 1993 Gordon C. Bruner II
11
internal consistency between the scales used to
measure consumer, advertising, and organizational
constructs.
Scale Type
The type of scale employed to measure a construct was
tested by Churchill and Peter (1984) to determine if it made
any difference in a scale's internal consistency. The mean
alpha for Likert scales was found to be 75.9 compared to an
83.3 for semantic differentials. Despite this apparent
difference in the two types of scales the authors concluded
that there was no significant relationship because the
confidence intervals for the means overlapped. Although the
null version of the hypothesis will be tested, the evidence
from Churchill and Peter (1984) could lead one to expect that
if the null is rejected it will be due to semantic
differentials having higher mean alphas than Likert-type
scales.
H15: There is no significant difference in mean
internal consistency between Likert-type scales
and semantic differentials.
Method
Collecting and coding the scales used in published
marketing research required several years worth of effort.
Limits were imposed to make the task achievable in some
reasonable time period. The two main limits placed on the

© 1993 Gordon C. Bruner II
12
domain of review were the number of journals and years of
publication. There was also a particular concern that three
areas of study (consumer behavior, advertising, and
organization) should be especially well represented. Six
journals were ultimately selected: JM, JMR, JCR, JAMS, JA, and
JAR.2 While it is not advocated that these are necessarily
the top six journals in marketing it does seem clear that
during the 1980s they were among the most well known and
respected journals in the field (Browne & Becker, 1985; Fry,
Walters, & Scheuermann, 1985; Luke & Doke, 1987). Further, it
was assumed that most scales of any reasonable quality and
value to the field would have been reported at least once in
these journals during the period reviewed.
The time frame reviewed focused on the 1980s given that
previous studies have already examined scale usage of the
1960s and 1970s. Further, instead of taking a sample of
scales from that period, every instance of scale usage was
examined. However, only those scales which met certain
criteria were included in the database. Measures had to
contain two or more items. Also, a minimum amount of
information had to be known about each scale, particularly
with regard to reliability and item content. This information
generally was gathered from within the articles themselves or
from other published sources. Attempts to obtain information
from the authors themselves were also made with mixed results.
The group of scales analyzed here, therefore, while close to

© 1993 Gordon C. Bruner II
13
being the population of published multi-item scales from the
prescribed domain lacks those measures for which the minimum
required information could not be obtained.
Most of the variables examined in this study were not
particularly difficult to code. What made the job tedious was
the number of scale uses to code and the difficulty of
gathering the data, particularly when the information was not
clearly stated in the article. The scale codes and inter-
coder reliabilities are provided in Table A1. The levels of
intercoder reliability are in the range of acceptability
except for scale origination.3 Adjustment in coding
instructions for the origination variable was made followed by
a second round of testing. The level of inter- coder
reliability improved substantially but was still lower than
the ideal level. Further changes were made with little
success so the data regarding origination should be viewed
more cautiously than the other information reported here.
In total, 2,458 articles, comments, and research notes
were examined for measures which met the stated criteria for
inclusion in the database. Seven-hundred-and-fifty uses of
codable scales were found in 181 different articles.4 These
750 uses are broken down by year of publication and journal in
Figure 1 and Figure 2, respectively.
[Figures 1 and 2 about here]
Given that the data set is virtually the population from
the defined domain, "significant difference" is more of a

© 1993 Gordon C. Bruner II
14
conceptual than a statistical issue. Further, most of the
tests were run with each instance of scale use for which data
was available, the maximum being 750. In those cases,
significance testing used an alpha level of .01. Another
indication of substantive significance in the ANOVA tests
comes from examination of confidence intervals; overlapping
intervals suggest nonsignificance (Hunter, Schmidt, & Jackson,
1982, pp. 23, 24, Sawyer & Peter, 1983).
FINDINGS
Figure 1 indicates the number of scales reported per year
in the 1980s. It illustrates a six- fold increase in the
number of scales from 24 uses in 1980 to 152 uses in 1989.
There was a correlation of .87 between year of publication and
number of scales reported. Although there was not an increase
every year, the high positive correlation provides strong
evidence in support of H1.
The mean level of internal consistency for the whole
period was found to be a respectable .77. Yet, there was an
extremely wide range, from .28 to .98, with more than 26%
below .70. The data in Table 1 provide weak support for H2
given that the correlation between year of publication and
scale reliability was only .12. Figure 3 indicates
graphically the lack of a clear linear trend. Therefore,
although there was some slight increase in scale reliability

© 1993 Gordon C. Bruner II
15
over the 1980s the decade did not end with the average
reliability at a higher level than when it began.
[Table 1 & Figure 3 about here]
H3 stated that a positive correlation would be found
between the number of scale items and reported reliability.
Indeed, such a relationship was found. Based on the domain of
literature reviewed, there was a correlation of .21. The
corresponding estimate from the Churchill and Peter (1984)
sample was .32.
Weak evidence was found in support of H4. There was a
correlation of .14 between scale points and internal
consistency compared with a correlation of .22 in the
Churchill and Peter (1984) study. A refinement of this
hypothesis was also tested since it has been suggested that
the influence of scale points on reliability might be greater
for tests with few items than it is for those with a great
many items (Komorita, 1963). The partial correlation between
number of points and reliability was .19 when the number of
items in the scale was controlled for.
To further examine this relationship an ANOVA was
performed on three groups of scales: those with two, three,and
four points; those with five, six, and seven points; and,
those with eight to eleven points. Mean internal consistency
was highest for the group with the most response alternatives
(.78) and lowest for the group with the least scale points
(.73). However, it is questionable if anything should be made

© 1993 Gordon C. Bruner II
16
of this difference given that the test was insignificant and
the confidence intervals for all three groups overlapped
(F=1.96, p=.14). The expectation stated in H5 was that there
would be a significant negative relationship between sample
size and internal consistency. This relationship was
confirmed in the present study. Specifically, the correlation
was -.21, quite similar to the -.22 correlation found by
Churchill and Peter (1984).
H6 was tested using a specially developed subset of the
full data set. The subset was constructed by using only one
scale per unique sample (study) in the domain. When multiple
scales were administered to a sample, data regarding longest
was used. Doing this resulted in 199 uses of scales with
subject/item ratios ranging between .90 to over 597. Seven
percent of the studies had less than five times as many
respondents as they had items. Nine-and-a-half percent of the
studies had subject/item ratios of between five and ten. The
rest of the studies (83.5%) had ratios of 10 or better bearing
out H6.
Given the data discussed above it is reasonable to
conclude that the ratio of sample size to scale items is
negatively correlated with reliability. Using the subset of
the full database described above, the correlation between
subject/item ratio and internal consistency was -.14. This
means that there was a slight tendency for scale reliability
to diminish as the ratio of items to subjects increased.

© 1993 Gordon C. Bruner II
17
Since an increase in subjects and items are generally
desirable methodological characteristics the implication is
that studies with low subject/item ratios have a greater
tendency to report scales with high reliability. But, those
figures should be viewed skeptically since they are more
susceptible to chance.
With regard to scale origin, the data supported only H9,
not H7, H8, or H10. (See data in Table 2). Instead of there
being an increased amount of originality in scale usage, there
was a decrease in the percentage of scales developed in the
studies rather than borrowed from previous work (r=-.53).
There was no measurable trend over the decade involving the
percent of scales borrowed from previous marketing research
(r=.06) though borrowing from other fields decreased somewhat
(r=-.36). Further, the portion of scales of unknown origin
increased (r=.69) rather than decreased over the decade. Any
conclusions drawn from these apparent trends must be tempered
by the fact that nearly 30% of the all the scales were of
unknown origin. If their origination status where known it
might radically influence these results.
[Table 2 about here]
In support of H11, it was found that the two groups of
journals did differ substantially in their levels of scale
reliability. Specifically, the group composed of JM, JMR, and
JCR had a mean level of scale internal consistency of .78
whereas JAMS, JA, and JAR had a mean of .73. The t-test was

© 1993 Gordon C. Bruner II
18
significant well below the p=.001 level (t=4.99).
To further investigate this difference, an ANOVA was
performed on the six journals. It indicated there was a
significant difference in the mean levels of internal
consistency between the journals (F=7.02, p=.0001). The means
ranged from a high of .79 for both JCR and JMR to a low of .72
for JAMS (Table 3). Both Bonferroni and Scheffe's methods
indicated that significant differences existed between JAMS at
one extreme and JCR and JMR at the other since their
confidence intervals did not overlap.
[Table 3 about here]
The number of scales reported per journal did vary
substantially as shown in Figure 2. However, H12 was tested
more precisely by dividing the number of scales reported in
each journal by the number of articles published in the time
period. Table 3 shows that not only did JMR report more
scales in total in the 1980s but it also had a higher degree
of scale usage per article than any other journal of those
examined. The amount of scales reported in JAR was
considerably lower than the others but may be biased downward
to some degree due the study's methodology.5
H13 was tested by examining the number of scales
associated with the three construct groups. Nearly half
(47%) of all scale uses were found to involve consumer
constructs. Forty-one percent of the scales related to
organizational issues and the remainder of the scales (12%)

© 1993 Gordon C. Bruner II
19
were used to assess advertising constructs.
Not only were there different quantities of scales
associated with the three groups (H13) but their qualities
seem to be different as well (H14). Specifically, an ANOVA
was used to examine their internal consistencies. The
advertising group was found to have the highest mean (.82),
followed by the organizational and consumer groups (both
approximately .76). The ANOVA was significant (F=8.23,
p=.0003) and the Bonferroni confidence intervals for the
organizational and consumer groups did not overlap with that
of the advertising group. (Scheffe's confidence intervals
indicated a slight overlap between the organizational and
advertising groups.) This evidence indicates that while
measures of organizational and consumer constructs were nearly
indistinguishable in their internal consistencies, advertising
scales were noticeably higher.
About 78% of the scales reviewed were of the Likert-type
with around 16% being semantic differentials. With regard to
H15, semantic differential scales were found to have much
higher mean reliability (.85) than Likert-type scales (.75).
Yet, while these mean reliabilities are very similar to what
was reported by Churchill and Peter (1984), the conclusion is
different. H15 is rejected based upon the fact that the
confidence intervals did not overlap. It seems safe to say,
therefore, that the difference in the means is not only
conceptually significant but statistically significant as

© 1993 Gordon C. Bruner II
20
The significant relationships found by Churchill and
Peter (1984) were confirmed in this study. Specifically,
internal consistency was found to be positively related to
number of scale items and points but negatively associated
with sample size.
well.
Since it was known that scale length has an effect on
internal consistency (H3) and that length might vary based on
scale type, the test was rerun to be more certain of the
result. However, when the number of items composing a scale
was used as a covariate the conclusion was still the same: the
semantic differential scales used in the 1980s tended to have
much higher reliability than the Likert-type scales.
Discussion
The review of a decade's worth of articles indicated that
there were 750 uses of multi-item scales reported in 181
articles. The number of scales and their reliabilities varied
among the journals in which they were reported as well as the
construct-areas studied.
6 The combined impact of these associations
on the overall reliability of scales used in published
marketing studies could be characterized as modest at best. A
regression analysis indicated that number of items, points,
and sample size produced a R-squared of only .1 (p=.0001).7
So, even though these factors should receive serious
attention when developing and using individual measures, they
appear to explain only a small amount of variance in scale

© 1993 Gordon C. Bruner II
21
reliability for the population as a whole.
Despite the need for greater reliability, use of scales
with more items is not likely to occur given the growing
tedium respondents seem to have with long surveys. Over fifty
percent of the scale uses examined here had between two to
four items. Therefore, scale users would do well to remember
this simple rule: the fewer the items in the scale then the
greater the number of response alternatives to use. That is,
if one must have a short scale then at least a response scale
of seven, eight, or nine points should be utilized. In
contrast, if a scale with many items is used then reliability
may not suffer substantially if fewer response alternatives
are offered. The impact of these decisions on validity need
to be explored further, however.
The general level of scale internal consistency in the
domain was acceptable. However, there were many instances of
articles having scales that provided little evidence of
reliability or validity. While the data appears to show some
slight improvement in reliability over time in the 1980s, it
is interesting that the values are almost identical to those
found by Churchill and Peter (1984) for scales from an earlier
time period.
The author was struck by the number of times researchers
attempted to justify low reliabilities (∝<.7) by citing the
older edition of Nunnally (1967, p. 226) rather than the more
recent edition (1978, pp. 245, 246) in which higher levels

© 1993 Gordon C. Bruner II
22
were recommended. In other words, the standards of
acceptability increased from the 1960s to the 1970s. Further,
what was acceptable in the late 1970s may not be acceptable
for certain forms of research in the 1990s. It is suggested,
therefore, that instead of using scales with low reliabilities
and searching for citations to justify their use, effort
should be expended on the development and use of higher
quality measures.
Some may argue that lower standards of reliability may be
acceptable in those studies for which scales are not the
primary focus of examination. However, the attenuating effect
of low reliability on those relationships which are the focus
must then be acknowledged. That is, insignificant findings
may result due to low reliability rather than invalid
theoretical propositions. Use of a multiple scales with low
reliability in the same analysis only compounds the problem.
The knee-jerk reaction to simply maximize internal
consistency is not being proposed, however. Although little
discussed, high internal consistency can actually work against
high validity, particularly when attempting to measure a
construct with broad content (Kline, 1986, pp. 118-121). If
scale developers merely select those items from a pool which
maximize internal consistency then the result is what Cattell
called a "bloated specific" (e.g., 1978, p.289). Therefore,
high internal consistency may be a worthy goal but it should
not be pursued at the expense of content validity.

© 1993 Gordon C. Bruner II
23
About 27% of the instances of scale usage composing the
database were judged to be original. While that by itself is
not bad, it appears that measures have been developed too many
times when "good" ones have already been reported in the
literature. This is in contrast to what Peter (1981) observed
a decade ago when he said that those interested in studying
marketing-related issues ". . . have little to choose from in
the way of theory or multi-item measures developed in their
own literature" (p. 138). Now there are literally hundreds
of scales available to assess a wide variety of marketing-
related constructs. Therefore, the challenge facing most
scale users today is not so much having to construct good
scales from scratch or having to borrow and adapt measures
from other fields, it is a matter of doing proper reviews of
the marketing literature before questionnaires are prepared.
The field appears to have disregarded Churchill's suggestion
that "researchers should have good reasons for proposing new
measures . . . and those publishing should be required to
supply their rationale" (1979, p. 67).
In a related issue, it seems unfortunate that so many
authors have not been more specific about the origin of their
measures. Nearly 30% of the instances of scale usage were not
described sufficiently so that a determination of origination
status could be made. This lack of information affected
inter-coder reliability and may also have masked the trends
which were expected (H7 to H10). Certainly, authors should be

© 1993 Gordon C. Bruner II
24
more forthcoming about this matter so readers may know whether
a scale was constructed specifically for the study being
reported or was borrowed from previous research.
It also does not seem defensible to use a scale if
little or no published information attests to its quality. In
contrast, if a scale has been used previously and there is
sufficient evidence of its validity then users may not have to
examine and report its psychometric properties in great depth.
However, even with well tested scales certain types of
information may still be useful. Measures of internal
consistency are easy to compute and should be reported now in
all journals as a matter of course. In addition, if we are to
make use of computer-aided interviewing technology that can
customize the length of scales in real time for individual
respondents then we must be more forthcoming about reporting
the requisite information for building item response banks
(e.g., Singh, Howell, & Rhoads, 1990).
Greater concern for scale quality might occur if
journals, particularly those most devoted to publishing
empirical research, more vigorously solicited manuscripts
regarding scaling issues. Not only should presentations of
new measures be welcomed but so should articles which
critically evaluate and compare alternative measures of the
same construct. The Journal of Personal Selling & Sales
Management began a section in 1993 totally devoted to scales
and the time is ripe for journals which deal with other
© 1993 Gordon C. Bruner II
25
topical areas to do likewise. Although it may have been
considered previously, the notion of starting a new journal
totally devoted to articles of this nature would appear to be
worth revisiting at this point in the discipline's
development.
The validity of measures was not addressed in this study
but is worthy of investigation in future studies. There was a
clear sense from this study, however, that providing evidence
of a scale's validity was the exception rather than the rule.
While it was expected that sophisticated examination of some
forms of validity would be rare, it was surprising that
indications of such fundamentals as content validity and
unidimensionality were not routinely provided. Complicating
the examination of validity is the inconsistent use of
terminology and a lack of agreement on the methods of
assessment.
A contribution could also be made in future research by
dividing the scales into many construct groups and noting
their psychometric characteristics. Not only could this help
determine for which constructs good alternatives scales exist
but also those for which few if any scales now exist. The
major hurdle to accomplishing this task would be to first
develop a mutually exclusive and collectively exhaustive set
of marketing constructs and their operational definitions.
Given the difficulty of such a task, less lofty goals may have
to be acceptable for the short term.
© 1993 Gordon C. Bruner II
26
Summary and Conclusions
This article describes some of the findings of the most
recent and largest examination of scales in marketing. The
decade of the 1980s was one of tremendous growth by
researchers in the use of multi-item summated scales. The
quantity of usage increased dramatically over the period but
the quality (reliability) of the scales did not show a similar
degree of improvement. This effort and those changes being
implemented by our field's journals will hopefully raise the
sensitivity level of scale users. If that can occur then a
meaningful advancement in the quality of research being
published in marketing should ultimately follow.

© 1993 Gordon C. Bruner II
27
to lack of sufficient information in the articles or supplied by authors. While this was also true for the other journals it may have occurred more frequently for
FOOTNOTES 1. The term "organizational" is used broadly here to refer to constructs relating to sales management, personal selling, channels, and other constructs involving marketing management that are not directly related to consumers or advertising. Further, it is admitted that these three categories (consumer, advertising, and
organizational) are rather crude. However, repeated attempts to develop a larger set of mutually exclusive and collectively exhaustive groups were unsuccessful.
The efforts continue and may at some point yield a hierarchical schemata of marketing constructs which can be used to more specifically examine scale usage.
2. The task of reviewing each article in the cited journals,
describing each instance of scale usage, contacting scale users for more information, building the database, and analyzing the data required over three years of intensive work. While the inclusion of other journals would have improved the research, the time and manpower resources to do so were not available given that the research had to be finished and published in a reasonable timeframe before the data became dated and less relevant.
3. Inter-coder reliability was estimated using fourteen scales. Using the Perreault and Leigh (1989) formula, reliability was above .90 for all variables except for origination status. Data were also collected with regard to a scale's degree of modification compared to its original form. However, repeated attempts to bring bring inter-coder reliability up to even minimum acceptable standards were unsuccessful. 4. These 750 "uses of scales" should not be interpreted as 750 different scales much less 750 different constructs.
Since several scales have been employed in multiple studies, the exact number of unique scales is lower than 750. Although an exact count was not made for this study, an estimate of the number of scales with substantially different item sets is between 590 and 600. The exact number depends upon the way uniqueness is operationalized since many studies have employed sets of items with varying degrees of similarity to measure the same constructs.
5. Although the authors stand by the description of JAR as
having fewer uses of scales per article, we admit that several instances of scale usage were not included due

© 1993 Gordon C. Bruner II
28
JAR. 6. These results should not be interpreted as an independent
replication of Churchill and Peter (1984) since the data- bases of the two studies overlap for the 1980 to 1982
period for four journals. 7. The regression analysis was run both on the whole database (n=750) as well as the subset described earlier
(n=199) with similar amounts of variance explained.

© 1993 Gordon C. Bruner II
29
REFERENCES Anastasi, Anne. Mental Measurements: Some Emerging Trends. In The Ninth Mental Measurements Yearbook, James V. Mitchell Jr., ed., Lincoln, NE: Buros Institute of Mental Measurements of the University of Nebraska-Lincoln, xxiii-xxix, 1985. Bocker, Franz. Scale Forms and Their Impact on Ratings' Reliability and Validity. Journal of Business Research, 1988, 17 (August), 15-26. Bonjean, C. M., R. J. Hill, & S. D. McLemore. Sociological Measurement: An Inventory of Scales and Indices. San
Francisco: Chandler, 1967. Browne, William G. & Boris W. Becker. Perceptions of Marketing Journals: Awareness and Quality Evaluations. Proceedings of the American Marketing Association Educators' Conference, 1985, 149-154. Buros, Oscar Krisen, ed. Personality Tests and Reviews II. Highland Park, NJ: Gryphon Press, 1975. __________. Personality Tests and Reviews, Highland Park, NJ: Gryphon Press, 1970. Cattell, Raymond B. The Scientific Use of Factor Analysis in Behavior and Life Sciences, New York: Plenum Press, 1978. Chun, Ki-Taek, Sidney Cobb, & John R. P. French, Jr. Measures for Psychological Assessment. Ann Arbor, MI: Survey Research Center of the Institute for Social Research, University of Michigan, 1975. __________, __________, __________, & Stanley Seashore. Storage and Retrieval of Information on Psychological Measures. American Psychologist, 1973, 28 (July), 592-599. __________, J. T. Barnowe, K. S. Wykowski, Sidney Cobb, & John R. P. French, Jr. Selection of Psychological Measures: Quality or Convenience? Proceedings of the 80th Annual Convention of the American Psychological Association, 7, 15-16. Churchill, Gibert A., Jr. A Paradigm for Developing Better Measures of Marketing Constructs. Journal of Marketing
Research, 1979, 16 (February), 64-73. __________ & J. Paul Peter. Research Design Effects on the Reliability of Rating Scales: A Meta-Analysis. Journal of Marketing Research, 1984, 21 (November), 360-375.

© 1993 Gordon C. Bruner II
30
Comrey, Andrew L. Factor Analytic Methods of Scale Development in Personality and Clinical Psychology. Journal of Consulting and Clinical Psychology, 1988, 56 (October), 754-761. Cox III, Eli P. The Optimal Number of Response Alternatives for a Scale: A Review. Journal of Marketing Research, 1980, 17 (November), 407-422. DeVellis, Robert F., Scale Development: Theory and Applications. Newbury Park, California: Sage Publications, Inc, 1991. Edris, Thabet A. & A. Meidan. On the Reliability of Psychographic Research: Encouraging Signs for Measurement Accuracy and Methodology in Consumer Research. European Journal of Marketing, 1990, 24 (3), 23-41. Fry, Elaine Hobbs, C. Glenn Walters, & Lawrence E.Scheuermann.
Perceived Quality of Fifty Selected Journals: Academicians and Practitioners. Journal of the Academy of Marketing Science, 1985 13 (Spring), 352-361.
Green, Paul E., Donald S. Tull & Gerald Albaum. Research for Marketing Decisions. Englewood Cliffs, NJ: Prentice Hall, 1988. Heeler, Roger M. and Michael L. Ray. Measure Validation in Marketing. Journal of Marketing Research, 1972, 9 (November), 361-370. Hunter, John E., Frank L. Schmidt, & Gregg B. Jackson. Meta-Analysis: Cumulating Research Findings Across
Studies. Beverly Hills, California: Sage Publications, Inc, 1982.
Jacoby, Jacob. Consumer Research: A State of the Art Review. Journal of Marketing, 1978, 42 (April), 87-96. __________ & Michael S. Matell. Three Point Scales Are Good Enough. Journal of Marketing Research, 1971, 8 (November), 495-500. Kassarjian, Harold H. Personality and Consumer Behavior: A Review. Journal of Marketing Research, 1971, 8 (November), 409-418. Kline, Paul. A Handbook of Test Construction: Intro- duction to Psychometric Design. New York: Methuen, Inc,

© 1993 Gordon C. Bruner II
31
1986. Komorita, S. S. Attitude Content, Intensity, and the Neutral Point on a Likert Scale. Journal of Social Psychology, 1963, 61 (December), 327-334. Luke, Robert H. & E. Reed Doke. Marketing Journal Hierarchies: Faculty Perceptions, 1986-1987. Journal of the Academy of Marketing Science, 1987, 15 (Spring), 74-78. Malhotra, Naresh K. Some Observations on the State of the Art in Marketing Research. Journal of the Academy of Marketing Science, 1988, 16 (Spring), 4-24. Nunnally, Jum C. Psychometric Theory. New York: McGraw-Hill Book Company, 1967/1978. Perreault, Jr., William D. & Lawrence E. Leigh. Reliability of Nominal Data Based on Qualitative Judgments. Journal of Marketing Research, 1989, 26 (May), 135-148. Peter, J. Paul. Reliability: A Review of Psychometric Basics and Recent Marketing Practices. Journal of Marketing, 1979, 16 (February), 6-17. __________. Construct Validity: A Review of Basic Issues and Marketing Practices. Journal of Marketing Research, 1981, 18 (May), 133-145. __________ & Gilbert A. Churchill, Jr. Relationships Among Research Design Choices and Psychometric Properties of Rating Scales: A Meta-Analysis. Journal of Marketing Research, 1986, 23 (February), 1-10. Sawyer, Alan G. & J. Paul Peter. The Significance of Statistical Significance Tests in Marketing Research. Journal of Marketing Research, 1983, 20 (May), 122-133. Shaw, Marvin E. & Jack M. Wright. Scales for the Measurement of Attitudes. New York: McGraw-Hill, Inc, 1967. Singh, Jagdip, Roy D. Howell, & Gary K. Rhoads. Adaptive Designs for Likert-Type Data: An Approach for Implementing Marketing Surveys. Journal of Marketing Research, 1990, 27 (August), 304-321. Sudman, Seymour & Norman H. Bradburn. Asking Questions. San Francisco: Jossey-Bass, 1982. Tinsley, Howard E. A. & Diane J. Tinsley. Uses of Factor Analysis in Counseling Psychology Research. Journal of

© 1993 Gordon C. Bruner II
32
Counseling Psychology, 1978, 34 (October), 414-424.

Table A1 Scale Codes, Instructions, & Inter-Coder Reliabilities
GROUP CODE: [consumer behavior=1 advertising=2 organizational=3] Code based upon examination of scale items, and, if necessary, the context in which a scale was used (theory tested, nature of sample). (100%)a
ARTICLE CODE: Three digit number assigned to each article corresponding to number of physical file containing copy of article and other relevant materials.b
YEAR PUBLISHED: Last 2 digits of the year in which an article was published (80 to 89).b
JOURNAL: [JM=1 JMR=2 JCR=3 JAMS=4 JA=5 JAR=6] The journal in which an article was published.b
NUMBER OF ITEMS: The number of items for a particular use of a scale.(100%)c
NUMBER OF RESPONSE ALTERNATIVES: The number of points for a particular use of a scale; if different number of points were used for different items, the majority rules.(100%)c
SCALE TYPE: [Likert-type=1 semantic differential=2 other=3].(95%)a
INTERNAL CONSISTENCY: Report two-digit alpha from the sample, if known, otherwise report split-half, Spearman-Brown, LISREL reliability, etc.(92%)c
SAMPLE SIZE: The sample size reported in an article upon which reliability was estimated.(92%)c
ORIGINATION STATUS: [developed in this use=1 developed in previous marketing research=2 developed in non-marketing research=3 unknown=9] Code as "unknown" unless it is very clear that it was original or borrowed.(72%)a
a Inter-coder reliabilities for nominal level data were calculated using the formula offered by Perreault and Leigh (1989). b Information regarding these variables was supplied by the lead author on coding forms to insure that coders were examining the appropriate scales. Inter-coder reliabilities were not calculated. c Reliabilities for ratio level data were calculated by dividing the number of agreements among the judges by the number of observations they made.

Table 1
Correlations, Means, & Standard Deviations For Metric-Level Variables
Year Published
Scale Length Scale Points Reliability Sample Size
Year Published
1
Scale Length -0.13a 1 Scale Points -0.02 -0.20a 1 Reliability 0.12a 0.21a 0.14a 1
Sample Size 0.04 -0.08 -0.13a -0.21a 1
Means 1986b 5.96 6.06 0.77 327.58 Standard Deviations
2.59 6.08 1.38 0.13 297.89
a p<.001 b median year of publication
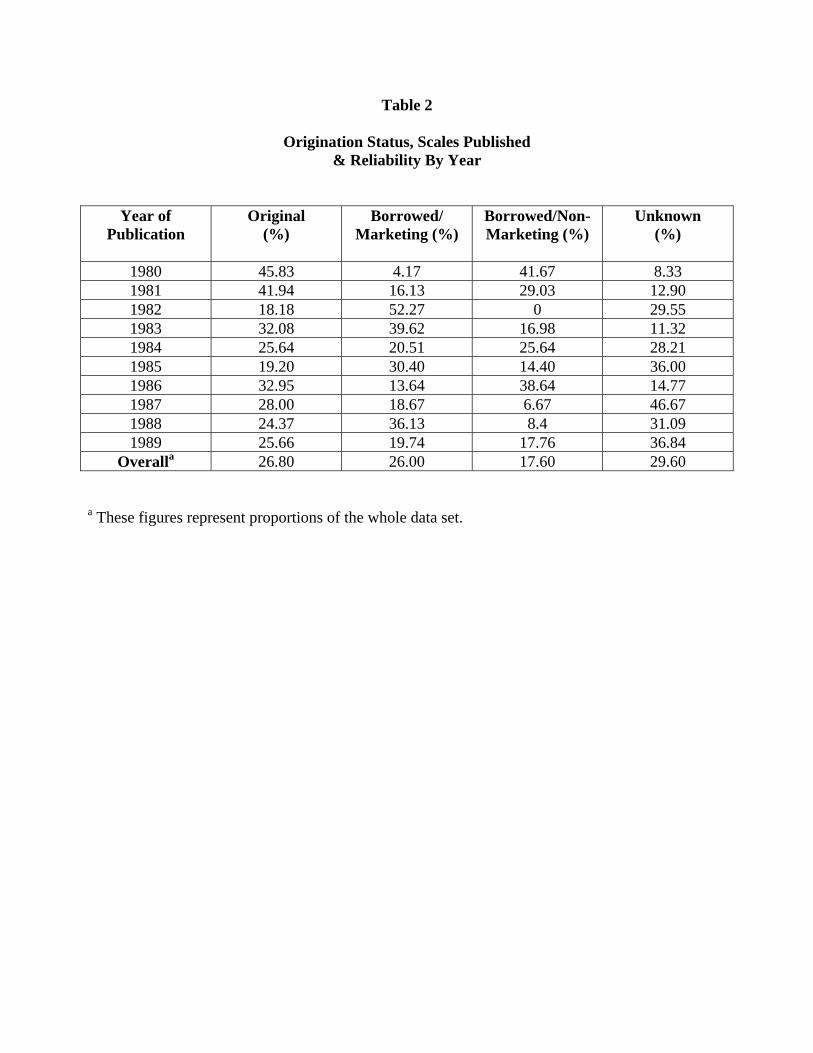
Table 2
Origination Status, Scales Published & Reliability By Year
Year of Publication
Original (%)
Borrowed/ Marketing (%)
Borrowed/Non- Marketing (%)
Unknown (%)
1980 45.83 4.17 41.67 8.33 1981 41.94 16.13 29.03 12.90 1982 18.18 52.27 0 29.55 1983 32.08 39.62 16.98 11.32 1984 25.64 20.51 25.64 28.21 1985 19.20 30.40 14.40 36.00 1986 32.95 13.64 38.64 14.77 1987 28.00 18.67 6.67 46.67 1988 24.37 36.13 8.4 31.09 1989 25.66 19.74 17.76 36.84
Overalla 26.80 26.00 17.60 29.60
a These figures represent proportions of the whole data set.

Table 3
Number of Scale Uses Per Article For Each Journal
Journal Scales Reporteda Articles Publishedb
Scales Per Article
Mean Reliability
JM 96 404 .24 .76 JMR 231 504 .46 .79 JCR 164 499 .33 .79
JAMS 162 396 .41 .72 JA 82 239 .34 .76
JAR 15 416 .04 .76
a These are the numbers of multi-item scales for which sufficient information was available to qualify them for inclusion in the database. b The count of articles included research notes and comments.

Figure 1
Number of Scales Reported By Year
0
20
40
60
80
100
120
140
160
1980 1982 1984 1986 1988
Year of Publication
Freq
uenc
y

Figure 2
Number of Scales Reported By Journal
050
100150200250
JM JMR JCR JAMS JA JAR
Journal
Freq
uenc
y

Figure 3
Scale Reliability By Year
0.6
0.65
0.7
0.75
0.8
0.85
1980 1982 1984 1986 1988
Year of Publication
Inte
rnal
Con
sist
ency


