Vol. 66 · No. 4 · 313–328 2012 DOI: 10.3112/erdkunde.2012.04.03 http://www.erdkunde.uni-bonn.de ISSN 0014-0015 A CENTURY OF MOTORISATION IN URBAN AND RURAL CONTEXTS: PATHS OF MOTORISATION IN GERMAN CITIES Joachim Scheiner With 2 figures and 7 tables Received 16. August 2012 · Accepted 05. November 2012 Summary: Historical trends in motorisation have been intensively studied by transport historians. However, this is not true for the spatial aspects of these trends. It is well-known that the level of motorisation today is considerably lower in cities than in suburban and rural areas. However, this has not always been the case. The paper studies spatial structures in motorisation for German cities over the period 1907 to 2008. A typology is developed including 80 cities according to their motorisation trends over the period 1938 to 2008. The results show characteristic paths of motorisation. It also becomes apparent that motorisation started in the cities, and the countryside ‘overtook’ the cities not before the 1960s in terms of motorisation levels. Zusammenfassung: Die historische Entwicklung der Motorisierung ist von Verkehrshistorikern intensiv erforscht worden. Dies gilt jedoch nicht für deren räumliche Differenzierung. Heute ist die Motorisierung in Städten bekanntlich deutlich geringer als in suburbanen und ländlichen Räumen. Dies war jedoch nicht immer so. Der Beitrag untersucht die räumliche Struktur der Motorisierung anhand deutscher Städte für den Zeitraum 1907 bis 2008. 80 Städte werden anhand ihrer Motori- sierungsentwicklung im Zeitraum 1938 bis 2008 typisiert. Dabei zeigen sich charakteristische Motorisierungspfade. Darüber hinaus wird deutlich, dass die Motorisierung in den größeren Städten begann und erst in den 1960er Jahren der ländliche Raum die Städte ‚überholte‘. Keywords: Motorisation, transport trends, transport history, car availability 1 Introduction The 20 th century has been described as the cen- tury of the automobile by transport historians and sociologists (canzler and Schmidt 2003), our age as the age of the automobile ( Flink 1988), and our so- ciety as an automobile society ( kuhm 1995). Beyond doubt, other ground-breaking trends, discoveries and inventions shaped the 20 th century as well, in- cluding film and telecommunication, globalisation, secularisation, and change in values. But hardly any other artefact dominated a whole century, contribut- ed to destruction in ecological and urban structures, to socio-spatial exclusion and integration, freedom and emancipation from regional constraints to the extent the car did. This is particularly true since the period of mass motorisation, the car’s broad penetra- tion of the population after its “bumpy triumph” ( merki 2002; author’s translation) at the beginning. The history of motorisation has been studied intensively in historical, political and social scienc- es for Germany as well as on an international level (SachS 1984; Blaich 1987; laux 1992; niemann and hermann 1995; merki 2002; for the USA see Flink 1988; ling 1990; for overviews of research see Barker 1993; Schmucki 1995). This research focuses on political, societal, economic and technical trends. There is little empirical evidence on the spatial side of motorisation history, apart from international comparisons. Only casually, historians mention that today’s high level of motorisation in rural areas did not exist from the beginning. Rather the triumph of the car started in cities (aSmuS 1995; merki 2002). This observation, however, leaves open a number of questions: How large were the differences in car ownership levels between cities and the countryside? When did these differences diminish and eventually turn around? Are they homogeneous over various regions, or do cities (or rural areas) exhibit different paths of motorisation? This paper aims to corroborate the existing, anecdotic observations by a systematic analysis of long-term motorisation data for German cities over the period 1907 to 2008. The focus is on typical paths of cities; rough comparisons with rural areas are made as well. The next section gives an over-
A CENTURY OF MOTORISATION IN URBAN AND RURAL CONTEXTS: PATHS OF MOTORISATION IN GERMAN CITIES
Joachim Scheiner
With 2 figures and 7 tablesReceived 16. August 2012 · Accepted 05. November 2012
Summary: Historical trends in motorisation have been intensively studied by transport historians. However, this is not true for the spatial aspects of these trends. It is well-known that the level of motorisation today is considerably lower in cities than in suburban and rural areas. However, this has not always been the case. The paper studies spatial structures in motorisation for German cities over the period 1907 to 2008. A typology is developed including 80 cities according to their motorisation trends over the period 1938 to 2008. The results show characteristic paths of motorisation. It also becomes apparent that motorisation started in the cities, and the countryside ‘overtook’ the cities not before the 1960s in terms of motorisation levels.
Zusammenfassung: Die historische Entwicklung der Motorisierung ist von Verkehrshistorikern intensiv erforscht worden. Dies gilt jedoch nicht für deren räumliche Differenzierung. Heute ist die Motorisierung in Städten bekanntlich deutlich geringer als in suburbanen und ländlichen Räumen. Dies war jedoch nicht immer so. Der Beitrag untersucht die räumliche Struktur der Motorisierung anhand deutscher Städte für den Zeitraum 1907 bis 2008. 80 Städte werden anhand ihrer Motori-sierungsentwicklung im Zeitraum 1938 bis 2008 typisiert. Dabei zeigen sich charakteristische Motorisierungspfade. Darüber hinaus wird deutlich, dass die Motorisierung in den größeren Städten begann und erst in den 1960er Jahren der ländliche Raum die Städte ‚überholte‘.
Keywords: Motorisation, transport trends, transport history, car availability
1 Introduction
The 20th century has been described as the cen-tury of the automobile by transport historians and sociologists (canzler and Schmidt 2003), our age as the age of the automobile (Flink 1988), and our so-ciety as an automobile society (kuhm 1995). Beyond doubt, other ground-breaking trends, discoveries and inventions shaped the 20th century as well, in-cluding film and telecommunication, globalisation, secularisation, and change in values. But hardly any other artefact dominated a whole century, contribut-ed to destruction in ecological and urban structures, to socio-spatial exclusion and integration, freedom and emancipation from regional constraints to the extent the car did. This is particularly true since the period of mass motorisation, the car’s broad penetra-tion of the population after its “bumpy triumph” (merki 2002; author’s translation) at the beginning.
The history of motorisation has been studied intensively in historical, political and social scienc-es for Germany as well as on an international level (SachS 1984; Blaich 1987; laux 1992; niemann
and hermann 1995; merki 2002; for the USA see Flink 1988; ling 1990; for overviews of research see Barker 1993; Schmucki 1995). This research focuses on political, societal, economic and technical trends. There is little empirical evidence on the spatial side of motorisation history, apart from international comparisons. Only casually, historians mention that today’s high level of motorisation in rural areas did not exist from the beginning. Rather the triumph of the car started in cities (aSmuS 1995; merki 2002).
This observation, however, leaves open a number of questions: How large were the differences in car ownership levels between cities and the countryside? When did these differences diminish and eventually turn around? Are they homogeneous over various regions, or do cities (or rural areas) exhibit different paths of motorisation?
This paper aims to corroborate the existing, anecdotic observations by a systematic analysis of long-term motorisation data for German cities over the period 1907 to 2008. The focus is on typical paths of cities; rough comparisons with rural areas are made as well. The next section gives an over-
314 Vol. 66 · No. 4
view on the state of research. Subsequently the data are introduced, followed by the results and an outlook.
2 Spatial trends in motorisation in Germany
The term motorisation may refer to various vehi-cle types depending on its definition (Schmucki 1995). In its broadest sense it includes the general level of mechanisation in transport, in the narrowest sense it refers to the level of private car ownership. Mostly it refers to motor vehicles for road transport, includ-ing cars, trucks, busses and motor cycles. Within this range, private cars clearly dominate in quantitative terms today. For historical studies it is important to consider that business cars and taxis are cars as well. It was only after 1960, that the majority of cars in Germany were registered as private cars (edelmann 1989, 227).
It is well-known that today’s level of motorisation is higher in suburban and rural areas than in cities (lötScher et al. 2001). In North-Rhine Westphalia car motorisation (or car ownership) level in urban dis-tricts1) varies between 441 (Aachen) and 576 (Münster) cars per 1,000 inhabitants (inh), but between 535 (Recklinghausen) and 672 (Düren) (MBV NRW 2008, 55). For the household level data availability is less sat-isfactory. According to PreiSendörFer (2001) 42% of households did not have their own cars in cities with more than 500,000 inh in 1998, as compared to 17% in municipalities with less than 2,000 inh. The shares of urban households not owning a car are even consid-erably higher in inner-city areas than on city levels as a whole (see JürgenS and kaSPer 2006 for Cologne).
The reasons for the lower level of motorisation in cities are urban transport systems and structures of land-use, including better public transport, lack of parking space, and short distances between housing and places of out-of-home activities. What is more, there are social and cultural differences, such as con-centrations of poor households, young people and sin-gle households in cities.
Trends in travel mode choice suggest growing di-vergence in motorisation levels over recent decades be-tween large cities, particularly their centrally located, high-density neighbourhoods, on the one hand, and smaller municipalities on the other hand (Scheiner 2006). For instance, the level of motorisation is cur-
1) ‘Urban districts’ are actually known as ‘district-free cit-ies’ (kreisfreie Städte) and typically include agglomeration cores, i.e. large cities with about 100,000 inhabitants or more.
rently declining slightly in Berlin (from 365 to360 cars per 1,000 inh over the period 2002–2007) as well as in Hamburg (from 478 to 476) and Bremen (from 446 to 441). As opposed, the figure for Germany as a whole still increases (from 538 to 566 over the same period2).
The difference in motorisation level between ur-ban and rural areas has not always been the way it is now. Transport historians have often pointed out that the private car started its triumph in the cities (SachS 1984, 23ff; edelmann 1989, 92; aSmuS 1995; merki 2002). aSmuS (1995) highlights that in Schleswig-Holstein motor vehicles were concentrated in the cit-ies of Altona, Kiel and Flensburg before World War (WW) I, while being virtually non-existent in the countryside. He also reports that urban-rural differ-ences in motorcycle ownership were less pronounced then. merki (2002, 68) notes for the same period that in Berlin or Hamburg the level of car ownership was three times as high as in rural Silesia or Posen. edelmann (1989, 92) reports low levels of motorisa-tion in rural areas as well as in the industrial centres of the Ruhr and Upper Silesia around 1928.
The USA exhibited a somewhat different pat-tern. Although the earliest US cars also appeared in the cities, the innovation was adopted very fast in the countryside. First, most US farms were characterised by subsistence and isolation due to the extremely low population density, which made private cars more beneficial to farmers than in Germany. Second, the American vehicle industry launched the Ford T as a relatively affordable model as early as 1908. For these reasons the car was more common in the countryside than in cities even before WWI, and it contributed considerably to integrating rural areas into the urban American economy and society (Berger 1979; FoSter 1983, 33; interrante 1983, 95ff.; Flink 1988, 132ff.; ling 1990, 7).
Commendable as these historical studies are, they provide very limited systematic empirical evidence. One can only suspect at which point in history the above discussed spatial differences levelled off and, finally, turned around. Voigt (1965, 465) reports motorisation levels for the old Bundesländer for 1962. The figures suggest that motorisation in rural areas was still below average then. Hamburg appeared to have the highest level with 128 cars per 1,000 inh. However, the less wealthy Bundesland of Bremen had only a medium level, and Berlin (West) had the lowest
2) Data from the internet sites of the Federal Statistical Office and the Statistical Offices of the Länder. More recent data cannot be directly compared any more due to the exclu-sion of temporarily de-registered vehicles.
315J. Scheiner: A century of motorisation in urban and rural contexts2012
level among all Bundesländer with 92 cars per 1,000 inh. Apparently, economic or other local impact factors were stronger at this time than a general urban-rural difference. hartenStein and liePelt (1961) found in their groundbreaking sociological study an almost identical level of private car ownership for urban and rural regions of 22% and 24% of all households, re-spectively (ibid., 67). These results are likely to be somewhat biased due to the wording in the question-naire used (“Is there a car in your family?”), as in rural areas more than elsewhere the family may not have been equated with the household. In Hamburg a considerably higher motorisation level was found at the outskirts than in the centre (42% v. 26% of families, ibid., 68). This finding points towards seg-regation and early suburbanisation processes. At the same time, small-scale activity spaces and holdings of cheaper vehicles were above average in rural ar-eas, which is reflected in large proportions of mo-torcycles and bicycles used for job trips and the large share of employees for whom residence and work-place are identical (Tab. 1).
These empirical glimpses suggest that the spatial structure of motorisation and activity spaces differed strongly from today’s patterns until at least the 1960s. Motorisation levels were high in cities, in some at least, and were strongly affected by local economic condi-tions. Apart from the general affluence level the lo-cal significance of the automotive industry may have played an important role. What is more, the relative importance of agricultural and industrial or service sector employment may have been important, as the activity spaces of rural farmers were probably very limited.
3 Data and methodology
The analysis presented in this paper is based on motorisation figures for cars, motorcycles and motor vehicles in total. The Statistical Yearbook of German Municipalities includes these figures for relatively large cities. These typically include all urban districts (‘district-free cities’, kreisfreie Städte), complemeted by medium-sized towns and cities within districts (kreis-angehörige Städte) wherever data are available. From 1938 vehicle holdings for cities with 20,000 inh or more are included3). After WWII the time series is re-
3) The 1938 data for medium-sized towns are included in the 1954 volume, including five urban districts with less than 20,000 inh (1938). After WWII the lower population limit is generally 20,000 inh.
sumed in 1954. The cities included in the Statistical Yearbook often change. Reasons include the loss of state territory after WWII, the German division and reunification, municipal area reforms, the loss of self-administration (Kreisfreiheit) of many towns and cities, and population changes.
For 1928 the national Statistical Yearbook of Germany includes data on motorisation only for cit-ies with 100,000 inh or more. For earlier years city-level information is limited to the Hanseatic cities of Hamburg, Bremen and Lübeck plus Berlin since 1907.
As the old books are often hardly readable by software, data preparation requires considerable ef-fort. An attempt was therefore made to use data from regular, but not annual, intervals. The data were scanned, corrected manually and processed further. In order to span a period as long as possi-ble, and considering WWI, after which motorisation data were resumed from 1921, seven-year steps were chosen for the first decades (1907, 1914, 1921, 1928). For the remaining period ten-year steps were used with an interruption around WWII (1928, 1938, 1954, 1958, 1968, 1978, 1988, 1998, 2008). The data used include the number of cars (including estate cars, in early years referred to as ‘motor vehicles that prima-rily serve the transport of passengers’), motorcycles (including mopeds), other motor vehicles, and motor vehicles in total. All figures were recalculated to vehi-cles per 1,000 inh.
In order to approximate rural motorisation lev-els, sum values for the German Reich (1907–1938, without Austria in 1938) and the Federal Republic of Germany (1954–2008) were used, subtracting the data for cities. It is important to keep in mind that the area remaining after subtraction is not identical in all years of observation due to the changing composi-tion of cities. The comparability is strongly limited for 1928, as the Statistical Yearbook city-level data in that year only include cities with 100,000 inh or more. Population size classes are used to categorise cities; note that this does not fully account for the complex-ity of urban development. The same is true for the residual category of rural areas.
It also should be noted that the motorisation fig-ures calculated do not necessarily reflect private mo-torisation levels. First, the figures include company cars, which are typically registered at the firm loca-tion. Secondly, vehicles registered at manufacturers’ places are included as well. This will be considered for interpretation.
Data processing had to consider a number of specific cases. Information for Berlin during the German separation refers to Berlin (West). Data for
316 Vol. 66 · No. 4
Hannover and Aachen include the respective regions (including suburban areas) in 2008. These values were substituted by data from the Federal Statistical Offices for the two cities without their suburban hinterland. The data for Wiesbaden in 1998 include all police vehicles of the State of Hesse. This figure was therefore estimated from the adjacent years by linear interpolation.
In 1938 some data on motorcycle holdings are missing. These were estimated from cities of the same population size category, considering the gen-eral motorisation level of the respective city. In 1978 information on motorcycles is generally missing. The values were estimated by linear interpolation using the nearest year with information (1983).
The result of data preparation is a dataset in-cluding 200 cities, among those 34 are located in the former German Democratic Republic (GDR) or in former East German areas being now part of Poland. Among the remaining 166 cities, there are continuous time series from 1938 to 2008 for 80 cit-ies. Other cities are mainly small and medium-sized towns. The largest missing city is Saarbrücken, for which no data are available for the period of autono-my (1954 and 1958). There are only four further cities with more than 100,000 inh (reference: 1954) with-out a complete time series (Herne, Recklinghausen, Salzgitter, Wilhelmshaven). For these cities there is no information on 1938. For Recklinghausen there are also no data from 1978 due to loss of self-ad-ministration. The 80 cities with continuous time se-ries from 1938 are the basis for a typology of cities according to historical trends in motorisation. The types are constructed using cluster analysis with a preceding factor analysis. For the period before 1938 there is too little information, as cities with less than 100,000 inh are generally missing. The typology is used to identify typical ‘paths of motorisation’. The
interpretation of results for separate cities is heuris-tic in character. Due to lack of historical city level data covering economic and social aspects at various points in time the same is true for the explanation of differences in motorisation.
Apart from the typology, descriptive time series categorised by city size classes and comparisons be-tween the Ruhr area and other regions are presented. Size classes refer to the population of the cities in the respective year of reference. These analyses use the total sample of the respective year of observation, as this allows longer time series when comparisons are made between the Ruhr and other regions. A control analysis was performed including only the 80 cities with continuous time series. This analysis yielded only minimal differences, suggesting that the 80 cit-ies should provide a relatively representative sample.
4 The German Reich and the Federal Repub-lic of Germany, 1907 to 2008
4.1 Motorisation in urban and rural areas
The longest time series on motorisation available reach back to 1907. Only Berlin, Hamburg, Bremen and Lübeck can be distinguished as separate cities from Germany as a whole. The focus is on cars and motorcycles here. The data for all motor vehicles taken together are largely akin to those for cars.
Figure 1 shows the unchallenged top position of Berlin in the first decades of car motorisation. In 1907 almost 15% of all vehicles ‘serving primarily passenger transport’ in the German Reich were reg-istered in Berlin. These 1,449 vehicles also included public transport vehicles (busses, taxis). But even the lowest power range (up to 8 hp) included no less than 532 vehicles in Berlin, compared to only
Rural areas Urban areas Hamburg
Public transport 23 32 48
Car 15 14 18
Motorcycle/scooter 14 9 4
Bicylce 20 14 6
On foot 23 29 22
n.s. 5 2 2
Sum 100 100 100
Residence and workplace identical 30 12 12
All figures in percent. Source: hartenStein and liePelt (1961, 26 and 34)
Tab.1: Travel mode use for job trips 1960
317J. Scheiner: A century of motorisation in urban and rural contexts2012
93 in Hamburg, which had almost half as many in-habitants back then. This illustrates Berlin’s enor-mous power of innovation and economic potential at that time. It also suggests the tremendous change in perception of public spaces that must have taken place, as the 1,449 registered cars were concentrated in an area that matches today’s inner city of Berlin (63 sq.km, covering approximately the district of Berlin-Mitte plus adjacent neighbourhoods). For comparison: At the same time, 946 cars were reg-istered in Brandenburg on an area of 40,000 sq.km, 65 cars in Pomerania (30,000 sq.km). These figures match motorisation levels of 0.71 cars (Berlin), 0.27 (Brandenburg) and 0.04 (Pomerania). Compared to the German Reich as a whole, car motorisation in Berlin was four-fold stronger. The Hanseatic cities of Hamburg and Bremen also clearly exceeded the German average.
In the 1920s smaller towns and the German Reich as a whole started catching up with Berlin. On the one hand, other regions started to catch up eco-nomically, on the other hand early suburbanisation trends emerged in societal reform movements (e.g. in the settlement Eden in Oranienburg near Berlin) and in the upper classes (e.g. residences of industrial magnates). However, Berlin fell below the German average only after the collapse in WWII, caught up again to the average and fell back again not before the 1960s. Bremen and Hamburg fell below the aver-age not even before the 1970s. The smaller Hanseatic
city of Lübeck could not catch up with the larger cit-ies, neither before nor after WWII. Its motorisation level slightly exceeded that of Hamburg and Bremen only from the 1990s.
The picture looks very different for motorcycles (Fig. 2). Lübeck started clearly above the German average in 1907, holding the leading position among the cities studied until 1928 when it was overtaken by Berlin. The latter city also started slightly above average. In the 1930s all four cities studied fell well below the German average, particularly in the 1950s when mass motorisation started as a rural motorcy-cle phenomenon (see below).
The period from 1928 allows a more systematic investigation considering the whole sample of cities (Tab. 2). Trends in car ownership clearly show the initial salience of cities compared to smaller towns and rural areas. The comparison between cities from 500,000 to 1 m inh and rural areas suggests itself for quantification, as the largest cities (> 1 m inh) are strongly affected by the specific case of Berlin and the collapse in WWII. As a consequence, the 1954 motorisation level in the largest cities hardly exceed-ed that in 1938. In the other large cities (500,000-1 m inh) motorisation was twice as high as in the countryside. When the economically weak and low-motorised Ruhr area is excluded, cities and country-side even differed by factor 2.5. This salience of the cities existed similarly even in 1928, and it continued to the end of the 1950s.
0
1
10
100
1000
1907
1917
1927
1937
1947
1957
1967
1977
1987
1997
2007
Car
s p
er 1
,000
inha
bita
nts
Car motorisation levels 1907 to 2008
BerlinLübeckBremenHamburgGermany
Fig. 1: Motorisation trends (cars) 1907–2008. The Y-axis is logarithmic, as otherwise differences cannot be detected in early years due to small values. Values for 2008 were extrapolated from 2007 including temporarily de-registered vehicles that are excluded from official statistics since 2008. Values for years without data (see section 3) are interpolated
318 Vol. 66 · No. 4
Not earlier than in the 1960s did the countryside catch up with the cities in terms of car ownership, and not before the 1970s the urban-rural decline turned around. In the decade between 1958 and 1968 the general level of motorisation increased almost four-fold from 54 to 196 cars per 1,000 inh, but almost five-fold from 44 to 204 in rural areas. This matches the period of the first wave of suburbanisation. Hence, these figures probably do not only reflect a catch-up motorisation of the rural population, but also an im-port of vehicles by in-moving urban residents who transformed the countryside into suburbia – similar to the USA after WWI, where higher motorisation levels have been observed in the suburban countryside than in the inner city (Flink 1988, 134). Over this period the countryside – which was no original rural area anymore now – rose from the last to the first position in car ownership among all categories shown in table 2. Today the level of car ownership in cities (500,000-1 m inh) is 22% lower than in rural areas.
Besides middle-class residential suburbanisation, increasing affluence in rural areas was supported by counterurbanisation processes that stretched out into the countryside since about the 1980s. Car diffusion was also supported by the modernisation and exten-sion of rural road networks in the 1960s and 1970s, as well as by rail closures and cutback of public transport services in the countryside, with the consequence of decreasing competitiveness of public transport.
There was no such turnaround with motorcy-cles. Motorcycle ownership was on a similar level in all municipality size classes as well as in rural areas in
1928. By 1938 the motorcycle had become a typical rural vehicle, reaching a considerably above-average level of ownership. Again this was partly a conse-quence of the poor condition of rural roads, which made car-driving difficult and slow. Quickly after WWII a first wave of mass motorisation began in which the number of motorcycles by far exceeded the number of cars for a short time. In this period mo-torcycles were still concentrated in the countryside.
It is also striking that spatial differences in mo-torisation were considerably more pronounced in early years than today, although the absolute differ-ences between municipality size classes were relative small due to the low absolute level of vehicle own-ership. In order to capture this observation statis-tically, variation coefficients of motorisation are compared over the years (Tab. 3). The variation co-efficient is defined as the standard deviation divided by the arithmetic means. Hence, it is independent of measurement units and, therefore, of the absolute level of motorisation. Both the variation coefficients of vehicle ownership and car ownership starkly de-creased over the study period until about 1980, but increased afterwards. The decrease reflects that mo-torisation was strongly affected by local conditions in early decades, e.g. by a city’s economic power. The ongoing distribution of cars over the population led to decreasing relevance of such conditions (re-gional differences in the USA had already decreased in the 1920s, see Flink 1988, 140). The increasing differences since 1980 are likely to be not so much induced by new economic inequalities but by urban
0
1
10
100
1907
1917
1927
1937
1947
1957
1967
1977
1987
1997
2007
Mot
orcy
cles
per
1,0
00 in
habi
tant
s
Motorcycle motorisation levels 1907 to 2008
Berlin
LübeckBremenHamburgGermany
Fig. 2: Motorisation trends (motorcycles) 1907 to 2008Motorcycles incl. mopeds. See remarks below figure 1
319J. Scheiner: A century of motorisation in urban and rural contexts2012
structures. Growing divergence in travel behaviour has already been observed in recent decades between cities and the highly-motorised countryside includ-ing small and medium-sized towns (Scheiner 2006). This divergence may reflect, firstly, that cities tend to become the last areas that provide good alternatives to the private car (well-established public transport,
proximate destinations). Secondly, it may reflect the selective out-migration of car-oriented individuals while those without a car tend to stay or move in (‘residential self-selection’, cao et al. 2009).
Some examples may illustrate the variation be-tween cities in early years. Exceptionally high lev-els of car ownership could be found in 1928 in the
Motorcycles incl. mopeds. See remarks below figure 1** Rural areas: all municipalities that are not separately listed in the Statistical Yearbook of German Municipalities (essentially all districts except for urban districts). The term ‚rural area‘ is therefore only approximately correct
1928 1938 1954 1958 1968 1978 1988 1998 2008*
Motor vehicles per 1,000 inh> 1 m inh 18 50 57 90 221 342 444 468 488
500,000-1 m inh 19 52 96 124 232 363 479 523 548
300-500,000 inh 17 48 74 98 209 367 480 522 606
100-300,000 inh 16 50 81 114 223 370 494 537 581
50-100,000 inh 43 80 108 227 389 518 554 613
20-50,000 inh 13 48 86 115 227 397 535 602 660
Rural** 46 98 127 254 423 580 647 744
Total 15 47 90 120 242 401 545 604 682
Cars per 1,000 inh> 1 m inh 9 25 27 59 184 284 394 408 427
500,000-1 Mio, inh 9 25 44 80 192 305 433 458 482
300-500,000 inh 8 23 33 60 174 310 432 456 529
100-300,000 inh 7 24 34 67 184 311 444 467 509
50-100,000 inh 20 32 62 185 320 457 478 534
20-50,000 inh 5 22 33 64 182 326 469 517 572
Rural** 16 22 44 204 370 491 536 616
Total 6 24 27 54 196 346 470 508 574
Motorcycles per 1,000 inh> 1 m inh 6 17 15 16 3 10 18 23 32
Tab. 2: Motorisation trends by city size category 1928 to 2008
320 Vol. 66 · No. 4
cities of Dresden, Chemnitz, Frankfurt/Main and Cologne, with 11 cars per 1,000 inh, respectively. The leading position was held by Stuttgart with 14 cars, not incidentally one of the most important ear-ly locations of the automotive industry, just as the other cities listed except for Dresden. At the bottom end Gelsenkirchen, Bochum, Dortmund, Essen and other Ruhr cities could be found, which had 2–4 cars per 1,000 inh, and the tail end were Hindenburg (Silesia) and Oberhausen (Ruhr) with 1.7 cars, re-spectively. In 1938 car motorisation reached 5–15 cars in cities with a low level, but 30–48 cars – i.e. three to four times as many – in highly-motorised cities, including those listed above plus Düsseldorf, Saarbrücken, Munich, Hannover, Darmstadt, Erfurt and Freiburg. At that time the car must have played an enormous role in individuals’ specific experience of cities. When a Ruhr worker travelled to nearby Düsseldorf, road traffic must have shaped his image of the city considerably, compared to what he was used to from home.
After WWII Frankfurt/Main and the new Federal capital of Bonn were the first cities to reach the threshold of 100 cars per 1,000 inh, Munich and Stuttgart being marginally below. The Ruhr cities as well as industrial and port cities such as Bremerhaven, Kiel, Lübeck or Salzgitter achieved only half that level (40–50 cars). In 1978 the range had shrunken to 260 (Berlin (West)) to 380 cars (Baden-Baden), the top value being only 1.5 times larger than the tail-end. The range expanded again in later years, yet without achieving the inital massive spatial inequal-ity. Today, car ownership in the highest level cities (Schwabach, Zweibrücken, Baden-Baden, Neustadt/Weinstraße, Dessau, Aschaffenburg) reaches 617 to 649 cars, which is about 70–75% more than in tail-end Berlin (366 cars), and 50% more than in other low level cities such as Halle/Saale, Leipzig, Rostock or Hannover (417–420 cars)4).
4) In this comparison, the exceptional cases of Ingolstadt and Wolfsburg have been excluded, because the extremely high levels in these two cities are due to vehicles registered at the head offices of car manufacturers (Audi and VW, respectively).
Again, motorcycle trends are somewhat differ-ent. Motorcycle holdings were on a high level in 1928 in cities where car holdings are so as well: Munich, Frankfurt/Main, Chemnitz, Stuttgart. However, these cases were complemented by cities with a high level of motorcycle, but not car ownership which are exclusively located in South Germany, mostly in Bavaria. Among these are Nuremberg, Ansbach, Augsburg, Karlsruhe, Mannheim, Ludwigshafen, Freiburg, Würzburg, Bamberg, Freising, Ingolstadt, Landshut, Rosenheim and more. In the years follow-ing WWII some Northern cities joined these ‘mo-torcycle cities’, but the focus clearly remains in the South until today. Motorcycle variation coefficients decreased over time, suggesting catch-up motorisa-tion. In the 1960s and 1970s, however, the variation coefficients strongly increased. In this period motor-cycle holdings generally decreased starkly, and the decrease was less pronounced in areas where motor-cycles held a prominent position, which led to new spatial disparities in holdings. Starting with the new increase in motorcycle ownership since the 1980s the variation evened out at a level which had already been achieved in the 1950s.
4.2 The Ruhr area
The Ruhr area is undoubtedly a specific case in motorisation trends. If any, the Upper Silesian indus-trial district may be similar, including the cities of Hindenburg and Gleiwitz (now Zabrze and Gliwice), which also had an extremely low motorisation level in the 1920s and 1930s. The Upper Silesian district, however, is much smaller in size. Other cities with a very low motorisation level at that time are port cities (Emden, Cuxhaven, Harburg-Wilhelmsburg, Altona, Stettin, Lübeck) and some medium-sized rural towns (e.g. Zweibrücken, Pirmasens, or Neumünster). Nowhere else, however, was there such a concentrat-ed ‘under-motorisation’ as in the Ruhr.
With reference to 1928, comparing Ruhr cities to other cities shows that the level of car motorisation was only a third to half as high in the Ruhr as else-where in any city size class (Tab. 4). Similar propor-
Tab. 3: Variation coefficients of motorisation 1928 to 2008
321J. Scheiner: A century of motorisation in urban and rural contexts2012
tions can be observed for motorcycles. These figures reflect the relatively poor working class population in this region, while the proportions of middle and up-per class citizens were distinctly low (see for similar observations again Flink 1988, 134).
The Ruhr had started to catch up in 1938 (not included in the table). This refers particularly to mo-torcycles, which were more affordable for blue-collar workers than cars. Car ownership had now achieved half, motorcycle ownership two thirds the level of other cities. In terms of motorcycles the Ruhr was therefore not as poor as with cars. Hence, the mo-torcycle served to compensate the lack of financial means in poorer regions to some extent.
Even in 1968 motorisation in the Ruhr region was clearly lower than in other regions. Car owner-ship had achieved 80% the level of other cities with similar size, while for motorcycles the same level had been achieved.
Today the Ruhr has caught up completely in terms of cars. In cities between 500,000 and 1 m inh the motorisation level is even slightly higher in the Ruhr than elsewhere, and the Ruhr has clearly over-taken other regions in terms of motorcycles, the level being 20% higher in the Ruhr, city size categories considered. This is mainly due to the renaissance of motorcycles since the 1990s.
4.3 Typical paths of motorisation in German cities
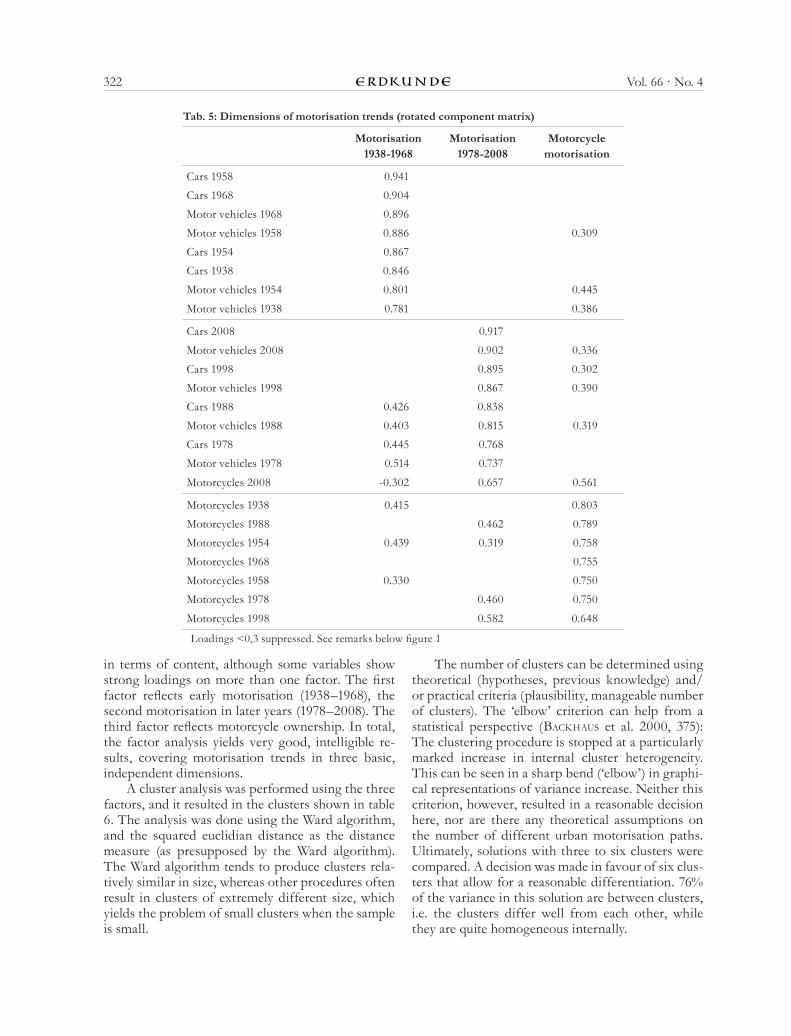
Quantitative typologies are usually made by cluster analysis. Objects (here: cities) are grouped together in a way as to maximise heterogeneity be-tween clusters and minimise heterogeneity within clusters based on defined criteria. The criteria (vari-ables) used here are motorisation levels for ten points in time. The variables are strongly correlated, and hence cluster analysis is not straightforward. Factor analysis was therefore used to merge the variables into uncorrelated dimensions (BackhauS et al. 2000). The years prior to 1938 were excluded because there is no information on small to medium-sized towns. Motorisation is measured as the number of cars, mo-torcycles and motor vehicles in total (per 1,000 inh, respectively). The use of other variables (cars and motorcycles only; cars only; cars, motorcycles and other motor vehicles) led to similar results. Principal components were used as the method of extraction, and the factors derived were rotated using the var-imax method.
The factors are shown in table 5. They explain 84.8% of the input variables’ variance. Due to out-liers in 1954 – a result of WWII – the analysis was re-run excluding the 1954 values, yielding virtually identical results. The factors are easily accessible
Motor vehicles per 1,000 inh Cars per 1,000 inh Motorcycles per 1,000 inh1928 1968 2008 1928 1968 2008 1928 1968 2008
Ruhr area> 1 m inh
500,000-1 m inh 8 196 564 4 165 496 2 3 40
300-500,000 inh 8 181 602 3 153 522 3 3 41
100-300,000 inh 8 185 585 3 156 513 2 3 44
50-100,000 inh 177 150 3
Total 8 187 582 3 158 509 2 3 42
Other cities> 1 m inh 18 221 488 9 184 427 6 3 32
500-1 m inh 23 244 544 10 201 479 8 3 32
300-500,000 inh 22 236 608 10 194 532 8 3 42
100-300,000 inh 17 230 580 7 189 509 6 4 36
50-100,000 inh 234 613 190 534 5 37
< 50,000 inh 227 660 182 572 6 43
Total 19 231 554 9 190 486 7 4 35
Germany 15 242 682 6 196 547 7 5 49
Tab. 4: Motorisation trends by city size category 1928 to 2008 – the Ruhr area compared to other cities
322 Vol. 66 · No. 4
in terms of content, although some variables show strong loadings on more than one factor. The first factor reflects early motorisation (1938–1968), the second motorisation in later years (1978–2008). The third factor reflects motorcycle ownership. In total, the factor analysis yields very good, intelligible re-sults, covering motorisation trends in three basic, independent dimensions.
A cluster analysis was performed using the three factors, and it resulted in the clusters shown in table 6. The analysis was done using the Ward algorithm, and the squared euclidian distance as the distance measure (as presupposed by the Ward algorithm). The Ward algorithm tends to produce clusters rela-tively similar in size, whereas other procedures often result in clusters of extremely different size, which yields the problem of small clusters when the sample is small.
The number of clusters can be determined using theoretical (hypotheses, previous knowledge) and/or practical criteria (plausibility, manageable number of clusters). The ‘elbow’ criterion can help from a statistical perspective (BackhauS et al. 2000, 375): The clustering procedure is stopped at a particularly marked increase in internal cluster heterogeneity. This can be seen in a sharp bend (‘elbow’) in graphi-cal representations of variance increase. Neither this criterion, however, resulted in a reasonable decision here, nor are there any theoretical assumptions on the number of different urban motorisation paths. Ultimately, solutions with three to six clusters were compared. A decision was made in favour of six clus-ters that allow for a reasonable differentiation. 76% of the variance in this solution are between clusters, i.e. the clusters differ well from each other, while they are quite homogeneous internally.
Motorisation 1938-1968
Motorisation 1978-2008
Motorcycle motorisation
Cars 1958 0.941
Cars 1968 0.904
Motor vehicles 1968 0.896
Motor vehicles 1958 0.886 0.309
Cars 1954 0.867
Cars 1938 0.846
Motor vehicles 1954 0.801 0.445
Motor vehicles 1938 0.781 0.386
Cars 2008 0.917
Motor vehicles 2008 0.902 0.336
Cars 1998 0.895 0.302
Motor vehicles 1998 0.867 0.390
Cars 1988 0.426 0.838
Motor vehicles 1988 0.403 0.815 0.319
Cars 1978 0.445 0.768
Motor vehicles 1978 0.514 0.737
Motorcycles 2008 -0.302 0.657 0.561
Motorcycles 1938 0.415 0.803
Motorcycles 1988 0.462 0.789
Motorcycles 1954 0.439 0.319 0.758
Motorcycles 1968 0.755
Motorcycles 1958 0.330 0.750
Motorcycles 1978 0.460 0.750
Motorcycles 1998 0.582 0.648
Loadings <0,3 suppressed. See remarks below figure 1
Tab. 5: Dimensions of motorisation trends (rotated component matrix)
323J. Scheiner: A century of motorisation in urban and rural contexts2012
In Cluster 1 (low motorisation) motorisation levels were extremely low in 1938 (Tab. 7) and re-mained considerably below average despite some catch-up. This is true for both cars and motorcycles.
As Berlin is in this cluster it should be noted that the analysis is limited to the period from 1938, masking the turbulent start of motorisation in Berlin at the dawn of the 20th century.
Cluster 1 2 3 4 5 6
Motoris-ation trend
Strongly below average, extremely below average at the beginning, no complete catch-up
Cars high at the beginning; falling back. Motorcycles at an average at the beginning, then falling back
Below average at the beginning, catching up, today at an average
Cars very high at the beginning, still above average today. Motorcycles low, today at an average after in-between maximum
Motorcycle extremely high at the beginning, today still above average. Cars high at the beginning, today at an average
Motorcycles strongly above average from the beginning. Cars low at the beginning, today high
Motoris-ation type
Low motorisation
Early motorised, falling back
Catch-up motorisation
Early motorised car city
Early motorised motorcycle city
Motorcycle city with catch-up car motorisation
Cities Aachen Berlin Bremerhaven Dortmund Duisburg Emden Gelsenkirchen Kiel Lübeck Oberhausen
Tab. 6: Motorisation paths – a typology of German cities: clustered cities
324 Vol. 66 · No. 4
In Cluster 2 motorisation level with cars and ve-hicles in total was already very high in 1938, but fell below average in subsequent decades. This is similarly true for motorcycles, except that motorcycle owner-ship started from an average level. Cluster 2 is therefore characterised as early motorised, but falling back.
Cluster 3 started below average, but caught up to an average level. This is equally true for cars and mo-torcycles, and hence Cluster 3 may be termed catch-up motorisation.
In Cluster 4, car ownership started from a very high level, and is still above average. Motorcycle
Tab. 7: Motorisation levels in the clusters. See remarks below figure 1
325J. Scheiner: A century of motorisation in urban and rural contexts2012
ownership started from a low level, and reached an average level today after a maximum in the 1960s and 1970s. The constantly above-average level of car ownership is most striking, yet. Thus, Cluster 4 may be termed an early motorised car city.
As opposed, motorcycle ownership was ex-tremely high in 1938 in Cluster 5, and it is still above average. Car motorisation declined over time from a high to an average level. The values for motorcycles are salient in this cluster, and hence it may be charac-terised as an early motorised motorcycle city.
In Cluster 6 motorcycle ownership is also far above average, reaching even higher values than in Cluster 5 today. Car motorisation was clearly below average in 1938, but is above average today. Cluster 6 is therefore called motorcycle city with catch-up car motorisation.
The clusters differ not only with respect to mo-torisation trends, but also in terms of the character of the cities included (Tab. 6).
The clusters 1 and 2 include the largest cities. Cluster 1 is mainly characterised by three types of cities: Ruhr cities, port cities, and Berlin (that could be considered a separate ‘type’ not only with respect to motorisation). Cluster 2 mainly combines regional capitals (Landeshauptstädte), cities with a long histori-cal tradition, distinguished research cities and cities that accumulated wealth with a particular branch of economy (e.g. Pforzheim: jewelry; Krefeld: textile goods).
In Cluster 3, three cities had more than 300,000 inh in 1938 as well as 2008, i.e. Essen, Bochum and Wuppertal. The focus in Cluster 3 is on smaller major cities, among which the Bergisches Land (Remscheid, Solingen, Wuppertal) as well as the Ruhr and adja-cent areas (Bochum, Essen, Bottrop, Hagen, Hamm, Mülheim, Mönchengladbach) dominate. Besides, solitary, often peripheral locations in the countryside stand out (Flensburg, Hof, Münster, Neumünster, Oldenburg, Osnabrück, Straubing). Generally the focus is more in the North than in the South.
The clusters 4 and 5 are clearly characterised by medium-sized towns. In 1938 as well as 2008 all cit-ies and towns in these clusters had less than 300,000 inh. The main difference between the two clusters is their regional distribution. While the focus of Cluster 4 is in Palatinate, Bavaria dominates Cluster 5.
Cluster 6 gathers the smallest towns. In 1938, 12 out of 13 towns had less than 50,000 inh. By 2007 three towns had passed the threshold of 100,000 inh (Regensburg, Ingolstadt and Erlangen) and become smaller major cities. Again, Bavaria domi-nates Cluster 6. However, the focus is more on
Northern and Eastern Bavaria than in Cluster 5 (Amberg, Aschaffenburg, Coburg, Erlangen, Passau, Regensburg, Schwabach, Weiden), i.e. on more re-mote regions, seen from a Bavarian perspective. The cluster also includes some Palatinate cities.
The distinct separation between North and South Germany in the clusters calls for interpreta-tion. The regional focus of motorcycle ownership in South Germany may not be explained by the loca-tions of manufacturers. Prior to WWII there was no important production site for motorcycles in Bavaria to the best of the author’s knowledge. Differences in transport policy should not play a distinct role either (see discussion in Schmucki 1995).
A combination of resource availability and re-quirements may serve for interpretation. Concerning requirements, topography may play a certain role. In hilly terrain the motorcycle may have been a con-venient substitute for the bicycle before more afflu-ence made way for the diffusion of the car. However, this is not likely to be a sufficient explanation. Resource availability combined with requirements could also point towards farming on a sideline ba-sis (Nebenerwerbslandwirtschaft), which may render a motor vehicle necessary. The necessity arises, first, from the combination of several gainful jobs and the associated complex daily life and scarce time budg-et and, second, from fragmented land estates with long trips in between. This in turn points towards the spatial distribution of Realteilung (South German inheritance law under which land was equally divid-ed among all sons). As opposed, under the North German Anerbenrecht land was inherited completely by one person (typically the eldest son). This did not require motor vehicles to the same extent either for the inheriting son who stayed a farmer or for his sib-lings who became employees in other branches of economy.
This lack of requirements may also serve to ex-plain the composition of Cluster 3 which started from a low motorisation level. First, this cluster includes a number of industrial cities at the Ruhr (Bottrop, Bochum, Essen, Hagen, Mülheim) and in the Bergisches Land (Remscheid, Solingen), which were characterised by a relatively poor industrial workforce with short daily trips. Second, it includes some medium-sized administrative cities in rural are-as (Flensburg, Neumünster, Osnabrück, Oldenburg) that probably had a relatively low affluence level plus a lack of requirements for long trips.
Given that this interpretation is accepted the question arises why some South German cities achieved a high level of car ownership in early years,
326 Vol. 66 · No. 4
whereas others started with motorcycles. Concerning this issue requirements probably play less of a role than chance in terms of affluence level. In Cluster 6 the high level of motorcycle but low level of car own-ership in early years stands out. This reflects a ‘poor’ type of medium-sized towns in which households could typically afford a motorcycle (possibly with a passenger seat), but not a car in early decades. The opposite model is Cluster 4 with its early high level of car motorisation. This includes wealthy cultural centres and residencies such as Baden-Baden and Wiesbaden, and cities which gained affluence from industry, viniculture or the military, e.g. Pirmasens (shoe manufacturing), Neustadt at the Weinstraße (viniculture), Landau (viniculture, military) or Koblenz (military). Cluster 5 is in a sense a combi-nation of clusters 4 and 6. The above average own-ership level of cars and motorcycles points towards prosperity plus strong requirements for motorised transport even among less affluent households.
Besides economy, political factors may play a role. This refers not so much to transport policy in terms of spatial differences in the promotion of motorisation than to the quality of the road net-works. High standard roads may contribute to ex-plain the early high level of motorisation in regional capitals such as Munich, Stuttgart or Nazi-promoted Nuremberg. Conversely, the lack of quality in rural roads and tracks contributes to the low car motorisa-tion in rural areas until the 1960s. A higher degree of modernity in road networks in Prussia (Northern Germany) may also contribute to explain the lower level of car motorisation in South Germany.
There is only limited evidence for the specu-lation that key sites of automobile industry have a conspicuously positive impact on (car) motorisation. Wolfsburg had a clearly above average level of mo-torisation from the beginning. However, this city was excluded from cluster analysis due to missing values in 1938, the city’s year of foundation. Many key locations of automobile industry are in Cluster 2 and showed high motorisation levels in early dec-ades: Munich, Stuttgart, Cologne, Bremen, and Frankfurt (Rüsselsheim). However, the motorisa-tion level of Bremen fell from above-average to be-low-average, measured against other cities of simi-lar size. Motorisation figures in Munich, Stuttgart and Frankfurt remained on high levels, and that of Cologne was only at an average from the start.
In this respect it is interesting to look at cities where large automobile production facilities were es-tablished within the study period, e.g. Emden (VW, 1964), Bochum (Opel, 1962), Kassel/Baunatal (VW,
1958), Ingolstadt (Horch/Audi, 1950) or Regensburg (BMW, 1986). Assuming an important impact of the local automotive industry, a disproportionate in-crease in motorisation after the establishment has to be expected, compared to other cities of the same size. There appears to be evidence for this assump-tion in some cases, namely Emden, Ingolstadt and Bochum (without table). These cities, however, are cases of catch-up motorisation starting from a low level. Looking at a reference example that did not experience the establishment of automotive industry (Dortmund) shows that the catch-up process oc-curred at the same time and to the same extent as in Bochum. Other cases (Regensburg, Kassel) show a mixed picture. While in Regensburg a dispropor-tionate increase in motorisation since the 1980s can be seen, Kassel even tends to fall back.
In total, the evidence for a strong impact of the local automotive industry on motorisation is not fully convincing, even when in some cases the in-dustry may play an important role, particularly when firm vehicles of the manufacturer are registered in the respective city. The findings could look differ-ent if the brand composition of the local vehicle fleet was studied rather than motorisation levels. SchamP (2004) shows associations between manufactur-ing and vehicle type choice on a regional level, and Schmid et al. (1994, 200ff.) point these out on a na-tional level as a reflection of patriotism.
5 Outlook
Motorisation has shaped the 20th century in eco-nomic, social, spatial, technical and cultural terms. This paper studied spatial aspects of motorisation based on longitudinal data for German cities, span-ning trends over a century. The urban start of mo-torisation that has often been mentioned by trans-port historians, but rarely studied systematically, be-comes apparent. The turnaround in car ownership levels between urban and rural areas was not before the 1960s, in North Rhine-Westphalia even in the 1970s (Scheiner 2010), when today’s above-aver-age car ownership levels in suburban and rural ar-eas emerged. As opposed, the motorcycle was more common in rural areas and less affluent cities even before WWII.
A typology of motorisation trends in cities over the period 1938 to 2008 shows different paths in ur-ban motorisation. Differences may emerge from a number of factors, such as affluence level, economic structures including agriculture and related inherit-
327J. Scheiner: A century of motorisation in urban and rural contexts2012
ance law, vehicle fleets of firms and public adminis-tration, as well as the quality of road networks and public transport services. These factors have to be seen against the background of spatial form and processes, most noticeably suburbanisation.
The typology shows close associations with city size classes. Most large cities are gathered in a clus-ter characterised by initially high, but falling back motorisation levels. The Ruhr area, port cities, and Berlin are exceptions from this pattern caused by economy. Medium-sized towns spread over various types that differ in trends concerning the car and the motorcycle. City size classes and economic affluence are superimposed by regional focuses that are char-acterised by distinct trends for cars and motorcycles.
There are a number of questions arising for fu-ture research that can only briefly be noted here. Among these are the following:• How do motorisation trends in rural areas differ
between regions over and above differences bet-ween cities?
• Can various paths of motorisation be better tra-ced back to causes? Can the heuristic interpreta-tion suggested in this paper be verified by using economic and social, maybe even infrastructural variables describing cities or regions?
• Which picture emerges when cities or other spatial units are categorised by impact factors of motori-sation rather than motorisation trends themselves? Doing so would permit to study motorisation as dependent on the urban (or spatial) type.
Answering these and other questions would not only contribute to better understand motorisation history, but could also shed new light on forecasting future transport trends.
Acknowledgements
The author wants to thank Prof. Dr. Eike W. Schamp for his valuable comments on a draft ver-sion of this paper and Dr. Martin Schaad for his support in eliminating idiosyncratic language.
References
aSmuS, W. (1995): Grundzüge und Auswirkungen der Motorisierungsentwicklung in einer Region: Beispiel Schleswig-Holstein. In: niemann, H. and hermann, A. (eds.): Die Entwicklung der Motorisierung im Deut-schen Reich und den Nachfolgestaaten. Stuttgart, 184–194.
BackhauS, K.; erichSon, B.; Plinke, W. and WeiBer, R. (20009): Multivariate Analysemethoden. Berlin.
Barker, T. (1993): Slow progress. Forty years of motoring research. In: Journal of Transport History, 3 rd series 14 (2), 142–165.
Berger, M. (1979): The devil wagon in god’s country. The au-tomobile and social change in rural America, 1893–1929. Hamden, CT.
Blaich, F. (1987): Why did the pioneer fall behind? Mo-torisation in Germany between the wars. In: Barker, T. (ed.): The economic and social effects of the spread of motor vehicles Basingstoke, London, 148–164.
canzler, W. and Schmidt, G. (eds.) (2003): Das zweite Jahrhundert des Automobils. Technische Innovationen, ökonomische Dynamik und kulturelle Aspekte. Berlin.
cao, X.; mokhtarian, P. and handy, S. (2009): Examining the impacts of residential self-selection on travel behav-iour: a focus on empirical findings. In: Transport Re-views 29, 359–395. DOI: 10.1080/01441640802539195
Deutscher Städtetag (ed.): Statistisches Jahrbuch deutscher Gemeinden. Berlin (various volumes).
edelmann, H. (1989): Vom Luxusgut zum Gebrauchsge-genstand. Die Geschichte der Verbreitung von Perso-nenkraftwagen in Deutschland. Frankfurt a. M.
Flink, J. (1988): The automobile age. Cambridge, MA.FoSter, M. (19832): The automobile and the city. In: leW-
iS, D. and goldStein, L. (eds.): The automobile and American culture. Ann Arbor, 24–36.
hartenStein, W. and liePelt, K. (1961): Man auf der Straße. Eine verkehrssoziologische Untersuchung. Frankfurt a. M.
interrante, J. (19832): The road to autopia: the automobile and the spatial transformation of American culture. In: leWiS, D. and goldStein, L. (eds.): The automobile and American culture. Ann Arbor, 89–104.
JürgenS, C. and kaSPer, B. (2006): Alltagsmobilität, Raum und Lebensstile. In: Beckmann, K. J.; heSSe, m.; holz-rau, c. and hunecke, M. (eds.): StadtLeben – Woh-nen, Mobilität und Lebensstil. Wiesbaden, 125–141.
kuhm, K. (1995): Das eilige Jahrhundert: Einblicke in die automobile Gesellschaft. Hamburg.
laux, J. (1992): The European automobile industry. New York.
ling, P. (1990): America and the automobile: technology, reform and social change, 1893–1923. Manchester, New York.
lötScher, l.; mayer, o. and monheim, R. (2001): Ent-wicklung der privaten Motorisierung. In: Leibniz-Insti-tut für Länderkunde (ed.): Nationalatlas Bundesrepub-lik Deutschland Vol. 5: Verkehr und Kommunikation. Heidelberg, Berlin, 62–63.
MBV NRW (Ministerium für Bauen und Verkehr des Lan-des Nordrhein-Westfalen) (2007): Mobilität in NRW – Daten und Fakten 2007. Düsseldorf.
328 Vol. 66 · No. 4
merki, C. M. (2002): Der holprige Siegeszug des Automo-bils 1895–1930. Zur Motorisierung des Straßenverkehrs in Frankreich, Deutschland und der Schweiz. Wien.
niemann, H. and hermann, A. (eds.) (1995): Die Entwick-lung der Motorisierung im Deutschen Reich und den Nachfolgestaaten. Stuttgart.
PreiSendörFer, P. (2001): Sozialprofil und Lebenslage von Haushalten ohne Auto. In: Kölner Zeitschrift für Sozio-logie und Sozialpsychologie 53, 734–750.
SachS, W. (1984): Die Liebe zum Automobil. Reinbek.SchamP, E. W. (2004): Automobilindustrie: Standorte und
Zulieferverflechtungen. In: Leibniz-Institut für Länder-kunde (ed.): Nationalatlas Bundesrepublik Deutschland Vol. 8: Unternehmen und Märkte. Heidelberg, Berlin, 64–67.
Scheiner, J. (2006): Does individualisation of travel behav-iour exist? Determinants and determination of travel participation and mode choice in West Germany, 1976–2002. In: Die Erde 137, 355–377.
– (2010): 80 Jahre Motorisierung in Stadt und Land: Fallstu-die Nordrhein-Westfalen. In: Internationales Verkehrs-wesen 62, 17–21.
Schmid, G.; lindenBaum, H. and Staudacher, P. (1994): Bewegung und Beharrung. Transport und Transportsys-teme in Österreich 1918–1938: Eisenbahn, Automobil, Tramway. Wien.
Schmucki, B. (1995): Automobilisierung. Neuere Forschun-gen zur Motorisierung. In: Archiv für Sozialgeschichte 35, 582–597.
Statistisches Bundesamt (ed.): Statistisches Jahrbuch für die Bundesrepublik Deutschland. Wiesbaden: Statistisches Bundesamt (various volumes)
Statistisches Reichsamt (ed.): Statistisches Jahrbuch für das Deutsche Reich. Berlin (ed. up to 1914: Kaiserliches Sta-tistisches Amt; various volumes)
Voigt, F. (1965): Verkehr. Vol. 2: Die Entwicklung des Ver-kehrssystems. Berlin.
Author
PD Dr. Joachim ScheinerTU Dortmund University
Faculty of Spatial PlanningDepartment of Transport Planning