This paper presents the simulation studies on the effect of velocity and pressure distributions
in wet gas metering of slotted orifice flow using Computational Fluid Dynamic (CFD)
simulations with the Gambit 2.4.6 and Fluent 6.3.26 software. The effect of velocity and
pressure distributions in wet gas metering using slotted orifice flow meter was clearly
understand by fully developed a turbulent condition in the 1.6 in long horizontal pipe line
equipped with slotted orifices having a 3 ratio of 0.40. Air mass flow rate and volume fraction
were varied in the range from 0.33 kg/s to 0.80 kg/s and 0.90 to 1.00, respectively. Pressure
was also varied in the range of 240000 - 360000 Pa. The slotted orifice results were also
compared with the standard orifice with the same 3 ratio. Gambit 2.4.6 mesh-generator was
employed to perform all geometry generation and meshing. The relatively higher over-
reading values obtained in this work was consistent with the results of that for a slotted
orifice, a low P ratio was more sensitive to the liquid presence in the stream and hence was
preferable for wet gas metering. Total mass flows for the wet gas get from the simulations
were varied from the 0.3376 kg/s to 0.8000 kg/s. In conclusion, the numerical results indicate
that pressure drop and static pressure recovery was better with the slotted orifice, and hence
was preferable for wet gas metering. Moreover, with the rectangular slots, the static pressure
recovery improves marginally as the aspect ratio increases. It was also found that the slotted
orifice was more sensitive to wet gas flow compared to the standard orifice.
Key words: Wet gas metering, velocity and pressure distributions, Computational Fluid
Dynamics (CFD), slotted orifice flow meter.
VIII
ABSTRAK
Kertas kerja mi membentangkan kajian simulasi mengenai kesan halaju dan tekanan agihan
dalam pemeteran gas basah aliran berlubang menggunakan simulasi Komputasi Dinamik
Bendalir (CFD) melalui perisian Gambit 2.4.6 dan Fluent 6.3.26. Kesan halaju dan tekanan
agihan dalam pemeteran gas basah menggunakan meter aliran berlubang telah difahami
dengan jelas dengan menghasilkan keadaan bergelora dalam 1.6 m panjang talian paip
mendatar dilengkapi dengan plat berlubang mempunyai nisbah 0 daripada 0.40. Kadar aliran
jisim udara dan jumlah pecahan telah diubah dalam julat dari 0.33 kg I s kepada 0.80 kg / s
dan 0,90-1,00, masing-masing. Tekananjuga diubah dalam lingkungan 240000 -. 360000 Pa.
Keputusan pemeteran aliran berlubang juga dibandingkan dengan standard meter dengan
nisbah f3 yang sama. Gambit 2.4.6 mesh-penjana telah digunakan untuk melaksanakan semua
generasi geometri dan bersirat. Yang lebih tinggi nilai lebih-bacaan yang diperolehi dalam
kerja-kerja mi adalah selaras dengan keputusan itu bagi suatu meter plat berlubang, nisbah 0 yang rendah adalah lebih sensitif kepada kehadiran cecair di dalam sungai itu dan oleh itu
adalah lebih baik untuk pemeteran gas basah. Jumlah jisim aliran gas basah diperoleh dan
simulasi telah divariasi diantara 0,3376 kg / s hingga 0,8000 kg / s. Kesimpulannya,
keputusan berangka menunjukkan bahawa kejatuhan tekanan dan pemulihan tekanan statik
adalah lebih baik dengan meter plat berlubang, dan oleh itu adalah lebih baik untuk
pemeteran gas basah. Selain itu, dengan slot segi empat tepat, pemulihan tekanan statik
adalah lebih baik sedikit seiring dengan kenaikan aspek nisbah. Ia juga mendapati bahawa
meter plat berlubang adalah lebih sensitif kepada aliran gas basah berbanding dengan
standard meter.
Kata kunci: pemeteran gas basah, halaju dan tekanan pengagihan, Komputasi Dinamik
Bendalir (CFD), meter aliran plat berlubang.
Ix
TABLE OF CONTENTS
MILESTONE 36 SUPERVISOR'S DECLARATION iv STUDENT'S DECLARATION v DEDICATION VI ACKNOWLEDGEMENT VII ABSTRACT ABSTRAK TABLE OF CONTENTS Error!
Bookmark not defined.VIII
LIST OF FIGURES XIIX LIST OF TABLES XII LIST OF ABBREVIATIONS XIII I INTRODUCTION i
1.1 Brief Introduction and Problem Statement 1-2 1.2 Motivation 2-5 1.2.1 Summary 1.3 Objectives of Study 6 1.4 Scope of this research 6 1.5 Hypothesis 6 1.6 Main contribution of this work 7 1.7 Organisation of this thesis 7
perforations ofl/w = 3.0 (B) circular perforations (C) standard orifice
Fig.5. Pressure distribution upstream and downstream of the horizontal pipe 29
equipped with different orifices, J3 0.40, mg = 0.50 kg/s, GVF = 0.98.
Fig.6. Pressure distribution upstream and downstream of the horizontal pipe 30
equipped with a slotted orifice with rectangular perforations of l/w = 3.0, 13 =
0.40, GVF of 0.98
Fig.7. Pressure distribution upstream and downstream of the horizontal pipe 31
equipped with a slotted orifice with rectangular perforations of l/w = 3.0, 13 = 0.40, mg 0.50 kg/s.
Fig. 8. Pressure drop measured as area-weighted average static pressure at the 31
standard flange taps, 13 = 0.40, mg 0.50 kg/s.
XI
LIST OF TABLES
Table 2 Summary of previous works, in simulation the flow pattern of 12
orifice with the help of Computational Fluid Dynamics (CFD)
Table 3 Dimensions of the orifices with 0 = 0.40
17
Table 3. 1.1 Coordinates for the inner circles. 18
Table 3.1.2 Coordinates for the middle circles. 19
Table 3.1.3 Coordinates for the outer circles. 20
Table 3.1.4 Coordinates for the inner rectangles 22
Table 3.1.5 Coordinates for the middle rectangles 22
Table 3.1.6 Coordinates for the outer rectangles 23
XII
LIST OF ABBREVIATIONS
Greek
V1
gm
m/s
m3/s
wt%
kJ/kg
kg/m'
Pa.s in
P
g
kinematic viscosity
micrometre
Water velocity / oil leaking rate
Volume flux
moisture content
Calorific Value
oil density
Pascal .seconds
diameter (height, distance)
density
gravity
CFD
RANS
VOF
FVM
GAMBIT
MESH
FLUENT
Computational Fluid Dynamics
(Reynolds-Averaged-Navier-Stokes) equations,
Volume of Fluid
(finite volume method)
XIII
I INTRODUCTION
1.1 Brief Introduction and problem statement
Wet gas is generally defined as a volume of gas having a gas volume fraction (GVF) greater
than 90%, but less than 100% (Geng et al., 2006.). The existing multiphase flow meters
mainly work for flows where the GVF is between 0% and 90% and the single phase flow
meters such as the standard orifice cannot be used for wet gas flow measurement because of
the significant measurement error (Li Yi et al., 2009). Hence, many industries still depend on
bulky three phase separators to measure wet gas flow rate, where the process is complex and
costly. Accurate wet gas metering is important, particularly for oil and gas industry, in terms
of hydrocarbon allocation and revenue generation (Agar et al., 2002).
Throughout the years, several well-known companies such as TEA, Solartron, Roxar, PECO,
FRAMO and Agar have developed different types of wet gas meters by employing different
metering principles and technology, ranging from pressure differential to microwave and
vortex shedding technologies (Li Yi et al., 2009). In recent years, wet gas measurement using
differential pressure (DP) flow meters like Venturi and orifice is gaining popularity in the oil
and gas industry owing to the relative ease of operation and low cost compared to the
multiphase flow meters. In order to further improve the standard design, modifications have
been proposed especially for the orifice meter. The slotted orifice meter is one such version of
the standard design found to be better performing by several researchers. This design was
reported to be substantially less sensitive to upstream flow conditions and generating a
smaller permanent head loss compared to the standard orifice with the same beta ratio. Static
pressure recovery was also found to be faster than the standard orifice. It was noted that in
stratified flow conditions, liquid stream was able to pass through the perforations of the
slotted orifice at the bottom of the pipe, which could eliminate the water retention effect
commonly observed in standard orifice plates [(Geng et al., 2006.), Morrison et al.,1994-
2001)]. Moreover, the slotted orifice with low beta ratio was found to be more sensitive to
liquid presence, but less sensitive to flow pattern changes. This particular behavior makes the
slotted orifice a better choice for wet gas metering compared to the standard orifice (Geng et
al., 2006.). Based on the literature study, it is considered worthwhile to investigate the effect
of geometry of slots on the wet gas meter performance. This has been done by CFD modeling
of the wet gas flow as it provides deeper insight into the flow field. Rectangular slots with
1
varying aspect ratio and circular slots (all having 13 ratio 0.4) are considered in this study. The
performance of these slotted orifices has also been compared with that of a standard orifice
meter with the same 0 ratio.
The error introduced in the DP meter reading by the presence of liquid has to be corrected for
an accurate measurement of the wet gas flow. For this purpose, semi-empirical correlations
based on theoretical analysis and experimental data have been developed over the years by
many researchers. The details of these correlations are given elsewhere [(Lide et al., 2007,
Steven et al., 2007)]. All these correlations work on the same principle as the single phase
correlation, such that the gas mass flow rate is calculated using Eq. (1). However due to the
bias in the measurements of wet gas flows, a correction factor is applied to mitigate the over-
reading of the gas mass flow rate. In this work, the performance of the wet gas correlations
for gas flow prediction has also been reported.
M9Cd
1.2 Motivation
One of the biggest problems encountered in measuring natural gas flows occurs when liquids
flow with the gas. Traditional gas meters are not designed to cope with such wet gas flows.
The main issues when dealing with wet gas flows include knowing how wet the gas is,
knowing how wet gas affects flow measurement and knowing what systems exist to correctly
measure the wet gas flow. Wet gas flow metering is of increasing importance to the natural
gas production industry. Therefore, wet gas flow testing facilities are also of increasing
importance to the industry. State-of-the-art wet gas flow testing facilities allow the research
and development and verification of wet gas flow metering technologies by meter
manufacturers, operators and regulatory authorities. This proposal describe the CFD
simulation study on the effects of velocity and pressure distributions in wet gas metering
using slotted orifice flow meter.
Wet gas flow is a flowing mixture of gas and liquid where the liquid makes up a relatively
small part of the mixture by volume. The liquid can be made up of hydrocarbons and/or free
water. The flow conditions dictate how the liquid phase is dispersed throughout the pipe. The
2
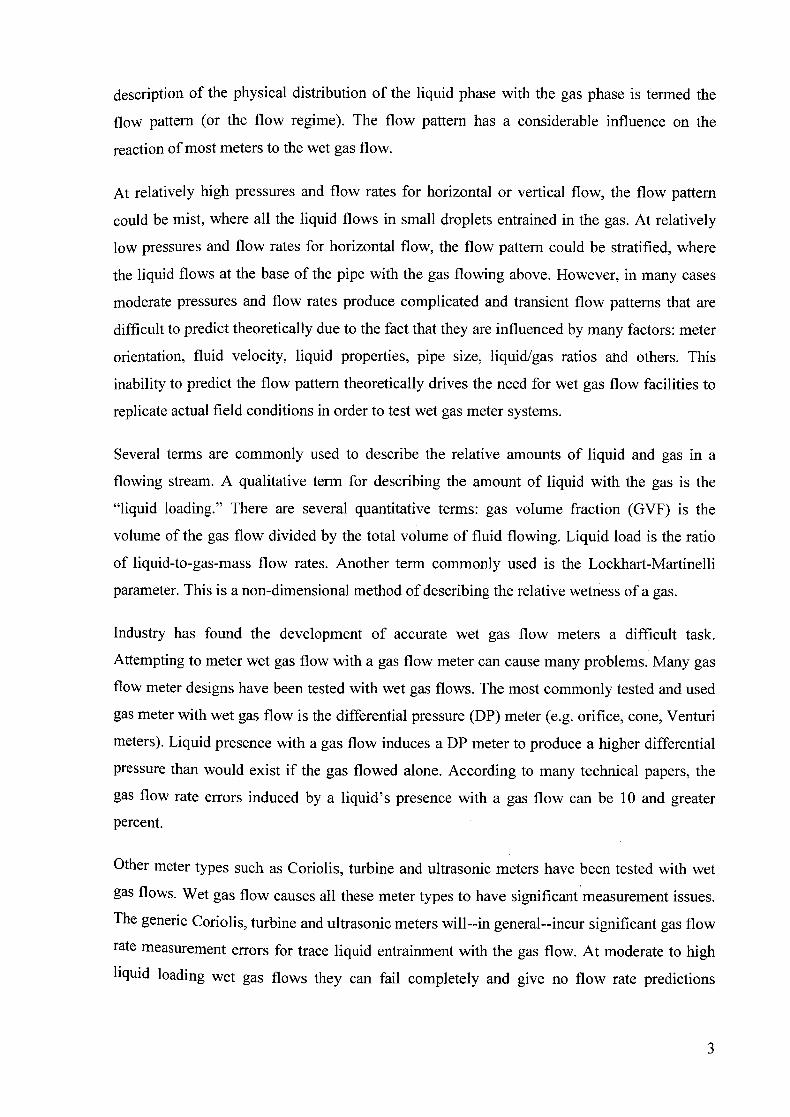
description of the physical distribution of the liquid phase with the gas phase is termed the
flow pattern (or the flow regime). The flow pattern has a considerable influence on the
reaction of most meters to the wet gas flow.
At relatively high pressures and flow rates for horizontal or vertical flow, the flow pattern
could be mist, where all the liquid flows in small droplets entrained in the gas. At relatively
low pressures and flow rates for horizontal flow, the flow pattern could be stratified, where
the liquid flows at the base of the pipe with the gas flowing above. However, in many cases
moderate pressures and flow rates produce complicated and transient flow patterns that are
difficult to predict theoretically due to the fact that they are influenced by many factors: meter
orientation, fluid velocity, liquid properties, pipe size, liquid/gas ratios and others. This
inability to predict the flow pattern theoretically drives the need for wet gas flow facilities to
replicate actual field conditions in order to test wet gas meter systems.
Several terms are commonly used to describe the relative amounts of liquid and gas in a
flowing stream. A qualitative term for describing the amount of liquid with the gas is the
"liquid loading." There are several quantitative terms: gas volume fraction (GVF) is the
volume of the gas flow divided by the total volume of fluid flowing. Liquid load is the ratio
of liquid-to-gas-mass flow rates. Another term commonly used is the Lockhart-Martinelli
parameter. This is a non-dimensional method of describing the relative wetness of a gas.
Industry has found the development of accurate wet gas flow meters a difficult task.
Attempting to meter wet gas flow with a gas flow meter can cause many problems. Many gas
flow meter designs have been tested with wet gas flows. The most commonly tested and used
gas meter with wet gas flow is the differential pressure (DP) meter (e.g. orifice, cone, Venturi
meters). Liquid presence with a gas flow induces a DP meter to produce a higher differential
pressure than would exist if the gas flowed alone. According to many technical papers, the
gas flow rate errors induced by a liquid's presence with a gas flow can be 10 and greater
percent.
Other meter types such as Coriolis, turbine and ultrasonic meters have been tested with wet
gas flows. Wet gas flow causes all these meter types to have significant measurement issues.
The generic Coriolis, turbine and ultrasonic meters will--in general--incur significant gas flow
rate measurement errors for trace liquid entrainment with the gas flow. At moderate to high
liquid loading wet gas flows they can fail completely and give no flow rate predictions
3
whatsoever. Alternatively they can give highly inaccurate random flow rate predictions that
are not reproducible.
For gas meters that do exhibit repeatable and reproducible wet gas flow responses, a
considerable amount of flow testing is required to gather the required data to form a
mathematical prediction method to account for the liquid's effect. This wet gas flow
correction method is required to take account of the liquid effects on the gas flow meter and
therefore accounts for the flow pattern effects. This fact makes it impractical to attempt to
estimate liquid induced gas flow rate prediction errors through theoretical means only, and
facilitates the requirement for wet gas flow facility testing.
Even when gas meters have low-uncertainty wet gas correction factors available, these
corrections still require that the liquid flow rate be known externally to the wet gas meter
system. For this reason meter manufacturers are developing and marketing wet gas metering
systems. Again, these systems are heavily dependent on the services of wet gas flow facilities
for research and development and verification.
Through the extensive use of wet gas flow test facilities manufacturers are having significant
success in developing wet gas flow meters. The key to accurately measuring wet gas flow is
to understand how a metering system reacts to liquids flowing with the gas stream.
Thus, the slotted orifice meter is one such version of the standard design found to be better
performing by several researchers. This design was reported to be substantially less sensitive
to upstream flow conditions and generating a smaller permanent head loss compared to the
standard orifice with the same beta ratio. Static pressure recovery was also found to be faster
than the standard orifice. It was noted that in stratified flow conditions, liquid stream was able
to pass through the perforations of the slotted orifice at the bottom of the pipe, which could
eliminate the water retention effect commonly observed in standard orifice plates [(Geng et
al., 2006.), Morrison et al.,1994-2001)]. Moreover, the slotted orifice with low beta ratio was
found to be more sensitive to liquid presence, but less sensitive to flow pattern changes. This
Particular behavior makes the slotted orifice a, better choice for wet gas metering compared to
the standard orifice (Geng et al., 2006.). Based on the literature study, it is considered
Worthwhile to investigate the effect of geometry of slots on the wet gas meter performance.
This has been done by CFD modeling of the wet gas flow as it provides deeper insight into the flow field. Rectangular slots, circular slots (all having 13 ratio 0.4) are considered in this
is
study and the performance of these slotted orifices has also been compared with that of a
standard orifice meter with the same 0 ratio.
Hence, numerical simulation of the flow behavior would yield more information than
experiments, and would make it possible to optimize the slotted orifice structure in terms of
realizing the desired measuring performance. Flow predictions were carried out to study the
performance of different geometrical orifice flow meters Consisting of a 5 mm plate with 13
0.40 in a Schedule 80 horizontal pipe (equivalent to an inner diameter of 105.74 mm). Figs.
I a and lb show the general structure of the rectangular and circular orifices used in the flow
investigation. In the present study, 0.5 m upstream pipe length and 1 in downstream pipe
length were provided in the computational flow domain for specification of the boundary
conditions. The reason the longer downstream pipe length is to make sure that the entire flow
profile is captured as it comes through the constriction. As the flow is considered to be fully
developed, it does not matter if the upstream pipe is shorter than the downstream pipe.
Generally, a pipe length of 1-2 in is needed for multiphase flow to fully develop. The
geometries of the orifices were created in a GAMBIT 2.4.6 pre-processor.
Fig. la. Geomatric details of the slotted orifice with
Fig. lb. Geomatric details of the slotted orifice with rectangular perforationns. circular perforationns.
1.2.1 Summary
The topic was scoped from addressing the problem in the oil and gas industry, way by
indenti1iing the problem causes by wet gas. Alternatively, an extensive studies using the
Computational Fluid Dynamic (CFD) simulations with FLUENT software has been used to
develop the slotted orifice flow meter in the attempt to improve the performance of the
standard orifice flow meter. Then a study of performane in wet gas metering between slotted
and standard orifice flow for effects of velocity and pressure distributions was investigate
using CFD simulations to get the data for the improvement.
5
1.3 Objectives of Study
The main objective of this study is to study the effects of velocity and pressure distributions
in wet gas metering using slotted orifice flow meter by using CFD. This study investigates the
pressure distribution upstream and downstream of the horizontal pipe equipped with different
orifices, 13 = 0.40, mg = 0.50 kg/s, GVF = 0.98, by CFD simulations with FLUENT software.
1.4 Scope of this research
The scopes of this study are to mainly study the effects of velocity and pressure distributions
in wet gas metering using slotted orifice flow. The method of study is by implementing CFD
using the Gambit 2.4.6 and the Fluent 6.3.26 software. Flow predictions were carried out to
study the performance of different geometrical orifice flow meters consisting of a 5mm plate
with 13 = 0.40 in a Schedule 80 horizontal pipe (equivalent to an inner diameter of 105.74
mm). Pressure was varied in the range of 240000 - 360000 Pa. Air mass flow rate and
volume fraction also were varied in the range from 0.33 kg/s to 0.80 kg/s and 0.90 to 1.00,
respectively. In the present study, 0.5 in upstream pipe length and 1 in downstream pipe
length were provided in the computational flow domain for specification of the boundary
conditions. The reason the longer downstream pipe length is to make sure that the entire flow
profile is captured as it comes through the constriction. As the flow is considered to be fully
developed, it does not matter if the upstream pipe is shorter than the downstream pipe.
Generally, a pipe length of 1-2 in is needed for multiphase flow to fully develop. The
geometries of the orifices were created in a GAMBIT 2.4.6 pre-processor.
1.5 Hypothesis
The use of CFD for in-depth analysis of fluid mechanics, heat and mass transfer of various
chemical processes has increased significantly due to its efficiency and economy. One of the
main merits of CFD is that it can get a deeper insight into underlying physical mechanisms,
and it can also provide velocity field and phase distribution with high spatial and temporal
resolution for engineering flow applications. Thus, CFD technology is an effective and
versatile tool for flow predictions. Furthermore it is able to explore multiple phenomena in a
Single simulation case, thereby allowing extensive studies to evaluate the performance of the
flow meters. In this work, FLUENT 6.3 has been used to predict both pressure and flow
inside the horizontal pipes equipped with different orifices.
water (upto3msj pipe velocity) and published experimental data of Nail (1991) and
Morrison et al. (1993). Energy balance is also established for the simulated cases. Sensitivity
analysis of turbulence model parameters has also been reported in the present work.
It is also known that the actual locations of vena-contracta change with flowrates and may not
match the vena-contracta tapping. It is shown that in the CFD simulation, it is possible to
locate the vena-contracta. Using this capability of CFD, a suitable modification in the
hardware has been proposed to position the pressure tap at vena-contracta for flow
measurement with better accuracy and sensitivity without compromising the existing
advantages of orifice meter.
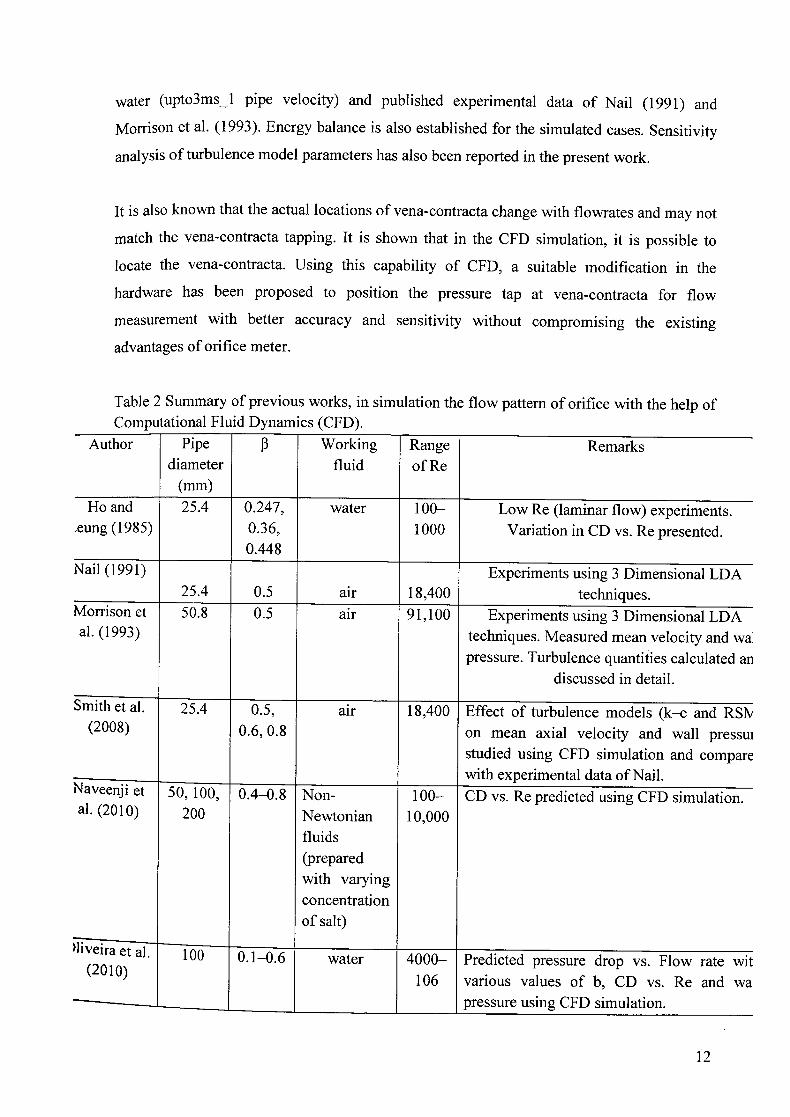
Table 2 Summary of previous works, in simulation the flow pattern of orifice with the help of Computational Fluid Dynamics (CFD).
Author Pipe 13 Working Range Remarks diameter
(mm) fluid of Re
Ho and 25.4 0.247, water 100— Low Re (laminar flow) experiments. .eung (1985) 0.36, 1000 Variation in CD vs. Re presented.
0.448 Nail (1991) Experiments using 3 Dimensional LDA
25.4 0.5 air 18,400 techniques. Morrison et 50.8 0.5 air 91,100 Experiments using 3 Dimensional LDA al. (1993) techniques. Measured mean velocity and wa
pressure. Turbulence quantities calculated an discussed in detail.
Smith et al. 25.4 0.5, air 18,400 Effect of turbulence models (k—c and RSI\/ (2008) 0.6, 0.8 on mean axial velocity and wall pressui
studied using CFD simulation and compare with experimental data of Nail.
Naveenjiet 50,100
______
,
__ .______
4-0.8 0 Non- 100— CD vs. Re predicted using CFD simulation. al. (2010) 200 Newtonian 10,000
fluids (prepared with varying concentration of salt)
J'veIra et al. (2010)
100 0.1-0.6 water 4000— Predicted pressure drop vs. Flow rate wit 106 various values of b, CD vs. Re and wa
pressure using CFD simulation.
12
2 LITERATURE REVIEW
2.1 Screening Route
The main focused of this paper was to study on the wet gas metering using slotted orifice
flow meter based on the effects of velocity and pressure distributions. In addition, a study
was also done on Computational Fluid Dynamics (CFD). Finally, the literature centered on
the advantages and disadvantages of slotted orifice flow meter.
2.2 Wet Gas Metering
Wet gas flow has been acknowledged as gas and liquid two-phase flow with the percentage of
gas volume overwhelming that of the liquid volume. Wet gas flow exists widely in many
industrial processes, such as the nuclear industry, the power generation, the oil and gas
industry, etc. Within the oil and gas industry, well fluids with gas volume fraction greater
than 90% are widely accepted as wet gas flow (Wet Gas Flow metering Guideline et al.,
2008, Recommended Practice for Measurement of Multiphase et al., 2005, Steven et al.,
2007). Wet gas metering is gaining considerable attention due to its importance in the oil and
gas industry. Especially, with the advancing of exploitation of oil and natural gas fields into
offshore, desert and remote areas, it is extremely desirable to have a wet gas metering system
that is capable of providing cost effective, compact in size, and on-line measurement of wet
gas with sufficient accuracy to replace a bulky and costly test separator, in terms of cost
savings, production optimization, field monitoring and reservoir management (Wet Gas Flow
metering Guideline et al., 2008, Recommended Practice for Measurement of Multiphase et
al., 2005,). There are two distinct wet gas-metering situations, and then there are two basic
approaches to wet gas flow metering (Wet Gas Flow metering Guideline et al., 2008,
Recommended Practice for Measurement of Multiphase et al., 2005,). First, when some flow
rate knowledge is initially known, for example, the total mass flow rate or the liquid flow rate
or the ratio of gas-to-liquid flow rates is known (from some other means),and the gas flow
rate is usually required to be metered. In this situation, several meters designed for dry gas
flow applications are employed to meter the gas flow rate in wet gas flow. But the liquid-
Induced gas flow rate error is considered to be significant by the user. Therefore, the wet gas
flow correlation with some known flow rate knowledge, specified for that gas meter, is
required to correct the liquid induced gas flow rate error. The metering performances of some
dry gas meters in wet gas flow have been investigated by many researchers and some
8
corresponding correlations are proposed, such as orifice plate meter (Murdock et al., 1962), V-
Cone meter (Steven et al.,2009), and some velocity meters(Zanker Et al.,2000). Some of them
have been proposed for use in wet gas flow. Second, when no flow rate information is known
(e.g., unprocessed wet natural gas flows), both the liquid and gas phase flow rates are
required to be metered. It is a considerably more difficult metering situation a sex train
formation is required. When the liquid flow rate in formation cannot be available to use with
a wet gas correction, or the liquid flow rate changes frequently, research in to metering
systems that measure both the gas and liquid flow rates respectively in real time has been
growing for the last few years. One method of metering both the liquid and gas flow rates
simultaneously is to use a combination of some DP meter with one or more phase fraction
device(s). The other is to use two or multiple single-phase gas meters in series that react
differently to wet gas flow (Dual stream II et al., 2001, Geng et al., 2007).
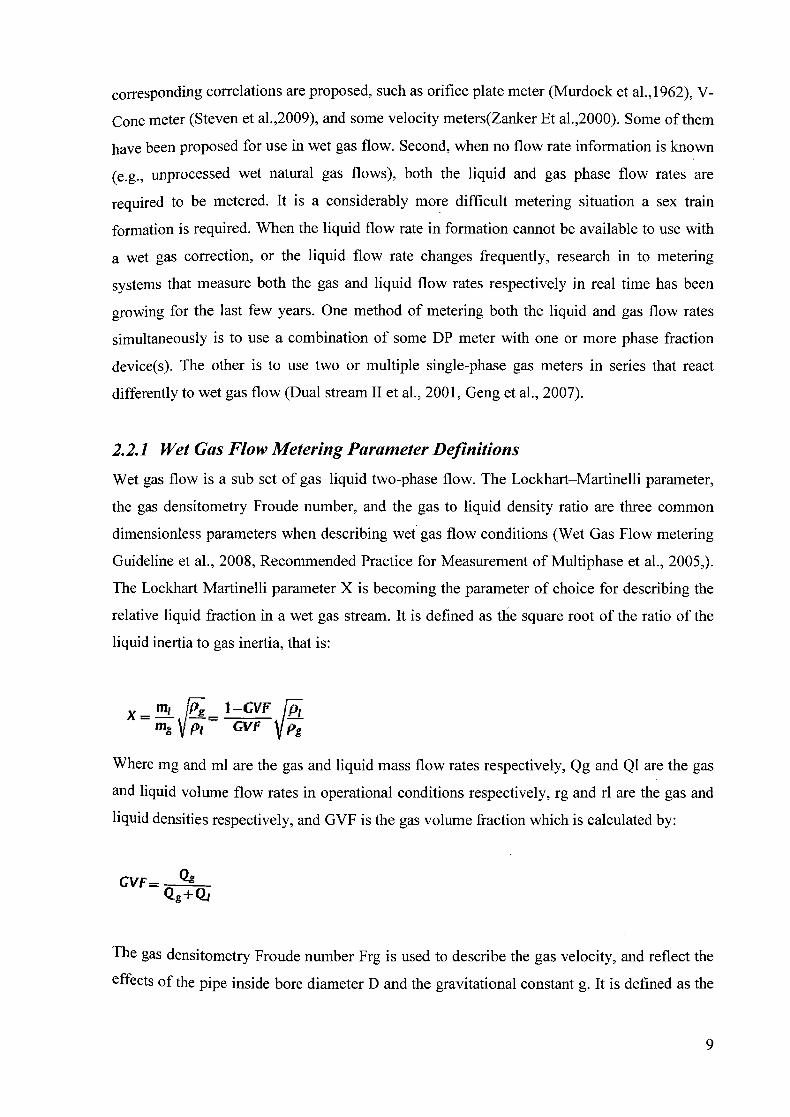
2.2.1 Wet Gas Flow Metering Parameter Definitions
Wet gas flow is a sub set of gas—liquid two-phase flow. The Lockhart—Martinelli parameter,
the gas densitometry Froude number, and the gas to liquid density ratio are three common
dimensionless parameters when describing wet gas flow conditions (Wet Gas Flow metering
Guideline et al., 2008, Recommended Practice for Measurement of Multiphase et al., 2005,).
The Lockhart Martinelli parameter X is becoming the parameter of choice for describing the
relative liquid fraction in a wet gas stream. It is defined as the square root of the ratio of the
liquid inertia to gas inertia, that is:
x=!IL /Og 1—CVF
M1>1 p, GVF V " Where mg and ml are the gas and liquid mass flow rates respectively, Qg and Ql are the gas
and liquid volume flow rates in operational conditions respectively, rg and rl are the gas and
liquid densities respectively, and GVF is the gas volume fraction which is calculated by:
GVF-9 Qg+Qj
The gas densitornetry Froude number Frg is used to describe the gas velocity, and reflect the
effects of the pipe inside bore diameter D and the gravitational constant g. It is defined as the
square root of the ratio of the gas inertia if it flowed alone to the gravity force on the liquid
phase, that is:
Usg f7m2 ^Tgu;l F = /ji5\/Pr1)g fig)
Where A is the pipe cross sectional area, and Usg is the superficial gas velocity. Many wet
gas meters have output responses that are dependent on pressure. The liquid is effectively in
compressible and gas is compressible with pressure changes. Gas density varies with pressure
where as liquid density does not, and hence for a set liquid component only the gas-to-liquid
density ratio DR can be used as a non dimensional description of pressure, thai is:
Pt
2.3 Orifice Meters
It is very important to have information on flow rates of various chemical process streams
with adequate accuracy in the plants, especially when it has a direct influence on efficiency
and productivity of a given process. Although orifice meters have higher pressure losses and
correspondingly higher pumping cost, they are still the most common meters used for fluid
flow measurement because these are rugged, simple in construction and
installation/replacement, without having any moving parts, economic, measurement
flexibility with high range ability, can be used for liquids, gases or slurries, well suited for use
under extreme weather conditions etc. (Husain, 2010 and McCabe et al. 1993). It works on
simple principle of using effects of velocity and pressure variation caused by reduction of the
available area for flow. Orifice meters are well known and have been studied by a number of
investigators over a considerable range of Reynolds numbers and Beta ratio [(Nail (1991);
Morrison et al. (1993); Smith et al. (2008), Naveenji et al. (2010); Oliveira et al. (2010)]. In
international trade, it is implemented in accordance with international standards such as
IS05167-1.The orifice meter is supplied with discharge coefficient (CD) and installation
procedure. The discharge coefficient is defined as the ratio of actual flow to the theoretical
flow . It is obtained from experimental measurements after regression, wherein experiments
are conducted in controlled conditions of undisturbed, symmetrical, swirl-free velocity profile
10
in the upstream of orifice [(Erdal and Andersson (1997)]. Definite straight length of pipe is
also kept downstream of the orifice to avoid the effects of outlet conditions on the flow
profile close to downstream of orifice. With the above distinct advantages of a flow meter of
high industrial importance, it is necessary to understand the flow pattern of orifice meter to
further improve its performance in terms of flow measurement with better accuracy and
sensitivity.
2.3.1 Previous Work
The summary of published literature is given in Table 2.1. Very few attempts have been made
to simulate the flow pattern for orifice with the help of Computational Fluid Dynamics
(CFD). Durst and Wang, 1989 found good agreement between calculations using k—e
turbulence model and measurements, but pressure drop was not reported by them. Smith et al.
(2008) have studied the effect of beta ratios from 0.5 to 0.8 on the flow field. Naveenji et al.
(2010) have studied variation in discharge coefficient for non-Newtonian fluid flow at beta
ratios from 0.4 to 0.8. Oliveira et al. (2010) have presented numerical methodology for
calibrating orifice meter. CFD technique requires reliable experimental data on flow profiles
to validate its outcome. In all the above literature, limited part of CFD simulations have been
compared with experimental data. Nail (1991) has presented experimental measurements of
measured using Laser Doppler Anemometer (LDA) in his PhD Dissertation. Morrisonetal.
(1993) have measured flow field using a three-color, 3D LDA and reported the mean velocity
and turbulence field inside orifice flow meter with a beta ratio of 0.5. Centreline axial
velocity and wall pressure profiles were also presented. To summarise, though reliable
experimental data are available, comprehensive information is not available in the published
literature on the predicted flow structure downstream of orifice explaining the flow features
using CFD simulations. Moreover, advancement in the CFD, availability of high speed
computing machines and robust solvers have encouraged us to make an attempt for predicting
orifice flows with better accuracy. It was also thought desirable to propose a cost effective
tool towards replacement of experiments required for estimating the discharge coefficient. In
the present paper, efforts are made to combine experimental and CFD modelling to achieve
better explanation for the flow phenomena in the upstream and downstream of orifice.
Experiments are conducted with water as fluid with various flow rates. Pressure drop across
the orifice meter was measured with the help of manometer mounted on flange taps of the
meter. CFD simulations have been carried out and compared with experimental data using
11
water (upto3ms_1 pipe velocity) and published experimental data of Nail (1991) and
Morrison et al. (1993). Energy balance is also established for the simulated cases. Sensitivity
analysis of turbulence model parameters has also been reported in the present work.
it is also known that the actual locations of vena-contracta change with flowrates and may not
match the vena-contracta tapping. It is shown that in the CFD simulation, it is possible to
locate the vena-contracta. Using this capability of CFD, a suitable modification in the
hardware has been proposed to position the pressure tap at vena-contracta for flow
measurement with better accuracy and sensitivity without compromising the existing
advantages of orifice meter.
Table 2 Summary of previous works, in simulation the flow pattern of orifice with the help of Computational Fluid Dynamics (CFD).
Author Pipe 13 Working Range Remarks diameter fluid of Re
(mm) Ho and 25.4 0.247, water 100— Low Re (laminar flow) experiments.
•eung (1985) 0.36, 1000 Variation in CD vs. Re presented. 0.448
Nail (1991) Experiments using 3 Dimensional LDA 25.4 0.5 air 18,400 techniques.
Morrison et 50.8 0.5 air 91,100 Experiments using 3 Dimensional LDA al. (1993) techniques. Measured mean velocity and wa
pressure. Turbulence quantities calculated ar discussed in detail.
Smith et al. 25.4 0.5, air 18,400 Effect of turbulence models (k—e and RSI\ (2008) 0.6, 0.8 on mean axial velocity and wall pressu:
studied using CFD simulation and compar with experimental data of Nail.
Naveenjiet________
50, 100, 0.4-0.8 Non- 100— CD vs. Re predicted using CFD simulation. al. (2010) 200 Newtonian 10,000
fluids (prepared with varying concentration of salt)
ftivejra etal. 100 0.1-0.6 water 4000— Predicted pressure drop vs. Flow rate Wil (2010) 106 various values of b, CD vs. Re and wa
pressure using CFD simulation.
12
2.4 Software
For geometry and mesh generation, the CFD, ANSYS FLUENT and GAMBIT were used.
2.4.1 CFD
Computational fluid dynamics (CFD) is one of the branches of fluid mechanics predicting
fluid flow, heat transfer, mass transfer, chemical reactions, and related phenomena by solving
the mathematical equations which govern these processes using a numerical process. Claude-
Louis Navier and George Gabriel Stokes introduced viscous transport into the Euler
equations, which resulted in the Navier—Stokes equation based on current CFD. Richardson
(Richardson L at al., 1991) developed the first numerical weather prediction system when he
divided physical space into grid cells and used the finite difference approximations of
Bjerknes's "primitive differential equations". The earliest numerical solution for flow past a
cylinder was carried out by Thom (Thom et al., 1993). Thus, CFD was developed from the
pioneering efforts by Richardson (Richardson et al., 1991), Thom (Thom et al., 1993),
Courantetal (Courant et al., 1928), Southwell (Southwell et al. 1940), and von Neumann (Von
Neumann at al., 1950), who in their endeavours to procure insight into fluid motion produced
the development of powerful numerical techniques that can describe all types of fluid flow
(Shang et al., 2004). The theoretical division of NASA contributed many numerical methods,
and Spalding and his colleagues developed many codes and algorithms (Runchal et al., 2003).
Commercial CFD codes began to open the market place from the early1980s. During the last
30 years, a market for commercial CFD software grew quickly, and commercial CFD
software is used in almost all engineering fields (Fluent et al., 2003). CFD is based on three
principle numerical approaches - the Finite Difference Method (FDM), Finite Element
Method (FEM) and Finite Volume Method (FVM). Finite difference (FD) discretization is the
oldest method and is based on the application of polynomial, Legendre polynomial, Fourier
and Taylor series expansions to represent the differential equations (Peiro et al.). This scheme
motivated the use of an integral form of partial differential equations (PDEs) and
subsequently, the development of the finite element and finite volume techniques. Current
CFD mainly uses the FEM and FVM more than the FDM, which has trouble handling
complicated geometries. Finite element (FE) discretization divides up the region into a
number of smaller regions (finite elements) for the computational domain is based on a piece wise approximation of the solution. The PDEs that are solved are typically obtained by
restating the conservation equation in a weak formulation (Ferziger et al., 2002, Kumar et al.,
13
a Mesh
2009). This solving process was established by the Galerkin method. Finite volume (FV)
discretiZatiofl is based on an integral form of the PDE to be solved, with the values of the
conserved variables averaged across the volume. The PDE is written in a form which can be
solved for a given finite volume (or cell). The computational domain is discretized into finite
volumes, and then for every volume the governing equations are solved (Ferziger et al., 2002,
Ahmad N et al., 1998). Fig. 2 represents the structure mesh for the two discretization
methods.
Control Cell Center VOIiJrne (CV)
N /1 10 / I
I w I S I E
S/S/S I Si
Clement Nodes
Fig.2. A representation of a structured mesh for the two discretization methods ;(a) the finite element method,
and (b) the finite volume method. Ahmad N et al., 1998.
2.4.2 ANSYS FLUENT
One generally used commercial codes based on FEM and FVM is ANSYS FLUENT.
ANSYS FLUENT, one of famous commercial CFD software packages, is based on a finite
volume method approach. This software solver uses cell-centred finite volumes. In cell
centred schemes, the flow variables are stored at the centres of the mesh elements (Fluent et
al., 2003). ANSYS FLUENT focused in offers several solution approaches (density-based as
well as segregated and coupled pressure-based methods). This program is the most popular
commercial packages available for most engineering fields. GAMBIT is used as a tool to
generate or import geometry so that it can be used as a basis for simulations runs in ANSYS
FLUENT. It can either build a model or import existing geometries from various other CAD applications. With geometry in place it generates a mesh for the surface and volume of the geometry allowing it to be used for computational fluid dynamics. ANSYS FLUENT is a
"Flow Modelling Software" that was used to model fluid flow within a defined geometry
Using the principles of computational fluid dynamics. Unlike GAMBIT, which it is shipped
with, it utilizes a multi window pane system for displaying various configuration menus and
grids instead of a single window with several embedded sub-windows restricted within the
14
space of the parent window. ANSYS FLUENT is able to read geometries generated in
GAMBIT and model fluid flow within them. It can model various scenarios using
computational fluid dynamics, including compressible and incompressible flow, multiphase
flow, combustion, and heat transfer.
2.5 Mesh design
Grid generation is a key issue in flow simulation as it governs the stability and accuracy of
the flow predictions. For the present case of flow through orifice, unstructured tetrahedral
hybrid cells were used to discretize the entire flow domain. The size of the mesh was kept
finer in the orifice region to capture the existence of high velocity and pressure gradients. The
meshed geometry of the slotted orifice is shown in Fig. 2.1.
This paper describes the numerical studies to establish the effect of velocity and pressure
distributions on the performance of the slotted orifice. Two sets of slotted orifices which were
rectangular perforations and one with a circular perforation and a P ratio of 0.40 were
simulated in a 1.6 in horizontal pipe using the k-6 turbulence model over a range of
parameters, i.e. gas volume fraction (GVF) and gas mass flow rate. Besides, the pressure was
also varied in the range of 240000 - 360000 Pa. The commercial CFD code, FLUENT 6.3
was used to model the wet gas flow.
15
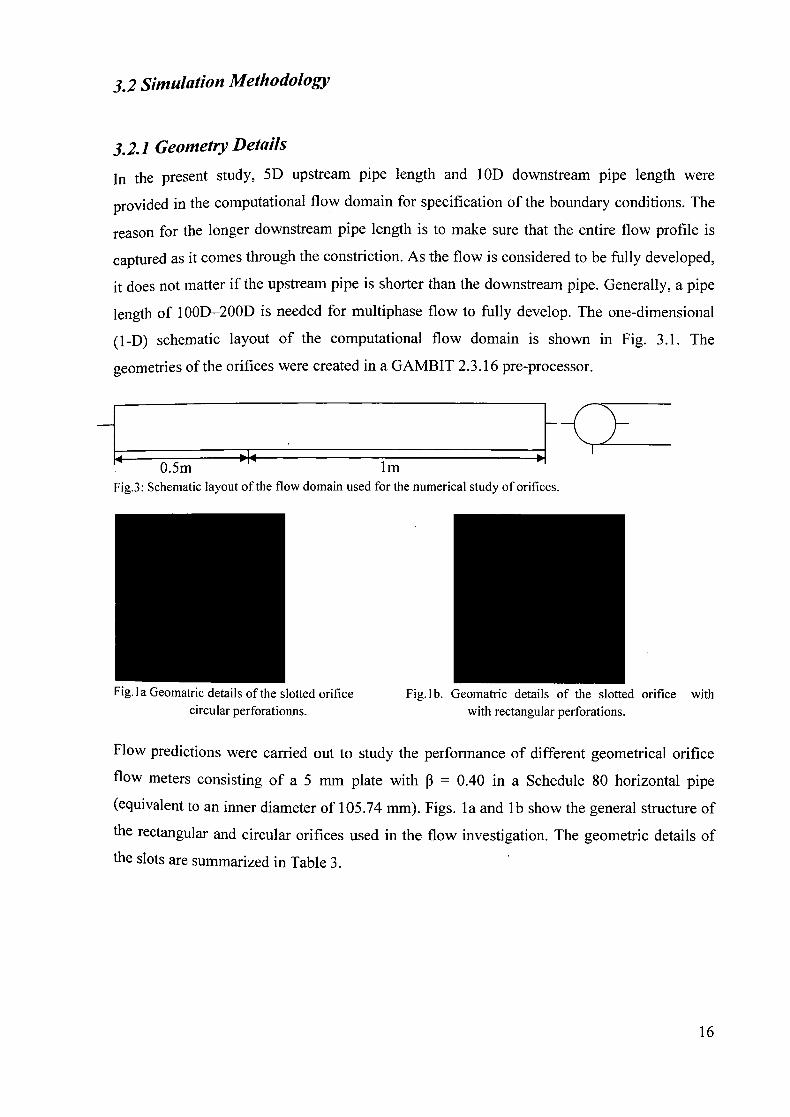
3.2 Simulation Methodology
3.2.1 Geometry Details In the present study, 5D upstream pipe length and 101) downstream pipe length were
provided in the computational flow domain for specification of the boundary conditions. The
reason for the longer downstream pipe length is to make sure that the entire flow profile is
captured as it comes through the constriction. As the flow is considered to be fully developed,
it does not matter if the upstream pipe is shorter than the downstream pipe. Generally, a pipe
length of 1 OOD-200D is needed for multiphase flow to fully develop. The one-dimensional
(1-1)) schematic layout of the computational flow domain is shown in Fig. 3.1. The
geometries of the orifices were created in a GAMBIT 2.3.16 pre-processor.
IJ.3111 1111
Fig.3: Schematic layout of the flow domain used for the numerical study of orifices.
Fig. I a Geomatric details of the slotted orifice Fig. lb. Geomatric details of the slotted orifice with circular perforationns. with rectangular perforations.
Flow predictions were carried out to study the performance of different geometrical orifice
flow meters consisting of a 5 nun plate with 13 = 0.40 in a Schedule 80 horizontal pipe
(equivalent to an inner diameter of 105.74 mm). Figs. la and lb show the general structure of
the rectangular and circular orifices used in the flow investigation. The geometric details of
the slots are summarized in Table 3.
16
i'g.i.i. Geometry of the perforated orifice.
Table 3 rdnnc of the orifices with B = 0.40.
Case Perforation 1/w D dlw 1 xl x2 No. of perforation