A Comparative Study of Dragonfly Flight in Variable Oxygen Atmospheres by Joanna Randyl Henry A Thesis Presented in Partial Fulfillment of the Requirements for the Degree Master of Science Approved May 2011 by the Graduate Supervisory Committee: Jon F. Harrison, Chair Alexander Kaiser Ronald L. Rutowski ARIZONA STATE UNIVERSITY August 2011
Transcript
A Comparative Study of Dragonfly Flight
in Variable Oxygen Atmospheres
by
Joanna Randyl Henry
A Thesis Presented in Partial Fulfillment of the Requirements for the Degree
Master of Science
Approved May 2011 by the Graduate Supervisory Committee:
Jon F. Harrison, Chair
Alexander Kaiser Ronald L. Rutowski
ARIZONA STATE UNIVERSITY
August 2011
i
ABSTRACT
One hypothesis for the small size of insects relative to vertebrates, and the
existence of giant fossil insects, is that atmospheric oxygen levels have
constrained body sizes because oxygen delivery would be unable to match the
needs of metabolically active tissues in larger insects. This study tested whether
oxygen delivery becomes more challenging for larger insects by measuring the
oxygen-sensitivity of flight metabolic rates and behavior during hovering for 11
different species of dragonflies that range in mass by an order of magnitude.
Animals were flown in 7 different oxygen concentrations ranging from 30% to
2.5% to assess the sensitivity of their behavior and flight metabolic rates to
oxygen. I also assessed the oxygen-sensitivity of flight in low-density air
(nitrogen replaced with helium), to increase the metabolic demands of hovering
flight. Lowered atmosphere densities did induce higher metabolic rates. Flight
behaviors but not flight metabolic rates were highly oxygen-sensitive. A
significant interaction between oxygen and mass was found for total flight time,
with larger dragonflies varying flight time more in response to atmospheric
oxygen. This study provides some support for the hypothesis that larger insects
are more challenged in oxygen delivery, as predicted by the oxygen limitation
hypothesis for insect gigantism in the Paleozoic.
ii
ACKNOWLEDGEMENTS
I would first like to thank the members of my committee: Alex Kaiser,
Ron Rutowski and especially Jon Harrison. Without their helpful advice (and
patience) this project may never have been completed.
When learning respirometry techniques, John Lighton, Robin Turner,
Mike Quinlan, and Brenda Rascón provided critical assistance. Members of the
Harrison Lab and the Social Insect Research Group gave helpful suggestions
regarding the analysis and presentation of the confusing dataset that I had
collected. Melanie Frazier was instrumental in teaching me the basics of R,
without which I would not have been able to run my statistical analyses. I would
also like to thank the Desert Studies Center and Rob Fulton for allowing me to
conduct my research in Zzyzx.
My family and friends helped encourage me to continue this project and
for that I am grateful.
This research was partially supported by NSF IBN 0419704 to JFH.
iii
TABLE OF CONTENTS
Page
LIST OF TABLES................................................................................................. iv
LIST OF FIGURES .................................................................................................v
the species captured tended to patrol the lake continuously throughout the day
categorizing them as “fliers” while the remaining species, categorized as
“perchers”, preferred to sit on vegetation and only flew when actively hunting or
attempting to mate.
Experimental Design
The power of interspecific comparative analyses depends on the number
of species used, and in this case, on the range of masses (Harvey and Pagel 1991).
Because many measurements were made on individuals (flight behavior and
metabolic rate in 14 different gas mixes plus some additional controls), several
hours were required to complete measurements for a single individual. In
5
addition, the hours that dragonflies are easily available are relatively limited,
necessarily limiting the number of animals that could be assessed. Thus I decided
to focus on obtaining the maximum number of species, and our study had
relatively low number of individuals per species (Table 1). Unless otherwise
stated, reported values are species means (averaging across individuals of that
species for each parameter).
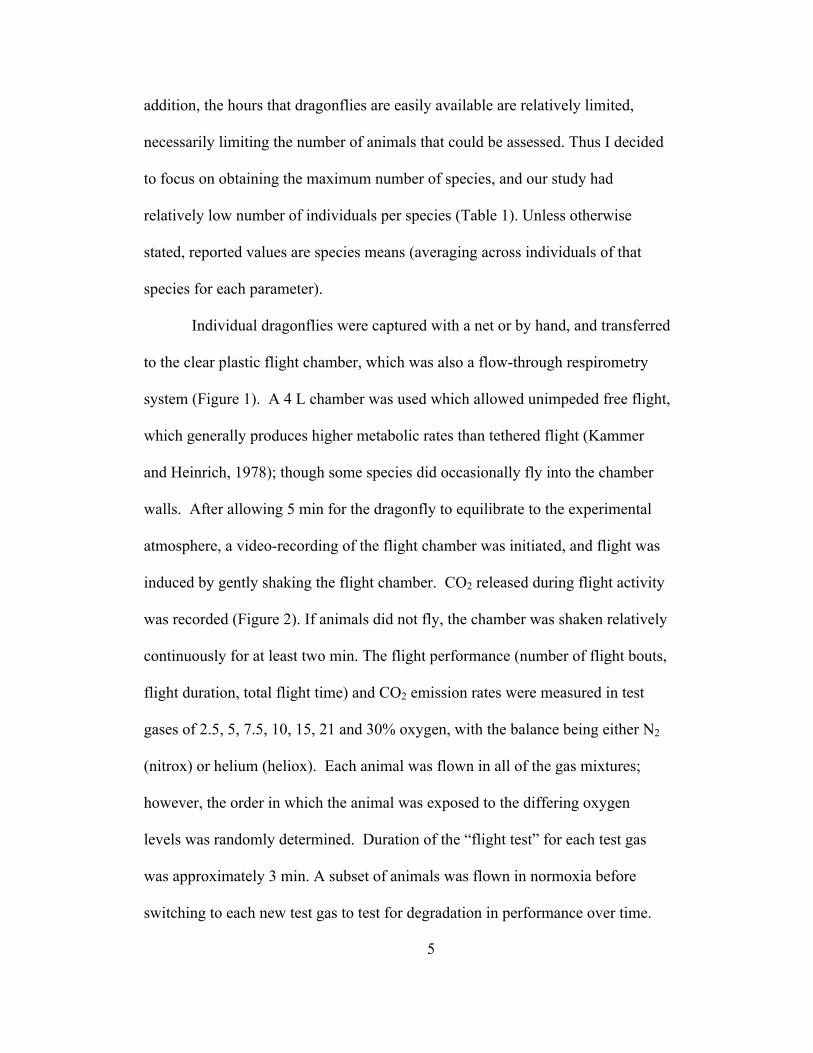
Individual dragonflies were captured with a net or by hand, and transferred
to the clear plastic flight chamber, which was also a flow-through respirometry
system (Figure 1). A 4 L chamber was used which allowed unimpeded free flight,
which generally produces higher metabolic rates than tethered flight (Kammer
and Heinrich, 1978); though some species did occasionally fly into the chamber
walls. After allowing 5 min for the dragonfly to equilibrate to the experimental
atmosphere, a video-recording of the flight chamber was initiated, and flight was
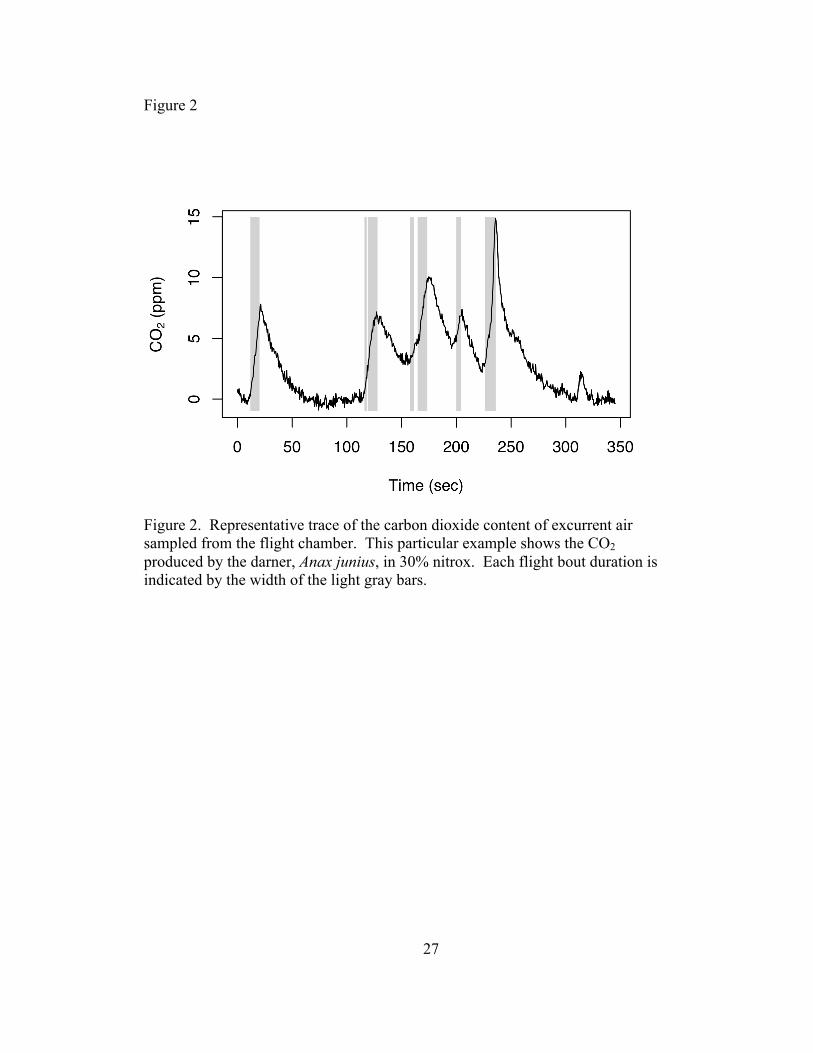
induced by gently shaking the flight chamber. CO2 released during flight activity
was recorded (Figure 2). If animals did not fly, the chamber was shaken relatively
continuously for at least two min. The flight performance (number of flight bouts,
flight duration, total flight time) and CO2 emission rates were measured in test
gases of 2.5, 5, 7.5, 10, 15, 21 and 30% oxygen, with the balance being either N2
(nitrox) or helium (heliox). Each animal was flown in all of the gas mixtures;
however, the order in which the animal was exposed to the differing oxygen
levels was randomly determined. Duration of the “flight test” for each test gas
was approximately 3 min. A subset of animals was flown in normoxia before
switching to each new test gas to test for degradation in performance over time.
6
The barometric pressure at Zzyzx during the course of the experiment was 101.07
± 0.04 kPa (286 m elevation).
Video Analysis of Behavior
The video camera’s angle of view encompassed the entire flight chamber;
a flight bout was defined as a continuous period of time when the wings were
active and animals were off the chamber floor. Flight bout durations were
measured using of frame-by-frame analysis of video taken by a digital video
recorder (ZR series; Canon, New York, USA). Video images were shot at a
standard rate of 30 frames per second; thus, bouts of activity as short as 0.03 sec
could be detected.
Respirometry
The flow rate of air through the flight chamber (constant at16.2 ± 0.1 L
min-1) and the oxygen concentration of the mixture were regulated by mass flow
controllers and meters (Omega, Stamford, CT, USA). The flow rate was chosen to
reduce washout effects and improve temporal resolution (95% equilibration time
was less than one minute) while keeping flows low enough so that the CO2 output
of the excurrent air could be accurately determined. Our oxygen analyzer was not
sufficiently precise to measure oxygen consumption rates during flight; the
oxygen readings were instead used to confirm the gas mixes. Excurrent air from
the chamber was dumped into a manifold from which the air was subsampled at a
rate of 500 ml min-1. The subsampled air was first dried (magnesium
perchlorate) and then pulled sequentially through a CO2 analyzer (LI-6252; Li-
Cor, Lincoln, NE, USA), Ascarite II (for CO2 removal), and then an O2 analyzer
7
(FOXBOX , Sable Systems, Las Vegas, NV, USA) by a pump (R-1; AMETEK,
Pittsburg, PA, USA). The output of both analyzers was digitized and recorded
using Sable Systems DATACAN (Las Vegas, NV, USA).
The metabolic rates during flight were calculated by integrating the area
under each CO2 emission peak (Figure 2) that corresponded to a burst or closely-
timed burst of flight, and dividing by the time spent in flight as determined using
the video recording of behavior.
The flight chamber was housed in a temperature-controlled environment
to reduce the effects of temperature on metabolic rate. The temperature was
maintained at 31.6 ± 0.1°C by monitoring the temperature within a 0.76 m x 0.76
m x 0.91 m wood-framed, Plexiglas chamber and adjusting the output from an
attached air conditioner accordingly.
Statistical Analyses
I tested for general effects of oxygen and air density on our dependent
parameters (flight CO2 emission rate, number of flight bouts, flight bout duration,
total flight time during the flight test) using a general linear analysis using
oxygen, air density, and body mass as independent factors. I first tested for three-
way interaction terms, and then two-way interaction terms.
To assess the oxygen-responsiveness of dragonflies, I plotted the
dependent variables vs. oxygen for each species and calculated the linear slope. I
then tested whether these slopes (oxygen-responsiveness) were statistically related
to body mass using linear regression.
8
Because observed differences in metabolic rate and behavior may be
affected by phylogenetic relatedness in addition to physical size differences,
phylogenetically independent contrasts (PICs) were calculated for each of the
independent and dependent variables used in this study using the ape package in
R (Paradis, et al., 2004; Felsenstein, 1985).
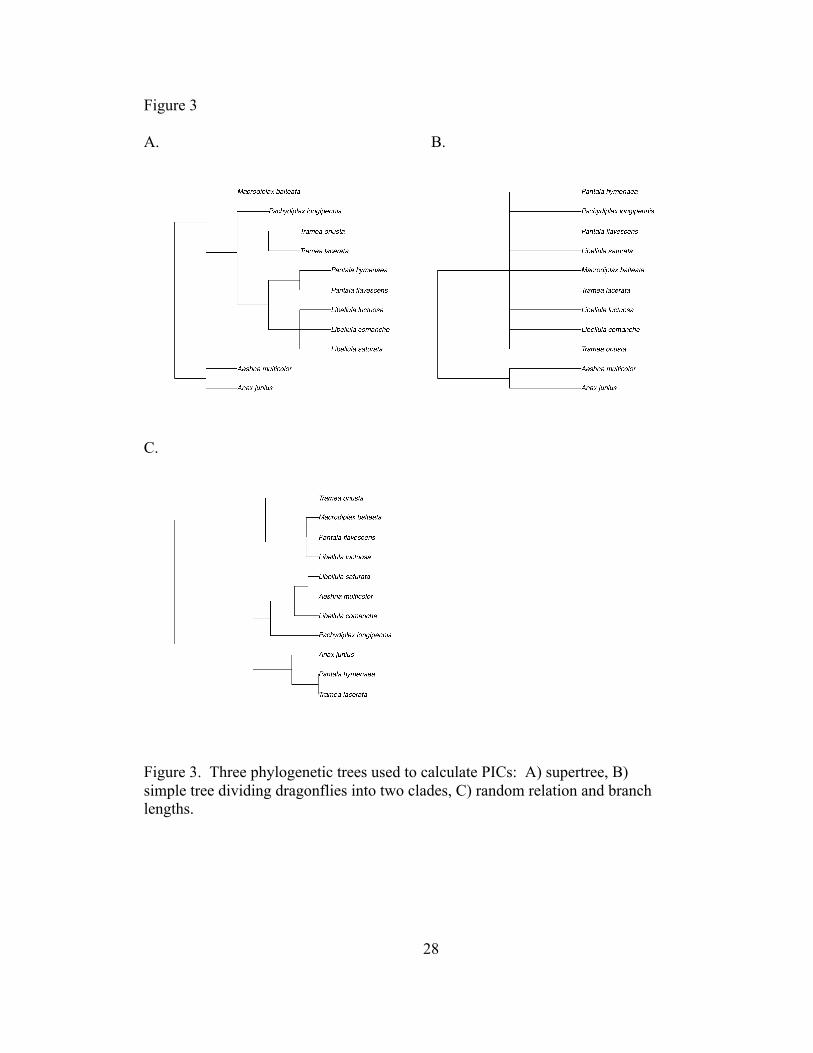
To calculate the PICs, a supertree that included all of the species tested at
Zzyzx was constructed by combining two other trees (Saux, 2003; Ware, 2007)
using a strict supertree algorithm (Figure 3; Sanderson, et al., 1998). A second
tree was generated that assumes that all libellulid species were equally related to
each other in a monophyletic clade, while keeping the aeshnids separated. A third
tree was constructed using random branch lengths and relatedness.
All statistical analyses were carried out using R language (R Core
Development Team, 2010; http://www.R-project.org/); graphs were generated
using the ggplot2 and lattice packages (Wickham, 2009; Sarkar, 2008). Results
were determined to be significantly different from the null hypothesis by using an
experimental type I error less than or equal to 5%. Analysis of covariance
(ANCOVA) and linear regressions were used in the analysis of mass effects on
metabolic rates and flight behaviors. All values are shown as means ± S.E.M.
unless otherwise noted.
9
RESULTS
Effect of flight bout duration on CO2 emission rates
Many of the flight bouts were quite short (a few seconds), raising the
question of whether the CO2 emission rates approximated steady-state conditions.
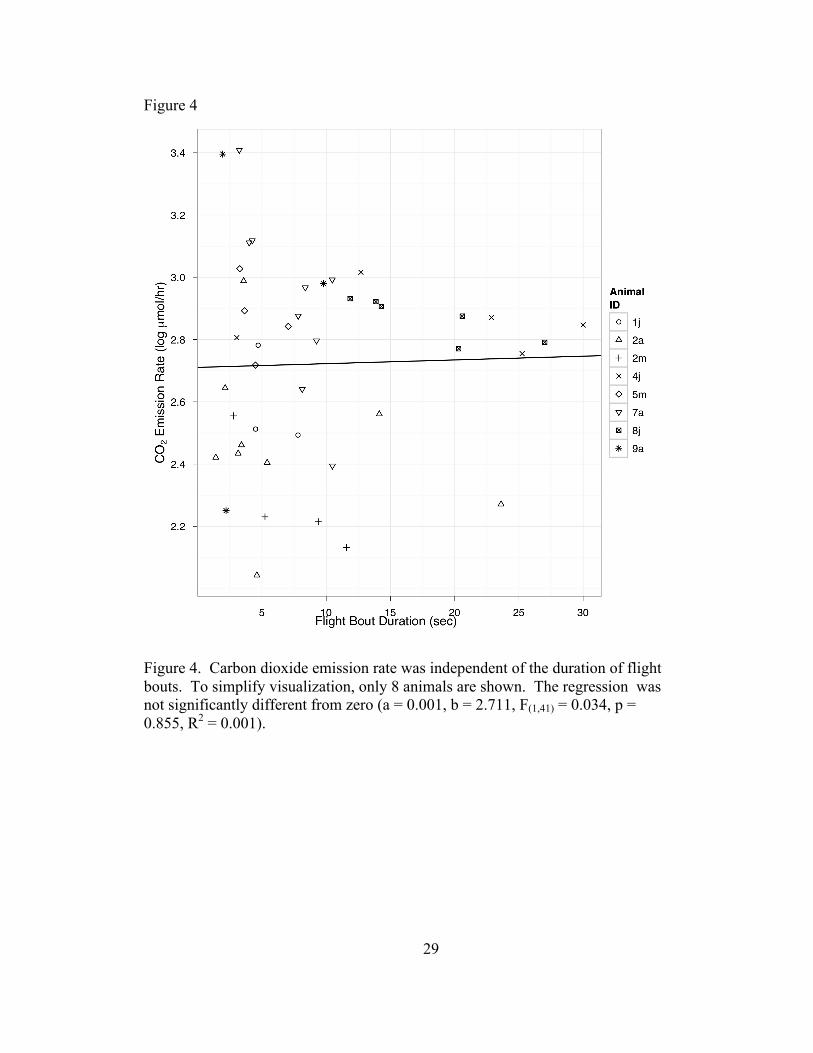
To assess this question, I tested the relationship between flight bout duration and
the measured carbon dioxide emission rate associated with that peak in CO2
emission rate for individual animals flown in 21% nitrox. Although CO2
production rates were more variable when flight bout durations were short, they
were independent of flight bout duration, suggesting that even the very short
flight bouts of a few seconds approximate steady-state flight (Figure 4). CO2
emission scaled non-significantly with mass to the 0.44 power. Though the
regression model was a poor fit, this slope did not significantly differ from the 2/3
power relationship between mass and metabolic rate typically seen in insects (t-
test on slopes: t=0.071, d.f.=9, p>0.05).
Air density effects on flight metabolism and behavior
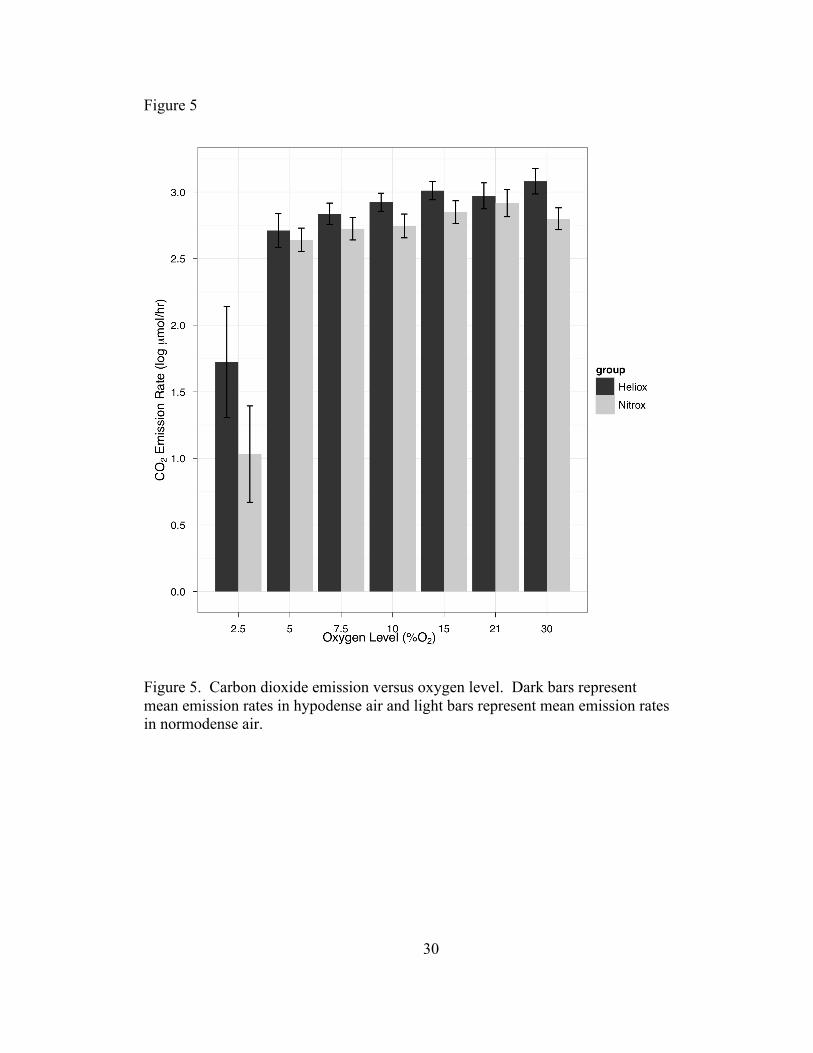
Dragonflies consistently produced carbon dioxide at a higher rate when
hovering in hypodense atmospheres (heliox mixtures, Figure 5, Table 2). CO2
emission rates averaged about 10% higher when the dragonflies were flown in
heliox, but in 2.5% oxygen atmospheres, CO2 emission rates were 75% higher
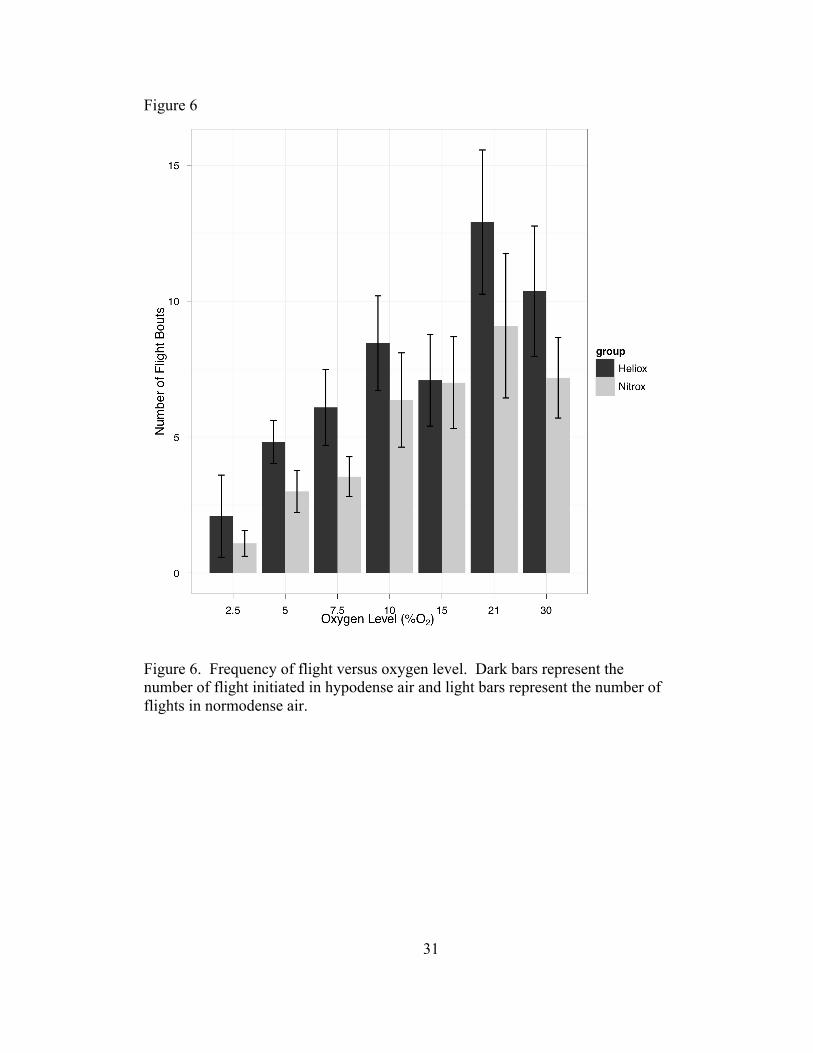
than in nitrox. The flight bouts were also significantly more frequent in heliox gas
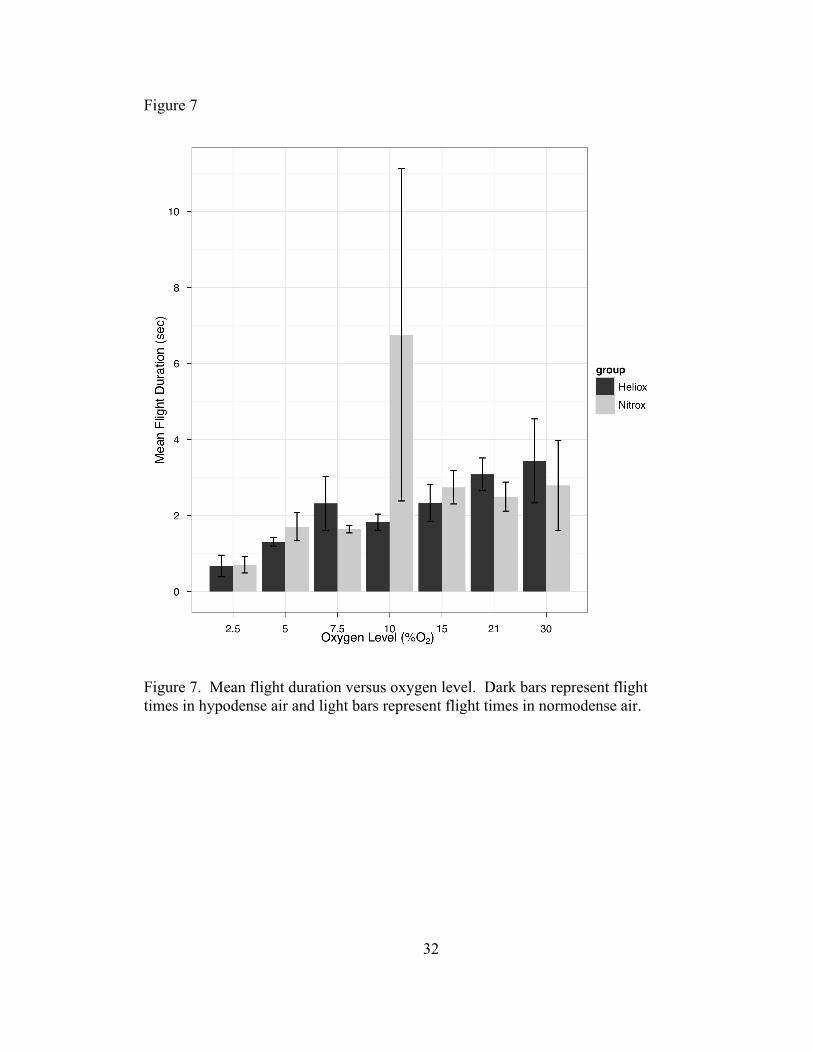
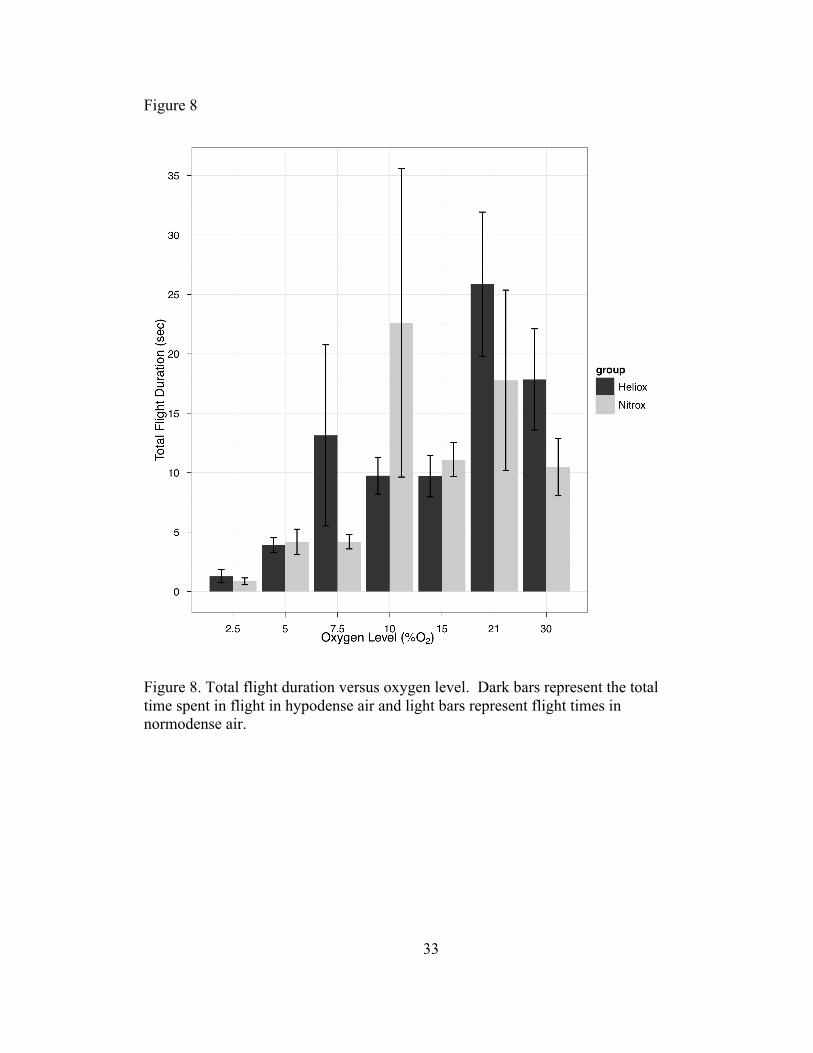
mixtures (Figure 6, Table 3). However, there was no consistent or significant
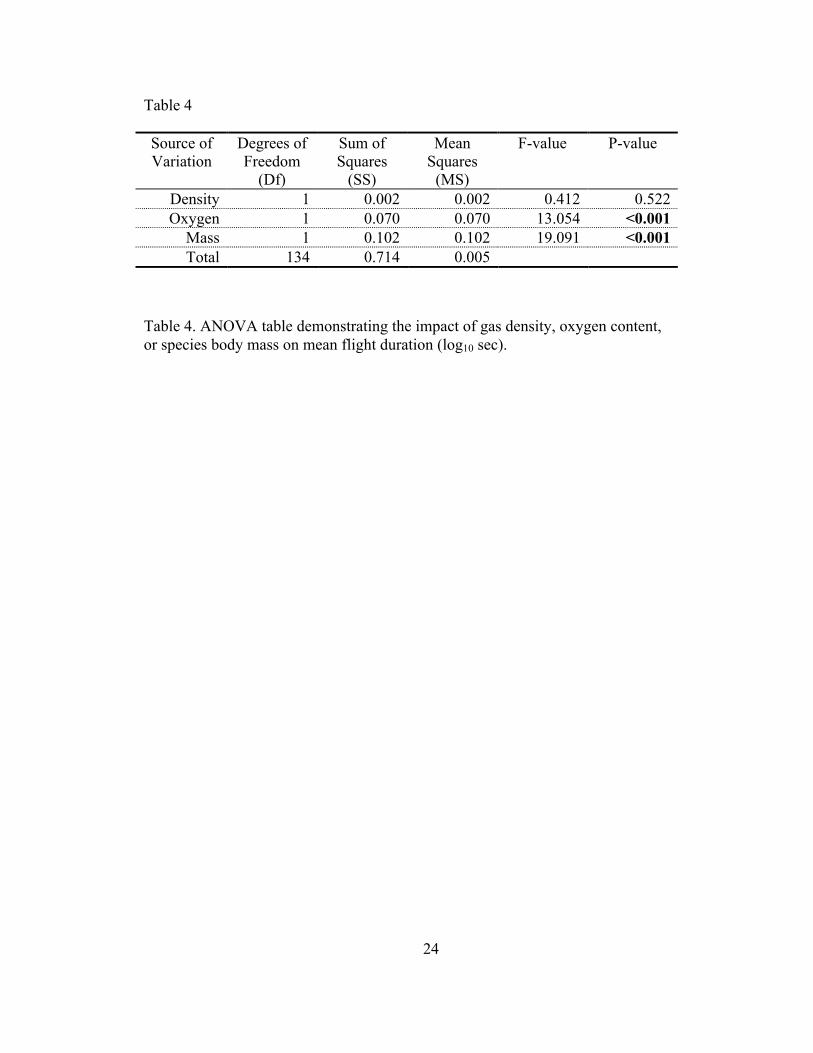
effect of air density on flight bout duration or total flight duration (Tables 4 and
6).
10
Oxygen effects on flight metabolism and behavior
There was an overall effect of oxygen concentration on CO2 emission
rates (Table 2). However, at oxygen concentrations equal or greater than 5%,
carbon dioxide production remained relatively constant; while at 2.5% oxygen,
metabolism rates drop (Figure 5, Table 2). All measures of flight behavior were
highly significantly affected by oxygen level (Tables 3-5), with a general positive
correlation between flight behavior and oxygen level (Figures 6-8).
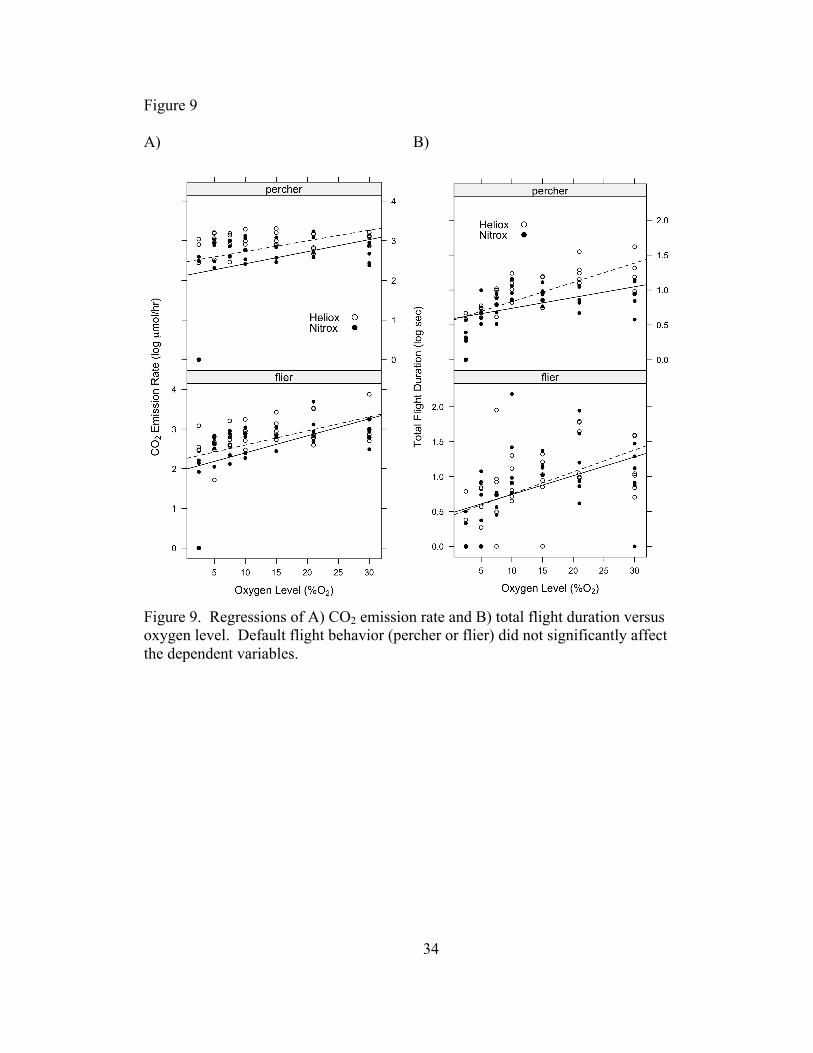
The default flight behavior of each species did not alter the oxygen-
dependent changes to CO2 production or observed flight behavior since slopes of
perchers and fliers were not significantly different (Figure 9).
Body mass effects on flight metabolism and behavior
The size of the dragonfly species did not significantly affect carbon
dioxide production in this study, but it did affect measures of flight behavior
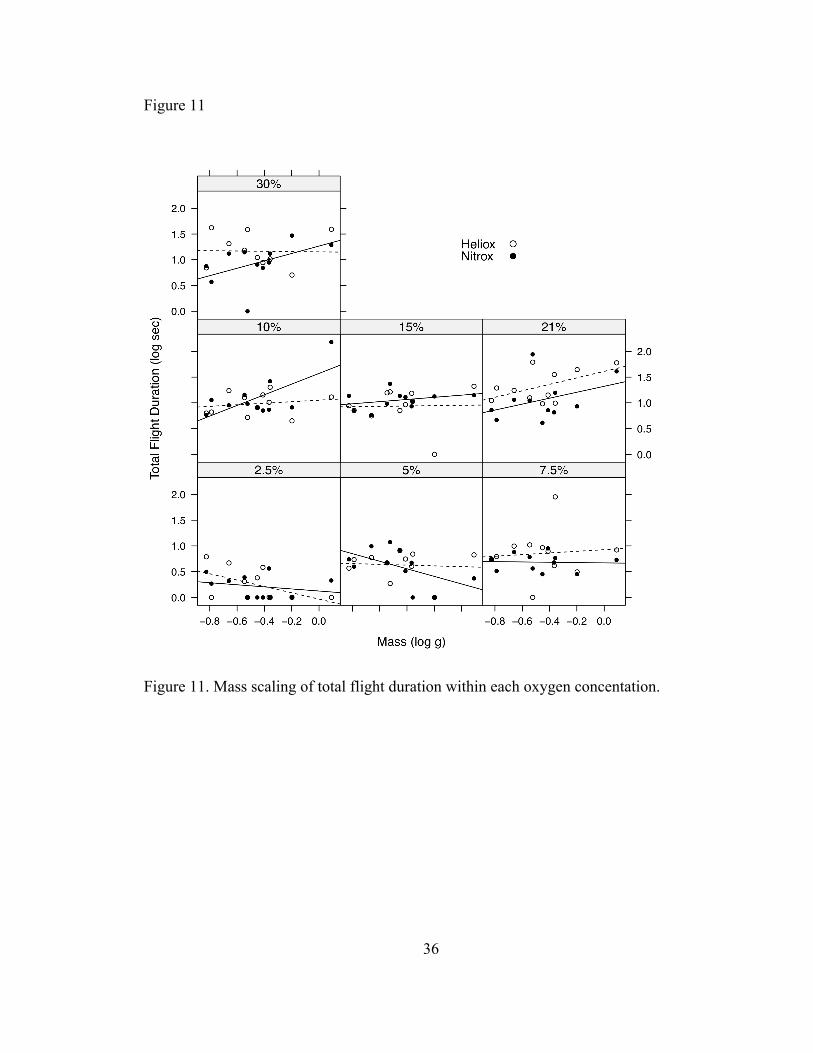
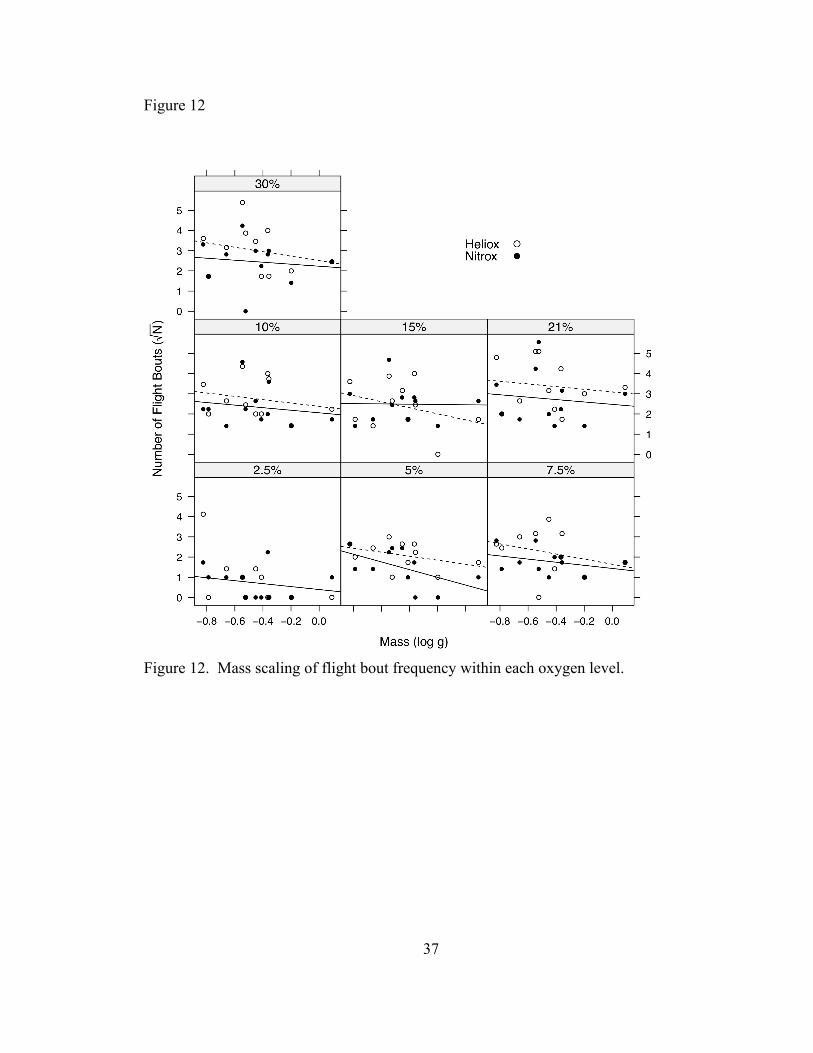
(Tables 2-5). Larger dragonflies generally flew longer (in oxygen levels greater
than 10%) and less often than smaller species (across all oxygen levels; Figures
10-12).
To assess response to oxygen levels within species, I plotted the value for
each dependent variable vs. oxygen and calculated the slope of a linear regression,
assessing nitrox and heliox data separately (Figure 13). Then these slopes were
plotted vs. mass to test whether larger animals were more responsive to varying
oxygen level. The response of CO2 emission rate to oxygen level was not
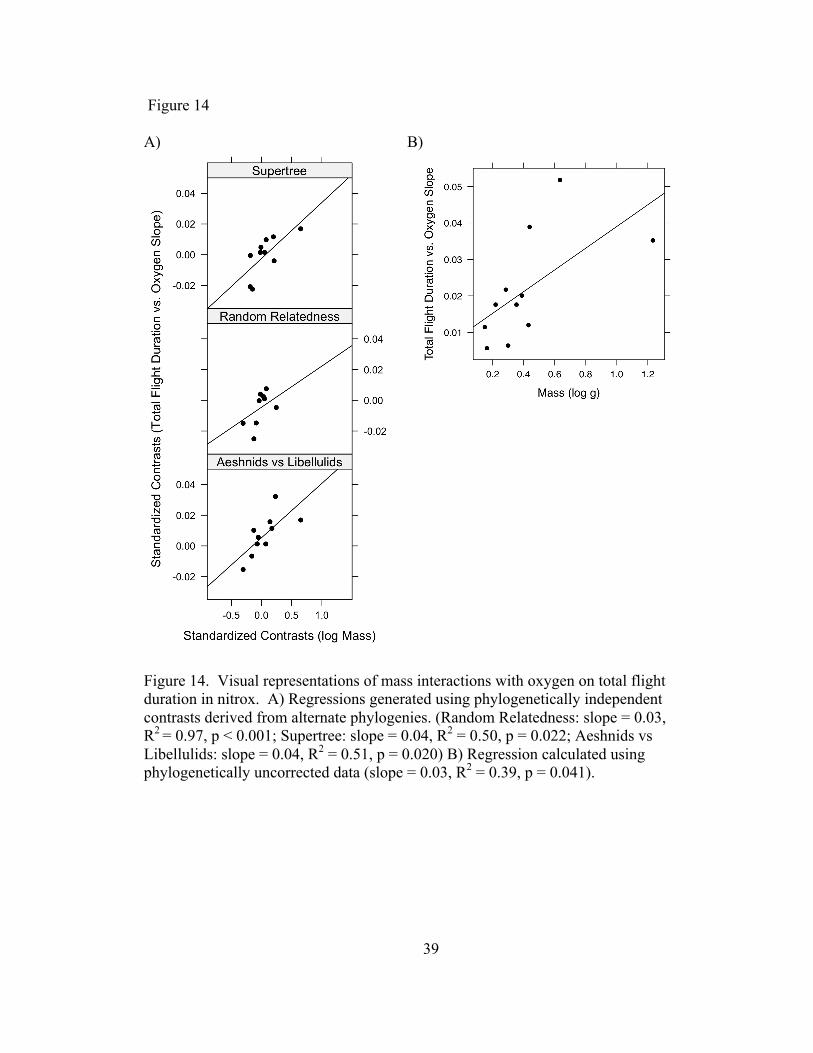
statistically related to body mass. However, the response of total flight duration to
atmospheric oxygen in nitrox atmospheres was greater in larger dragonflies
11
(Figure 14, slope = 0.03 * log mass + 0.01, R2=0.39, p=0.04). The oxygen-
responsiveness of total flight duration in nitrox was also significantly related to
body mass when tested with phylogenetic corrections using both the supertree and
the two clade tree (Supertree: slopes = 0.04 * log mass + -0.002, R2=0.50, p=0.02;
Aeshnids vs Libellulids: slopes = 0.04 * log mass + 0.01, R2=0.51, p=0.02; Figure
14). However, randomly generated trees eliminated the significant relationship
between oxygen-responsiveness of flight duration and body mass (Figure 14).
Flight bout number and flight duration tended to show a similar effect
(greater responsiveness in larger insects, all slopes were positive), but these were
not statistically significant. In contrast, slopes of the oxygen-responsiveness of
flight behavior and CO2 emission were not significantly related to body mass in
heliox.
12
DISCUSSION
My study is one of the first to test oxygen-sensitivity during aerobic flight
across multiple species. Observed oxygen responsiveness for flight metabolic
rate was independent of mass, suggesting that hovering flight performance was
relatively invariant. However, larger dragonflies showed a stronger correlation
between oxygen level and the total duration of flight, indicating that the
concentration of oxygen does influence either the commencement or termination
of flight behavior. Since the effects on behavior match our predictions, these data
do provide new evidence that larger insects can be more responsive to changes in
atmospheric oxygen.
Reliability of the flight CO2 emission rates
The low sample size used in this experiment likely contributed to the low
power of tests and resulted in poorly fit regressions when calculating the mass-
scaling of metabolic rate in different oxygen levels. Despite this, there was a
clear positive relationship between the mass of these dragonflies and their carbon
dioxide emission rates and the slope found in this student (0.44) was not
significantly different from similar slopes found in other studies looking at insect
metabolic rates (Niven and Scharlemann, 2005). A number of other factors could
also contribute to the lower than expected correlation between mass and
metabolic rate. Dragonflies may have lower wingbeat frequencies compared to
other insects of similar size resulting in lower metabolic rates or the larger
dragonfly species captured may not have been flying optimally in the small
13
chamber used in this experiment thereby reducing the observed correlation
between mass and CO2 production.
Flight durations were quite short in this study (averaging 2.86 ± 0.36 sec)
since most of the dragonfly species (though able to hover) were not willing to
maintain steady flight in the flight chamber. Harrison and Lighton (1998)
measured much longer flight durations; however, they chose their target species
specifically for its long duration flights in a respirometer. This raises the question
of whether the flight CO2 emission rates could be measured accurately, and
represented steady-state conditions. Unlike vertebrates, insects rely almost
exclusively on aerobic metabolism to fuel flight (Beenakkers et al., 1985)
therefore even very short flight bursts would be expected to show some CO2
production. However, ATP stores within flight muscle cells are low often
requiring the use of arginine phosphate as a temporary substrate for ATP
production. Arginine phosphate can also act as an energy shuttle moving
phosphate rapidly between the mitochondria and myofibrils (Schneider et al.,
1989) which could account for the nearly instantaneous increase in insect flight
metabolism that is typically observed.
I found no relationship between flight duration and flight CO2 emission
rate (Figure 4), suggesting that even flights of a few seconds represented steady-
state conditions. In addition, assuming a respiratory exchange ratio of 1 indicative
of a carbohydrate-based metabolism, the flight metabolic rates recorded in this
study (0.05 to 0.38 Watts) were similar to reported values for Erythemis
simplicicollis and Sympetrum sanguineum (0.12 Watts and 0.02 Watts
14
respectively; Harrison and Lighton, 1998; Wakeling and Ellington, 1997). My
estimates of metabolic rate for Anax junius (0.134 Watts) were lower than those
reported by May (0.37 Watts; 1995); however, that study used thorax temperature
during flight to estimate power generation. Also, May showed that these
dragonflies decreased wingbeat frequency, thorax temperature, and had lower
metabolic rates as ambient temperature increased (1995). My animals were
consistently flown at a high temperature of 30°C while the highest temperature
recorded in May’s study was 26.5°C (1995).
Oxygen-sensitivity of flight metabolism and behavior
Since most animals were able to fly in oxygen levels of at least 5%,
dragonflies seem to adequately deliver oxygen to metabolically active tissues
regardless of size. This conclusion differs from the findings for a single species
of dragonfly, Erythemis simplicicollis (Harrison and Lighton, 1998). For this
species, it was found that hyperoxia stimulated CO2 emission rates, though flight
behavior did not differ from normoxia. I suspect that this difference may relate to
the relatively low power of this study to detect changes in CO2 emission rate in
response to oxygen. The single-species study of Harrison and Lighton (1998)
measured 25 individuals at each oxygen level, compared to 1-4 individuals per
species in this study, leading to a much greater power to detect significant, within-
species changes in flight parameters with oxygen.
The high temperature used in this study may have also served to inhibit
flight performance as animals attempted to reduce thorax temperatures (May,
1995). Since maximal flight performance might not have been achieved,
15
regardless of atmospheric density, changes in behavior should be a better index of
the sensitivity of these animals to hypoxia.
Inducing maximal flight power output by using hypodense air
Dudley (1995) demonstrated the power production in Orchid bees can
increase up to 45% when flown in a hypodense normoxic atmosphere. This
method of forcing insects to work harder has many benefits compared to the
alternatives traditionally chosen. Attaching weights or tethering the insect may
alter an insect’s center of gravity or might reduce the animal’s motivation to fly.
Roberts (2004) used this same method to study the kinematics and
metabolic rates of Carpenter bees. In this case, Roberts maintained normoxic
conditions, but altered the proportion of He to N2 in his balance gasses. Only the
smallest bees in his study were capable of achieving flight in the 100% heliox
mixture; this gas mix is 0.8 kg ml-1 less dense than 100% nitrox.
In my study, balance gas significantly affected metabolic rate and the
number of flight bouts (Figures 5 and 6), but did not play a role in the other
measures of flight behavior. This suggests that the high concentration of helium
in the balance gas improved diffusive gas exchange to the tissues. In fact, the
gas-phase diffusion coefficient of oxygen in helium is 3.67 times greater than in
nitrogen (Timmons, 2000).
Oxygen delivery as a factor limiting body size in insects?
Overall, the behavior of larger odonates tended to be more oxygen-
sensitive than that of smaller species (Figure 14). In particular, the total time
spent in flight was significantly reduced for larger animals exposed to low oxygen
16
levels in normodense atmospheres. This evidence supports the hypothesis that
highly active insects may be more responsive to changes to atmospheric oxygen,
which, in turn, may have been a major contributing factor in limiting insect size.
To add to this body of evidence, more work could be done to investigate
the ventilatory mechanisms utilized by dragonflies during flight. While flight
behavior was sensitive to oxygen level, flight metabolic rates were not. Unlike
vertebrates, insects demonstrate a proportional investment in respiratory
structures (via tracheal hypermetry) as body size increases (Greelee, et al., 2009;
Lease, et al., 2006; Kaiser, et al., 2007). By looking at the tracheal morphology
of dragonflies using similar methods, it should be possible to determine if the
flight metabolic rates’ insensitivity to oxygen was due to an overbuilt respiratory
system in larger dragonflies.
17
REFERENCES
Beenakkers, A. M. T. , Van der Horst, D. J. and Van Marrewijk, W. J. A. (1985). Biochemichal processes directed to flight muscle metabolism. In Comprehensive Insect Physiology, Biochemistry, and Pharmcology, vol 10. Oxford: Pergamon. pp. 451-486.
Blackburn, T. M. and Gaston, K. J. (1994). Animal body size distributions:
patterns, mechanisms and implications. Trends Ecol. Evol. 9, 471-474. Damuth, J. (1981). Population density and body size in mammals. Nature 290,
699-700. Dudley, R. (1995). Extraordinary flight performance of orchid bees (Apidae,
Euglossini) hovering in heliox (80 percent He/20 percent O2). J. Exp. Biol. 198, 1065-1070.
Felsenstein, J. (1985). Phylogenies and the comparative method. Amer. Nat. 125,
1-15. Frazier, M. R., Woods, H. A. and Harrison, J. F. (2001). Interactive effects of
rearing temperature and oxygen on the development of Drosophila melanogaster. Physiol. Biochem. Zool. 74, 641-650.
Graham, J. B., Dudley, R., Aguilar, N. M. and Gans, C. (1995). Nature 375,
117-120. Greenburg, S. and Ar, A. (1996). Effects of chronic hypoxia, normoxia and
hyperoxia on larval development in the beetle Tenebrio molitor. J. Insect Physiol. 42, 991-996.
Greenlee, K. J. and Harrison, J. F. (2004a). Development of respiratory
function in the American locust Schistocerca americana. I. Across-instar effects. J. Exp. Biol. 207, 497–508.
Greenlee, K. J. and Harrison, J. F. (2005). Respiratory changes throughout
ontogeny in the tobacco hornworm caterpillar, Manduca sexta. J. Exp. Biol. 208, 1385–1392.
Greenlee, K. J., Nebeker, C., and Harrison, J. F. (2007). Body size-
independent safety margins for gas exchange across grasshopper species. J. Exp. Biol. 210, 1288–1296.
Greenlee, K. J., Henry, J. R., Kirkton, S. D., Westneat, M. W., Fezzaa, K.,
Lee, W.-K., and Harrison, J. F. (2009). Synchrotron imaging of the
18
grasshopper tracheal system: morphological and physiological components of tracheal hypermetry. AJP – Regu. Physiol. 297, R1343-R1350.
Harrison, J., Frazier, M. R., Henry, J. R., Kaiser, A., Klok, C. J., Rascón, B.
(2006). Responses of terrestrial insects to hypoxia or hyperoxia. Resp. Physiol. Neurobiol. 154, 4–17.
Harrison, J. F. and Lighton, J. R. B. (1998). Oxygen-sensitive flight
metabolism in the dragonfly Erythemis simplicicollis. J. Exp. Biol. 201, 1739–1744.
Henry, J. R. and Harrison, J. F. (2004). Plastic and evolved responses of larval
tracheae and mass to varying atmospheric oxygen content in Drosophila melanogaster. J. Exp. Biol. 207, 3559–3567.
Kaiser, A., Klok, C. J., Socha, J. J., Lee, W.-K., Quinlan, M. C., and
Harrison, J. F. (2007). Increase in tracheal investment with beetle size supports hypothesis of oxygen limitation on insect gigantism. Proc. Natl. Acad. Sci. USA 104, 13198-13203.
Kammer, A.E. and Heinrich, B. (1978). Insect flight metabolism. Adv. Insect
Phys. 13, 133-228. Kirkton, S. D., Niska, J. A., and Harrison, J. F. (2005). Ontogenetic effects on
aerobic and anaerobic metabolism during jumping in the American locust, Schistocerca americana. J. Exp. Biol. 208, 3003–3012.
Lease, H. M., Wolf, B. O., and Harrison, J. F. (2006). Intraspecific variation in
tracheal volume in the American locust, Schistocerca americana, measured by a new inert gas method. J. Exp. Biol. 209, 3476-3483.
Loudon, C. (1989). Tracheal hypertrophy in mealworms: design and plasticity in
oxygen supply systems. J. Exp. Biol. 147, 217-235. Marden, J. H. (1994). From damselflies to pterosaurs: how burst and sustainable
May, M. L. (1995). Dependence of flight behavior and heat production on air
temperature in the green darner dragonfly Anax junius (Odonata: Aeshnidae). J. exp. Biol. 198, 2385–2392.
Niven, J. E. and Scharlemann, J. P. W. (2005). Do insect metabolic rates at rest
and during flight scale with body mass? Biol Lett. 1, 346–349.
19
Paradis E., Claude J. & Strimmer K. (2004). APE: analyses of phylogenetics
and evolution in R language. Bioinformatics 20, 289-290. Peck, L. S. and Maddrell, S. H. P. (2005). Limitation of size by hypoxia in the
fruit fly Drosophila melanogaster. J. Exp. Zool. A Comp. Exp. Biol. 303A, 968–975.
Polcyn, D. M. (1994.) Thermoregulation during summer activity in Mojave
Desert dragonflies (Odonata: Anisoptera). Funct Ecol 8, 441-449. Price, Peter W. (1997). “The world of the insect: size and scaling in moderately
small organisms”. In Insect Ecology, 3rd ed. New York, NY: John Wiley & Sons.
R Development Core Team (2010). R: A language and environment for
statistical computing. Vienna, Austria: R Foundation for Statistical Computing. http://www.R-project.org/.
Rascón, B. and Harrison, J. F. (2005). Oxygen partial pressure effects on
metabolic rate and behavior of tethered flying locusts. J. Insect Physiol. 51, 1193–1199.
Roberts, S. P., Harrison, J. F., and Dudley, R. (2004). Allometry of kinematics
and energetics in carpenter bees (Xylocopa varipuncta) hovering in variable-density gases. J. Exp. Biol. 207, 993-1004.
Sanderson, M. J., Purvis, A., and Henze, C. (1998). Phylogenetic supertrees:
assembling the trees of life. TREE 13, 105-109. Sarkar, D. (2008). Lattice: Multivariate Data Visualization with R. New York:
Springer. Saux, C., Simon, C., and Spicer, G. S. (2003). Phylogeny of the dragonfly and
damselfly order Odonata as inferred by mitochondrial 12S ribosomal RNA sequences. Ann. Entomol. Soc. Am. 96, 693-699.
Schneider, A., Wiesner, R. J. and Grieshaber, M. K. (1989). On the role of
arginine kinase in insect flight muscle. Insect Biochem. 19, 471-480. Timmons, G. S., Bechara, E. J. H., and Swartz, H. M. (2000). Direct
determination of the kinetics of oxygen diffusion to the photocytes of a bioluminescent elaterid larva, measurement of gas- and aqueous-phase diffusional barriers and modeling of oxygen supply. J. Exp. Biol. 203, 2479-2484.
20
Wakeling, J. M. and Ellington, C. P. (1997). Dragonfly flight. III. Lift and
power requirements. J. Exp. Biol. 200, 583–600. Ware, J., May, M., and Kjer, K. (2007). Phylogeny of the higher Libelluloidea
(Anisoptera: Odonata): An exploration of the most speciose superfamily of dragonflies. Mol. Phylogenet. Evol. 45, 289–310.
Weis-Fogh, T. (1967). Respiration and tracheal ventilation in locusts and other
flying species. J. Exp. Biol. 47, 561-587. Wickham, H. (2009). ggplot2: elegant graphics for data analysis. New York:
Springer.
21
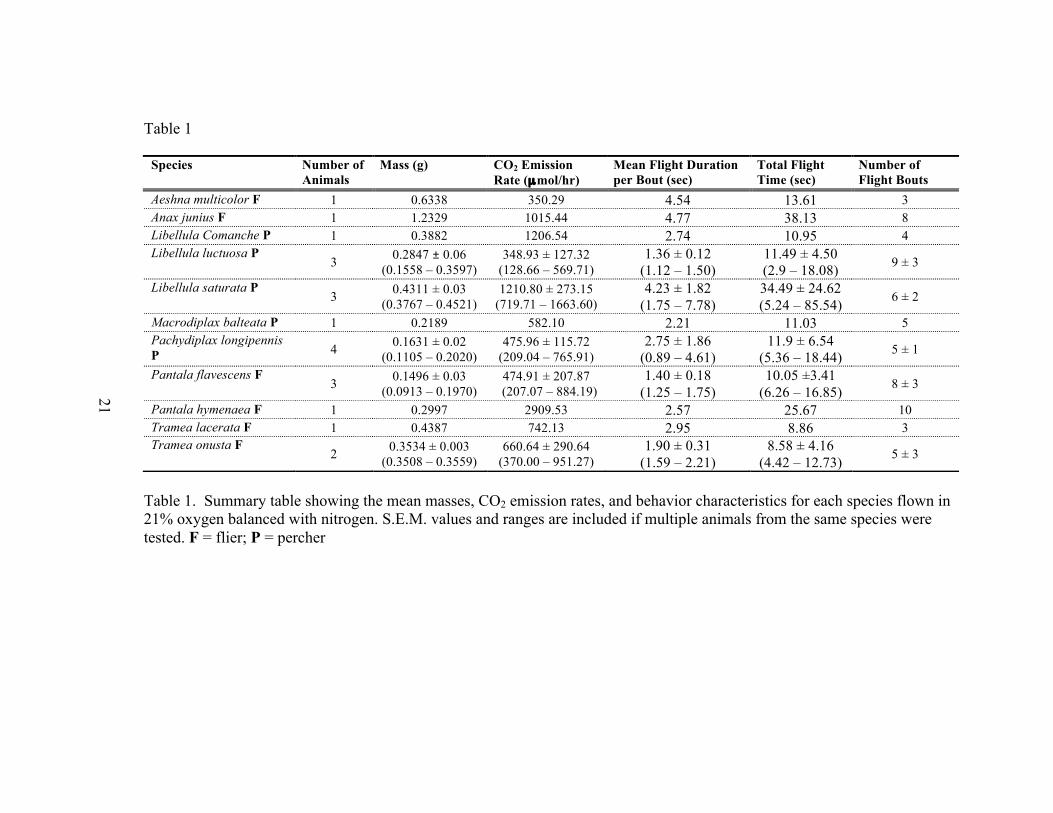
Table 1
Table 1. Summary table showing the mean masses, CO2 emission rates, and behavior characteristics for each species flown in 21% oxygen balanced with nitrogen. S.E.M. values and ranges are included if multiple animals from the same species were tested. F = flier; P = percher
Species Number of Animals
Mass (g) CO2 Emission Rate (µmol/hr)
Mean Flight Duration per Bout (sec)
Total Flight Time (sec)
Number of Flight Bouts
Aeshna multicolor F 1 0.6338 350.29 4.54 13.61 3 Anax junius F 1 1.2329 1015.44 4.77 38.13 8 Libellula Comanche P 1 0.3882 1206.54 2.74 10.95 4 Libellula luctuosa P
3 0.2847 ± 0.06 (0.1558 – 0.3597)
348.93 ± 127.32 (128.66 – 569.71)
1.36 ± 0.12 (1.12 – 1.50)
11.49 ± 4.50 (2.9 – 18.08) 9 ± 3
Libellula saturata P 3 0.4311 ± 0.03
(0.3767 – 0.4521) 1210.80 ± 273.15
(719.71 – 1663.60) 4.23 ± 1.82
(1.75 – 7.78) 34.49 ± 24.62 (5.24 – 85.54) 6 ± 2
Macrodiplax balteata P 1 0.2189 582.10 2.21 11.03 5 Pachydiplax longipennis P 4 0.1631 ± 0.02
(0.1105 – 0.2020) 475.96 ± 115.72
(209.04 – 765.91) 2.75 ± 1.86
(0.89 – 4.61) 11.9 ± 6.54
(5.36 – 18.44) 5 ± 1
Pantala flavescens F 3 0.1496 ± 0.03
(0.0913 – 0.1970) 474.91 ± 207.87
(207.07 – 884.19) 1.40 ± 0.18
(1.25 – 1.75) 10.05 ±3.41
(6.26 – 16.85) 8 ± 3
Pantala hymenaea F 1 0.2997 2909.53 2.57 25.67 10 Tramea lacerata F 1 0.4387 742.13 2.95 8.86 3 Tramea onusta F
2 0.3534 ± 0.003 (0.3508 – 0.3559)
660.64 ± 290.64 (370.00 – 951.27)
1.90 ± 0.31 (1.59 – 2.21)
8.58 ± 4.16 (4.42 – 12.73) 5 ± 3
22
Table 2
Table 2. ANOVA table demonstrating the impact of gas density, oxygen content, or species body mass on log10 CO2 emission rate.
Mass 1 0.031 0.031 4.641 0.033 Total 135 0.900 0.007
26
Figure 1
Figure 1. Schematic of experimental setup in the field. FC = mass flow controller, NV = needle valves, FM = flow meters. N2, He, and O2 indicate compressed air cylinders with dual-stage regulators, and A/C is the air conditioning unit that was used to regulate the temperature of the temperature-box.
O2
He
N2
A/C
CO2 analyzer
O2 analyzer
Laptop
FC Drierite & Ascarite
NV & FM
Temperature-control chamber
Flight chamber
Pump
Camcorder
27
Figure 2
Figure 2. Representative trace of the carbon dioxide content of excurrent air sampled from the flight chamber. This particular example shows the CO2 produced by the darner, Anax junius, in 30% nitrox. Each flight bout duration is indicated by the width of the light gray bars.
28
Figure 3 A. B.
C.
Figure 3. Three phylogenetic trees used to calculate PICs: A) supertree, B) simple tree dividing dragonflies into two clades, C) random relation and branch lengths.
29
Figure 4
Figure 4. Carbon dioxide emission rate was independent of the duration of flight bouts. To simplify visualization, only 8 animals are shown. The regression was not significantly different from zero (a = 0.001, b = 2.711, F(1,41) = 0.034, p = 0.855, R2 = 0.001).
30
Figure 5
Figure 5. Carbon dioxide emission versus oxygen level. Dark bars represent mean emission rates in hypodense air and light bars represent mean emission rates in normodense air.
31
Figure 6
Figure 6. Frequency of flight versus oxygen level. Dark bars represent the number of flight initiated in hypodense air and light bars represent the number of flights in normodense air.
32
Figure 7
Figure 7. Mean flight duration versus oxygen level. Dark bars represent flight times in hypodense air and light bars represent flight times in normodense air.
33
Figure 8
Figure 8. Total flight duration versus oxygen level. Dark bars represent the total time spent in flight in hypodense air and light bars represent flight times in normodense air.
34
Figure 9 A) B)
Figure 9. Regressions of A) CO2 emission rate and B) total flight duration versus oxygen level. Default flight behavior (percher or flier) did not significantly affect the dependent variables.
35
Figure 10
Figure 10. Mass scaling of flight duration within each oxygen concentation.
36
Figure 11
Figure 11. Mass scaling of total flight duration within each oxygen concentation.
37
Figure 12
Figure 12. Mass scaling of flight bout frequency within each oxygen level.
38
Figure 13
Figure 13. Representative graph showing the linear regressions performed within each species. The resultant slopes from each graph was recorded and used to test if there was an interaction between each dependent variable and mass.
39
Figure 14 A) B)
Figure 14. Visual representations of mass interactions with oxygen on total flight duration in nitrox. A) Regressions generated using phylogenetically independent contrasts derived from alternate phylogenies. (Random Relatedness: slope = 0.03, R2 = 0.97, p < 0.001; Supertree: slope = 0.04, R2 = 0.50, p = 0.022; Aeshnids vs Libellulids: slope = 0.04, R2 = 0.51, p = 0.020) B) Regression calculated using phylogenetically uncorrected data (slope = 0.03, R2 = 0.39, p = 0.041).