URISA Journal ■ Palmer, Shan 19 Introduction Light Detection and Ranging (lidar) is a terrain and urban information acquisition technique based on laser technology. It uses a downward-pointing laser, transmitting very short pulses or a modulated signal in the visible or near infrared part of the electromagnetic spectrum (Rees 1999). Back-scattered radiation is detected and analyzed for time delay, amplitude, or frequency, depending on the application. Lidar is quite similar to radar, but utilizes shorter wavelengths. Other terms such as ladar, laser radar, laser fluoro-sensor, and laser bathymeter are also used for various applications of this technology. Lidar techniques have been studied and utilized since the early 1960’s, but appear to have become more prominent in the past few years. Lidar has found applications in a wide variety of fields of study, including atmospheric science, bathymetric data collection, law enforcement, telecommunications, and even steel production (Maune et al. 2000). In this article, we present research efforts toward using airborne lidar data along with digital imagery for three-dimensional (3-D) urban modeling and visualization in the ArcView GIS (Geographic Information System) environment. The use of lidar data along with digital imagery for urban modeling and visualization has received greater attention in recent years. This is primarily due to the integration of a lidar system with a Global Positioning System (GPS). A lidar system is often comprised of a laser scanner, a cooling system, a GPS receiver, and an Inertial Navigation System (Airborne 1 Corporation 1999). The position and orientation of the aircraft are recorded at each transmission of the laser pulse. These measurements, combined with the round-trip travel time of the laser pulses, make it pos- sible to obtain 3-D coordinates of each ground reflection point. Another factor that expands lidar application in terrain science is its potential integration with rapidly improving and affordable GIS packages. Advantages of using lidar for terrain and urban applications include the following: lidar allows rapid generation of a large-scale DTM (digital terrain model); lidar is daylight A Comparative Study on Urban Visualization Using LIDAR Data in GIS Trent C. Palmer and Jeffrey Shan Abstract: Light Detection and Ranging (lidar) is a remote sensing technique utilizing laser technology that has found applica- tions in a wide variety of fields. This article focuses on the application of lidar data and digital imagery to three-dimensional urban visualization in a geographic information system (GIS) environment. An ArcView GIS package with advanced 3-D analysis and modeling extensions is used for the study. Both interactive and automatic approaches are investigated and compared. The problems encountered are analyzed. An integration of both approaches provided satisfactory results. This study shows that existing powerful GIS tools can be effectively used to process urban lidar data so that most urban buildings can be modeled and visualized satisfactorily through an automated process. Manual delineation is needed to precisely define building footprints and separate the buildings from the ground. Results from the built-up urban area of downtown Baltimore, Maryland are presented to support the analyses. independent, is relatively weather independent, and is extremely precise (3Di, LLC 2000). In addition, because lidar operates at much shorter wavelengths, it has higher accuracy and resolution than microwave radar (Jelalian 1992). A number of publications have addressed the use of lidar data in many different fields. Urban planning has been identified as a major benefactor of realistic visualization. Lidar has been used for topographic mapping of forested terrain and other areas not suitable for aerial photography (Wever and Lindenberger 1999). As each data point is georeferenced, the lidar data can also be easily merged with other data sources (Kletzli and Peterson 1998). Hug (1997) stated that laser scanners are the best choice for obtaining digital surface models, especially for dense urban areas. Haala and Brenner (1997) reported on similar work that uses airborne lidar data for the generation of 3-D city models. Kim et al. (2000) provided a concise examination of using photogrammetric imag- ery and lidar data for obtaining a DTM in urban areas. Förstner (1999) presented a thorough and informative discussion of the problems encountered in acquiring and establishing the building models. Although fully automatic techniques are improving, a re- view of extant acquisition systems has revealed that, up to the date of writing, the systems have not proved to be reliable enough to be used alone. Another interested party is the telecommunication industry that uses information in 3-D city models for planning the locations of antennas (Brenner 1999, Kirtner 2000). The desired ultimate outcome of urban modeling is realistic visualiza- tion (Danahy 1999, Bhagawati 2000). Fritsch (1999) stated that the overlay of laser scan data with digital aerial imagery delivered the first virtual 3-D model. It has been pointed out that as many available data sources as possible ought to be used to obtain a truly virtual urban model through the data fusion process of ground plans, aerial photographs, and laser scanning (Förstner 1999, Fritsch 1999, Toth and Grejner-Brzezinska 2000) The objective of this work is to study the methodology and efficiency of urban modeling and visualization by integrating
Transcript
URISA Journal ■ Palmer, Shan 19
IntroductionLight Detection and Ranging (lidar) is a terrain and urban information acquisition technique based on laser technology. It uses a downward-pointing laser, transmitting very short pulses or a modulated signal in the visible or near infrared part of the electromagnetic spectrum (Rees 1999). Back-scattered radiation is detected and analyzed for time delay, amplitude, or frequency, depending on the application. Lidar is quite similar to radar, but utilizes shorter wavelengths. Other terms such as ladar, laser radar, laser fl uoro-sensor, and laser bathymeter are also used for various applications of this technology. Lidar techniques have been studied and utilized since the early 1960’s, but appear to have become more prominent in the past few years. Lidar has found applications in a wide variety of fi elds of study, including atmospheric science, bathymetric data collection, law enforcement, telecommunications, and even steel production (Maune et al. 2000). In this article, we present research efforts toward using airborne lidar data along with digital imagery for three-dimensional (3-D) urban modeling and visualization in the ArcView GIS (Geographic Information System) environment.
The use of lidar data along with digital imagery for urban modeling and visualization has received greater attention in recent years. This is primarily due to the integration of a lidar system with a Global Positioning System (GPS). A lidar system is often comprised of a laser scanner, a cooling system, a GPS receiver, and an Inertial Navigation System (Airborne 1 Corporation 1999). The position and orientation of the aircraft are recorded at each transmission of the laser pulse. These measurements, combined with the round-trip travel time of the laser pulses, make it pos-sible to obtain 3-D coordinates of each ground refl ection point. Another factor that expands lidar application in terrain science is its potential integration with rapidly improving and affordable GIS packages. Advantages of using lidar for terrain and urban applications include the following: lidar allows rapid generation of a large-scale DTM (digital terrain model); lidar is daylight
A Comparative Study on Urban Visualization Using LIDAR Data in GIS
Trent C. Palmer and Jeffrey Shan
Abstract: Light Detection and Ranging (lidar) is a remote sensing technique utilizing laser technology that has found applica-tions in a wide variety of fi elds. This article focuses on the application of lidar data and digital imagery to three-dimensional urban visualization in a geographic information system (GIS) environment. An ArcView GIS package with advanced 3-D analysis and modeling extensions is used for the study. Both interactive and automatic approaches are investigated and compared. The problems encountered are analyzed. An integration of both approaches provided satisfactory results. This study shows that existing powerful GIS tools can be effectively used to process urban lidar data so that most urban buildings can be modeled and visualized satisfactorily through an automated process. Manual delineation is needed to precisely defi ne building footprints and separate the buildings from the ground. Results from the built-up urban area of downtown Baltimore, Maryland are presented to support the analyses.
independent, is relatively weather independent, and is extremely precise (3Di, LLC 2000). In addition, because lidar operates at much shorter wavelengths, it has higher accuracy and resolution than microwave radar (Jelalian 1992).
A number of publications have addressed the use of lidar data in many different fi elds. Urban planning has been identifi ed as a major benefactor of realistic visualization. Lidar has been used for topographic mapping of forested terrain and other areas not suitable for aerial photography (Wever and Lindenberger 1999). As each data point is georeferenced, the lidar data can also be easily merged with other data sources (Kletzli and Peterson 1998). Hug (1997) stated that laser scanners are the best choice for obtaining digital surface models, especially for dense urban areas. Haala and Brenner (1997) reported on similar work that uses airborne lidar data for the generation of 3-D city models. Kim et al. (2000) provided a concise examination of using photogrammetric imag-ery and lidar data for obtaining a DTM in urban areas. Förstner (1999) presented a thorough and informative discussion of the problems encountered in acquiring and establishing the building models. Although fully automatic techniques are improving, a re-view of extant acquisition systems has revealed that, up to the date of writing, the systems have not proved to be reliable enough to be used alone. Another interested party is the telecommunication industry that uses information in 3-D city models for planning the locations of antennas (Brenner 1999, Kirtner 2000). The desired ultimate outcome of urban modeling is realistic visualiza-tion (Danahy 1999, Bhagawati 2000). Fritsch (1999) stated that the overlay of laser scan data with digital aerial imagery delivered the fi rst virtual 3-D model. It has been pointed out that as many available data sources as possible ought to be used to obtain a truly virtual urban model through the data fusion process of ground plans, aerial photographs, and laser scanning (Förstner 1999, Fritsch 1999, Toth and Grejner-Brzezinska 2000)
The objective of this work is to study the methodology and effi ciency of urban modeling and visualization by integrating
20 URISA Journal • Vol. 14, No. 2 • 2002 ■
airborne lidar data into GIS. The lidar data, an orthoimage, and maps for downtown area of Baltimore, Maryland are used for this study. In particular, the effort investigated both interactive and automated approaches for building extraction and visualization by using ArcView GIS and its extension modules. The differences and properties of the interactive and automated approaches are studied and compared. It was found that the best results are provided by the integration of these two approaches. In addition, a database associated with the extracted buildings is created that contained thematic information about the building name and height. The created urban model and database can be viewed and queried within the GIS.
In this article, a brief overview of the data used for this study is presented. Both interactive and automated approaches to building extraction are then investigated. A comparison shows that the integration of these two approaches can lead to the best modeling and visualization results. Building polygons and their 3-D views are presented. A discussion follows concerning ways to reduce the amount of interaction, classify the lidar data, clean up automatically generated polygons, and integrate thematic infor-mation and its query. This article concludes with a comparison of various approaches and the future promise of urban modeling and visualization using lidar data within a GIS environment.
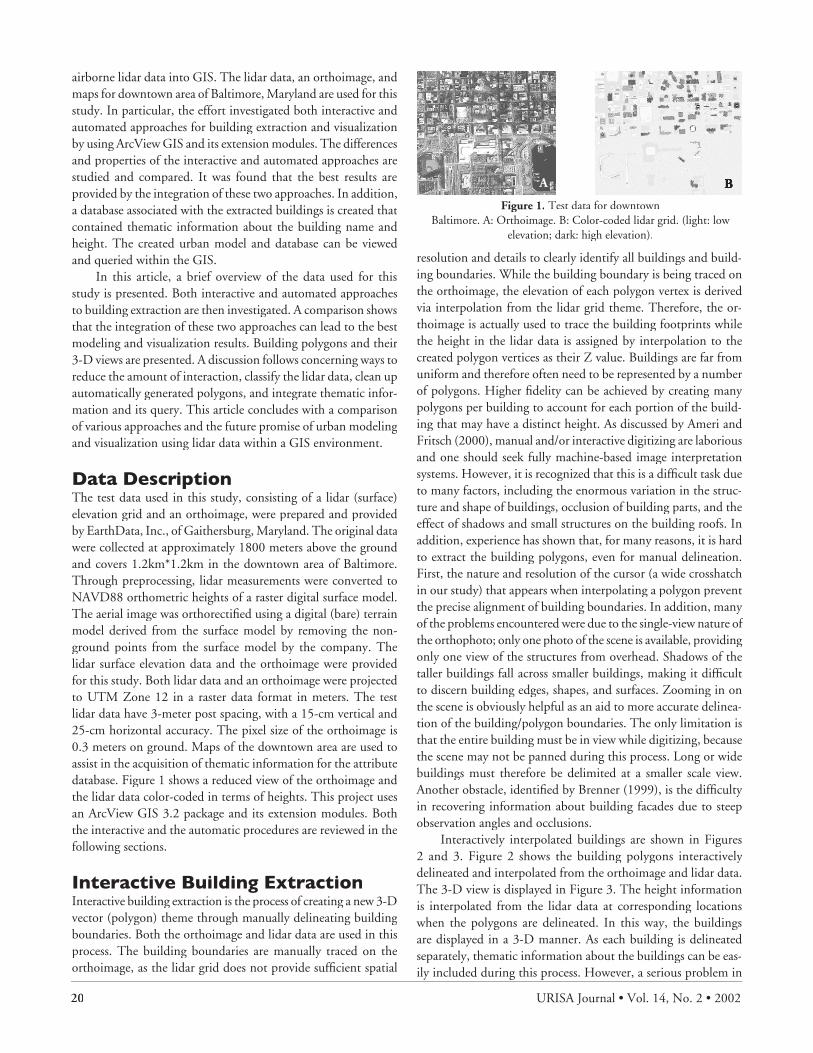
Data DescriptionThe test data used in this study, consisting of a lidar (surface) elevation grid and an orthoimage, were prepared and provided by EarthData, Inc., of Gaithersburg, Maryland. The original data were collected at approximately 1800 meters above the ground and covers 1.2km*1.2km in the downtown area of Baltimore. Through preprocessing, lidar measurements were converted to NAVD88 orthometric heights of a raster digital surface model. The aerial image was orthorectifi ed using a digital (bare) terrain model derived from the surface model by removing the non-ground points from the surface model by the company. The lidar surface elevation data and the orthoimage were provided for this study. Both lidar data and an orthoimage were projected to UTM Zone 12 in a raster data format in meters. The test lidar data have 3-meter post spacing, with a 15-cm vertical and 25-cm horizontal accuracy. The pixel size of the orthoimage is 0.3 meters on ground. Maps of the downtown area are used to assist in the acquisition of thematic information for the attribute database. Figure 1 shows a reduced view of the orthoimage and the lidar data color-coded in terms of heights. This project uses an ArcView GIS 3.2 package and its extension modules. Both the interactive and the automatic procedures are reviewed in the following sections.
Interactive Building ExtractionInteractive building extraction is the process of creating a new 3-D vector (polygon) theme through manually delineating building boundaries. Both the orthoimage and lidar data are used in this process. The building boundaries are manually traced on the orthoimage, as the lidar grid does not provide suffi cient spatial
resolution and details to clearly identify all buildings and build-ing boundaries. While the building boundary is being traced on the orthoimage, the elevation of each polygon vertex is derived via interpolation from the lidar grid theme. Therefore, the or-thoimage is actually used to trace the building footprints while the height in the lidar data is assigned by interpolation to the created polygon vertices as their Z value. Buildings are far from uniform and therefore often need to be represented by a number of polygons. Higher fi delity can be achieved by creating many polygons per building to account for each portion of the build-ing that may have a distinct height. As discussed by Ameri and Fritsch (2000), manual and/or interactive digitizing are laborious and one should seek fully machine-based image interpretation systems. However, it is recognized that this is a diffi cult task due to many factors, including the enormous variation in the struc-ture and shape of buildings, occlusion of building parts, and the effect of shadows and small structures on the building roofs. In addition, experience has shown that, for many reasons, it is hard to extract the building polygons, even for manual delineation. First, the nature and resolution of the cursor (a wide crosshatch in our study) that appears when interpolating a polygon prevent the precise alignment of building boundaries. In addition, many of the problems encountered were due to the single-view nature of the orthophoto; only one photo of the scene is available, providing only one view of the structures from overhead. Shadows of the taller buildings fall across smaller buildings, making it diffi cult to discern building edges, shapes, and surfaces. Zooming in on the scene is obviously helpful as an aid to more accurate delinea-tion of the building/polygon boundaries. The only limitation is that the entire building must be in view while digitizing, because the scene may not be panned during this process. Long or wide buildings must therefore be delimited at a smaller scale view. Another obstacle, identifi ed by Brenner (1999), is the diffi culty in recovering information about building facades due to steep observation angles and occlusions.
Interactively interpolated buildings are shown in Figures 2 and 3. Figure 2 shows the building polygons interactively delineated and interpolated from the orthoimage and lidar data. The 3-D view is displayed in Figure 3. The height information is interpolated from the lidar data at corresponding locations when the polygons are delineated. In this way, the buildings are displayed in a 3-D manner. As each building is delineated separately, thematic information about the buildings can be eas-ily included during this process. However, a serious problem in
Figure 1. Test data for downtown Baltimore. A: Orthoimage. B: Color-coded lidar grid. (light: low
elevation; dark: high elevation).
A B
URISA Journal ■ Palmer, Shan 21
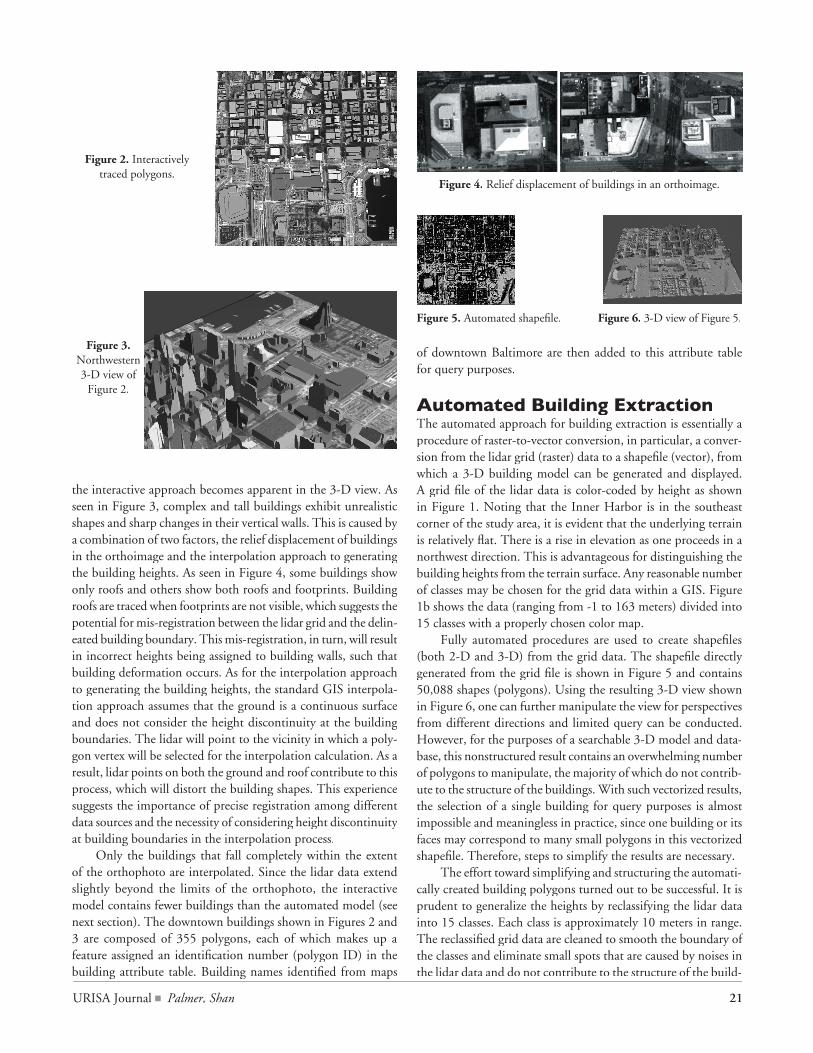
the interactive approach becomes apparent in the 3-D view. As seen in Figure 3, complex and tall buildings exhibit unrealistic shapes and sharp changes in their vertical walls. This is caused by a combination of two factors, the relief displacement of buildings in the orthoimage and the interpolation approach to generating the building heights. As seen in Figure 4, some buildings show only roofs and others show both roofs and footprints. Building roofs are traced when footprints are not visible, which suggests the potential for mis-registration between the lidar grid and the delin-eated building boundary. This mis-registration, in turn, will result in incorrect heights being assigned to building walls, such that building deformation occurs. As for the interpolation approach to generating the building heights, the standard GIS interpola-tion approach assumes that the ground is a continuous surface and does not consider the height discontinuity at the building boundaries. The lidar will point to the vicinity in which a poly-gon vertex will be selected for the interpolation calculation. As a result, lidar points on both the ground and roof contribute to this process, which will distort the building shapes. This experience suggests the importance of precise registration among different data sources and the necessity of considering height discontinuity at building boundaries in the interpolation process.
Only the buildings that fall completely within the extent of the orthophoto are interpolated. Since the lidar data extend slightly beyond the limits of the orthophoto, the interactive model contains fewer buildings than the automated model (see next section). The downtown buildings shown in Figures 2 and 3 are composed of 355 polygons, each of which makes up a feature assigned an identifi cation number (polygon ID) in the building attribute table. Building names identifi ed from maps
Figure 2. Interactively traced polygons.
Figure 3. Northwestern 3-D view of
Figure 2.
of downtown Baltimore are then added to this attribute table for query purposes.
Automated Building ExtractionThe automated approach for building extraction is essentially a procedure of raster-to-vector conversion, in particular, a conver-sion from the lidar grid (raster) data to a shapefi le (vector), from which a 3-D building model can be generated and displayed. A grid fi le of the lidar data is color-coded by height as shown in Figure 1. Noting that the Inner Harbor is in the southeast corner of the study area, it is evident that the underlying terrain is relatively fl at. There is a rise in elevation as one proceeds in a northwest direction. This is advantageous for distinguishing the building heights from the terrain surface. Any reasonable number of classes may be chosen for the grid data within a GIS. Figure 1b shows the data (ranging from -1 to 163 meters) divided into 15 classes with a properly chosen color map.
Fully automated procedures are used to create shapefi les (both 2-D and 3-D) from the grid data. The shapefi le directly generated from the grid fi le is shown in Figure 5 and contains 50,088 shapes (polygons). Using the resulting 3-D view shown in Figure 6, one can further manipulate the view for perspectives from different directions and limited query can be conducted. However, for the purposes of a searchable 3-D model and data-base, this nonstructured result contains an overwhelming number of polygons to manipulate, the majority of which do not contrib-ute to the structure of the buildings. With such vectorized results, the selection of a single building for query purposes is almost impossible and meaningless in practice, since one building or its faces may correspond to many small polygons in this vectorized shapefi le. Therefore, steps to simplify the results are necessary.
The effort toward simplifying and structuring the automati-cally created building polygons turned out to be successful. It is prudent to generalize the heights by reclassifying the lidar data into 15 classes. Each class is approximately 10 meters in range. The reclassifi ed grid data are cleaned to smooth the boundary of the classes and eliminate small spots that are caused by noises in the lidar data and do not contribute to the structure of the build-
Figure 4. Relief displacement of buildings in an orthoimage.
Figure 5. Automated shapefi le. Figure 6. 3-D view of Figure 5.
22 URISA Journal • Vol. 14, No. 2 • 2002 ■
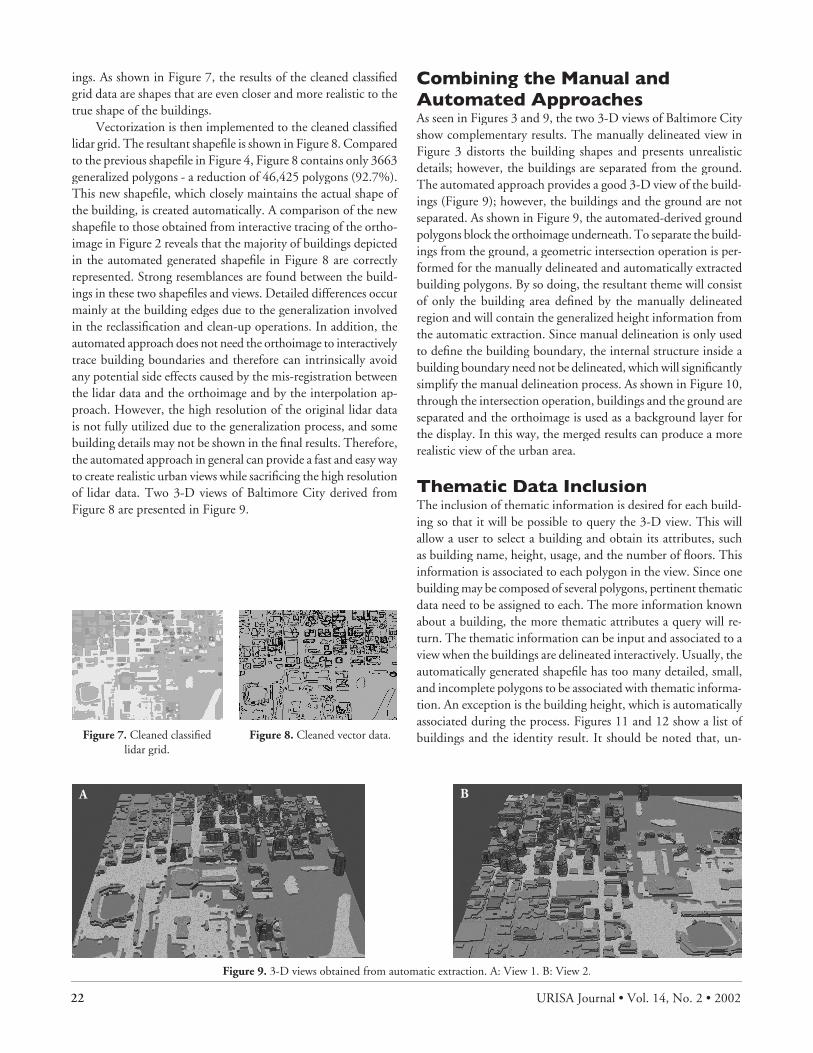
ings. As shown in Figure 7, the results of the cleaned classifi ed grid data are shapes that are even closer and more realistic to the true shape of the buildings.
Vectorization is then implemented to the cleaned classifi ed lidar grid. The resultant shapefi le is shown in Figure 8. Compared to the previous shapefi le in Figure 4, Figure 8 contains only 3663 generalized polygons - a reduction of 46,425 polygons (92.7%). This new shapefi le, which closely maintains the actual shape of the building, is created automatically. A comparison of the new shapefi le to those obtained from interactive tracing of the ortho-image in Figure 2 reveals that the majority of buildings depicted in the automated generated shapefi le in Figure 8 are correctly represented. Strong resemblances are found between the build-ings in these two shapefi les and views. Detailed differences occur mainly at the building edges due to the generalization involved in the reclassifi cation and clean-up operations. In addition, the automated approach does not need the orthoimage to interactively trace building boundaries and therefore can intrinsically avoid any potential side effects caused by the mis-registration between the lidar data and the orthoimage and by the interpolation ap-proach. However, the high resolution of the original lidar data is not fully utilized due to the generalization process, and some building details may not be shown in the fi nal results. Therefore, the automated approach in general can provide a fast and easy way to create realistic urban views while sacrifi cing the high resolution of lidar data. Two 3-D views of Baltimore City derived from Figure 8 are presented in Figure 9.
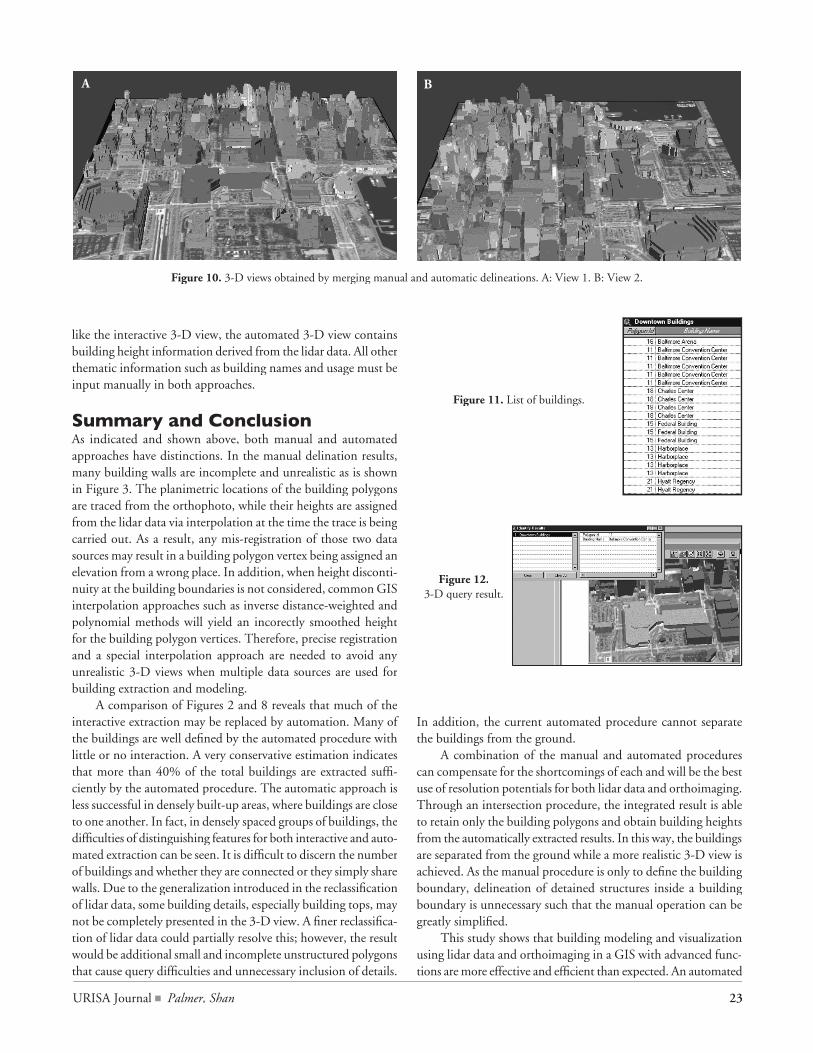
Combining the Manual and Automated Approaches As seen in Figures 3 and 9, the two 3-D views of Baltimore City show complementary results. The manually delineated view in Figure 3 distorts the building shapes and presents unrealistic details; however, the buildings are separated from the ground. The automated approach provides a good 3-D view of the build-ings (Figure 9); however, the buildings and the ground are not separated. As shown in Figure 9, the automated-derived ground polygons block the orthoimage underneath. To separate the build-ings from the ground, a geometric intersection operation is per-formed for the manually delineated and automatically extracted building polygons. By so doing, the resultant theme will consist of only the building area defi ned by the manually delineated region and will contain the generalized height information from the automatic extraction. Since manual delineation is only used to defi ne the building boundary, the internal structure inside a building boundary need not be delineated, which will signifi cantly simplify the manual delineation process. As shown in Figure 10, through the intersection operation, buildings and the ground are separated and the orthoimage is used as a background layer for the display. In this way, the merged results can produce a more realistic view of the urban area.
Thematic Data InclusionThe inclusion of thematic information is desired for each build-ing so that it will be possible to query the 3-D view. This will allow a user to select a building and obtain its attributes, such as building name, height, usage, and the number of fl oors. This information is associated to each polygon in the view. Since one building may be composed of several polygons, pertinent thematic data need to be assigned to each. The more information known about a building, the more thematic attributes a query will re-turn. The thematic information can be input and associated to a view when the buildings are delineated interactively. Usually, the automatically generated shapefi le has too many detailed, small, and incomplete polygons to be associated with thematic informa-tion. An exception is the building height, which is automatically associated during the process. Figures 11 and 12 show a list of buildings and the identity result. It should be noted that, un-Figure 7. Cleaned classifi ed
Figure 10. 3-D views obtained by merging manual and automatic delineations. A: View 1. B: View 2.
Figure 11. List of buildings.
Figure 12.3-D query result.
like the interactive 3-D view, the automated 3-D view contains building height information derived from the lidar data. All other thematic information such as building names and usage must be input manually in both approaches.
Summary and ConclusionAs indicated and shown above, both manual and automated approaches have distinctions. In the manual delination results, many building walls are incomplete and unrealistic as is shown in Figure 3. The planimetric locations of the building polygons are traced from the orthophoto, while their heights are assigned from the lidar data via interpolation at the time the trace is being carried out. As a result, any mis-registration of those two data sources may result in a building polygon vertex being assigned an elevation from a wrong place. In addition, when height disconti-nuity at the building boundaries is not considered, common GIS interpolation approaches such as inverse distance-weighted and polynomial methods will yield an incorectly smoothed height for the building polygon vertices. Therefore, precise registration and a special interpolation approach are needed to avoid any unrealistic 3-D views when multiple data sources are used for building extraction and modeling.
A comparison of Figures 2 and 8 reveals that much of the interactive extraction may be replaced by automation. Many of the buildings are well defi ned by the automated procedure with little or no interaction. A very conservative estimation indicates that more than 40% of the total buildings are extracted suffi -ciently by the automated procedure. The automatic approach is less successful in densely built-up areas, where buildings are close to one another. In fact, in densely spaced groups of buildings, the diffi culties of distinguishing features for both interactive and auto-mated extraction can be seen. It is diffi cult to discern the number of buildings and whether they are connected or they simply share walls. Due to the generalization introduced in the reclassifi cation of lidar data, some building details, especially building tops, may not be completely presented in the 3-D view. A fi ner reclassifi ca-tion of lidar data could partially resolve this; however, the result would be additional small and incomplete unstructured polygons that cause query diffi culties and unnecessary inclusion of details.
In addition, the current automated procedure cannot separate the buildings from the ground.
A combination of the manual and automated procedures can compensate for the shortcomings of each and will be the best use of resolution potentials for both lidar data and orthoimaging. Through an intersection procedure, the integrated result is able to retain only the building polygons and obtain building heights from the automatically extracted results. In this way, the buildings are separated from the ground while a more realistic 3-D view is achieved. As the manual procedure is only to defi ne the building boundary, delineation of detained structures inside a building boundary is unnecessary such that the manual operation can be greatly simplifi ed.
This study shows that building modeling and visualization using lidar data and orthoimaging in a GIS with advanced func-tions are more effective and effi cient than expected. An automated
A B
24 URISA Journal • Vol. 14, No. 2 • 2002 ■
approach based on reclassifi cation of the lidar data can produce a rather realistic modeling for an urban area, with the majority of buildings correctly shaped and presented. The labor-intensive manual approach based on tracing the orthoimage and associating the lidar data can be limited to defi ning the building boundary. Combining the manual and automatic approaches yields a more realistic result by separating the buildings from the ground. A truly realistic visualization and effective database query need support of structured building models, especially for buildings in an urban area that are composed of complex shapes. The use of lidar data along with digital imaging for 3-D urban modeling and visualization seems to have much promise for the future. GIS, with its increasing suite of advanced capabilities, will offer many users a great deal of power for 3-D urban modeling and visualization.
Authors
Trent C. Palmer is a GIS specialist at the National Imagery and Mapping Agency, St. Louis, Missouri.
Corresponding Address: Trent C. PalmerNational Imagery and Mapping Agency4600 Sangamore RoadBethesda, MD 20816palmert@ nima.mil
Jeffrey Shan is an Assistant Professor of Geomatics Engineering at Purdue University, West Lafayette, Indiana. His research interests are geospatial feature extraction and visualization.
This article is based on their work presented at the 2001 American Society for Photogrammetry and Remote Sensing Annual Confer-ence, Washington, D.C., and collected in the CD-ROM proceed-ings of the conference. The authors thank Dr. Zheng Wang and EarthData, Inc., who graciously prepared and provided the test data for this study. The authors also thank the three anonymous reviewers whose comments greatly improved the paper from its original version.
References
3Di, LLC, 2000, Services: Remote Sensing: LIDAR: At http://www.3Dillc.com/rem-lidar.htm.
Ameri, B. and D. Fritsch, 2000, Automatic 3-D Building Recon-struction using Plane-Roof Structures. Proceedings of the American Society for Photogrammetry and Remote Sensing Conference, Washington, D.C.
Bhagawati, D., 2000, Photogrammetry and 3-D Reconstruction - The State of the Art. ASPRS Proceedings, Washington, DC.
Brenner, C., 1999, Interactive Modelling Tools for 3-D Building Construction. In D. Fritsch and R. Spiller (Eds.), Photo-grammetric Week ‘99, (Heidelberg: Herbert Wichmann Verlag), 23-34.
Danahy, J., 1999, Visualization Data Needs in Urban Environ-mental Planning and Design. In D. Fritsch and R. Spiller (Eds.), Photogrammetric Week ‘99, (Heidelberg: Herbert Wichmann Verlag), 351-365.
Förstner, W., 1999, 3-D City Models: Automatic and Semiau-tomatic Acquisition Methods. In D. Fritsch and R. Spiller (Eds.), Photogrammetric Week ‘99, (Heidelberg: Herbert Wichmann Verlag), 291-303.
Fritsch, D., 1999, Virtual Cities and Landscape Models - What Has Photogrammetry to Offer? In D. Fritsch and R. Spiller (Eds.), Photogrammetric Week ‘99, (Heidelberg: Herbert Wichmann Verlag), 3-14.
Haala, N. and C. Brenner, 1997, Generation of 3-D City Models from Airborne Laser Scanning Data. EARSEL Workshop on LIDAR Remote Sensing of Land and Sea, Tallinn, Estonia.
Hug, C., 1997, Extracting Artifi cial Surface Objects from Air-borne Laser Scanner Data. In Grün, Baltsavias, Henricsson (Eds.), Ascona: Automatic Extraction of Man-made Ob-jects from Aerial and Space Images II, (Basel Birkhäuser Verlag).
Jelalian, A., 1992, Laser Radar Systems, (Boston: Artech House).
URISA Journal ■ Palmer, Shan 25
Kim, H., Y. Kim, W. Cho, and J. Seo, 2000, The Fusion of Pho-togrammetric Image and Laser Scanning Data. Proceedings of the American Society for Photogrammetry and Remote Sensing Conference, Washington, D.C.
Kirtner, J., 2000, Using LIDAR Data in Wireless Communica-tion System Design. Proceedings of the American Society for Photogrammetry and Remote Sensing Conference, Washington, D.C.
Kletzli, R. and J. Peterson, 1998, Inertial Measurement and LIDAR Meet Digital Ortho Photography: A Sensor Fu-sion Boon for GIS. Proceedings, ESRI International Users Conference.
Maune, D., C. Daniel, and J. Damron, 2000, LIDAR and IFSAR: Pitfalls and Opportunities for our Future. Proceedings of the American Society for Photogrammetry and Remote Sensing Conference, Washington, D.C.
Rees, G., 1999, The Remote Sensing Data Book, (Cambridge: UK University Press).
Toth, C. and D. Grejner-Brzezinska, 2000, Combining LIDAR with Digital Camera System. Proceedings of the American Society for Photogrammetry and Remote Sensing Confer-ence, Washington, D.C.
Wever, C. and J. Lindenberger, 1999, Experiences of 10 Years Laser Scanning. Photogrammetry Week, 125-132.
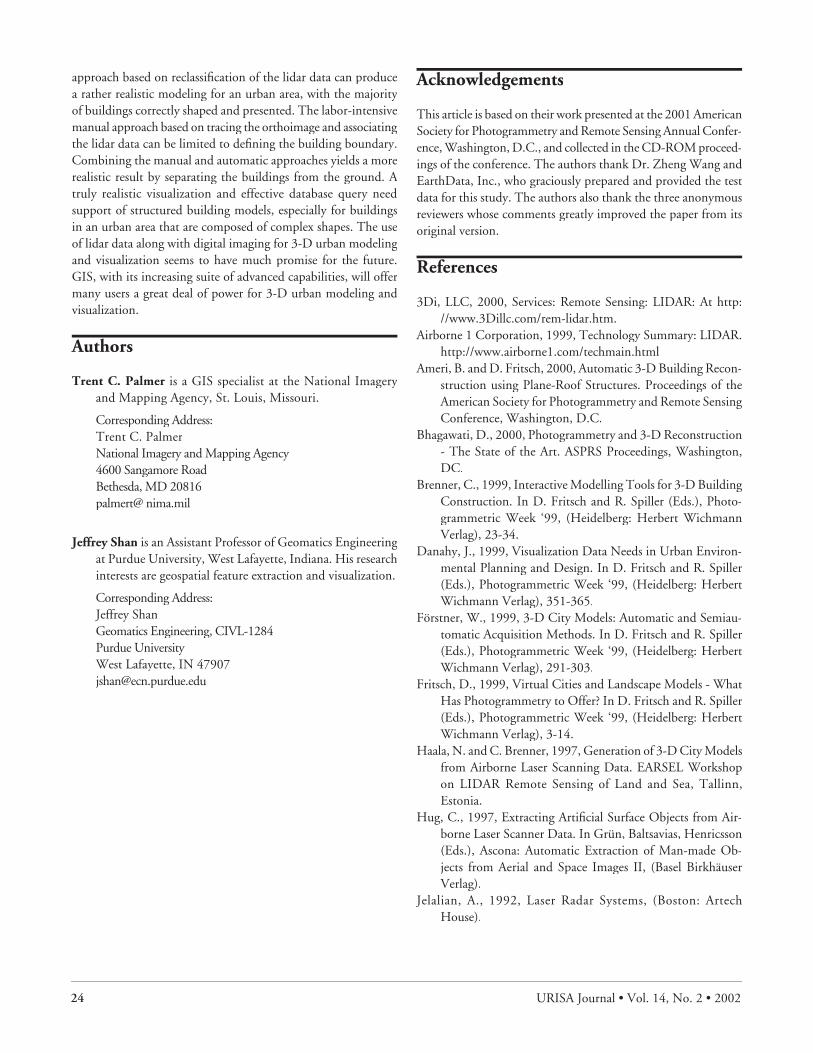
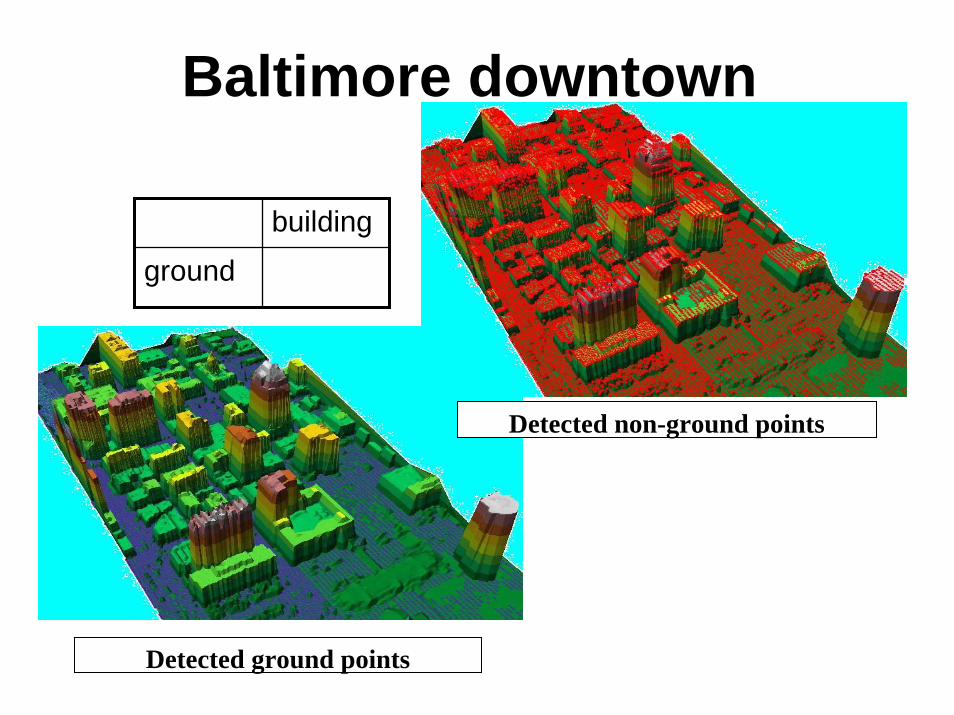
Baltimore downtown
Detected ground points
Detected non-ground points
building
ground
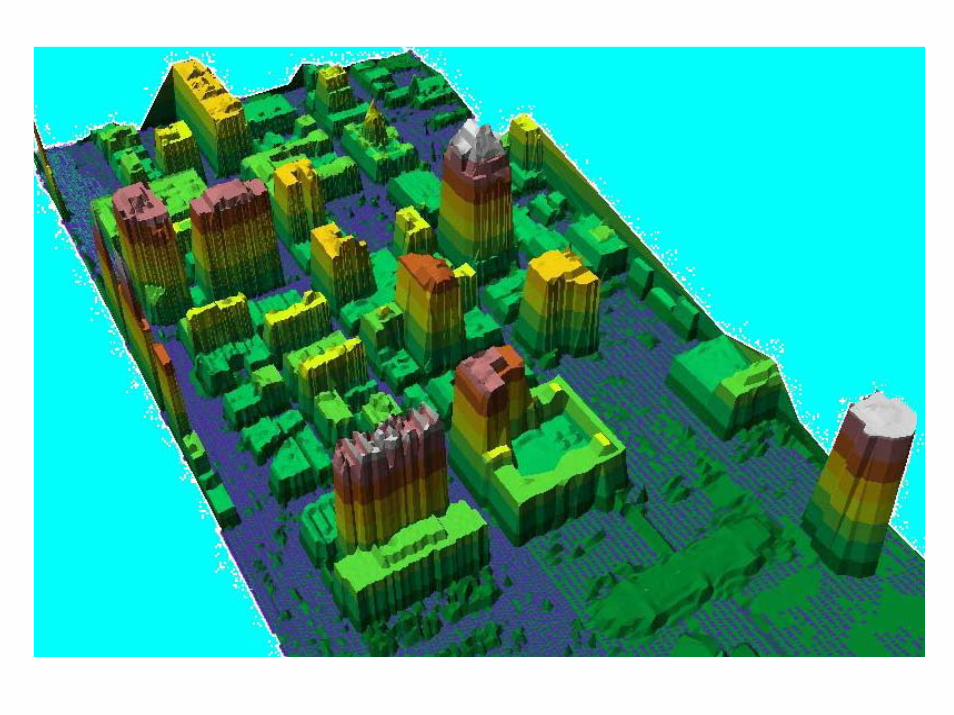
Automatic 3D Modelafter Cleaning and
Reclassification
N
Color-coded by elevation
Visualization with GIS•Using ArcView GIS and ArcGIS•Manual delineation of building footprint•Baltimore downtown


![Cloud-Based LiDAR Visualization and ExploitationLD09]-paper.pdf · Cloud-Based LiDAR Visualization and Exploitation ... afforded by cloud computing will expand the industry's ability](https://static.documents.pub/doc/80x56/5ab302c07f8b9a284c8df910/cloud-based-lidar-visualization-and-ld09-paperpdfcloud-based-lidar-visualization.jpg)


