13 th World Conference on Earthquake Engineering Vancouver, B.C., Canada August 1-6, 2004 Paper No. 1220 A COMPARISON BETWEEN IN SITU AND LABORATORY MEASUREMENTS OF PORE WATER PRESSURE GENERATION Kenan HAZIRBABA 1 and Ellen M. RATHJE 2 SUMMARY This paper presents a unique comparison between in situ and laboratory measurements of pore pressure generation in liquefiable sand. The in situ pore pressure measurements were conducted in the field with a newly developed in situ liquefaction testing technique that dynamically loads a soil deposit with a truck- mounted hydraulic vibrator (called a vibroseis). The soil response is recorded with embedded pore pressure transducers and geophones, and these data are used to compute the pore pressure ratio and shear strains induced in the soil. The in situ field testing consisted of subjecting a large (1.2 m by 1.2 m by 1.2 m) reconstituted test specimen of clean, uniform aggregate sand to staged loading levels that progressed from those that induced no pore pressure generation to a final stage that generated a pore pressure ratio of 68%. Because of the shallow location of the in situ test specimen, the effective stresses were relatively small (~13 kPa). The laboratory pore pressure measurements were conducted using strain-controlled cyclic simple shear testing. A total of 13 reconstituted sand specimens were prepared by water sedimentation at relative densities between 32% and 44%, and tested. Strain levels ranging from 0.005% to 0.96% were applied at vertical effective stresses of 25 kPa and 100 kPa. Both the field and laboratory testing results indicate the existence of a threshold shear strain between 0.005% and 0.01%. The pore pressure generation was shown to be stress dependent, with higher pore pressure ratios obtained at lower effective stresses. The comparison between in situ and laboratory measurements shows a similar trend in the generation of pore pressures with the induced strains, yet due to the low effective stresses in the field, higher pore pressures were recorded in situ than in the laboratory. 1 Graduate Student Researcher, University of Texas at Austin, Austin, TX, USA. E-mail: [email protected]2 Assistant Professor, University of Texas at Austin, Austin, TX, USA. E-mail: [email protected]
Transcript
13th World Conference on Earthquake Engineering Vancouver, B.C., Canada
August 1-6, 2004 Paper No. 1220
A COMPARISON BETWEEN IN SITU AND LABORATORY MEASUREMENTS OF PORE WATER PRESSURE GENERATION
Kenan HAZIRBABA1 and Ellen M. RATHJE2
SUMMARY This paper presents a unique comparison between in situ and laboratory measurements of pore pressure generation in liquefiable sand. The in situ pore pressure measurements were conducted in the field with a newly developed in situ liquefaction testing technique that dynamically loads a soil deposit with a truck-mounted hydraulic vibrator (called a vibroseis). The soil response is recorded with embedded pore pressure transducers and geophones, and these data are used to compute the pore pressure ratio and shear strains induced in the soil. The in situ field testing consisted of subjecting a large (1.2 m by 1.2 m by 1.2 m) reconstituted test specimen of clean, uniform aggregate sand to staged loading levels that progressed from those that induced no pore pressure generation to a final stage that generated a pore pressure ratio of 68%. Because of the shallow location of the in situ test specimen, the effective stresses were relatively small (~13 kPa). The laboratory pore pressure measurements were conducted using strain-controlled cyclic simple shear testing. A total of 13 reconstituted sand specimens were prepared by water sedimentation at relative densities between 32% and 44%, and tested. Strain levels ranging from 0.005% to 0.96% were applied at vertical effective stresses of 25 kPa and 100 kPa. Both the field and laboratory testing results indicate the existence of a threshold shear strain between 0.005% and 0.01%. The pore pressure generation was shown to be stress dependent, with higher pore pressure ratios obtained at lower effective stresses. The comparison between in situ and laboratory measurements shows a similar trend in the generation of pore pressures with the induced strains, yet due to the low effective stresses in the field, higher pore pressures were recorded in situ than in the laboratory.
1 Graduate Student Researcher, University of Texas at Austin, Austin, TX, USA.
E-mail: [email protected] 2 Assistant Professor, University of Texas at Austin, Austin, TX, USA.
INTRODUCTION Over the last four decades a great deal of research has been performed to study the liquefaction phenomenon. These studies have generally focused on stress-controlled tests with considerably less interest in strain-controlled tests. This study focuses on strain-controlled laboratory liquefaction testing and comparing these results with those measured in situ. Dobry et al. [1] introduced the cyclic strain approach for evaluating liquefaction, which is based on the prediction of pore water pressures from the earthquake-induced cyclic shear strain and the expected number of strain cycles. In this approach, shear strain is the main parameter that controls pore pressure generation in sands. In their effort, Dobry et al. [1] conducted strain-controlled, cyclic triaxial tests on reconstituted sand specimens and indicated that there is a strong relationship between cyclic shear strain and pore water pressure generation. They also found that this relationship is not significantly affected by relative density, grain size distribution, and soil fabric. This leads to the conclusion that laboratory results may be utilized to predict liquefaction potential using the cyclic strain approach. In this experimental study, the results from strain-controlled, undrained, cyclic simple shear tests performed on a uniform aggregate sand are compared to those measured in situ by Chang [2]. The objective is to compare the characteristics of pore pressure generation in situ and under laboratory conditions, and to verify the applicability of laboratory results in the evaluation of in situ liquefaction potential by the cyclic strain approach.
FIELD EXPERIMENTS
In a recently developed in situ liquefaction testing procedure (Chang [2], Rathje et al. [3]) the relationship between the cyclic shear strain and excess pore water pressure is measured. This testing technique utilizes a large, truck-mounted hydraulic vibrator (called a vibroseis) to generate seismic waves that propagate through the test area and induce a controlled number of cycles of shear strain and shear stress. The soil response is recorded with embedded geophones and miniature pore pressure transducers, integrated in a single unit called a liquefaction sensor. The collected data are used to compute the excess pore pressure ratio, ru, (the ratio of the pore water pressure developed to the initial vertical effective stress, ru=∆u/σv') and shear strains, γ, induced in the soil. In situ liquefaction testing was performed by Chang [2] on a large (1.2 m by 1.2 m by 1.2 m) reconstituted test specimen of clean, uniform aggregate sand. The index properties and grain size distribution of this aggregate sand are presented in Table 1 and Figure 1, respectively. The specimen was constructed by water sedimentation at a relative density of 35%. Because of the shallow location of the test specimen, the vertical effective stress was relatively small (~13 kPa). A schematic cross-section of the in situ test specimen is shown in Figure 2. Four liquefaction sensors were installed in such a manner that they were at the corners of a 0.6 m by 0.6 m square array. An additional sensor was located at the center of this square. The settlement was monitored at the surface and within the specimen at levels where the liquefaction sensors were located. A 0.8 m layer of air-dried sand was placed on top of the specimen to create overburden and thus increase the stresses acting on the test specimen. Staged loading was performed with the vibroseis, with loading levels progressing from those that induced no pore pressure generation to a final stage that induced significant pore pressure generation. The induced shear strains at specific locations were evaluated from relative displacements between adjacent sensor locations. These displacements were computed from the particle velocity data measured by the embedded geophones. The pore pressure generation was directly measured with the embedded pore pressure transducers. Thus, the coupled behavior between the dynamic response of the soil skeleton, represented by shear strain, and the generated pore water pressure was captured. Figure 3 shows the in situ measurements
of pore water pressure generation in terms of mean shear strain amplitudes and number of loading cycles. During the first four stages of loading, the induced mean shear strains did not exceed 0.003% and the measured excess pore pressure ratios were less than about 1%. The mean shear strains and pore pressure ratios increased to about 0.007% and 8%, respectively, with application of increased loads in the next three stages. In the last testing stage, the largest load was applied and caused the sample to experience a mean shear strain of 0.014% at the end of 20 loading cycles. The excess pore pressure ratio after 20 cycles of loading in the final stage was 68%. The data in Figure 3 are the basis of the comparison with the laboratory investigation, described in the next section. Further details regarding the field experiments can be found in Chang [2] and Rathje et al. [3].
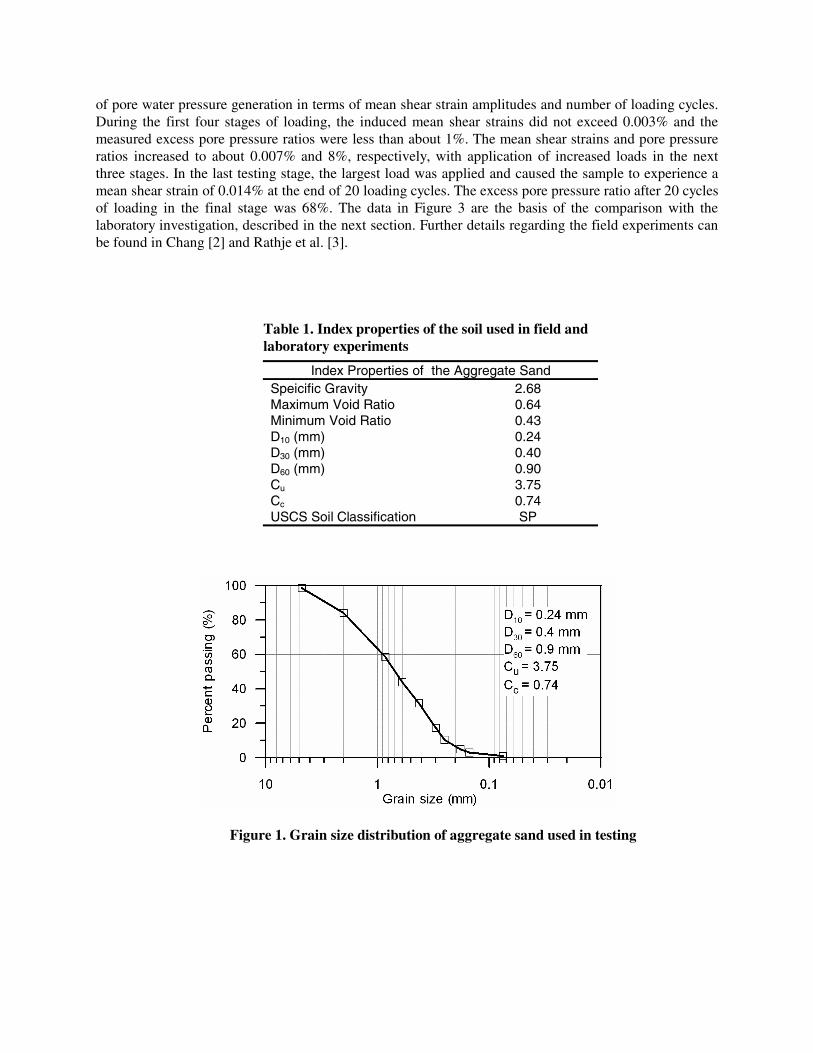
Table 1. Index properties of the soil used in field and laboratory experiments
Index Properties of the Aggregate Sand Speicific Gravity Maximum Void Ratio Minimum Void Ratio D10 (mm) D30 (mm) D60 (mm) Cu Cc
USCS Soil Classification
2.68 0.64 0.43 0.24 0.40 0.90 3.75 0.74 SP
Figure 1. Grain size distribution of aggregate sand used in testing
Figure 2. Schematic cross-section of the in situ testing set up [3]
Figure 3. In situ pore pressure generation curves [3]
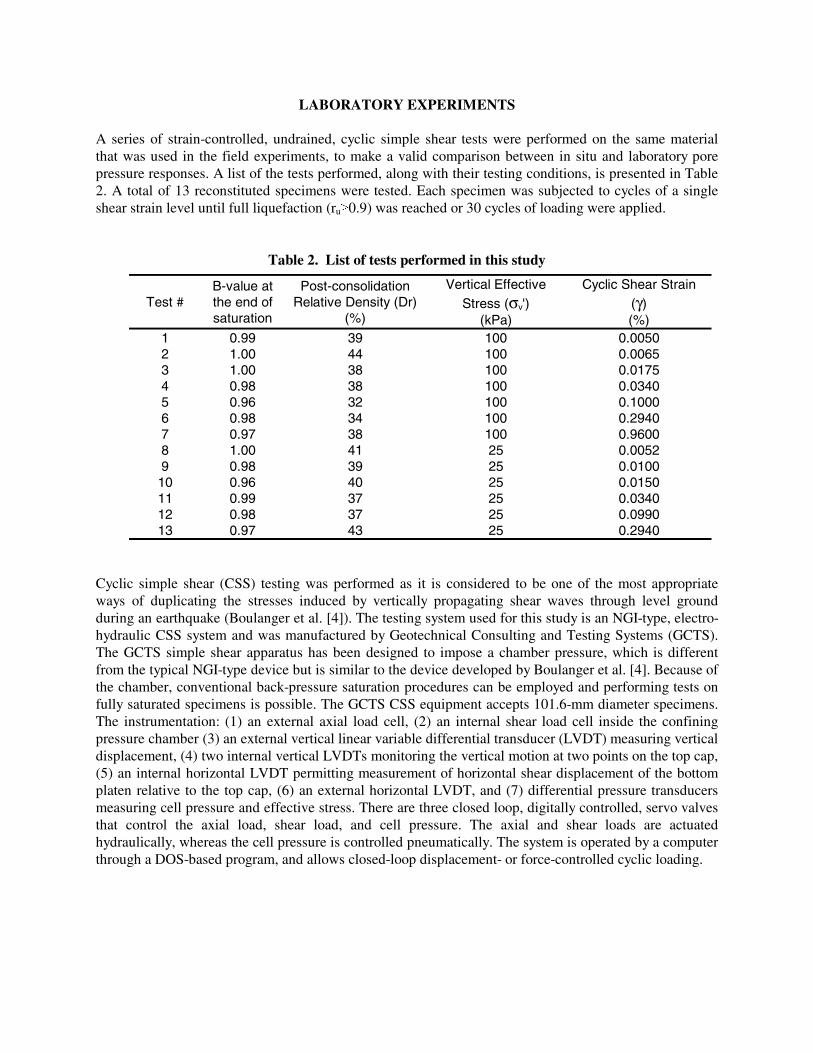
A series of strain-controlled, undrained, cyclic simple shear tests were performed on the same material that was used in the field experiments, to make a valid comparison between in situ and laboratory pore pressure responses. A list of the tests performed, along with their testing conditions, is presented in Table 2. A total of 13 reconstituted specimens were tested. Each specimen was subjected to cycles of a single shear strain level until full liquefaction (ru≥0.9) was reached or 30 cycles of loading were applied.
0.2940 Cyclic simple shear (CSS) testing was performed as it is considered to be one of the most appropriate ways of duplicating the stresses induced by vertically propagating shear waves through level ground during an earthquake (Boulanger et al. [4]). The testing system used for this study is an NGI-type, electro-hydraulic CSS system and was manufactured by Geotechnical Consulting and Testing Systems (GCTS). The GCTS simple shear apparatus has been designed to impose a chamber pressure, which is different from the typical NGI-type device but is similar to the device developed by Boulanger et al. [4]. Because of the chamber, conventional back-pressure saturation procedures can be employed and performing tests on fully saturated specimens is possible. The GCTS CSS equipment accepts 101.6-mm diameter specimens. The instrumentation: (1) an external axial load cell, (2) an internal shear load cell inside the confining pressure chamber (3) an external vertical linear variable differential transducer (LVDT) measuring vertical displacement, (4) two internal vertical LVDTs monitoring the vertical motion at two points on the top cap, (5) an internal horizontal LVDT permitting measurement of horizontal shear displacement of the bottom platen relative to the top cap, (6) an external horizontal LVDT, and (7) differential pressure transducers measuring cell pressure and effective stress. There are three closed loop, digitally controlled, servo valves that control the axial load, shear load, and cell pressure. The axial and shear loads are actuated hydraulically, whereas the cell pressure is controlled pneumatically. The system is operated by a computer through a DOS-based program, and allows closed-loop displacement- or force-controlled cyclic loading.
Specimen preparation and consolidation The specimens were prepared by water sedimentation in this study to replicate in situ soil deposition processes as closely as possible, as well as to match the field sample preparation technique (Chang [2], Rathje et al. [3]). As a first step, all equipment drain lines and the top and bottom caps were saturated before starting the sample preparation procedure. A 101.6-mm (4-in) diameter wire reinforced membrane of moderate stiffness (C=1.0), manufactured by the Norwegian Geotechnical Institute (NGI), was used in testing. This membrane was secured to the bottom platen by O-rings for sample preparation. A mold was placed around the membrane and filled half with de-aired water. Pre-weighed dry sand was poured into the mold with great caution. The approximate desired soil density was achieved by adjusting the drop height of the sand. An approximate drop height of 5 mm was found to create a loose fabric and result in initial relative densities between 32% and 44% for the aggregate sand. The sample was then carefully placed in the cyclic simple shear device, the top cap was lowered, and the membrane was secured to the top cap with O-rings. The drain lines were connected to both the top cap and the base platen of the specimen. A vertical pressure of 10 kPa was applied. To achieve the desired relative density and to improve contact between the soil and end caps, the base platen was gently tapped while the mold was in place. After the desired specimen height was obtained, the mold was removed and the O-rings at the top and bottom were tightened further around the membrane by application of hose clamps. This practice was found to be useful in preventing potential bulging of the non-reinforced ends of the membrane during development of high pore water pressures. The dimensions of the sample were then measured and recorded. Next, the cell wall was lowered around the pressure chamber and tightened. A slight cell pressure (~3 kPa) was then applied and carbon dioxide was circulated through the sample for approximately 15 minutes to displace any air from the soil pores. Flushing the sample with carbon dioxide helps achieve a higher degree of saturation, because the carbon dioxide is more soluble in water than air. Next, de-aired water was allowed to flow through the specimen from the bottom until no further bubbling was observed in the vacuum chamber. Full saturation of soil specimens is essential to accurately record pore water pressures and to obtain meaningful results during liquefaction testing (Chaney [5]). Therefore, saturation of specimens was achieved through application of relatively low backpressures of approximately 100 kPa. All B-value measurements were performed at a stress increment of 10 kPa and the net effective stresses acting on the specimen during the saturation process were kept around 15 kPa. Typically, after 2 to 3 hours of backpressure application, the B-values were found to be greater than 0.96. After a minimum acceptable B-value of 0.96 was obtained, the consolidation procedure was started. The use of a wire-reinforced membrane enforces approximate Ko conditions in the soil by minimizing lateral deformations during consolidation and testing. One-dimensional consolidation of the specimen was achieved by linearly increasing the vertical pressure to the desired value. Volume change and axial deformation measurements during consolidation were made using the volume change transducer and the internal LVDTs, respectively. The volume change indicated by the axial LVDT measurements agreed with that measured by the volume change transducer, suggesting that consolidation was one-dimensional and minimal bulging occurred. The sample was allowed to consolidate for thirty minutes.
Testing procedure Following consolidation to the desired vertical effective stress, undrained cyclic tests were performed using uniform cycles of shear strain. Because loading frequency has little to no effect on soil behavior in liquefaction testing (Finn et al. [6], Polito [7], Boulanger et al. [8]), testing was performed at 1/5 Hz to ensure equilibration of pore water pressure throughout the specimen and thus provide more accurate pore pressure measurements. The cyclic shear strain was applied in a sinusoidal manner. To duplicate the field loading conditions during an earthquake, the vertical load was kept constant while approximately zero lateral strain was achieved with the help of the wire-reinforced membrane. The experiment was terminated after 30 cycles during small strain tests and after liquefaction was achieved during large strain tests. Liquefaction was defined as an excess pore pressure ratio (ru) of about 90% or higher. Typical results from a strain-controlled cyclic simple shear test are displayed in Figure 4. A sand specimen is subjected to a constant amplitude shear strain level (~0.3% in this case, Figure 4a). The pore pressure generation follows a smooth progressive pattern, until reaching a pore pressure ratio, ru, of about 90% (Figure 4b). The induced shear stress decreases with time and becomes extremely low as liquefaction is approached (Figure 4c). Such a trend in the shear stress causes the stress-strain cycles to form loops as those shown in Figure 4d.
Figure 4. Results from a typical strain-controlled undrained cyclic simple shear test
TESTING RESULTS
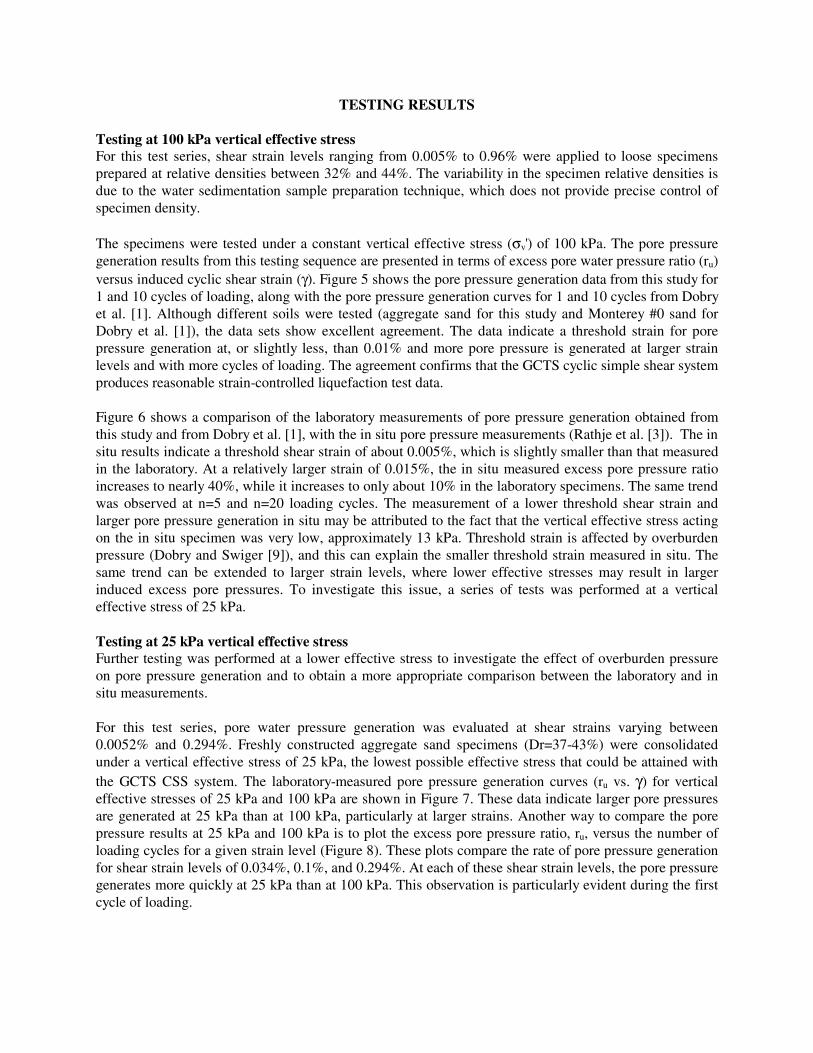
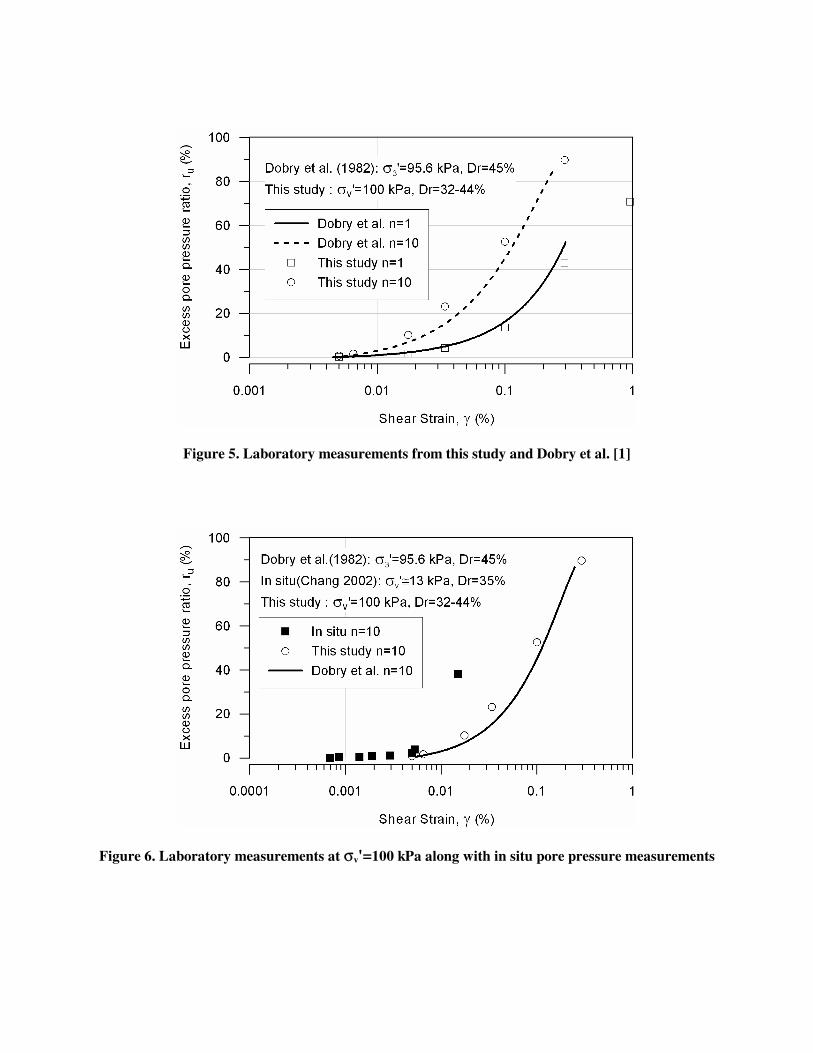
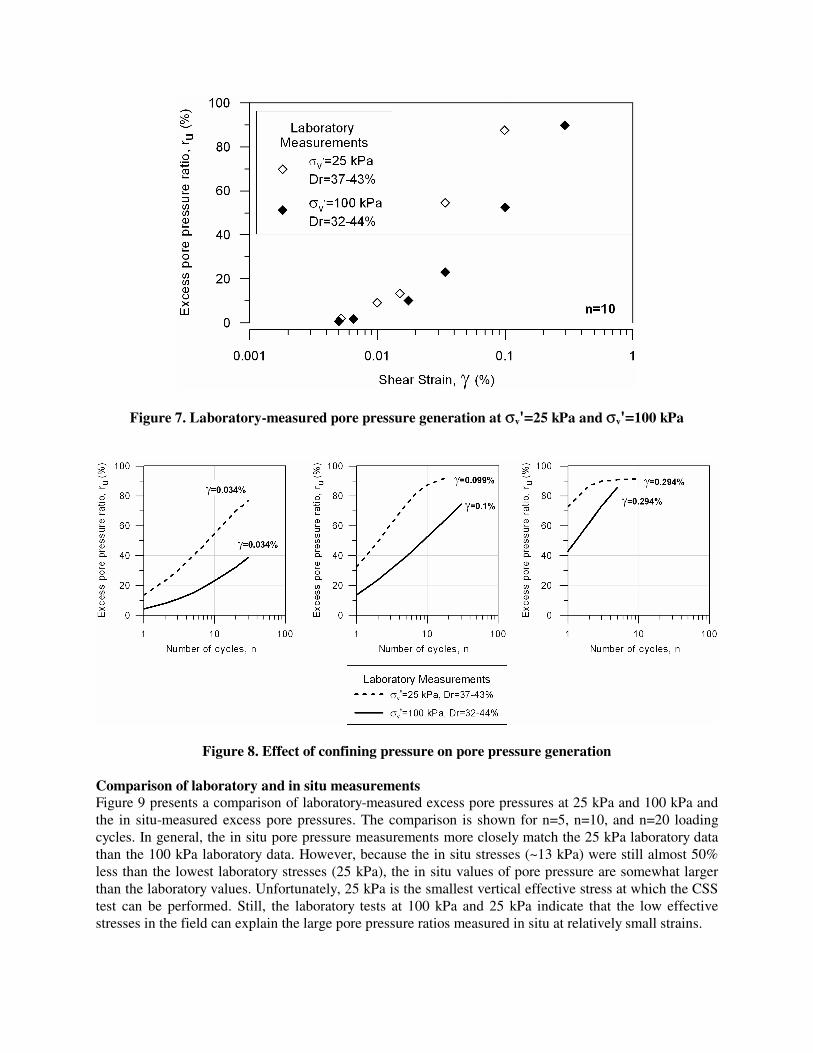
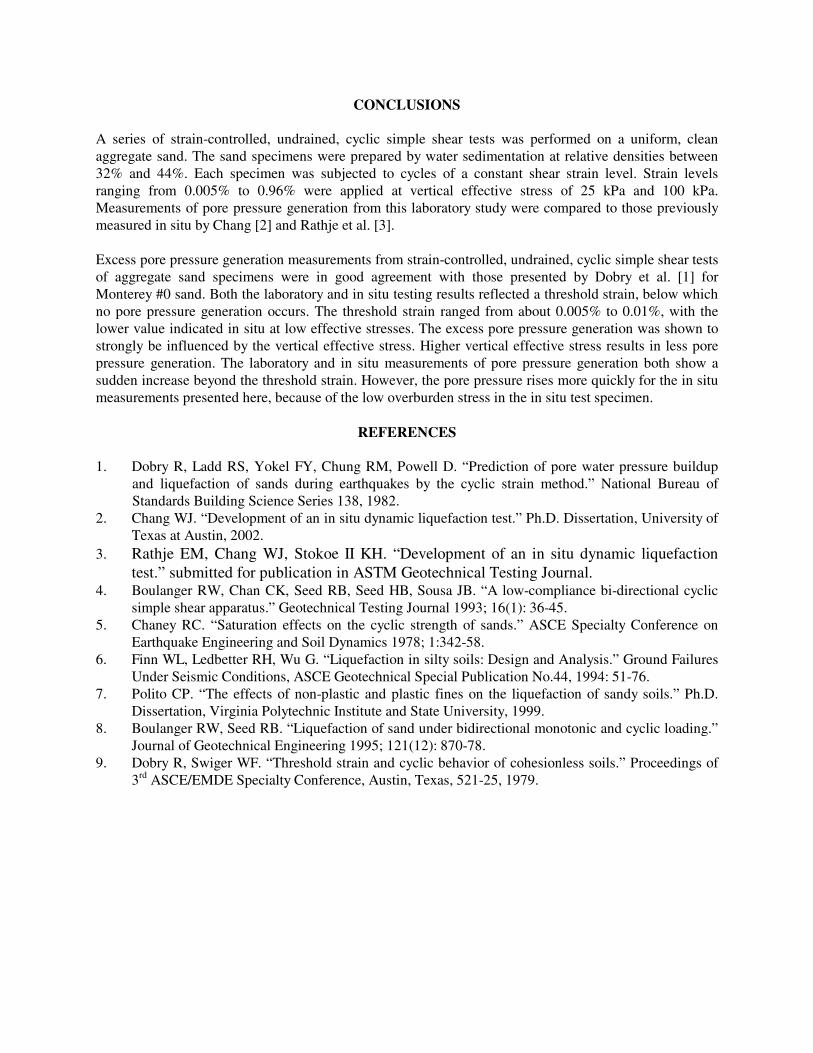
Testing at 100 kPa vertical effective stress For this test series, shear strain levels ranging from 0.005% to 0.96% were applied to loose specimens prepared at relative densities between 32% and 44%. The variability in the specimen relative densities is due to the water sedimentation sample preparation technique, which does not provide precise control of specimen density. The specimens were tested under a constant vertical effective stress (σv') of 100 kPa. The pore pressure generation results from this testing sequence are presented in terms of excess pore water pressure ratio (ru) versus induced cyclic shear strain (γ). Figure 5 shows the pore pressure generation data from this study for 1 and 10 cycles of loading, along with the pore pressure generation curves for 1 and 10 cycles from Dobry et al. [1]. Although different soils were tested (aggregate sand for this study and Monterey #0 sand for Dobry et al. [1]), the data sets show excellent agreement. The data indicate a threshold strain for pore pressure generation at, or slightly less, than 0.01% and more pore pressure is generated at larger strain levels and with more cycles of loading. The agreement confirms that the GCTS cyclic simple shear system produces reasonable strain-controlled liquefaction test data. Figure 6 shows a comparison of the laboratory measurements of pore pressure generation obtained from this study and from Dobry et al. [1], with the in situ pore pressure measurements (Rathje et al. [3]). The in situ results indicate a threshold shear strain of about 0.005%, which is slightly smaller than that measured in the laboratory. At a relatively larger strain of 0.015%, the in situ measured excess pore pressure ratio increases to nearly 40%, while it increases to only about 10% in the laboratory specimens. The same trend was observed at n=5 and n=20 loading cycles. The measurement of a lower threshold shear strain and larger pore pressure generation in situ may be attributed to the fact that the vertical effective stress acting on the in situ specimen was very low, approximately 13 kPa. Threshold strain is affected by overburden pressure (Dobry and Swiger [9]), and this can explain the smaller threshold strain measured in situ. The same trend can be extended to larger strain levels, where lower effective stresses may result in larger induced excess pore pressures. To investigate this issue, a series of tests was performed at a vertical effective stress of 25 kPa. Testing at 25 kPa vertical effective stress Further testing was performed at a lower effective stress to investigate the effect of overburden pressure on pore pressure generation and to obtain a more appropriate comparison between the laboratory and in situ measurements. For this test series, pore water pressure generation was evaluated at shear strains varying between 0.0052% and 0.294%. Freshly constructed aggregate sand specimens (Dr=37-43%) were consolidated under a vertical effective stress of 25 kPa, the lowest possible effective stress that could be attained with the GCTS CSS system. The laboratory-measured pore pressure generation curves (ru vs. γ) for vertical effective stresses of 25 kPa and 100 kPa are shown in Figure 7. These data indicate larger pore pressures are generated at 25 kPa than at 100 kPa, particularly at larger strains. Another way to compare the pore pressure results at 25 kPa and 100 kPa is to plot the excess pore pressure ratio, ru, versus the number of loading cycles for a given strain level (Figure 8). These plots compare the rate of pore pressure generation for shear strain levels of 0.034%, 0.1%, and 0.294%. At each of these shear strain levels, the pore pressure generates more quickly at 25 kPa than at 100 kPa. This observation is particularly evident during the first cycle of loading.
Figure 5. Laboratory measurements from this study and Dobry et al. [1]
Figure 6. Laboratory measurements at σv'=100 kPa along with in situ pore pressure measurements
Figure 7. Laboratory-measured pore pressure generation at σv'=25 kPa and σv'=100 kPa
Figure 8. Effect of confining pressure on pore pressure generation Comparison of laboratory and in situ measurements Figure 9 presents a comparison of laboratory-measured excess pore pressures at 25 kPa and 100 kPa and the in situ-measured excess pore pressures. The comparison is shown for n=5, n=10, and n=20 loading cycles. In general, the in situ pore pressure measurements more closely match the 25 kPa laboratory data than the 100 kPa laboratory data. However, because the in situ stresses (~13 kPa) were still almost 50% less than the lowest laboratory stresses (25 kPa), the in situ values of pore pressure are somewhat larger than the laboratory values. Unfortunately, 25 kPa is the smallest vertical effective stress at which the CSS test can be performed. Still, the laboratory tests at 100 kPa and 25 kPa indicate that the low effective stresses in the field can explain the large pore pressure ratios measured in situ at relatively small strains.
Figure 9. Comparison of in situ and laboratory measurements of pore pressure generation
CONCLUSIONS A series of strain-controlled, undrained, cyclic simple shear tests was performed on a uniform, clean aggregate sand. The sand specimens were prepared by water sedimentation at relative densities between 32% and 44%. Each specimen was subjected to cycles of a constant shear strain level. Strain levels ranging from 0.005% to 0.96% were applied at vertical effective stress of 25 kPa and 100 kPa. Measurements of pore pressure generation from this laboratory study were compared to those previously measured in situ by Chang [2] and Rathje et al. [3]. Excess pore pressure generation measurements from strain-controlled, undrained, cyclic simple shear tests of aggregate sand specimens were in good agreement with those presented by Dobry et al. [1] for Monterey #0 sand. Both the laboratory and in situ testing results reflected a threshold strain, below which no pore pressure generation occurs. The threshold strain ranged from about 0.005% to 0.01%, with the lower value indicated in situ at low effective stresses. The excess pore pressure generation was shown to strongly be influenced by the vertical effective stress. Higher vertical effective stress results in less pore pressure generation. The laboratory and in situ measurements of pore pressure generation both show a sudden increase beyond the threshold strain. However, the pore pressure rises more quickly for the in situ measurements presented here, because of the low overburden stress in the in situ test specimen.
REFERENCES
1. Dobry R, Ladd RS, Yokel FY, Chung RM, Powell D. “Prediction of pore water pressure buildup and liquefaction of sands during earthquakes by the cyclic strain method.” National Bureau of Standards Building Science Series 138, 1982.
2. Chang WJ. “Development of an in situ dynamic liquefaction test.” Ph.D. Dissertation, University of Texas at Austin, 2002.
3. Rathje EM, Chang WJ, Stokoe II KH. “Development of an in situ dynamic liquefaction test.” submitted for publication in ASTM Geotechnical Testing Journal.
5. Chaney RC. “Saturation effects on the cyclic strength of sands.” ASCE Specialty Conference on Earthquake Engineering and Soil Dynamics 1978; 1:342-58.
6. Finn WL, Ledbetter RH, Wu G. “Liquefaction in silty soils: Design and Analysis.” Ground Failures Under Seismic Conditions, ASCE Geotechnical Special Publication No.44, 1994: 51-76.
7. Polito CP. “The effects of non-plastic and plastic fines on the liquefaction of sandy soils.” Ph.D. Dissertation, Virginia Polytechnic Institute and State University, 1999.
8. Boulanger RW, Seed RB. “Liquefaction of sand under bidirectional monotonic and cyclic loading.” Journal of Geotechnical Engineering 1995; 121(12): 870-78.
9. Dobry R, Swiger WF. “Threshold strain and cyclic behavior of cohesionless soils.” Proceedings of 3rd ASCE/EMDE Specialty Conference, Austin, Texas, 521-25, 1979.