A Comparison of Several LC/MS Techniques for Use in Toxicology Abstract The analytical capabilities of various liquid chromatography/mass spectrometry (LC/MS) instruments are compared in the study of illicit and prescription drugs in blood. The blood samples analyzed include postmortem and driving under the influ- ence of drugs (DUID). The presence of drug compounds in these samples was previ- ously confirmed using gas chromatography/mass spectrometry (GC/MS). In this work, the LC conditions are common among the different types of mass spectrome- ters used. The mass spectrometers used include the single quadrupole (SQ), the time- of-flight (TOF), the ion trap (IT), the triple quadrupole (QQQ), and the quadrupole time- of-flight (QTOF). Both LC and MS instrumentation are Agilent. In analyzing the different samples for the presence of several drug compounds, the advantages and disadvantages of each type of instrumentation are demonstrated. For example, the IT, TOF, and QTOF mass spectrometers are shown to be excellent devices for qualitative screening and identification. On the other hand, the SQ and QQQ mass spectrometers are excellent devices for quantitative targeted confirmation. And yet, the converse is somewhat true in that the TOF and QTOF instruments may also be useful for quantification, though not as sensitive as an instrument like the QQQ. Drugs of interest in the blood samples include benzodiazepines, methadone, and cocaine metabolites. Authors Michael Zumwalt Agilent Technologies, Inc. 9780 S. Meridian Blvd. Englewood, CO 80112 USA John Hughes Agilent Technologies, Inc. 6612 Owens Drive Pleasanton, CA 94588 USA Greg Kilby Agilent Technologies, Inc. 2850 Centerville Road Wilmington, DE 19808 USA Jeri Ropero-Miller and Peter Stout RTI International 3040 Cornwallis Road Raleigh-Durham, NC 27709 USA H. Chip Walls University of Miami School of Medicine 1611 NW 12th Avenue Miami, FL 33136 USA Application Note Toxicology
Transcript
A Comparison of Several LC/MSTechniques for Use in Toxicology
Abstract
The analytical capabilities of various liquid chromatography/mass spectrometry
(LC/MS) instruments are compared in the study of illicit and prescription drugs in
blood. The blood samples analyzed include postmortem and driving under the influ-
ence of drugs (DUID). The presence of drug compounds in these samples was previ-
ously confirmed using gas chromatography/mass spectrometry (GC/MS). In this
work, the LC conditions are common among the different types of mass spectrome-
ters used. The mass spectrometers used include the single quadrupole (SQ), the time-
of-flight (TOF), the ion trap (IT), the triple quadrupole (QQQ), and the quadrupole time-
of-flight (QTOF). Both LC and MS instrumentation are Agilent.
In analyzing the different samples for the presence of several drug compounds, the
advantages and disadvantages of each type of instrumentation are demonstrated. For
example, the IT, TOF, and QTOF mass spectrometers are shown to be excellent
devices for qualitative screening and identification. On the other hand, the SQ and
QQQ mass spectrometers are excellent devices for quantitative targeted confirmation.
And yet, the converse is somewhat true in that the TOF and QTOF instruments may
also be useful for quantification, though not as sensitive as an instrument like the
QQQ.
Drugs of interest in the blood samples include benzodiazepines, methadone, and
cocaine metabolites.
Authors
Michael Zumwalt Agilent Technologies, Inc.9780 S. Meridian Blvd.Englewood, CO 80112USA
John HughesAgilent Technologies, Inc.6612 Owens DrivePleasanton, CA 94588USA
Greg KilbyAgilent Technologies, Inc.2850 Centerville RoadWilmington, DE 19808USA
Jeri Ropero-Miller and Peter StoutRTI International3040 Cornwallis RoadRaleigh-Durham, NC 27709USA
H. Chip WallsUniversity of Miami School of Medicine1611 NW 12th AvenueMiami, FL 33136USA
Application NoteToxicology
2
Introduction
Traditionally, laboratories use immunoassays for screeningand GC/MS for quantitative confirmation of drugs of abuse,whether illicit or prescribed. However, immunoassay is notcompletely specific and reagents are a significant labexpense, and GC/MS requires derivatization of sampleswhich are polar or nonvolatile. In LC/MS, according toDeBoeck, et al [1]. "There has been an explosion in the rangeof new products available for solving many analytical prob-lems, particularly those applications in which nonvolatile,labile, and/or high molecular weight compounds are beinganalyzed."
As a result, it is becoming more and more common for labora-tories to be considering LC/MS for the analysis of drugs inbiological samples, and not only for quantitative confirmation,but even for screening [2]. To date, LC/MS methods havebeen described for most of the main drug classes, includingthose analyzed here, like benzodiazepines, cocaine, andmetabolites [3]. However, what seems to be missing from theliterature is an overview of the various LC/MS techniquesavailable and which ones are most appropriate for varioustasks in the toxicology laboratory.
In this work, such a comparison among LC/MS techniques ismade, largely in part because Agilent has one of the broadestLC/MS portfolios of any mass spectrometry vendor. There-fore, by analyzing the same samples and calibrators andinjecting them under the same LC conditions onto each massspectrometer, fair comparisons are made to help the readerdetermine which instrument may be best for his or her type ofapplication.
This work also represents the combined collaboration of three application chemists at Agilent and three professionalforensic toxicologists. Some 50 samples, calibrators, andblanks were prepared: the postmortem samples by RTIInternational and the DUID samples by the University ofMiami. Over three days, the samples were run on the follow-ing five different LC/MS instruments at the AgilentTechnologies Center of Excellence in Wilmington, DE: SQ, IT,TOF, QQQ, and QTOF.
The postmortem blood samples from RTI are part of a projectsupported by NIJ Grant 2006-DN-BX-K014.
One mL of whole blood was used for each sample, with fivepoint calibration curves generated for quantification of realcase samples. Compounds analyzed in postmortem and DUIDblood are shown in Figures 1a and 1b, respectively.
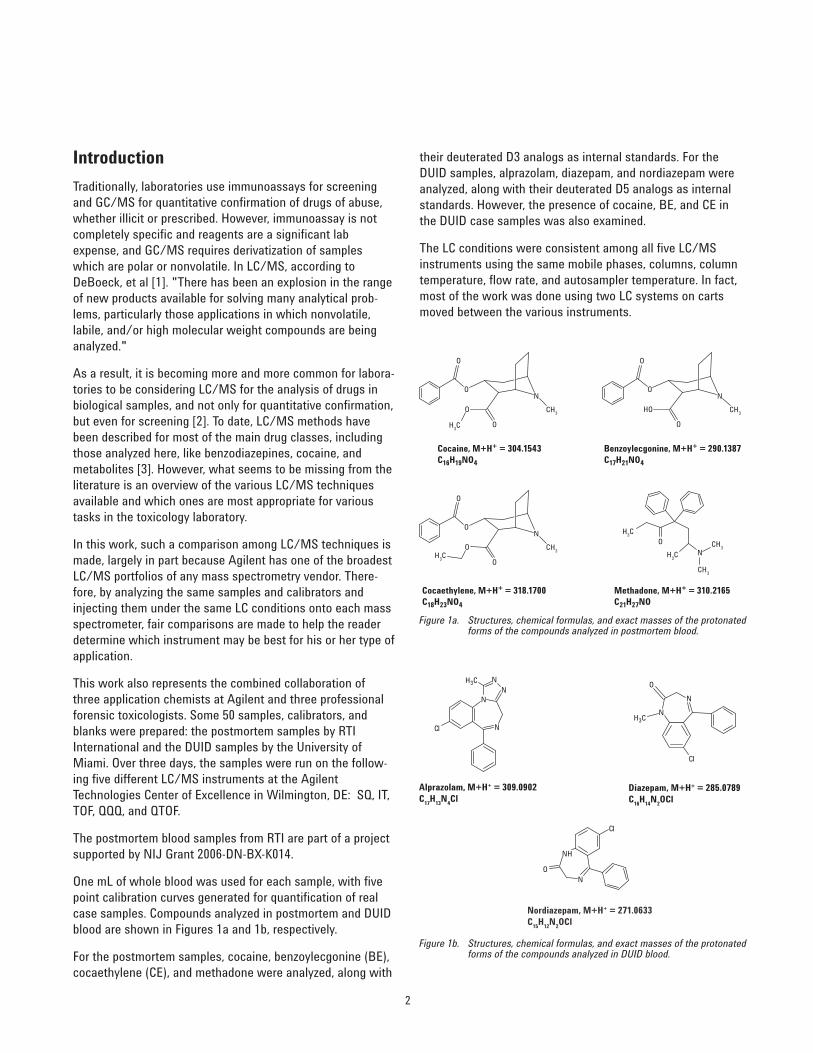
For the postmortem samples, cocaine, benzoylecgonine (BE),cocaethylene (CE), and methadone were analyzed, along with
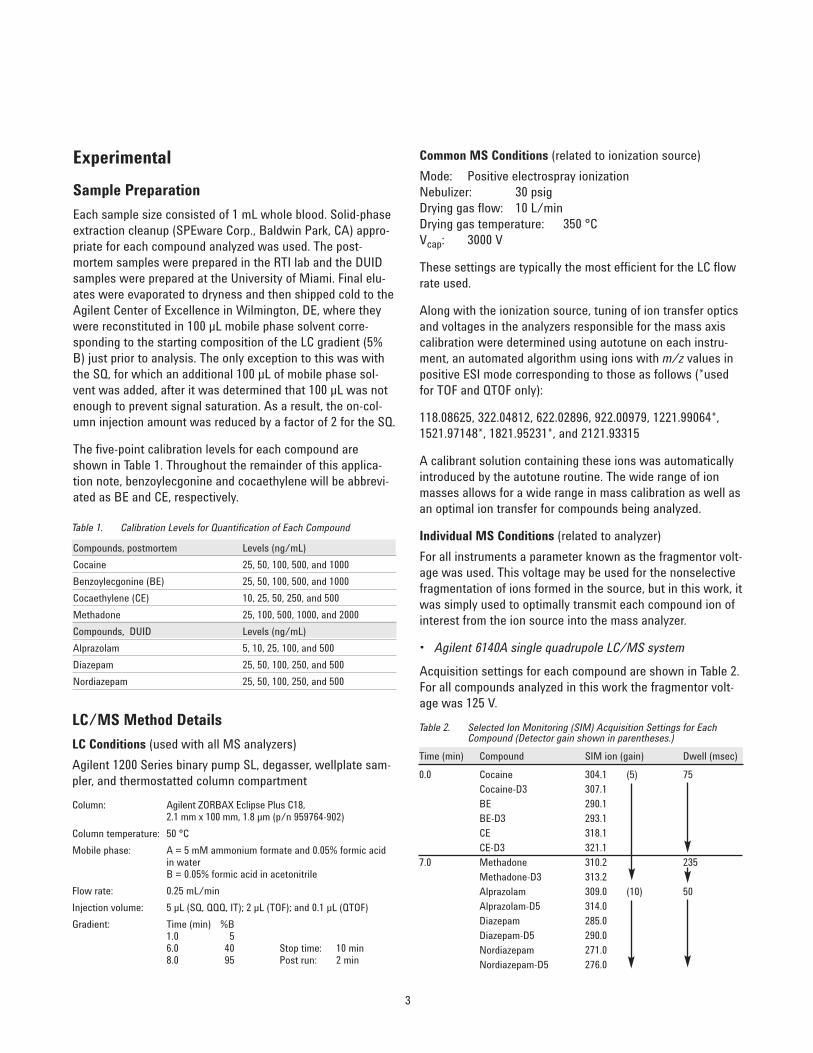
their deuterated D3 analogs as internal standards. For theDUID samples, alprazolam, diazepam, and nordiazepam wereanalyzed, along with their deuterated D5 analogs as internalstandards. However, the presence of cocaine, BE, and CE inthe DUID case samples was also examined.
The LC conditions were consistent among all five LC/MSinstruments using the same mobile phases, columns, columntemperature, flow rate, and autosampler temperature. In fact,most of the work was done using two LC systems on cartsmoved between the various instruments.
Cocaine, M+H+ = 304.1543C16H19NO4
Benzoylecgonine, M+H+ = 290.1387C17H21NO4
O
O
O
OH3C
N
CH3
CH3
CH3
Cocaethylene, M+H+ = 318.1700C18H23NO4
Methadone, M+H+ = 310.2165C21H27NO
O
O
O
OH
3C
H3C
H3C
N
CH3
O
O
HO
O
N
CH3
O
N
Figure 1a. Structures, chemical formulas, and exact masses of the protonatedforms of the compounds analyzed in postmortem blood.
Alprazolam, M+H+ = 309.0902C
17H
13N
4Cl
Diazepam, M+H+ = 285.0789C
16H
14N
2OCl
Nordiazepam, M+H+ = 271.0633C
15H
12N
2OCl
H3C
H3C
NN
N
N
Cl
N
N
O
Cl
N
NH
Cl
O
Figure 1b. Structures, chemical formulas, and exact masses of the protonatedforms of the compounds analyzed in DUID blood.
3
Experimental
Sample Preparation
Each sample size consisted of 1 mL whole blood. Solid-phaseextraction cleanup (SPEware Corp., Baldwin Park, CA) appro-priate for each compound analyzed was used. The post-mortem samples were prepared in the RTI lab and the DUIDsamples were prepared at the University of Miami. Final elu-ates were evaporated to dryness and then shipped cold to theAgilent Center of Excellence in Wilmington, DE, where theywere reconstituted in 100 µL mobile phase solvent corre-sponding to the starting composition of the LC gradient (5%B) just prior to analysis. The only exception to this was withthe SQ, for which an additional 100 µL of mobile phase sol-vent was added, after it was determined that 100 µL was notenough to prevent signal saturation. As a result, the on-col-umn injection amount was reduced by a factor of 2 for the SQ.
The five-point calibration levels for each compound areshown in Table 1. Throughout the remainder of this applica-tion note, benzoylecgonine and cocaethylene will be abbrevi-ated as BE and CE, respectively.
Common MS Conditions (related to ionization source)
Mode: Positive electrospray ionizationNebulizer: 30 psigDrying gas flow: 10 L/minDrying gas temperature: 350 °C Vcap: 3000 V
These settings are typically the most efficient for the LC flowrate used.
Along with the ionization source, tuning of ion transfer opticsand voltages in the analyzers responsible for the mass axiscalibration were determined using autotune on each instru-ment, an automated algorithm using ions with m/z values inpositive ESI mode corresponding to those as follows (*usedfor TOF and QTOF only):
118.08625, 322.04812, 622.02896, 922.00979, 1221.99064*,1521.97148*, 1821.95231*, and 2121.93315
A calibrant solution containing these ions was automaticallyintroduced by the autotune routine. The wide range of ionmasses allows for a wide range in mass calibration as well asan optimal ion transfer for compounds being analyzed.
Individual MS Conditions (related to analyzer)
For all instruments a parameter known as the fragmentor volt-age was used. This voltage may be used for the nonselectivefragmentation of ions formed in the source, but in this work, itwas simply used to optimally transmit each compound ion ofinterest from the ion source into the mass analyzer.
• Agilent 6140A single quadrupole LC/MS system
Acquisition settings for each compound are shown in Table 2.For all compounds analyzed in this work the fragmentor volt-age was 125 V.
Table 1. Calibration Levels for Quantification of Each Compound
Compounds, postmortem Levels (ng/mL)
Cocaine 25, 50, 100, 500, and 1000
Benzoylecgonine (BE) 25, 50, 100, 500, and 1000
Cocaethylene (CE) 10, 25, 50, 250, and 500
Methadone 25, 100, 500, 1000, and 2000
Compounds, DUID Levels (ng/mL)
Alprazolam 5, 10, 25, 100, and 500
Diazepam 25, 50, 100, 250, and 500
Nordiazepam 25, 50, 100, 250, and 500
LC/MS Method Details
LC Conditions (used with all MS analyzers)
Agilent 1200 Series binary pump SL, degasser, wellplate sam-pler, and thermostatted column compartment
Column: Agilent ZORBAX Eclipse Plus C18, 2.1 mm x 100 mm, 1.8 µm (p/n 959764-902)
Column temperature: 50 °C
Mobile phase: A = 5 mM ammonium formate and 0.05% formic acid in waterB = 0.05% formic acid in acetonitrile
Gradient: Time (min) %B1.0 56.0 40 Stop time: 10 min8.0 95 Post run: 2 min
Table 2. Selected Ion Monitoring (SIM) Acquisition Settings for EachCompound (Detector gain shown in parentheses.)
Time (min) Compound SIM ion (gain) Dwell (msec)
0.0 Cocaine 304.1 (5) 75
Cocaine-D3 307.1
BE 290.1
BE-D3 293.1
CE 318.1
CE-D3 321.1
7.0 Methadone 310.2 235
Methadone-D3 313.2
Alprazolam 309.0 (10) 50
Alprazolam-D5 314.0
Diazepam 285.0
Diazepam-D5 290.0
Nordiazepam 271.0
Nordiazepam-D5 276.0
4
The SQ instrument was the least expensive instrument ofthose used in this work. It was also the easiest to use in thatthere was typically only one parameter, the fragmentor volt-age, that needed to be optimized for each SIM experiment.As noted above, the settings for the ionization source, ionoptics, and mass analyzer are already determined by the LCflow rate and by the autotune routine.
• Agilent 6410A triple quadrupole LC/MS system
Along with the fragmentor voltage, the collision energy (CEn)was a parameter to optimize for acquisition in the QQQ. Thisvoltage was optimized to produce the highest responseamong product ions for multiple reaction monitoring (MRM).For each analyte compound, the higher response MRM wasmonitored for quantification and the next highest was usedfor confirmation as a qualifier. To confirm the presence ofcompounds in a sample, the peak area ratio of the qualifierversus quantifier MRM must be consistent with calibratorsand within a tolerance of ± 20%. The MRM transitions arelisted in Table 3. Qualifier ions and their voltages are indicatedin square brackets ([ ]).
The QQQ may be operated as a scanning instrument as well,scanning as fast as 5,400 amu/sec, but this is not the mostsensitive acquisition mode of the instrument. Just like theSQ, the fragmentor voltage must be optimized for each ana-lyte ion of interest. In addition, the CEn must be optimized tomaximize the responses of the quantifier and qualifier productions. Otherwise, just like the SQ, the settings required formethod development are predetermined for the ESI based onLC flow rate, and for the ion transfer optics and mass analyzervoltages based on the tuning mix ions.
• Agilent 6330A ion trap LC/MS system
The ion trap was operated in a targeted screening mode ofAutoMS(3) with an Include List of the expected compounds.The Include List consists of the m/z values corresponding tothe expected ion masses (M + H)+ of the analyte compounds.This list was the same as those shown as SIM ions in Table 2.
Operating in AutoMS(3) means that the ion trap was scanningin MS mode and when the intensity of any of the ion massesin the Include List rose above a user-defined threshold, thation was then fragmented in full scan MS/MS mode. Theinstrument also looked at the intensity of the product ions andif any of them were more intense than another user-definedthreshold, then that product ion would be fragmented in full-scan MS/MS/MS mode, or MS(3).
Acquiring in MS/MS/MS mode is specific to the compoundstructure; however, it does require enough signal in theMS/MS mode to be successful. The acquired MS/MS andMS(3) spectra are then compared to the same type of spectrain a library available from Agilent of some 400 compounds.Scoring matches are a weighted average of matching scoresat the MS/MS and MS(3) levels as shown in the equationbelow.
Table 3. MRM Acquisition Settings for Each Compound (Qualifier ion set-tings in brackets, fragmentor voltage denoted as frag and colli-sion energy denoted as CEn)
Time Dwell(min) Compound MRM Frag (V) CEn (V) (msec)
The effective score Score' is related to the individual scoreScore at each level of MS/MS and MS(3) matched to corre-sponding spectra in the library. The Score is the Fit (F),Reverse Fit (RF), and Purity (P) as calculated using the indus-try standard NIST-based search algorithm. The library doesnot contain MS spectra, so matching at that level is not car-ried out. Coeluting compounds can interfere with librarymatching at the MS level.
In the above equation, M is the number of compound spectraidentified and N is the total number of spectra. Match is aparameter that may be employed to allow comparisons of dif-ferent levels of MS spectra. For example, an acquired MSspectrum could be identified using an MS/MS spectrum inthe library. This would correspond to a Match = 500. Since allMatch parameters are set to "Forbidden," the value of Matchin all instances of scoring is 1,000.
Therefore, effective scores will be expressed as Fit', RFit', andPurity'.
5
Fragmentation is carried out in a unique mode known asSmartFrag, which is a ramped collision energy applied over arange of 0.3 to 2.0 V, which results in producing consistentproduct ion spectra from one instrument to another and gen-erates fragment ions over a wider mass range. The libraryspectra are also acquired using SmartFrag.
Additional acquisition parameters include Smart ParameterSettings (SPS) turned on, a scan range of 150 to 300, aMaximum Accumulation Time of 200 msec, a Smart Target of500,000, and Averages set to 5. The SPS consists of voltagesdesigned to optimally transmit precursor ions to the ion trapanalyzer and optimally collect them in the trap itself. TheMaximum Accumulation Time is the longest amount of timethe ion trap will spend accumulating ions before beginninganother scan or performing the fragmentation cycle on aselected precursor.
The Smart Target setting has to do with filling the ion trap tocapacity but avoiding overfilling, which can result in a loss ofresolution and mass assignment. Setting Averages to 5means that 5 full scans are actually acquired and then aver-aged before being stored as a data scan.
Acquiring in full-scan MS/MS mode is the most sensitiveacquisition of the ion trap. The ion trap can be used for quan-tification, but normally only if the samples are clean. This isbecause the ion trap collects all of the ions formed in the ionsource before selecting a precursor and fragmenting it. Ifmatrix ions are also present, then there is less room to trapthe analytes of interest, thus reducing sensitivity.
As in the case of the SQ and QQQ mass spectrometers, thesource settings are based on LC flow rate. The mass axis cali-bration is carried out using an infusion of tuning mix ions.Optimal voltages in the ion optics and mass analyzer for trap-ping precursor ions of interest are predetermined using thetuning mix. Method development is minimal in the AutoMS(3)mode of operation.
• Agilent 6220 accurate-mass time-of-flight LC/MS system
The acquisition settings include the fragmentor set to 150 V.The scanning range was m/z 100 to 1,000, with approximately10,000 transients acquired per scan. A transient is one pulse,boosting a packet of ions into the TOF mass analyzer.Reference ions at m/z 121.0509 and 922.0098 were used forreal-time calibration of each scan, updating each spectrumbefore it was stored in the data file.
The reference mass solution was introduced through a sec-ond sprayer and used to ensure better than 2 ppm mass accu-racy in MS mode and 5 ppm in MS/MS mode on the QTOF.The second sprayer eliminates ion suppression, which mightotherwise be caused by introducing the reference compoundsinto the LC flow prior to ionization.
The injection volume was reduced to 2 µL because the 5 µLinjection volume amount used for the SQ, QQQ, and IT wasfound to cause either electrospray or MS detector saturationfor some of the compounds in the case samples. We underes-timated the sensitivity of the SQ and the TOF when initiallyreconstituting the samples.
Once again, because the Agilent TOF instrument shares thesame ion source and ion optics as the other LC/MS instru-mentation in the Agilent portfolio, method development wassimplified by the fact that source settings were based on flowrate, and ion transfer optics and mass analyzer voltages werepredetermined using the autotune discussed earlier. The frag-mentor voltage of 150 V used in this work was an ion transferoptic setting that worked well for transferring a wide massrange of ions to the mass analyzer. The optimum fragmentorvoltage varied slightly for the LC/MS systems because ofslight differences in the ion optics of the five mass analyzers.
The same settings were used with the QTOF as with the TOFand in an acquisition mode similar to the ion trap calledAutoMS/MS. The QTOF scans m/z 100 to 1,000, and when anion intensity was above a user-defined threshold, the selectedion was fragmented and a full-scan MS/MS was acquired inthe mass analyzer. The collision energy was mass normalizedor based on the mass of the precursor ion, assuming that thehigher the precursor m/z the higher the collision energyrequired to adequately fragment it and form enough productions to determine structure.
The same reference ions were used and also introducedthrough a second sprayer. Consistent with the other AgilentLC/MS instrumentation included in this work, the source set-tings were dependent upon LC flow rate while the ion transferoptics and mass analyzer voltages were based on an auto-mated tuning and calibration algorithm using the ion masseslisted earlier. Like the TOF, the fragmentor voltage is set to150 V.
6
Results and Discussion
Single Quadrupole Mass Spectrometer
Postmortem Blood
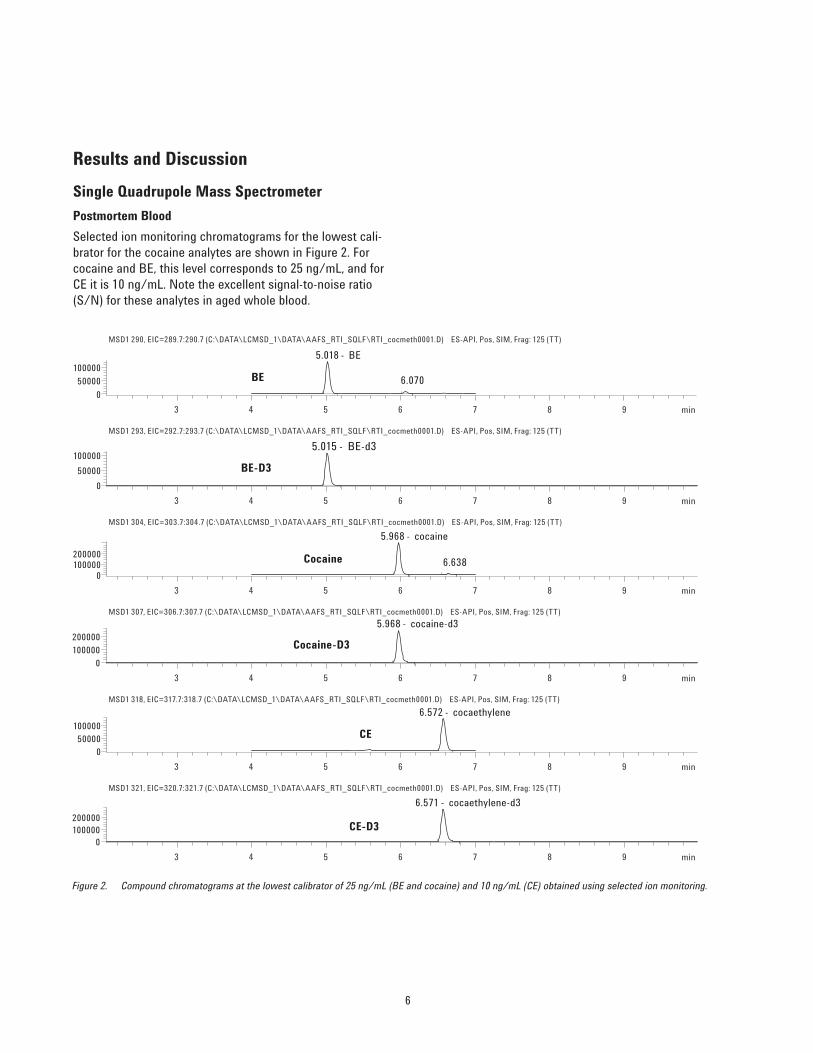
Selected ion monitoring chromatograms for the lowest cali-brator for the cocaine analytes are shown in Figure 2. Forcocaine and BE, this level corresponds to 25 ng/mL, and forCE it is 10 ng/mL. Note the excellent signal-to-noise ratio(S/N) for these analytes in aged whole blood.
Figure 2. Compound chromatograms at the lowest calibrator of 25 ng/mL (BE and cocaine) and 10 ng/mL (CE) obtained using selected ion monitoring.
7
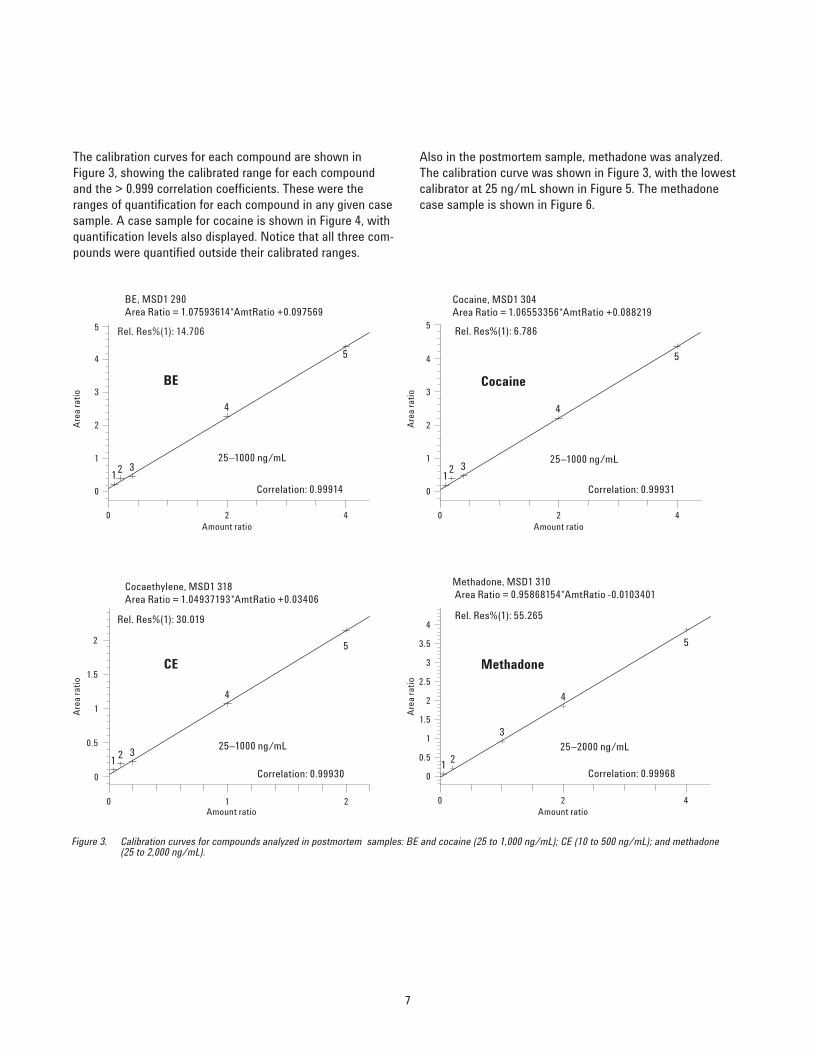
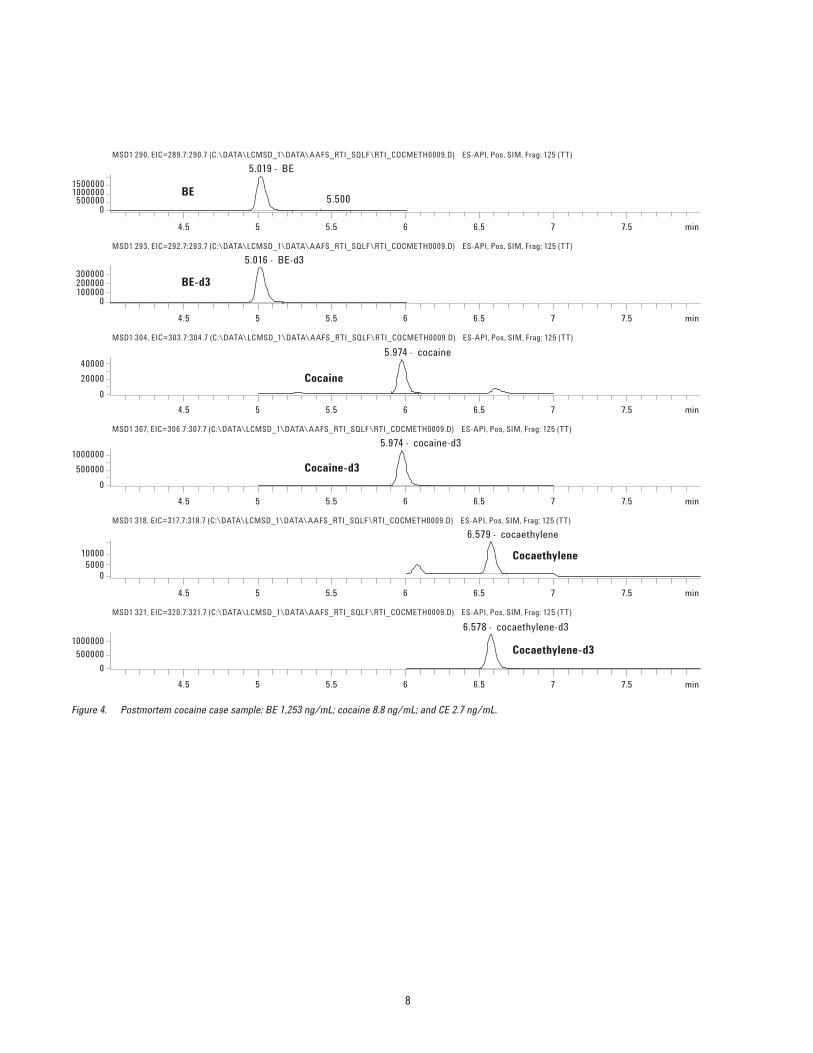
The calibration curves for each compound are shown inFigure 3, showing the calibrated range for each compoundand the > 0.999 correlation coefficients. These were theranges of quantification for each compound in any given casesample. A case sample for cocaine is shown in Figure 4, withquantification levels also displayed. Notice that all three com-pounds were quantified outside their calibrated ranges.
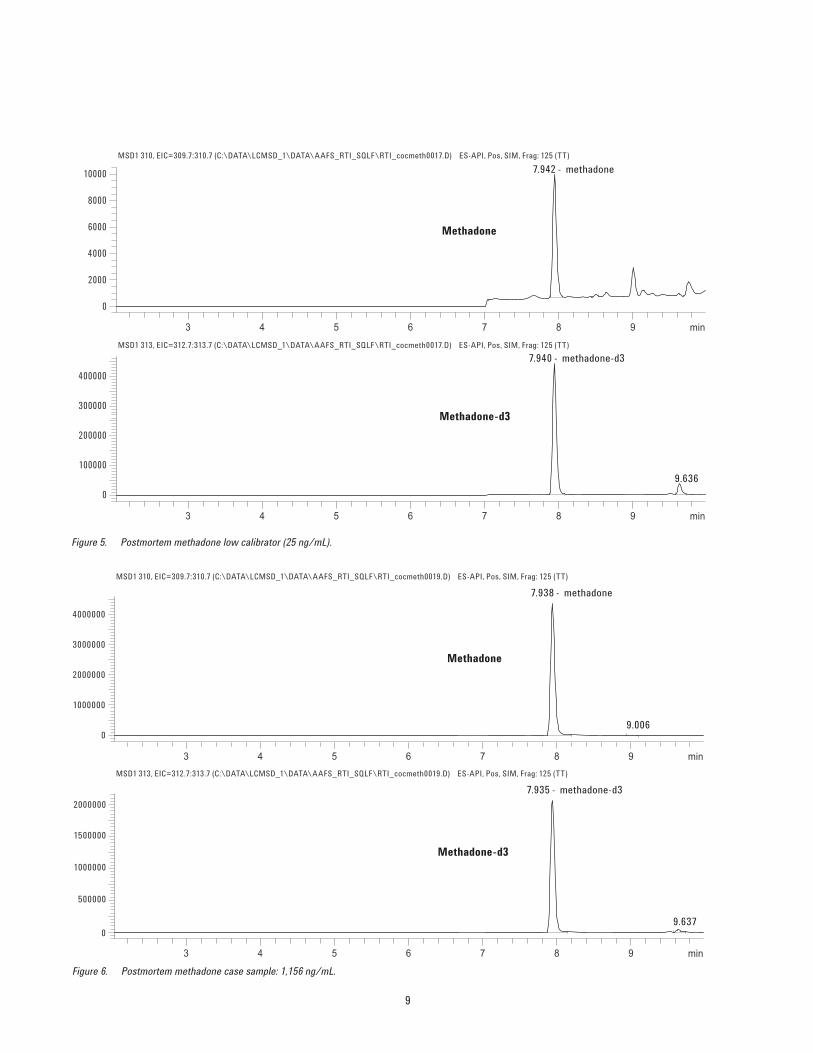
Also in the postmortem sample, methadone was analyzed.The calibration curve was shown in Figure 3, with the lowestcalibrator at 25 ng/mL shown in Figure 5. The methadonecase sample is shown in Figure 6.
0 1 2
0
0.5
1
1.5
2
12 3
4
5
Cocaethylene, MSD1 318 Area Ratio = 1.04937193*AmtRatio +0.03406
Correlation: 0.99930
Rel. Res%(1): 30.019
12 3
4
5
Cocaine, MSD1 304Area Ratio = 1.06553356*AmtRatio +0.088219
Correlation: 0.99931
Rel. Res%(1): 6.786
Amount ratio
Amount ratio
0 2 4
Are
a ra
tio
0
1
2
3
4
5
12 3
4
5
BE, MSD1 290 Area Ratio = 1.07593614*AmtRatio +0.097569
Correlation: 0.99914
Rel. Res%(1): 14.706
1 2
3
4
5
Methadone, MSD1 310 Area Ratio = 0.95868154*AmtRatio -0.0103401
Correlation: 0.99968
Rel. Res%(1): 55.265
Cocaine
Methadone
25–1000 ng/mL
25–2000 ng/mL
BE
CE
25–1000 ng/mL
25–1000 ng/mL
Amount ratio0 2 4
Are
a ra
tio
0
1
2
3
4
5
Amount ratio0 2 4
Are
a ra
tio
Are
a ra
tio
0
0.5
1
1.5
2
2.5
3
3.5
4
Figure 3. Calibration curves for compounds analyzed in postmortem samples: BE and cocaine (25 to 1,000 ng/mL); CE (10 to 500 ng/mL); and methadone (25 to 2,000 ng/mL).
Figure 6. Postmortem methadone case sample: 1,156 ng/mL.
10
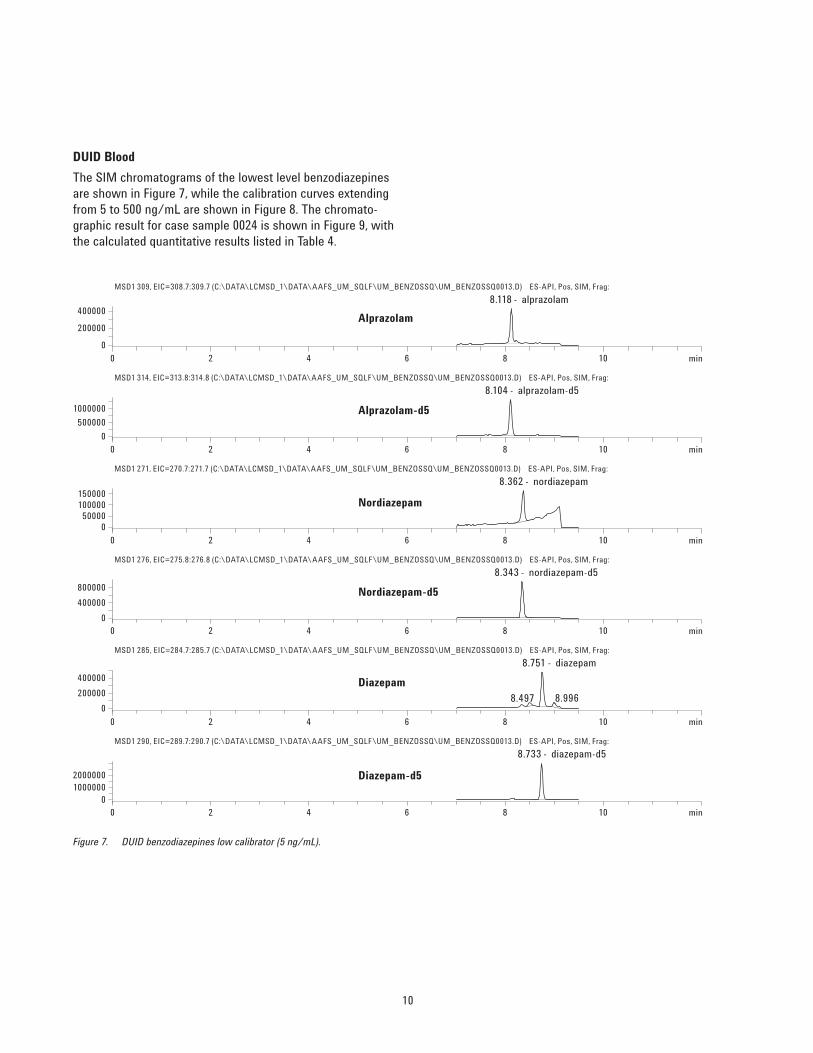
DUID Blood
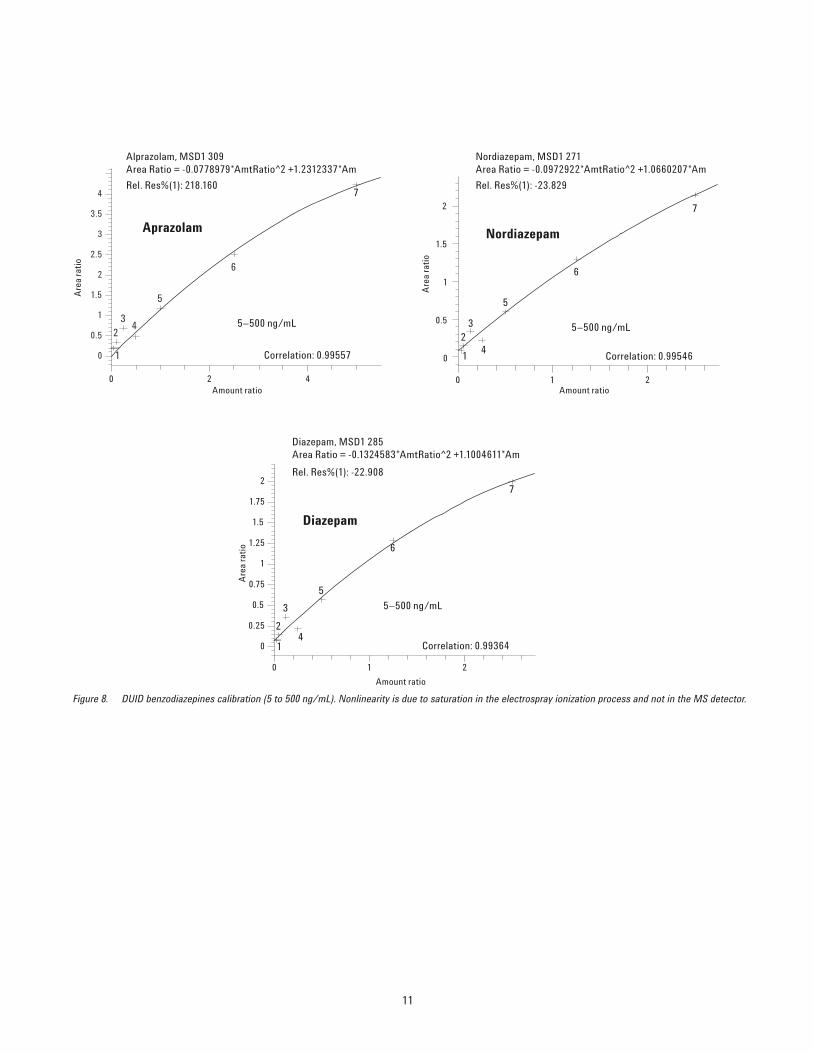
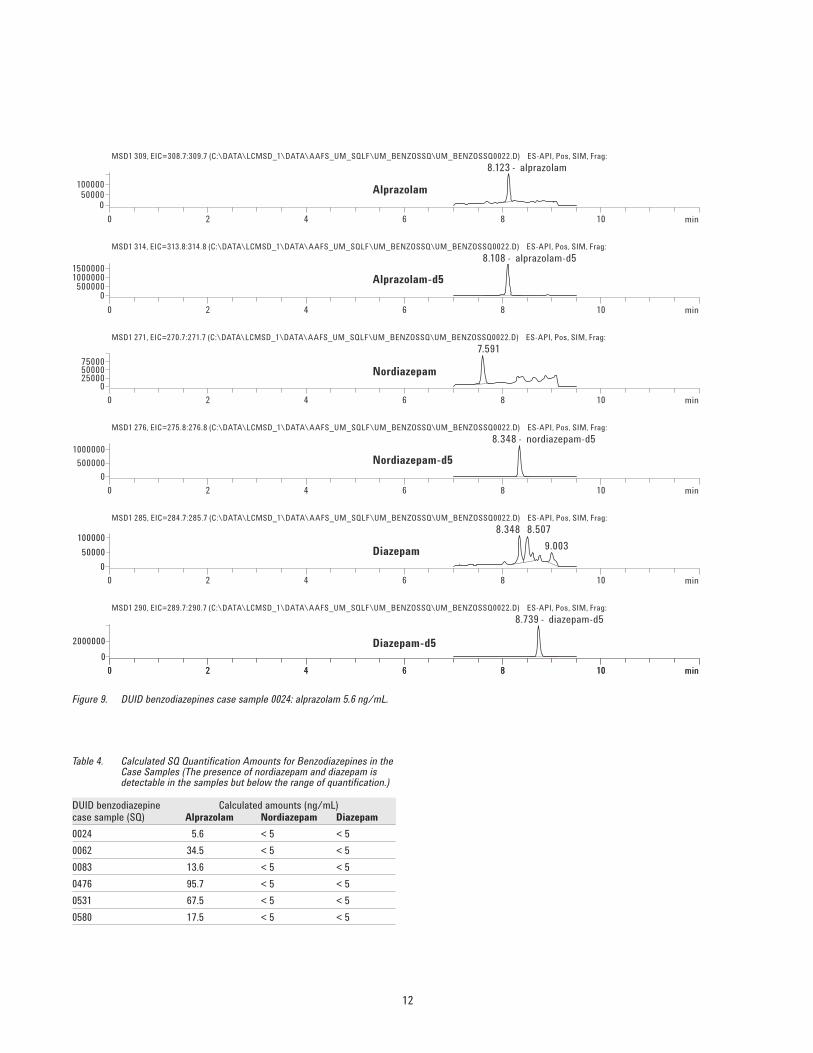
The SIM chromatograms of the lowest level benzodiazepinesare shown in Figure 7, while the calibration curves extendingfrom 5 to 500 ng/mL are shown in Figure 8. The chromato-graphic result for case sample 0024 is shown in Figure 9, withthe calculated quantitative results listed in Table 4.
Nordiazepam, MSD1 271Area Ratio = -0.0972922*AmtRatio^2 +1.0660207*Am
Correlation: 0.99546
Rel. Res%(1): -23.829
0 1 2
0
0.25
0.5
0.75
1
1.25
1.5
1.75
2
1
2
3
4
5
6
7
Diazepam, MSD1 285Area Ratio = -0.1324583*AmtRatio^2 +1.1004611*Am
Correlation: 0.99364
Rel. Res%(1): -22.908
0
0.5
1
1.5
2
2.5
3
3.5
4
1
23
4
5
6
7
Alprazolam, MSD1 309Area Ratio = -0.0778979*AmtRatio^2 +1.2312337*Am
Correlation: 0.99557
Rel. Res%(1): 218.160
Aprazolam
5–500 ng/mL
Nordiazepam
5–500 ng/mL
Diazepam
5–500 ng/mL
0 1 2
0
0.5
1
1.5
2
1
23
6
7
Amount ratio
Amount ratio
Amount ratio0 2 4
Are
a ra
tio
Are
a ra
tio
Are
a ra
tio
Figure 8. DUID benzodiazepines calibration (5 to 500 ng/mL). Nonlinearity is due to saturation in the electrospray ionization process and not in the MS detector.
Figure 9. DUID benzodiazepines case sample 0024: alprazolam 5.6 ng/mL.
Table 4. Calculated SQ Quantification Amounts for Benzodiazepines in theCase Samples (The presence of nordiazepam and diazepam isdetectable in the samples but below the range of quantification.)
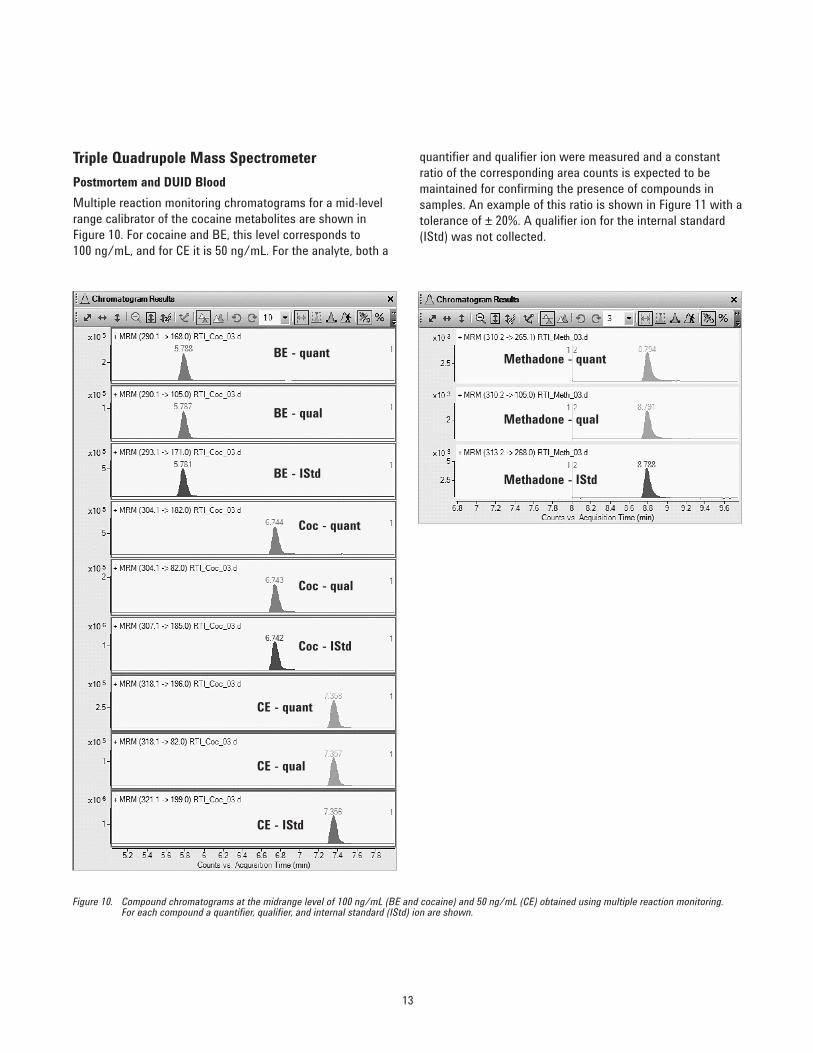
Multiple reaction monitoring chromatograms for a mid-levelrange calibrator of the cocaine metabolites are shown inFigure 10. For cocaine and BE, this level corresponds to 100 ng/mL, and for CE it is 50 ng/mL. For the analyte, both a
quantifier and qualifier ion were measured and a constantratio of the corresponding area counts is expected to bemaintained for confirming the presence of compounds insamples. An example of this ratio is shown in Figure 11 with atolerance of ± 20%. A qualifier ion for the internal standard(IStd) was not collected.
Figure 10. Compound chromatograms at the midrange level of 100 ng/mL (BE and cocaine) and 50 ng/mL (CE) obtained using multiple reaction monitoring.For each compound a quantifier, qualifier, and internal standard (IStd) ion are shown.
BE - quant
BE - qual
BE - IStd
Coc - quant
Coc - qual
Coc - IStd
CE - quant
CE - qual
CE - IStd
Methadone - quant
Methadone - qual
Methadone - IStd
14
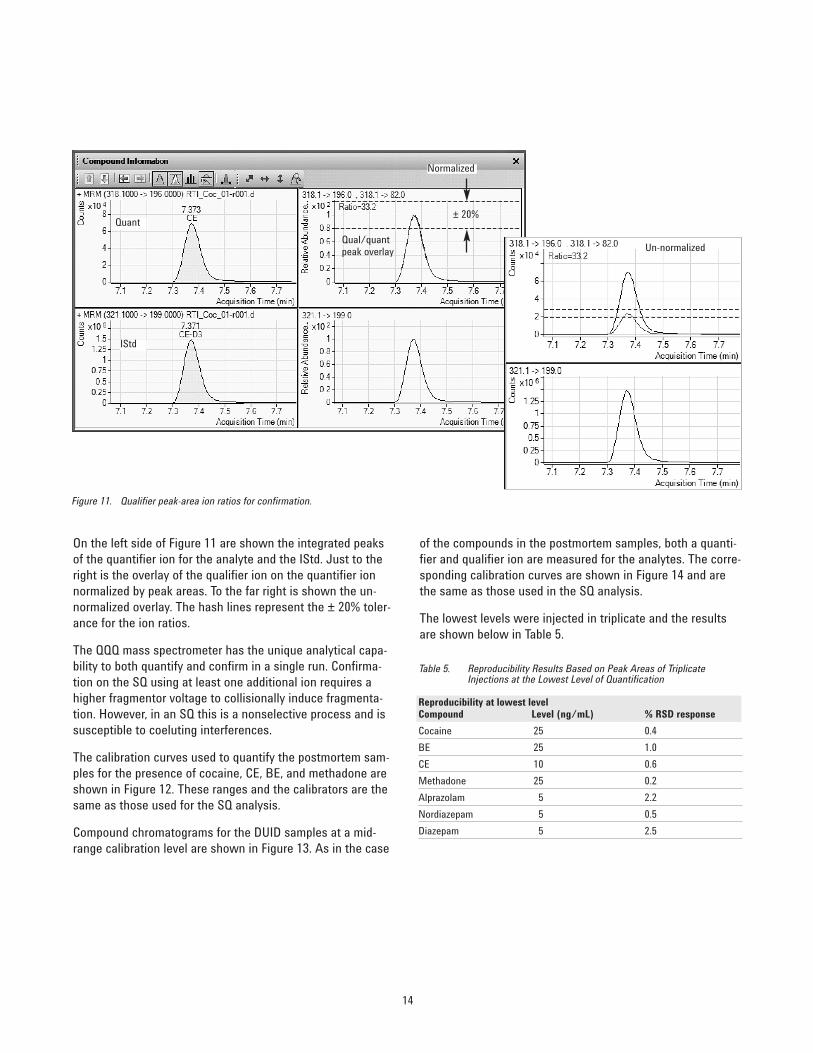
On the left side of Figure 11 are shown the integrated peaksof the quantifier ion for the analyte and the IStd. Just to theright is the overlay of the qualifier ion on the quantifier ionnormalized by peak areas. To the far right is shown the un-normalized overlay. The hash lines represent the ± 20% toler-ance for the ion ratios.
The QQQ mass spectrometer has the unique analytical capa-bility to both quantify and confirm in a single run. Confirma-tion on the SQ using at least one additional ion requires ahigher fragmentor voltage to collisionally induce fragmenta-tion. However, in an SQ this is a nonselective process and issusceptible to coeluting interferences.
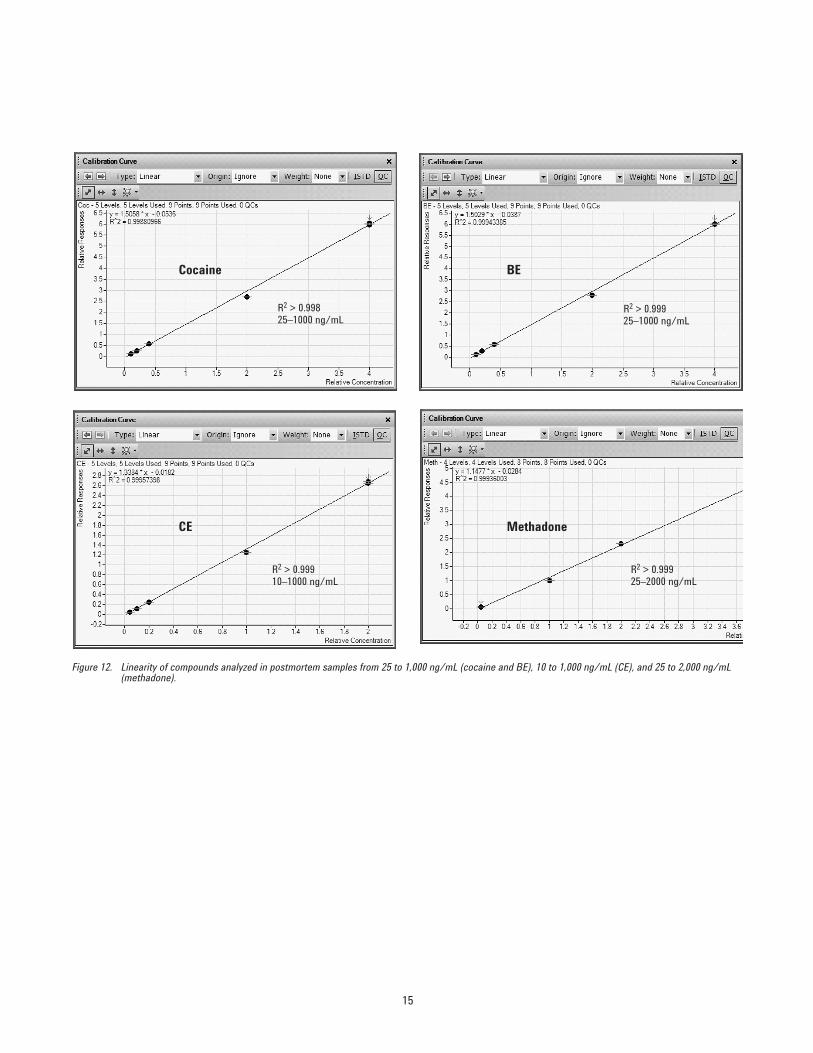
The calibration curves used to quantify the postmortem sam-ples for the presence of cocaine, CE, BE, and methadone areshown in Figure 12. These ranges and the calibrators are thesame as those used for the SQ analysis.
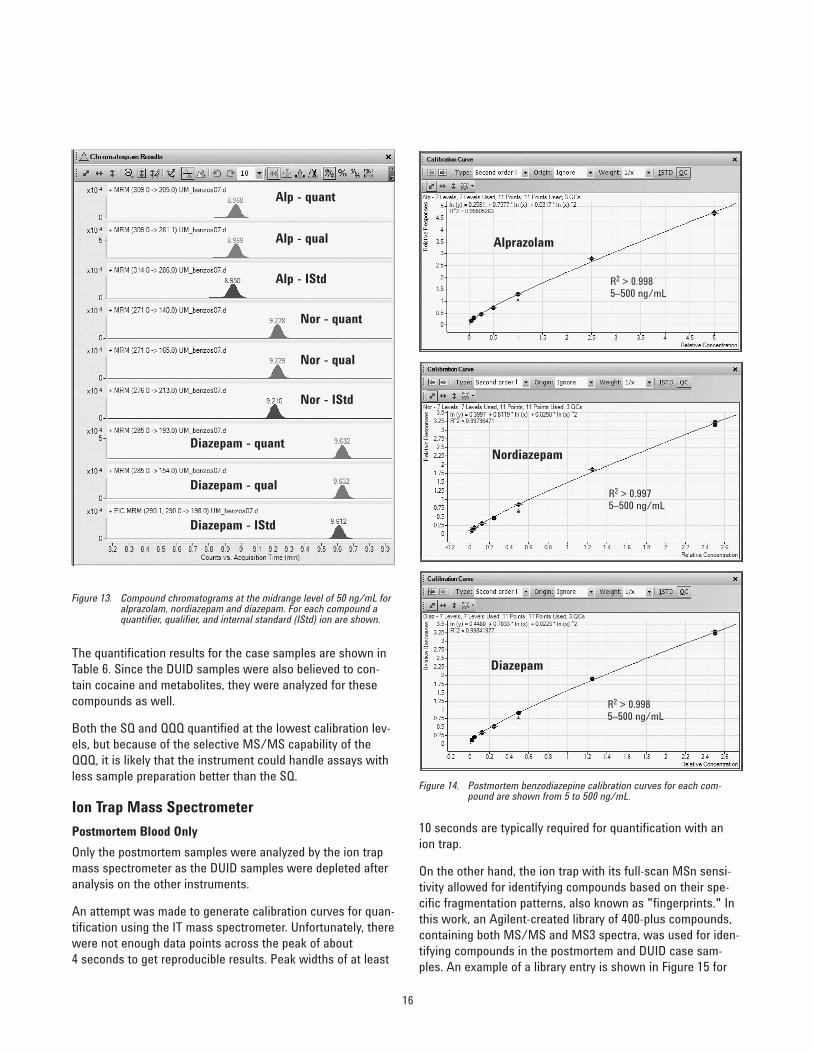
Compound chromatograms for the DUID samples at a mid-range calibration level are shown in Figure 13. As in the case
of the compounds in the postmortem samples, both a quanti-fier and qualifier ion are measured for the analytes. The corre-sponding calibration curves are shown in Figure 14 and arethe same as those used in the SQ analysis.
The lowest levels were injected in triplicate and the resultsare shown below in Table 5.
Figure 11. Qualifier peak-area ion ratios for confirmation.
Table 5. Reproducibility Results Based on Peak Areas of TriplicateInjections at the Lowest Level of Quantification
Reproducibility at lowest levelCompound Level (ng/mL) % RSD response
Cocaine 25 0.4
BE 25 1.0
CE 10 0.6
Methadone 25 0.2
Alprazolam 5 2.2
Nordiazepam 5 0.5
Diazepam 5 2.5
± 20%
Qual/quantpeak overlay Un-normalized
Quant
IStd
Normalized
15
Figure 12. Linearity of compounds analyzed in postmortem samples from 25 to 1,000 ng/mL (cocaine and BE), 10 to 1,000 ng/mL (CE), and 25 to 2,000 ng/mL(methadone).
Methadone
BECocaine
CE
R2 > 0.99825–1000 ng/mL
R2 > 0.99925–1000 ng/mL
R2 > 0.99910–1000 ng/mL
R2 > 0.99925–2000 ng/mL
16
Figure 13. Compound chromatograms at the midrange level of 50 ng/mL foralprazolam, nordiazepam and diazepam. For each compound aquantifier, qualifier, and internal standard (IStd) ion are shown.
Figure 14. Postmortem benzodiazepine calibration curves for each com-pound are shown from 5 to 500 ng/mL.
The quantification results for the case samples are shown inTable 6. Since the DUID samples were also believed to con-tain cocaine and metabolites, they were analyzed for thesecompounds as well.
Both the SQ and QQQ quantified at the lowest calibration lev-els, but because of the selective MS/MS capability of theQQQ, it is likely that the instrument could handle assays withless sample preparation better than the SQ.
Ion Trap Mass Spectrometer
Postmortem Blood Only
Only the postmortem samples were analyzed by the ion trapmass spectrometer as the DUID samples were depleted afteranalysis on the other instruments.
An attempt was made to generate calibration curves for quan-tification using the IT mass spectrometer. Unfortunately, therewere not enough data points across the peak of about 4 seconds to get reproducible results. Peak widths of at least
10 seconds are typically required for quantification with anion trap.
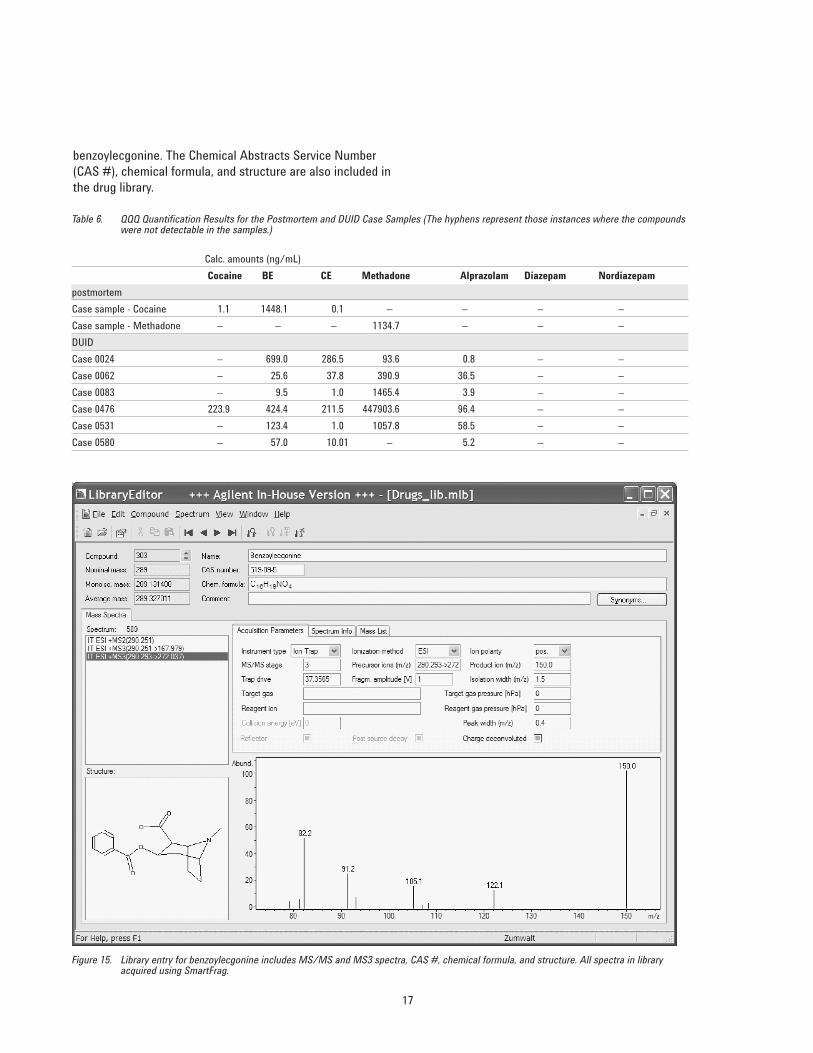
On the other hand, the ion trap with its full-scan MSn sensi-tivity allowed for identifying compounds based on their spe-cific fragmentation patterns, also known as "fingerprints." Inthis work, an Agilent-created library of 400-plus compounds,containing both MS/MS and MS3 spectra, was used for iden-tifying compounds in the postmortem and DUID case sam-ples. An example of a library entry is shown in Figure 15 for
Alp - quant
Alp - qual
Alp - IStd
Nor - quant
Nor - qual
Nor - IStd
Diazepam - IStd
Diazepam - qual
Diazepam - quant
Alprazolam
R2 > 0.9985–500 ng/mL
Nordiazepam
R2 > 0.9975–500 ng/mL
Diazepam
R2 > 0.9985–500 ng/mL
17
benzoylecgonine. The Chemical Abstracts Service Number(CAS #), chemical formula, and structure are also included inthe drug library.
Table 6. QQQ Quantification Results for the Postmortem and DUID Case Samples (The hyphens represent those instances where the compoundswere not detectable in the samples.)
Calc. amounts (ng/mL)
Cocaine BE CE Methadone Alprazolam Diazepam Nordiazepam
postmortem
Case sample - Cocaine 1.1 1448.1 0.1 – – – –
Case sample - Methadone – – – 1134.7 – – –
DUID
Case 0024 – 699.0 286.5 93.6 0.8 – –
Case 0062 – 25.6 37.8 390.9 36.5 – –
Case 0083 – 9.5 1.0 1465.4 3.9 – –
Case 0476 223.9 424.4 211.5 447903.6 96.4 – –
Case 0531 – 123.4 1.0 1057.8 58.5 – –
Case 0580 – 57.0 10.01 – 5.2 – –
Figure 15. Library entry for benzoylecgonine includes MS/MS and MS3 spectra, CAS #, chemical formula, and structure. All spectra in libraryacquired using SmartFrag.
18
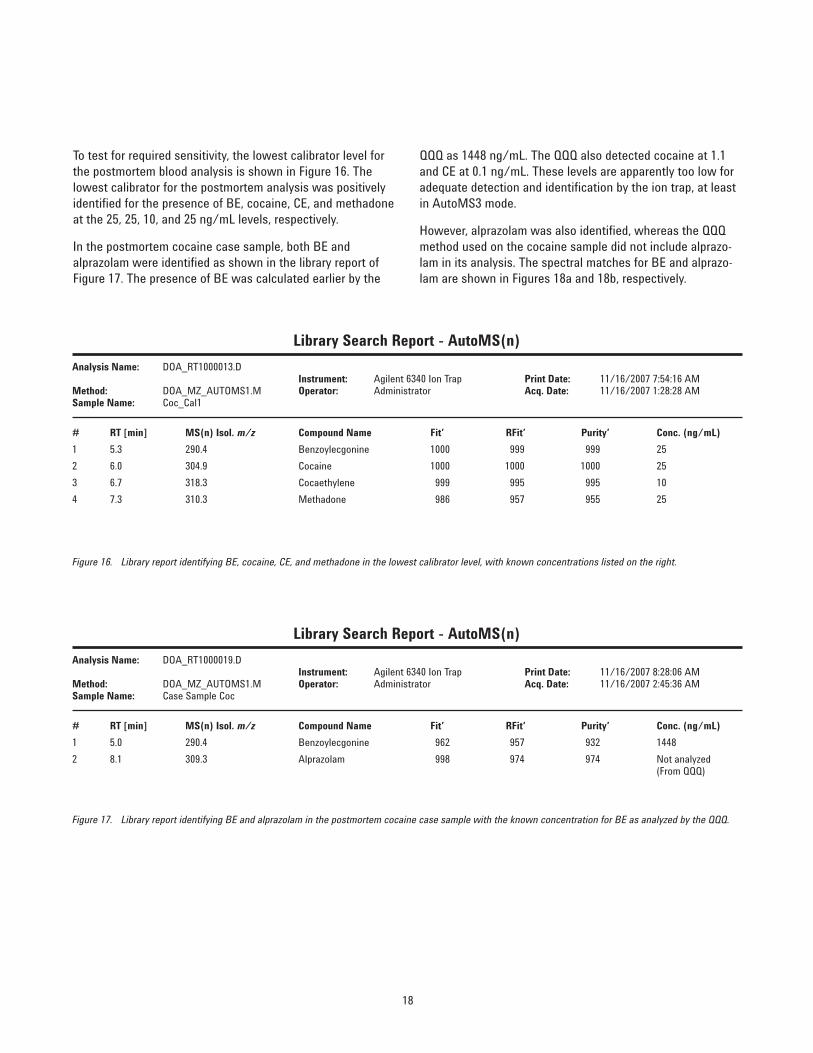
To test for required sensitivity, the lowest calibrator level forthe postmortem blood analysis is shown in Figure 16. Thelowest calibrator for the postmortem analysis was positivelyidentified for the presence of BE, cocaine, CE, and methadoneat the 25, 25, 10, and 25 ng/mL levels, respectively.
In the postmortem cocaine case sample, both BE and alprazolam were identified as shown in the library report ofFigure 17. The presence of BE was calculated earlier by the
QQQ as 1448 ng/mL. The QQQ also detected cocaine at 1.1and CE at 0.1 ng/mL. These levels are apparently too low foradequate detection and identification by the ion trap, at leastin AutoMS3 mode.
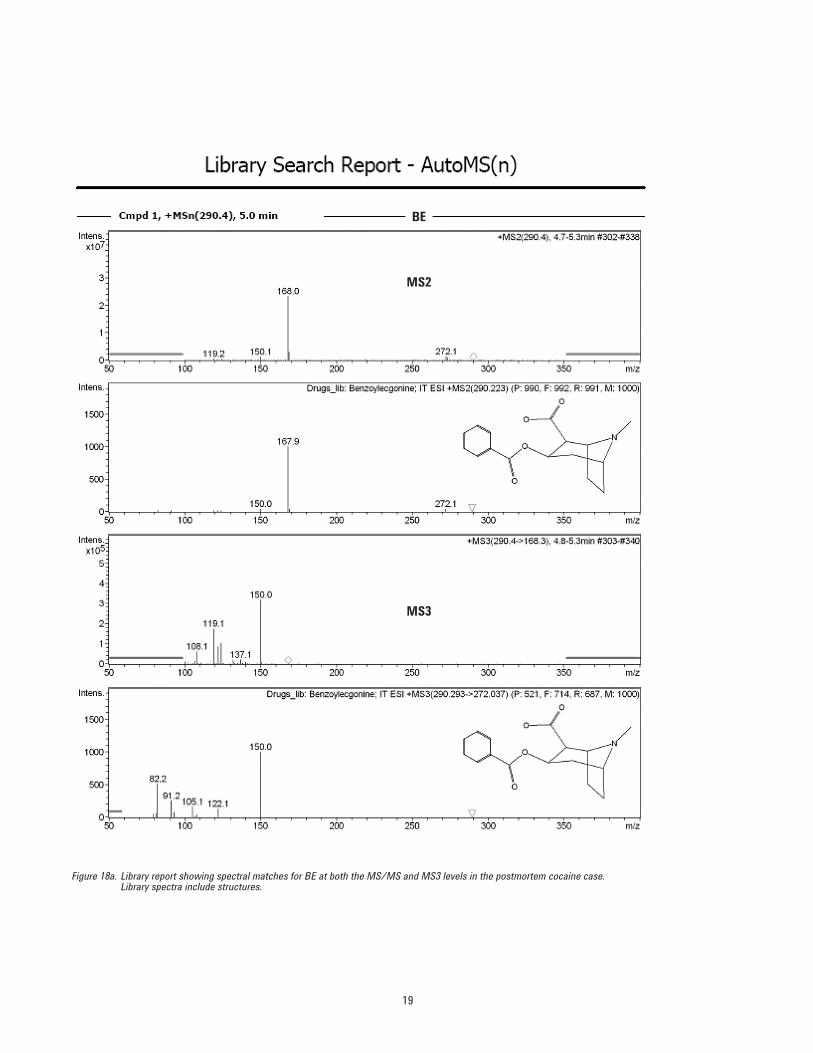
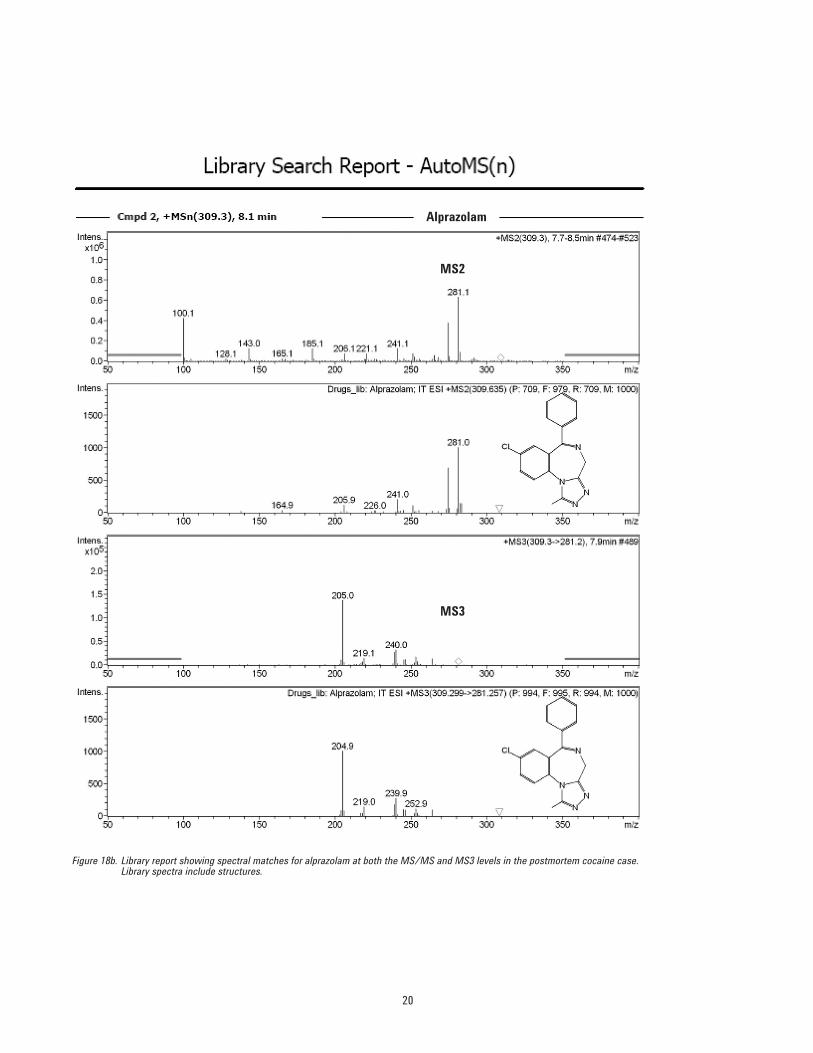
However, alprazolam was also identified, whereas the QQQmethod used on the cocaine sample did not include alprazo-lam in its analysis. The spectral matches for BE and alprazo-lam are shown in Figures 18a and 18b, respectively.
Library Search Report - AutoMS(n)
Analysis Name: DOA_RT1000013.DInstrument: Agilent 6340 Ion Trap Print Date: 11/16/2007 7:54:16 AM
2 8.1 309.3 Alprazolam 998 974 974 Not analyzed(From QQQ)
Figure 17. Library report identifying BE and alprazolam in the postmortem cocaine case sample with the known concentration for BE as analyzed by the QQQ.
19
Figure 18a. Library report showing spectral matches for BE at both the MS/MS and MS3 levels in the postmortem cocaine case.Library spectra include structures.
BE
MS2
MS3
20
Figure 18b. Library report showing spectral matches for alprazolam at both the MS/MS and MS3 levels in the postmortem cocaine case.Library spectra include structures.
Alprazolam
MS2
MS3
21
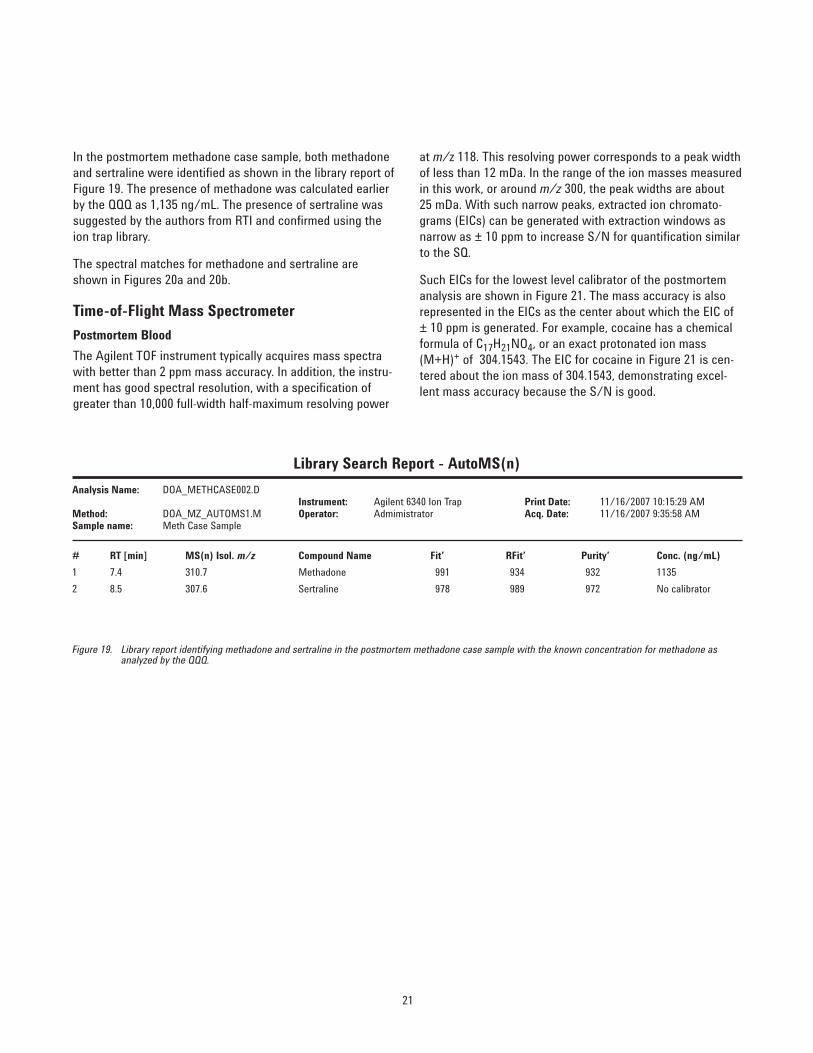
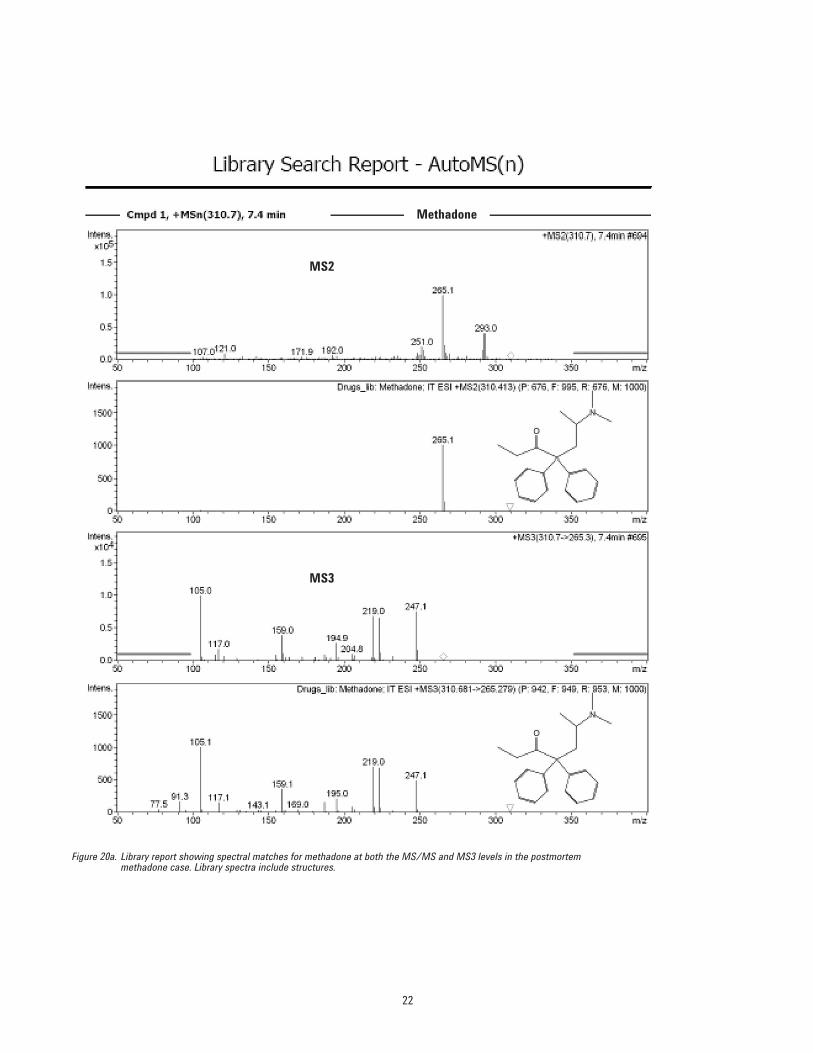
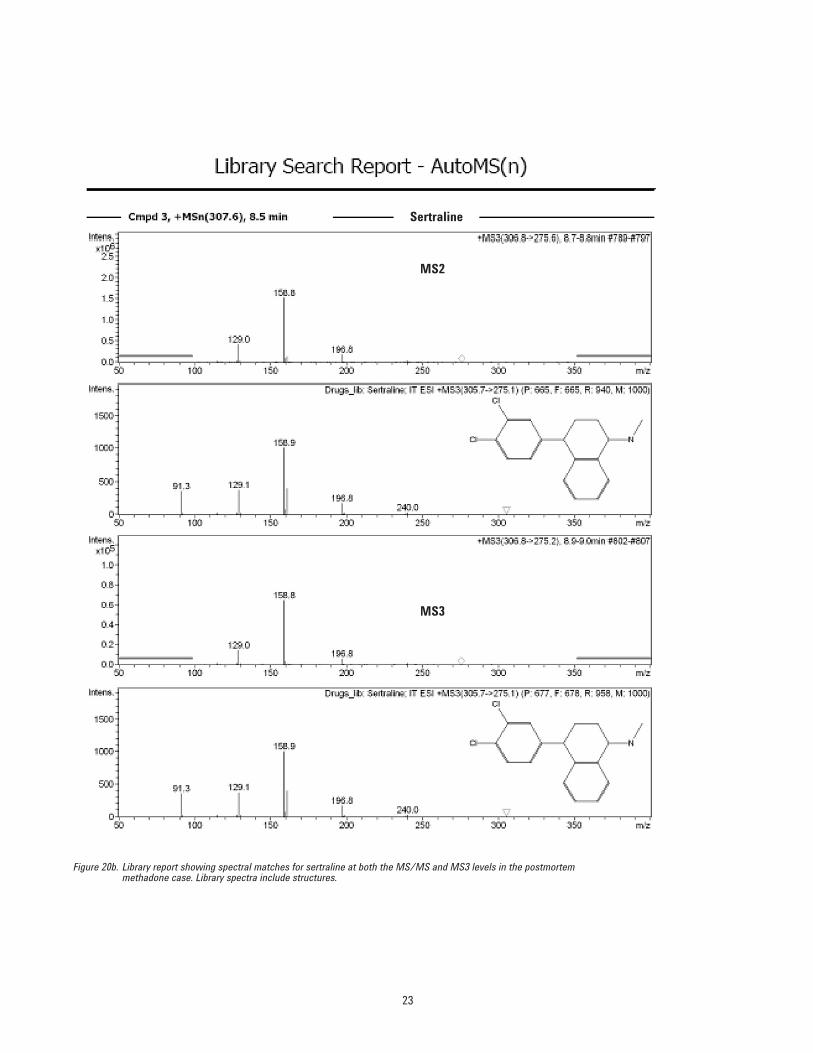
In the postmortem methadone case sample, both methadoneand sertraline were identified as shown in the library report ofFigure 19. The presence of methadone was calculated earlierby the QQQ as 1,135 ng/mL. The presence of sertraline wassuggested by the authors from RTI and confirmed using theion trap library.
The spectral matches for methadone and sertraline areshown in Figures 20a and 20b.
Time-of-Flight Mass Spectrometer
Postmortem Blood
The Agilent TOF instrument typically acquires mass spectrawith better than 2 ppm mass accuracy. In addition, the instru-ment has good spectral resolution, with a specification ofgreater than 10,000 full-width half-maximum resolving power
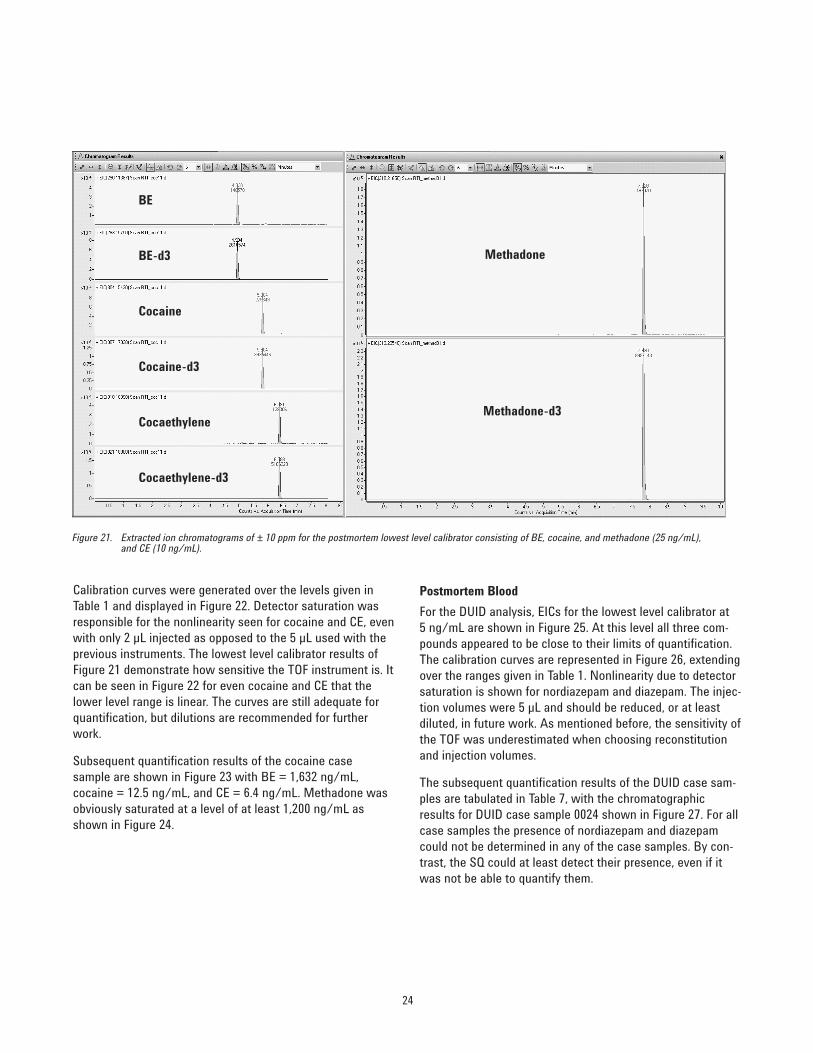
at m/z 118. This resolving power corresponds to a peak widthof less than 12 mDa. In the range of the ion masses measuredin this work, or around m/z 300, the peak widths are about 25 mDa. With such narrow peaks, extracted ion chromato-grams (EICs) can be generated with extraction windows asnarrow as ± 10 ppm to increase S/N for quantification similarto the SQ.
Such EICs for the lowest level calibrator of the postmortemanalysis are shown in Figure 21. The mass accuracy is alsorepresented in the EICs as the center about which the EIC of± 10 ppm is generated. For example, cocaine has a chemicalformula of C17H21NO4, or an exact protonated ion mass(M+H)+ of 304.1543. The EIC for cocaine in Figure 21 is cen-tered about the ion mass of 304.1543, demonstrating excel-lent mass accuracy because the S/N is good.
Library Search Report - AutoMS(n)
Analysis Name: DOA_METHCASE002.DInstrument: Agilent 6340 Ion Trap Print Date: 11/16/2007 10:15:29 AM
Figure 19. Library report identifying methadone and sertraline in the postmortem methadone case sample with the known concentration for methadone asanalyzed by the QQQ.
22
Figure 20a. Library report showing spectral matches for methadone at both the MS/MS and MS3 levels in the postmortemmethadone case. Library spectra include structures.
Methadone
MS2
MS3
23
Figure 20b. Library report showing spectral matches for sertraline at both the MS/MS and MS3 levels in the postmortemmethadone case. Library spectra include structures.
Sertraline
MS2
MS3
24
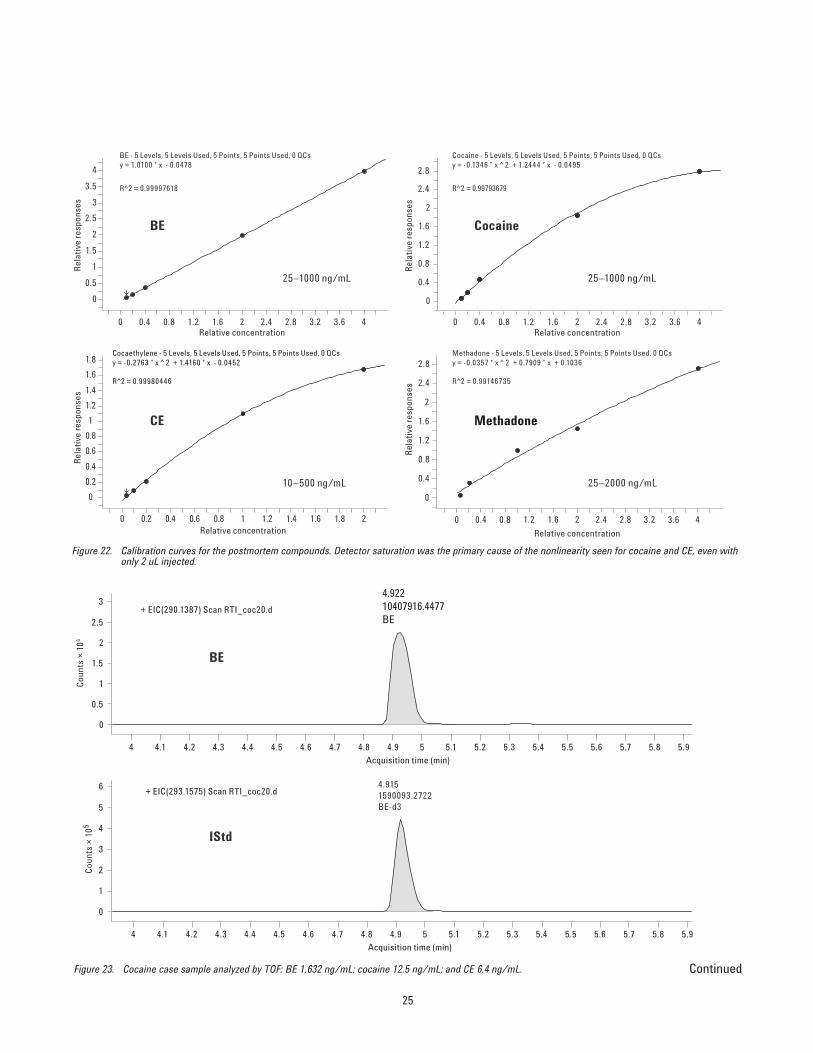
Calibration curves were generated over the levels given inTable 1 and displayed in Figure 22. Detector saturation wasresponsible for the nonlinearity seen for cocaine and CE, evenwith only 2 µL injected as opposed to the 5 µL used with theprevious instruments. The lowest level calibrator results ofFigure 21 demonstrate how sensitive the TOF instrument is. Itcan be seen in Figure 22 for even cocaine and CE that thelower level range is linear. The curves are still adequate forquantification, but dilutions are recommended for furtherwork.
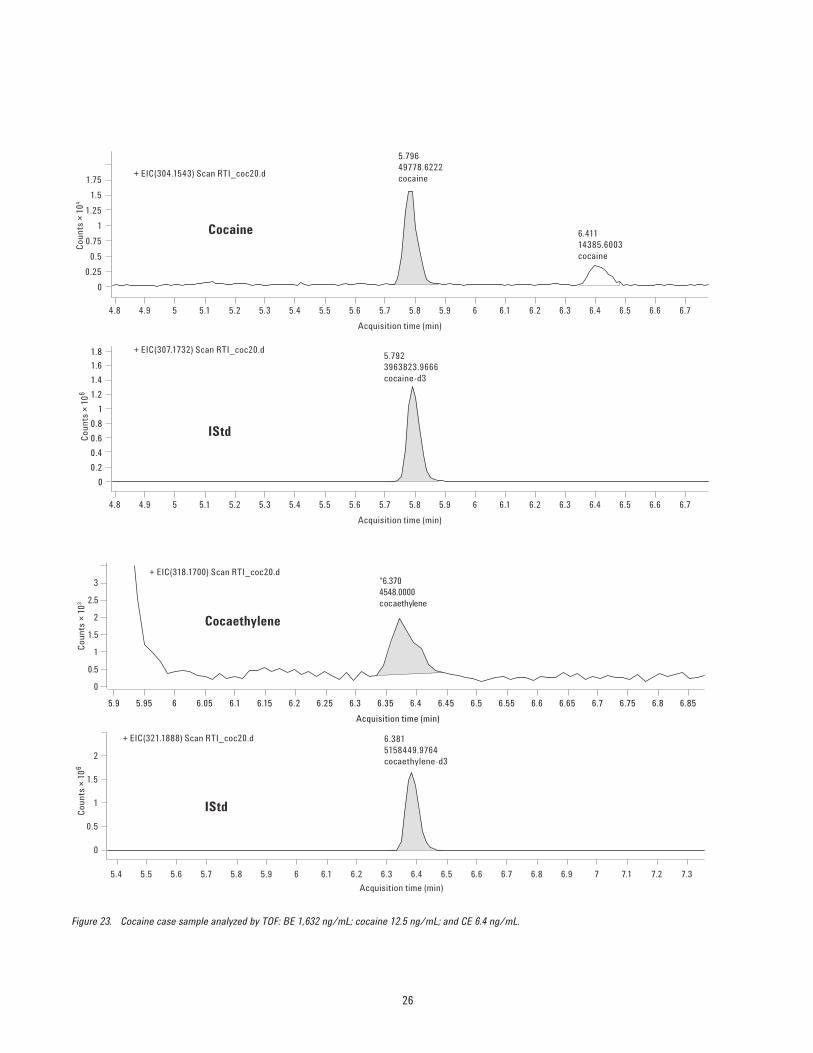
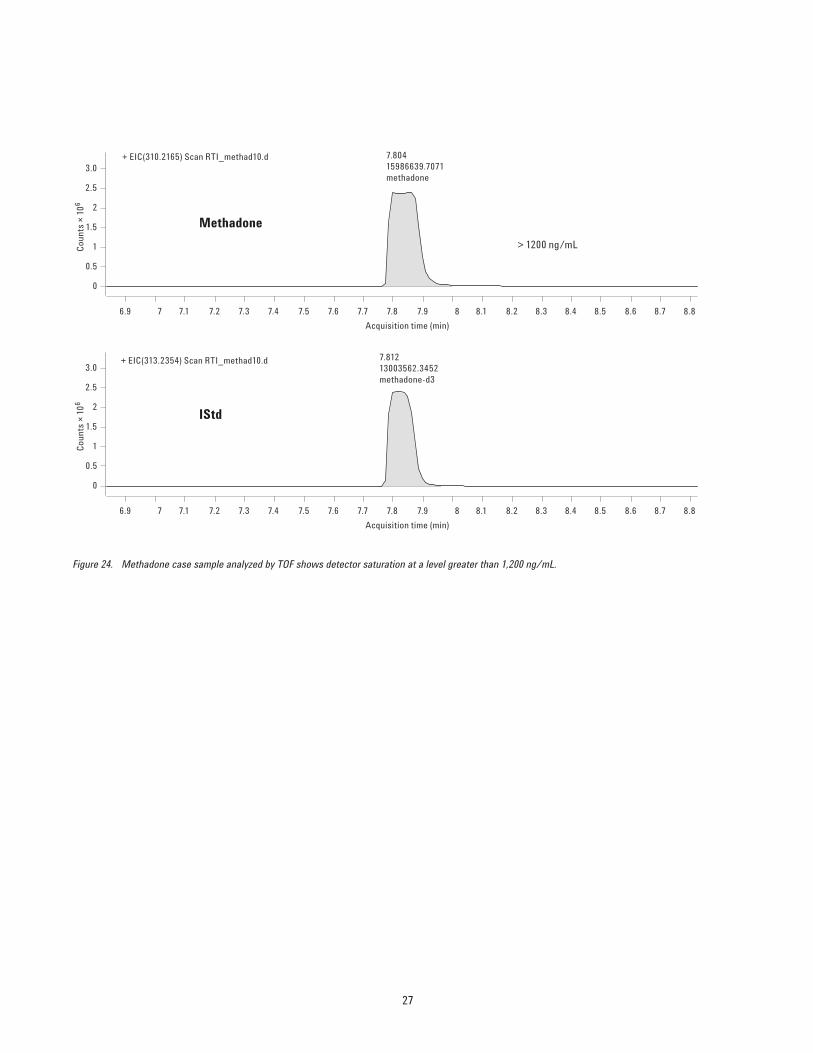
Subsequent quantification results of the cocaine case sample are shown in Figure 23 with BE = 1,632 ng/mL,cocaine = 12.5 ng/mL, and CE = 6.4 ng/mL. Methadone wasobviously saturated at a level of at least 1,200 ng/mL asshown in Figure 24.
Postmortem Blood
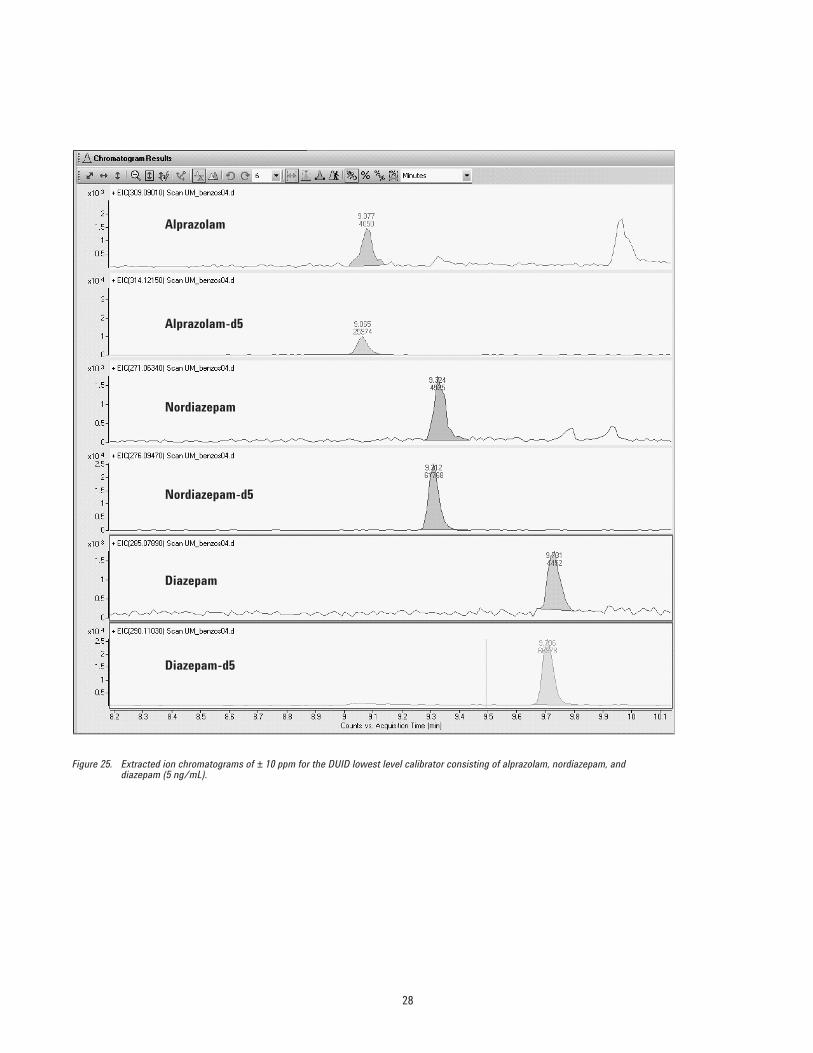
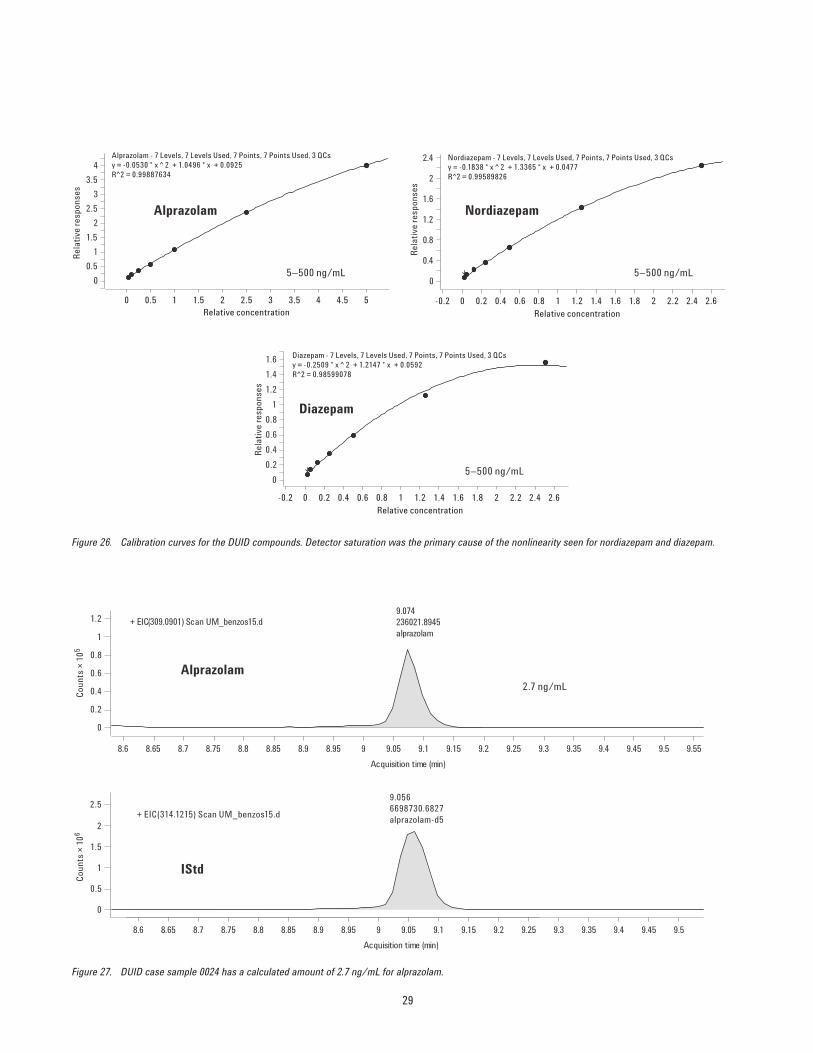
For the DUID analysis, EICs for the lowest level calibrator at 5 ng/mL are shown in Figure 25. At this level all three com-pounds appeared to be close to their limits of quantification.The calibration curves are represented in Figure 26, extendingover the ranges given in Table 1. Nonlinearity due to detectorsaturation is shown for nordiazepam and diazepam. The injec-tion volumes were 5 µL and should be reduced, or at leastdiluted, in future work. As mentioned before, the sensitivity ofthe TOF was underestimated when choosing reconstitutionand injection volumes.
The subsequent quantification results of the DUID case sam-ples are tabulated in Table 7, with the chromatographicresults for DUID case sample 0024 shown in Figure 27. For allcase samples the presence of nordiazepam and diazepamcould not be determined in any of the case samples. By con-trast, the SQ could at least detect their presence, even if itwas not be able to quantify them.
Figure 21. Extracted ion chromatograms of ± 10 ppm for the postmortem lowest level calibrator consisting of BE, cocaine, and methadone (25 ng/mL),and CE (10 ng/mL).
Figure 22. Calibration curves for the postmortem compounds. Detector saturation was the primary cause of the nonlinearity seen for cocaine and CE, even withonly 2 uL injected.
Figure 27. DUID case sample 0024 has a calculated amount of 2.7 ng/mL for alprazolam.
30
Quadrupole Time-of-Flight Mass Spectrometer
Postmortem Blood
The Agilent QTOF instrument in MS mode behaved exactlythe same as the TOF. To avoid the nonlinearity effects seen inthe TOF work, only 0.1 µL sample volumes were injected afterobserving ESI or detector saturation on the SQ and TOFinstruments. Quantification was performed on the QTOF in
MS mode only. Quantification may also be carried out inMS/MS mode although it is typically no more sensitivebecause the resolution in MS mode typically removes theeffects of coeluting interferences, short of ion suppression.
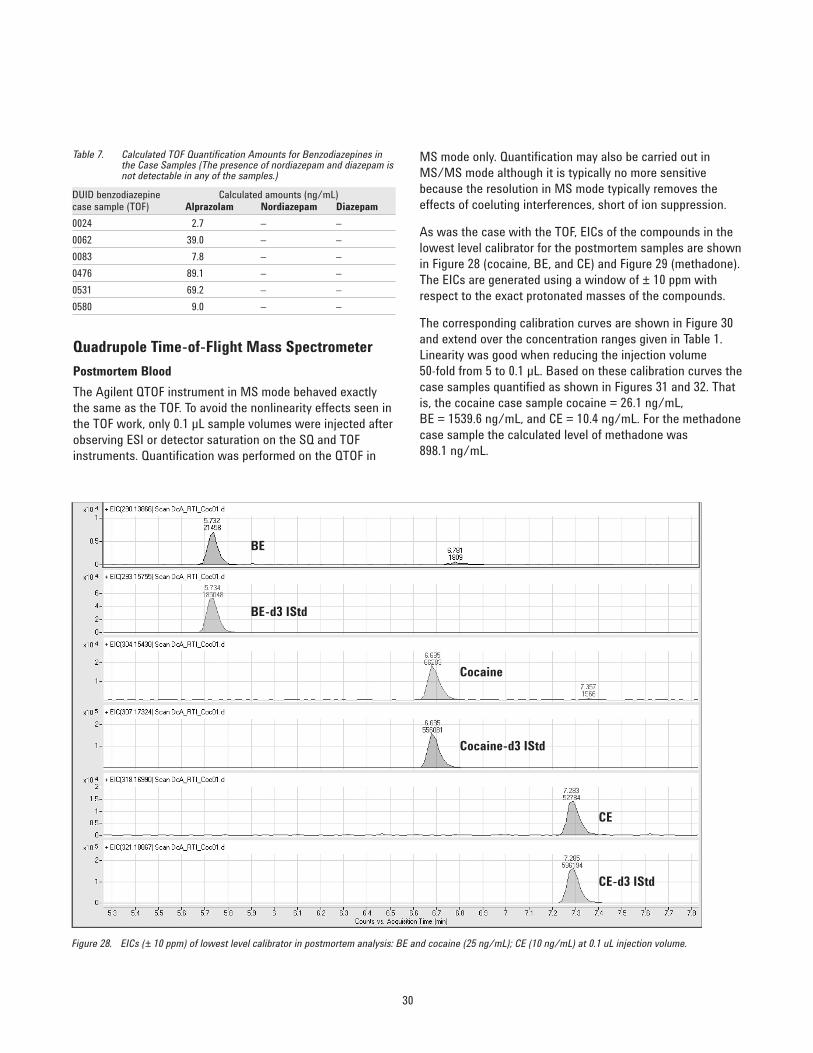
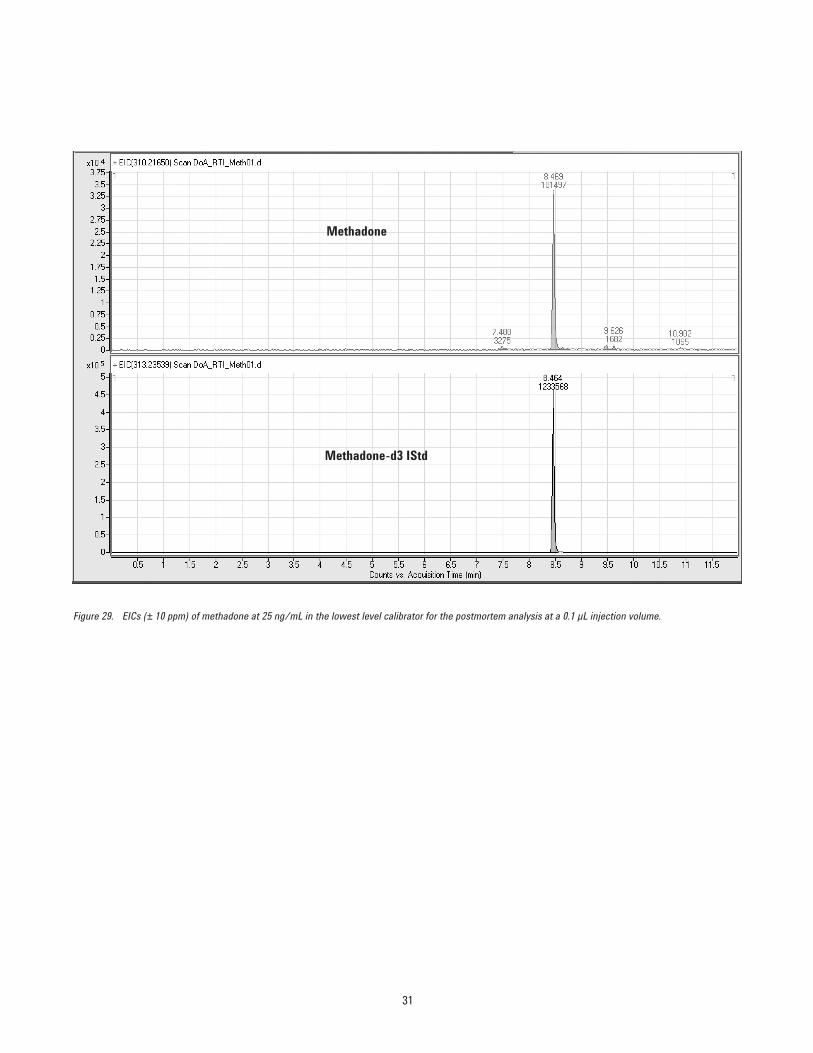
As was the case with the TOF, EICs of the compounds in thelowest level calibrator for the postmortem samples are shownin Figure 28 (cocaine, BE, and CE) and Figure 29 (methadone).The EICs are generated using a window of ± 10 ppm withrespect to the exact protonated masses of the compounds.
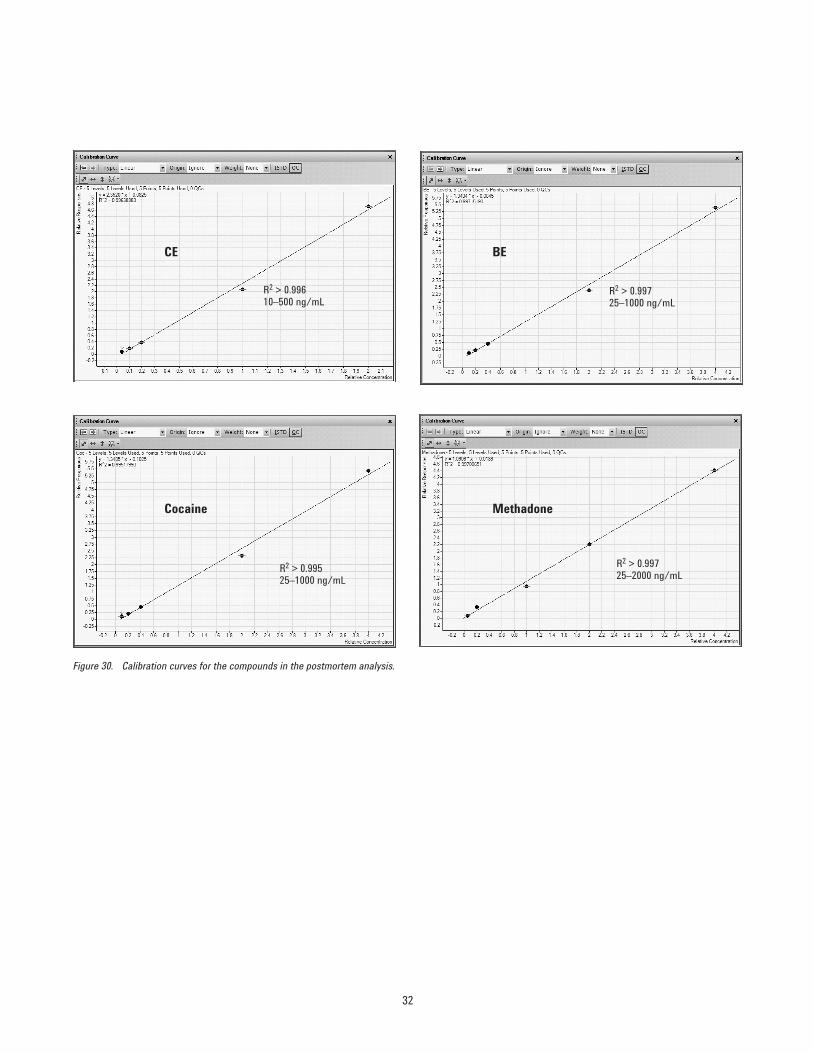
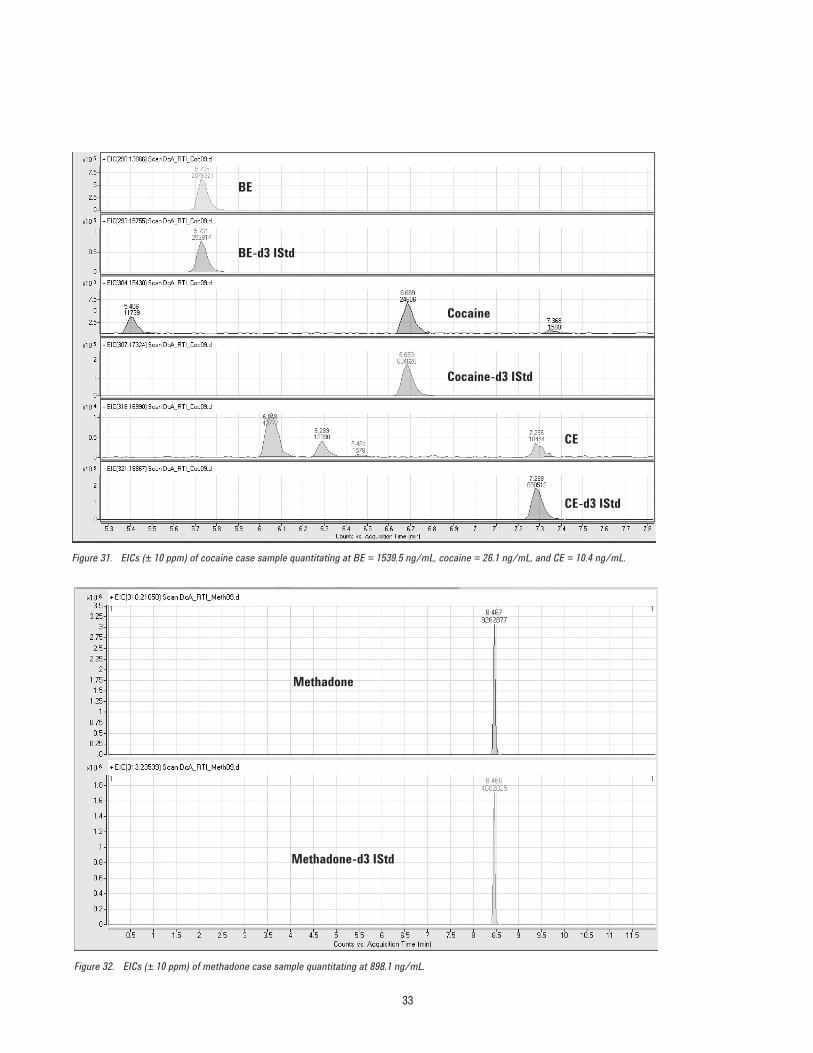
The corresponding calibration curves are shown in Figure 30and extend over the concentration ranges given in Table 1.Linearity was good when reducing the injection volume 50-fold from 5 to 0.1 µL. Based on these calibration curves thecase samples quantified as shown in Figures 31 and 32. Thatis, the cocaine case sample cocaine = 26.1 ng/mL, BE = 1539.6 ng/mL, and CE = 10.4 ng/mL. For the methadonecase sample the calculated level of methadone was 898.1 ng/mL.
Table 7. Calculated TOF Quantification Amounts for Benzodiazepines inthe Case Samples (The presence of nordiazepam and diazepam isnot detectable in any of the samples.)
Figure 28. EICs (± 10 ppm) of lowest level calibrator in postmortem analysis: BE and cocaine (25 ng/mL); CE (10 ng/mL) at 0.1 uL injection volume.
BE
BE-d3 IStd
CE-d3 IStd
CE
Cocaine-d3 IStd
Cocaine
31
Figure 29. EICs (± 10 ppm) of methadone at 25 ng/mL in the lowest level calibrator for the postmortem analysis at a 0.1 µL injection volume.
Methadone
Methadone-d3 IStd
32
Figure 30. Calibration curves for the compounds in the postmortem analysis.
Methadone
BECE
Cocaine
R2 > 0.99610–500 ng/mL
R2 > 0.99725–1000 ng/mL
R2 > 0.99525–1000 ng/mL
R2 > 0.99725–2000 ng/mL
33
Figure 31. EICs (± 10 ppm) of cocaine case sample quantitating at BE = 1539.5 ng/mL, cocaine = 26.1 ng/mL, and CE = 10.4 ng/mL.
Figure 32. EICs (± 10 ppm) of methadone case sample quantitating at 898.1 ng/mL.
BE
BE-d3 IStd
CE-d3 IStd
CE
Cocaine-d3 IStd
Cocaine
Methadone
Methadone-d3 IStd
34
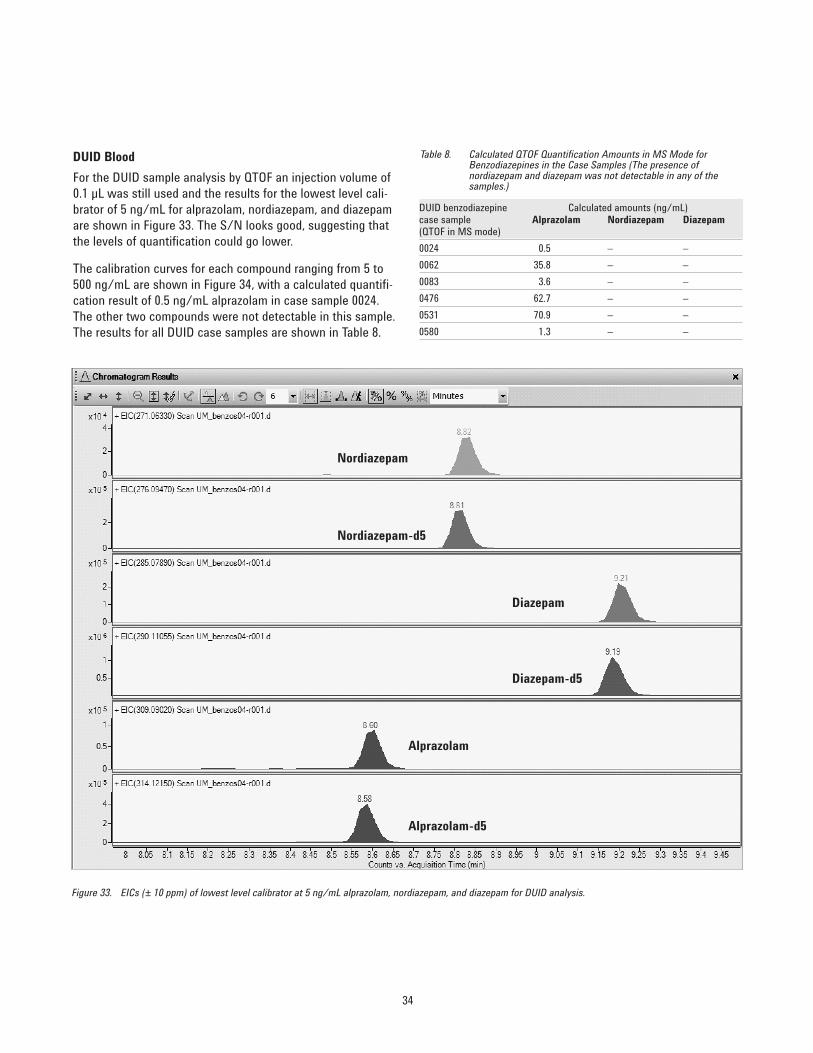
DUID Blood
For the DUID sample analysis by QTOF an injection volume of0.1 µL was still used and the results for the lowest level cali-brator of 5 ng/mL for alprazolam, nordiazepam, and diazepamare shown in Figure 33. The S/N looks good, suggesting thatthe levels of quantification could go lower.
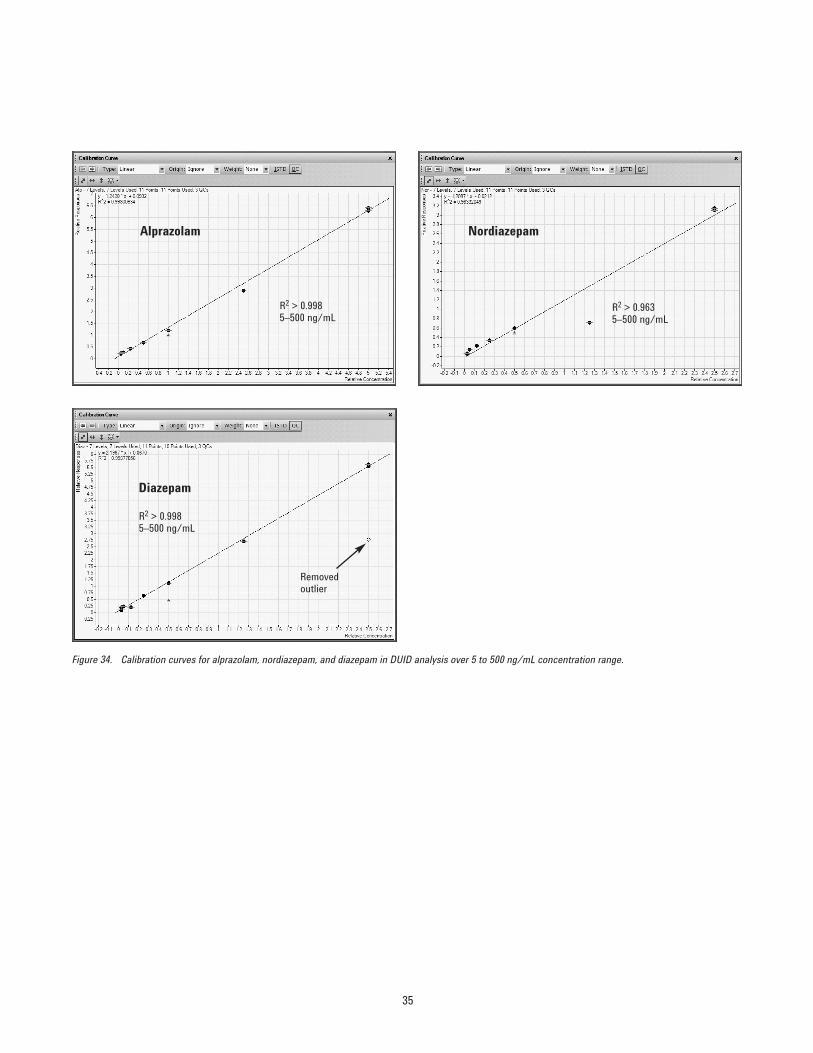
The calibration curves for each compound ranging from 5 to500 ng/mL are shown in Figure 34, with a calculated quantifi-cation result of 0.5 ng/mL alprazolam in case sample 0024.The other two compounds were not detectable in this sample.The results for all DUID case samples are shown in Table 8.
Table 8. Calculated QTOF Quantification Amounts in MS Mode forBenzodiazepines in the Case Samples (The presence of nordiazepam and diazepam was not detectable in any of the samples.)
DUID benzodiazepine Calculated amounts (ng/mL)case sample Alprazolam Nordiazepam Diazepam(QTOF in MS mode)
0024 0.5 – –
0062 35.8 – –
0083 3.6 – –
0476 62.7 – –
0531 70.9 – –
0580 1.3 – –
Figure 33. EICs (± 10 ppm) of lowest level calibrator at 5 ng/mL alprazolam, nordiazepam, and diazepam for DUID analysis.
Alprazolam
Alprazolam-d5
Diazepam-d5
Diazepam
Nordiazepam-d5
Nordiazepam
35
Figure 34. Calibration curves for alprazolam, nordiazepam, and diazepam in DUID analysis over 5 to 500 ng/mL concentration range.
NordiazepamAlprazolam
Diazepam
R2 > 0.9985–500 ng/mL
R2 > 0.9635–500 ng/mL
R2 > 0.9985–500 ng/mL
Removedoutlier
36
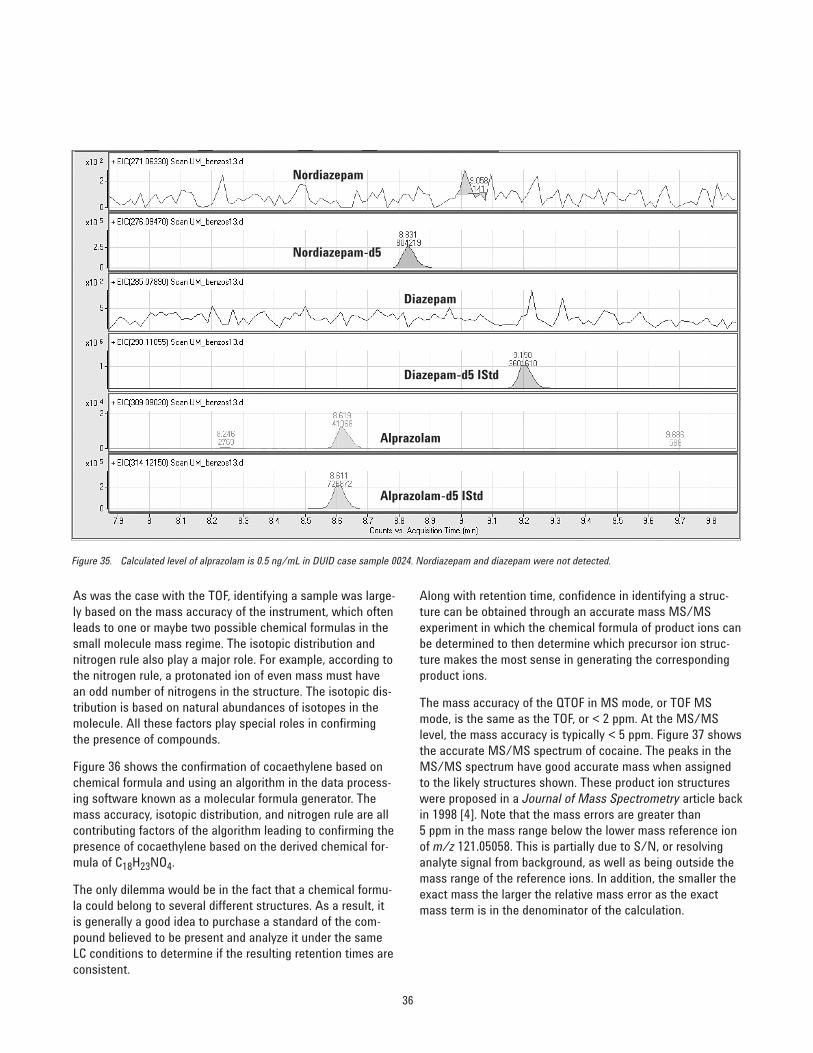
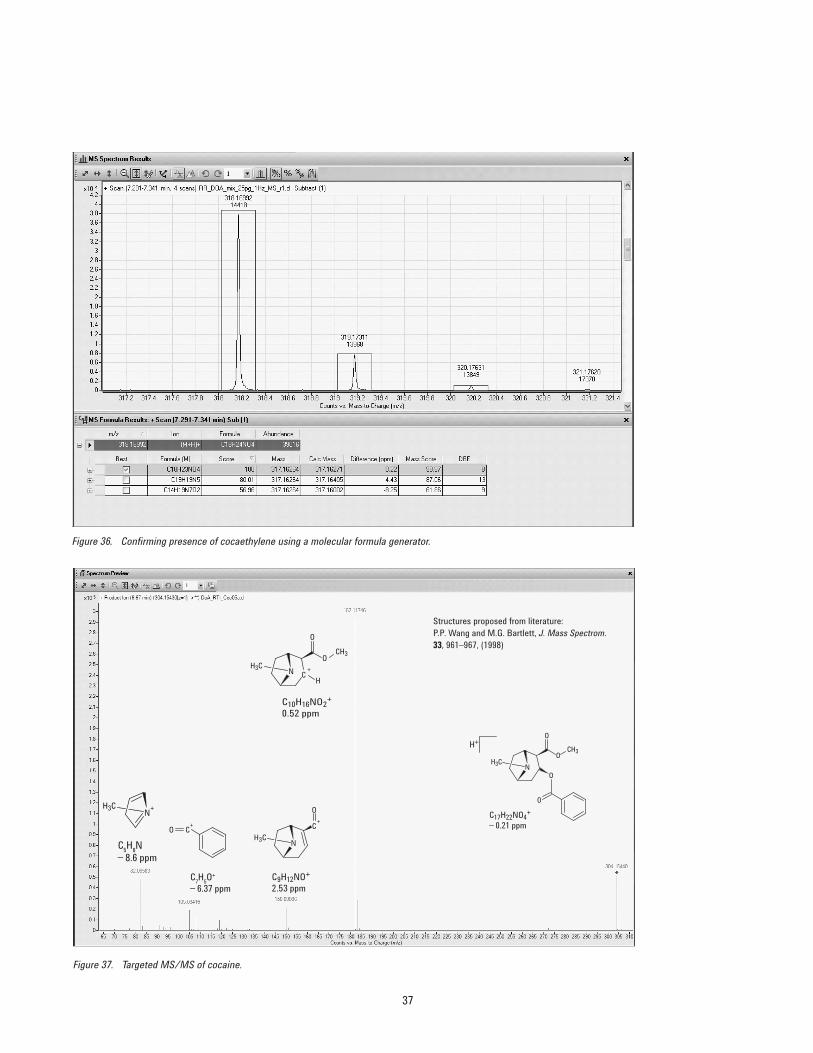
As was the case with the TOF, identifying a sample was large-ly based on the mass accuracy of the instrument, which oftenleads to one or maybe two possible chemical formulas in thesmall molecule mass regime. The isotopic distribution andnitrogen rule also play a major role. For example, according tothe nitrogen rule, a protonated ion of even mass must havean odd number of nitrogens in the structure. The isotopic dis-tribution is based on natural abundances of isotopes in themolecule. All these factors play special roles in confirmingthe presence of compounds.
Figure 36 shows the confirmation of cocaethylene based onchemical formula and using an algorithm in the data process-ing software known as a molecular formula generator. Themass accuracy, isotopic distribution, and nitrogen rule are allcontributing factors of the algorithm leading to confirming thepresence of cocaethylene based on the derived chemical for-mula of C18H23NO4.
The only dilemma would be in the fact that a chemical formu-la could belong to several different structures. As a result, itis generally a good idea to purchase a standard of the com-pound believed to be present and analyze it under the sameLC conditions to determine if the resulting retention times areconsistent.
Along with retention time, confidence in identifying a struc-ture can be obtained through an accurate mass MS/MSexperiment in which the chemical formula of product ions canbe determined to then determine which precursor ion struc-ture makes the most sense in generating the correspondingproduct ions.
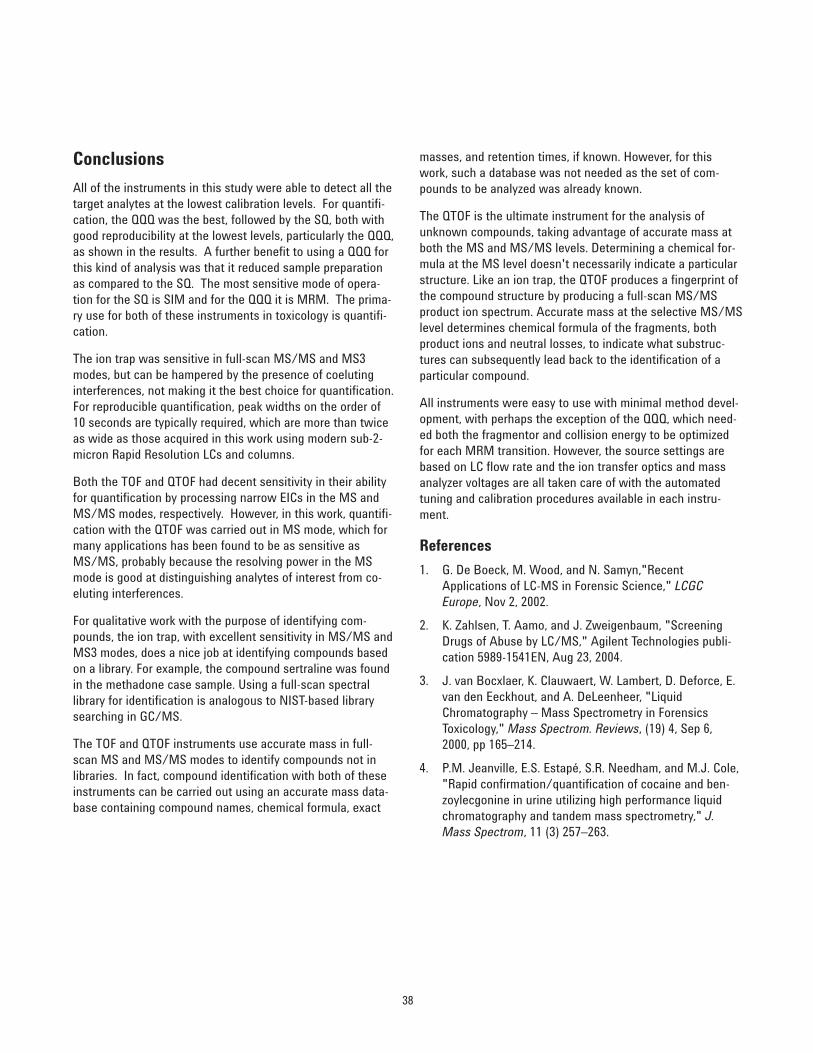
The mass accuracy of the QTOF in MS mode, or TOF MSmode, is the same as the TOF, or < 2 ppm. At the MS/MSlevel, the mass accuracy is typically < 5 ppm. Figure 37 showsthe accurate MS/MS spectrum of cocaine. The peaks in theMS/MS spectrum have good accurate mass when assignedto the likely structures shown. These product ion structureswere proposed in a Journal of Mass Spectrometry article backin 1998 [4]. Note that the mass errors are greater than 5 ppm in the mass range below the lower mass reference ionof m/z 121.05058. This is partially due to S/N, or resolvinganalyte signal from background, as well as being outside themass range of the reference ions. In addition, the smaller theexact mass the larger the relative mass error as the exactmass term is in the denominator of the calculation.
Figure 35. Calculated level of alprazolam is 0.5 ng/mL in DUID case sample 0024. Nordiazepam and diazepam were not detected.
Alprazolam
Alprazolam-d5 IStd
Diazepam-d5 IStd
Diazepam
Nordiazepam-d5
Nordiazepam
37
Figure 36. Confirming presence of cocaethylene using a molecular formula generator.
Figure 37. Targeted MS/MS of cocaine.
C17H22NO4+
_ 0.21 ppm
O
O
NO
O
H+CH3
H3C
Structures proposed from literature:P.P. Wang and M.G. Bartlett, J. Mass Spectrom.33, 961–967, (1998)
O
O
CH3
C10H16NO2+
0.52 ppm
C+N
H
H3C
C5H
8N
_ 8.6 ppm
N+H3C
C9H12NO+
2.53 ppm
C+
O
NH3C
C7H
5O+
_ 6.37 ppm
C+
O
38
Conclusions
All of the instruments in this study were able to detect all thetarget analytes at the lowest calibration levels. For quantifi-cation, the QQQ was the best, followed by the SQ, both withgood reproducibility at the lowest levels, particularly the QQQ,as shown in the results. A further benefit to using a QQQ forthis kind of analysis was that it reduced sample preparationas compared to the SQ. The most sensitive mode of opera-tion for the SQ is SIM and for the QQQ it is MRM. The prima-ry use for both of these instruments in toxicology is quantifi-cation.
The ion trap was sensitive in full-scan MS/MS and MS3modes, but can be hampered by the presence of coelutinginterferences, not making it the best choice for quantification.For reproducible quantification, peak widths on the order of10 seconds are typically required, which are more than twiceas wide as those acquired in this work using modern sub-2-micron Rapid Resolution LCs and columns.
Both the TOF and QTOF had decent sensitivity in their abilityfor quantification by processing narrow EICs in the MS andMS/MS modes, respectively. However, in this work, quantifi-cation with the QTOF was carried out in MS mode, which formany applications has been found to be as sensitive asMS/MS, probably because the resolving power in the MSmode is good at distinguishing analytes of interest from co-eluting interferences.
For qualitative work with the purpose of identifying com-pounds, the ion trap, with excellent sensitivity in MS/MS andMS3 modes, does a nice job at identifying compounds basedon a library. For example, the compound sertraline was foundin the methadone case sample. Using a full-scan spectrallibrary for identification is analogous to NIST-based librarysearching in GC/MS.
The TOF and QTOF instruments use accurate mass in full-scan MS and MS/MS modes to identify compounds not inlibraries. In fact, compound identification with both of theseinstruments can be carried out using an accurate mass data-base containing compound names, chemical formula, exact
masses, and retention times, if known. However, for thiswork, such a database was not needed as the set of com-pounds to be analyzed was already known.
The QTOF is the ultimate instrument for the analysis ofunknown compounds, taking advantage of accurate mass atboth the MS and MS/MS levels. Determining a chemical for-mula at the MS level doesn't necessarily indicate a particularstructure. Like an ion trap, the QTOF produces a fingerprint ofthe compound structure by producing a full-scan MS/MSproduct ion spectrum. Accurate mass at the selective MS/MSlevel determines chemical formula of the fragments, bothproduct ions and neutral losses, to indicate what substruc-tures can subsequently lead back to the identification of aparticular compound.
All instruments were easy to use with minimal method devel-opment, with perhaps the exception of the QQQ, which need-ed both the fragmentor and collision energy to be optimizedfor each MRM transition. However, the source settings arebased on LC flow rate and the ion transfer optics and massanalyzer voltages are all taken care of with the automatedtuning and calibration procedures available in each instru-ment.
References
1. G. De Boeck, M. Wood, and N. Samyn,"RecentApplications of LC-MS in Forensic Science," LCGCEurope, Nov 2, 2002.
2. K. Zahlsen, T. Aamo, and J. Zweigenbaum, "ScreeningDrugs of Abuse by LC/MS," Agilent Technologies publi-cation 5989-1541EN, Aug 23, 2004.
3. J. van Bocxlaer, K. Clauwaert, W. Lambert, D. Deforce, E.van den Eeckhout, and A. DeLeenheer, "LiquidChromatography – Mass Spectrometry in ForensicsToxicology," Mass Spectrom. Reviews, (19) 4, Sep 6,2000, pp 165–214.
4. P.M. Jeanville, E.S. Estapé, S.R. Needham, and M.J. Cole,"Rapid confirmation/quantification of cocaine and ben-zoylecgonine in urine utilizing high performance liquidchromatography and tandem mass spectrometry," J.Mass Spectrom, 11 (3) 257–263.
39
Acknowledgments
The authors thank Tom Gluodenis of Agilent Technologies forhis creation of and influence in this project.
For More Information
For more information on our products and services, visit ourWeb site at www.agilent.com/chem.
For more details concerning this note, please contact MichaelZumwalt at Agilent Technologies, Inc.
www.agilent.com/chem
Agilent shall not be liable for errors contained herein orfor incidental or consequential damages in connectionwith the furnishing, performance, or use of this material.
Information, descriptions, and specifications in this publication are subject to change without notice.