A computerized system for morphometric analysis of digitized images of histologically prepared arterial cross sections
Alan Harrison, Henry F. Mizgala, Patricia Allard, Linda Hughes and Branko Palcic
Cancer Imaging, B.C. Cancer Agency and Departments of Pathology and Medicine, the University of British Columbia, Vancouver, British Columbia, Canada
A method is described for computerized, operator-assisted, morphometric measurement of histologically prepared arterial cross sections. The system is composed of"an image cytometer equipped with a one power lens and a digitizing camera interfaced with an imaging board residing in a PC computer. Algorithms were developed for automated segmentation of the areas of interest. The method is rapid, objective, accurate and requires minimum operator intervention. It gives reliable and reproducible results in the measurement of all elements of the cross section including circumference, area of the media, circumference of the internal elastic lamina, area of the lumen and percent occlusion of the lumen by the intimal thickening. While manual measurements using computerized planimetric methods give similar results, this method is an order of magnitude faster (1-2 min vs. 10-20 rain per cross section) thus facilitating the study of large numbers of specimens. A blinded re-measurement of 284 sections of artery for reproducibility yielded r values of 0.86-0.97.
Several morphometric systems are currently available for measuring component parts of mi- croscopic tissue preparations. Most are based on manually operated, computerized plani'metry sys- tems. These have proven to be accurate and useful. In the study of coronary artery pathology, visual estimation of the percent luminal obstruc- tion by intimal thickening into arbitrary and semi-quantitative degrees of obstructive narrow- ing has been used and validated by morphometric methods [1]. Manually operated, computerized morphometric methods have also been used to
Correspondence B. Palcic, Cancer Imaging, Medical Physics Division, B.C. Cancer Agency, 601 West 10th Avenue, Van- couver, B.C. V5Z 1L3 Canada. Tel.: (604) 877-6010.
measure and quantitate the components of inti- mal plaque [2,3]. While manual systems are suit- able for the study of relatively small numbers of arterial cross sections, they are time-consuming and operator intensive when used to measure serially sectioned arteries in a large number of subjects. More sophisticated systems which em- ploy various forms of computerized imaging are either unavailable or extremely expensive thus out of reach of the smaller laboratory. To our knowledge, no software is available to assist the segmentation of complex structures such as those presented in arterial cross sections.
For the past 3 years, a study has been under way to evaluate arterial intimal thickening and the extent of plaque formation in the coronary tree of subjects under the age of 40 years who had died suddenly, unexpectedly, usually vio- lently, and were referred to the Coroner's service
290
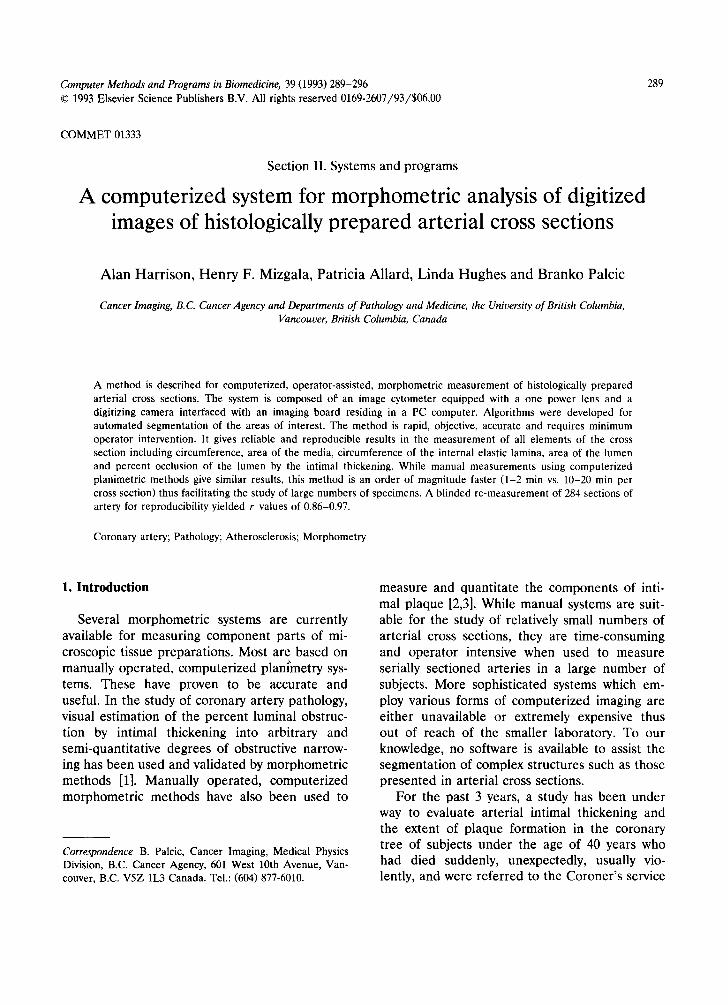
Fig. 1. (a) Colour photograph of cross section of an epicardial coronary artery, stained with a modified combination Verhoeff's elastic and Masson's trichrome stain, clearly demonstrating (1) the internal elastic lamina, (2) the media, (3) the intimal thickening and (4) the adventitia. (b) Digital image of (a) using a red filter of 55 +_ 10 nm. The internal elastic lamina and media stain the
darkest, next is intimal thickening and adventitia, while pixels belonging to lumen are the brightest and of uniform intensity.
for necropsy [4]. Our methodology for this study involves the serial sectioning of consecutive 5-mm segments of the Left Main, Left Anterior de- scending, Right and Circumflex coronary arteries through their entire epicardial lengths. Although the visual method of estimating coronary intimal thickening has been used in many studies, accu- rate measurement of this parameter and of co-in- cident changes in the relative dimensions and relationships of other structures of the cross sec- tioned artery cannot be evaluated.
With the accumulation of over 500 cases and each case generating an average of 48 cross sec- tions, there was an urgent need to find a rapid, accurate, operator assisted computerized mor- phometric system to process the large number of sections. It is the purpose of this communication to describe such a system which is capable of accurately measuring the circumference and area of the various components of each arterial cross section. This system also has the capability of storing all these data for future analysis. We therefore describe a method which employs an Image Cytometry Microscope (ICM) device [5], developed for quantitative measurements of
stained cells and tissues [6]. The ICM is equipped with a one power lens, digitizing camera, com- puter and imaging board. Algorithms were devel- oped and programmed to permit segmentation of areas of interest and their measurement in a semi-automated manner, i.e. with minimal inter- vention by the operator. This system has been extensively tested and is ideally suited for the measurement and analysis of components of arte- rial cross sections.
2. Materials and Methods
2.1. Arterial cross sections
At necropsy, the four major epicardial coro- nary arteries are identified: the Left Main, Left Anterior Descending, Right and Circumflex. Each artery is cut transversely into 5-ram sequential segments from their origin and through their entire epicardial lengths The segments are la- belled as originating from the proximal, middle and distal portions of each of the three arteries. They are processed in the usual manner and
291
~ i ¸
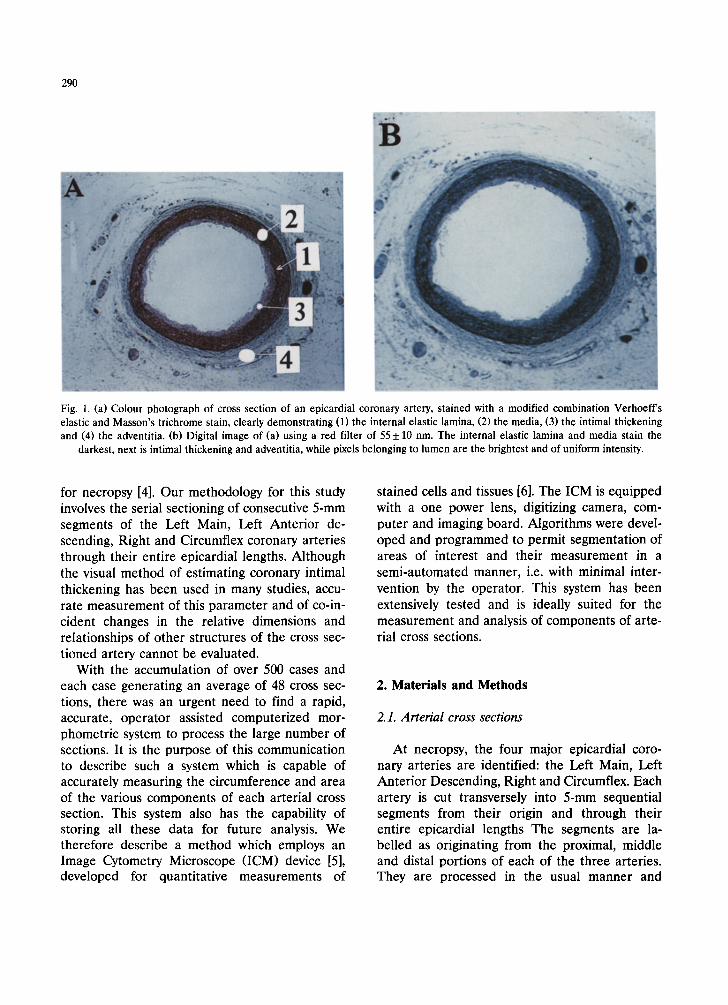
Fig. 2. (a) Using the manual procedure (mouse) a threshold is found such that most pixels belonging to internal elastic lamina and media are painted red. (b) An algorithm was developed (Fig. 3) outlining a smooth boundary of the internal elastic lamina in a fully automated way. Also all pixels belonging to the intimal thickening as well as the lumen are determined (Fig. 4). All pixels belonging to the internal elastic lamina and intimal thickening, and lumen are labelled separately and their respective numbers and positions are stored in the computer memory. (c) The algorithm then finds the boundary between the outer border of the media and the adventitia (similar procedure to Fig. 3) and the pixels belonging to the media are accounted for and stored into the computer memory. (d) A density histogram of pixels in (b) (Fig. 4) is used to find a position between pixels belonging to the lumen and intimal thickening. Each set of pixels is labelled separately and stored accordingly. Finally, pixels belonging to the media are painted red, pixels belonging to the intimal thickening are painted light blue and pixels belonging to the lumen are painted
dark blue.
292
histologic cross sections are cut from each block and mounted on slides. Each histologic section is stained using the modified Verhoeff's elastic and a modified Masson's trichrome stain [7] which clearly identifies the internal elastic lamina, me- dia, intima and intimal thickening (Fig. la).
2.2. Quantitative image microscope
The system is composed as follows. An Olym- pus BH-2 microscope is equipped with a one power lens (Plan 1/0.03, Nikon). A digital cam- era [8,9], Microlmager 1400 (Xillix Technologies Corp., Vancouver, B.C., Canada) is mounted into
the primary plane of the objective lens. The cam- era employs a scientific CCD detector with 1.4 million square pixels of 6.8 /xm per side and 100% fill factor [10]. The signals are directly digitized (within the camera) and the digital sig- nals are transferred into the computer memory. The computer is equipped with an imaging board with a real time processor (Matrox RTP 1280 series, Montreal, Que., Canada). A stabilized light source is used to illuminate the slides and images are acquired using a red filter at 55 + 10 nm. At this setting, using the above staining technique, the digital image can be divided into several areas of interest by pixel intensity (Fig. lb).
Fig, 3. Smoothing algorithm. Boundary pixels of the hand selected threshold are dilated and eroded two times by drawing a thick envelope of 30-pixels around each boundary pixel. This creates a new outer boundary and from each pixel of the new outer boundary, a new 30 pixel envelope is drawn whose inner boundary pixels represent the smoothed inner elastic lamina boundary. A similar algorithm is used to define the boundary between adventitia and media once rough adventitia/media boundary is found
(see also the text).
All programmes were written in C-language and compiled with a C-compiler.
2.3. Algorithm det~elopment
2.3.1. Segmentation The first and most important task is to prop-
erly segment the image. While this generally can be done by an operator using a cursor (if proper programmes are available), such a procedure in- volves subjective judgments and a significant amount of time. To accelerate this process and make it operator independent, the following algo- rithm was developed.
First the operator uses a global threshold func- tion which outlines all pixels in red that are below a selected threshold. The threshold can be moved by a mouse (or the keyboard) up or down the grey scale which is divided into 256 levels (0-255). As the pixels in the internal elastic lamina, media and the outer border of the media are the darkest using the above stains (Fig. lb), a threshold can be found where most of the pixels belonging to the internal elastic lamina and media (as judged by the operator) are below the selected threshold, i.e. they appear red on the monitor (Fig. 2a). It is most important to have the media coloured red as close as possible to the internal elastic lamina so as not to include elements of the intimal thickening.
At this stage, the operator may make neces- sary corrections manually with the mouse. Using the microscopic image as a reference (Fig. la), missing areas of the media can be filled in and painted red or extraneous material outside the media that has been inadvertently painted red can be deleted. This becomes necessary when during histologic preparation, parts of the media break off or when the internal elastic lamina is interrupted and the pixels outside the intended structure are painted red on the monitor. Thus, the missing parts of the internal elastic lamina or other structures can be traced in. In rare cases when histologic staining has been inadequate to clearly outline the internal elastic lamina, this structure and other components of the artery can be traced manually. These interactions consume very little time, on the average only a few sec-
293
# o f Pixels
Pixels belonging ~ A to Lumen / /
i
0 255
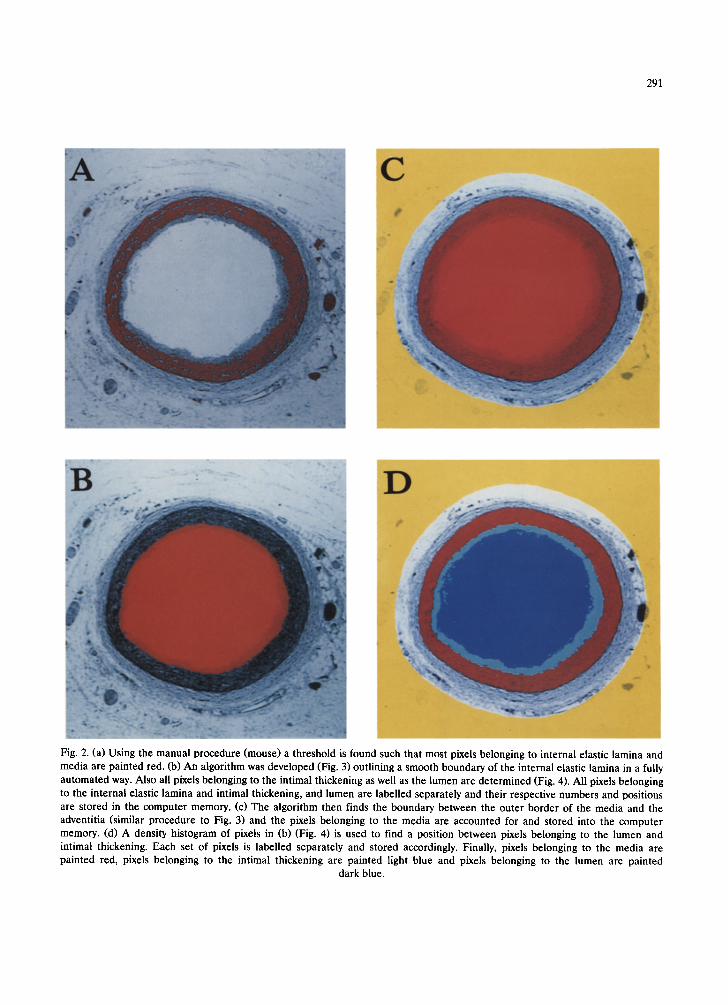
RELATIVE PIXEL INTENSITY Fig. 4. Histogram of pixels belonging to the lumen and the intimal thickening. The brighter pixels (large peak to the right) belong to free lumen; the darker pixels belong to the intimal thickening. An algorithm was developed which finds the first minimum to the left of the large peak. This creates a threshold separating pixels belonging to the intimal thickening
and lumen.
onds; in any event, they become necessary in only about 15% of all cases.
Thereafter the procedure is fully automated. The inner pixels form a boundary between the internal elastic lamina and the intimal thickening. This boundary is usually rough and irregular and a form of di la t ion/erosion algorithm was devel- oped to smooth this boundary. First, from each rough boundary point a circle 30 pixels thick is drawn creating an outer boundary approximately 30 pixels from the original boundary. From each new boundary pixel a new circle of 30 pixels is drawn which creates a relatively smooth bound- ary at the internal elastic lamina position (Fig. 3).
The smooth internal elastic boundary encom- passes a space occupied by all pixels belonging to the intima, intimal thickening and lumen (Fig. 2b). All such defined pixels are then used to create a histogram of pixel intensity which is bimodal whenever intimal thickening is present. The pixels belonging to the intimal thickening are much darker than those belonging to the lumen (Figs. lb, 2b and 4). The trough in the histogram is found by an algorithm looking for the first minimum after the peak of light pixels, dividing all pixels into two groups such that they belong to either the (i) intimal thickening or (ii) lumen. All pixels are then labelled accordingly. From time to time some debris can be found in the lumen
294
which is not part of the intimal thickening. This can be removed manually by the operator using the mouse as described above.
At the end of this process the internal elastic lamina boundary is dilated outwards by 60 pixels. At this magnification, the new thick envelope encompasses all pixels of the media as well as much of the adventitia and/or the surrounding tissues. All pixels within this area are again thresholded using the original, manually selected threshold. This defines an approximate boundary at the external border between the media and adventitia. A simple labelling routine eliminates any holes inside the new envelope. The outer boundary of the media is then also smoothed by an identical process as that described for smooth- ing of the internal elastic lamina boundary (Fig. 2c). The above process yields the following data:
(1) the number of pixels belonging to the internal elastic lamina;
(2) the number of pixels belonging to the media; (3) the number of pixels belonging to the intimal
thickening.
Using this approach, all of the above data can be obtained from any whole arterial section whether it is round, eccentric, partly indented or partly flattened as often happens during histolog- ical preparation of the sections. Assuming that
the number of pixels in (1) to (3) above do not change, irrespective of histological preparation procedures, the following is then calculated:
(1) the inner radius of an ideal circle comprised of the pixels of the internal elastic lamina;
(2) the outer radius (arterial circumference in mm) of an ideal circle comprised of the pixels belonging to the boundary between media and adventitia;
(3) total arterial area representing the area within the arterial circumference of (2) above (in mm2);
(4) area of the media (in mm2); (5) the lumen of the ideal circle if no intimal
thickening is present; (6) % luminal obstruction representing the per-
centage narrowing by the intimal thickening of the true lumen bounded by the internal elastic lamina.
3. Reproducibility
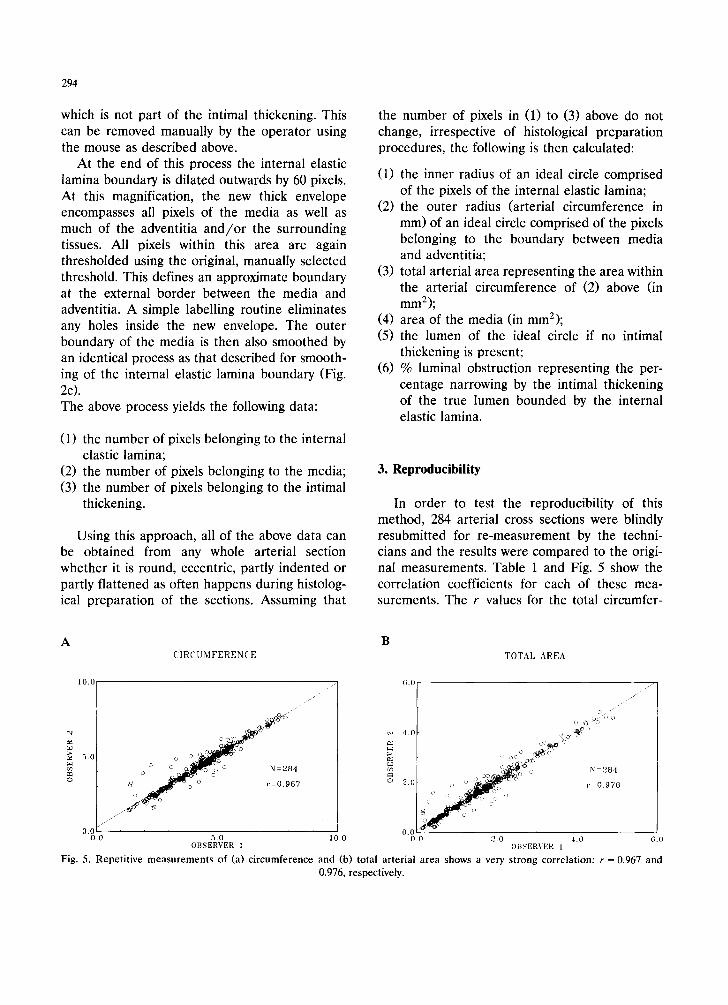
In order to test the reproducibility of this method, 284 arterial cross sections were blindly resubmitted for re-measurement by the techni- cians and the results were compared to the origi- nal measurements. Table 1 and Fig. 5 show the correlation coefficients for each of these mea- surements. The r values for the total circumfer-
A B CIRCUMFERENCE TOTAL AREA
10.0
c~
5 . 0
o = o 7 o o
o o
o y o r=0 .967
j r
0 i 0"5.0 5.0 10.0 0 0 2.0 4.0 6.0
OBSERVER 1 OBSERVER 1
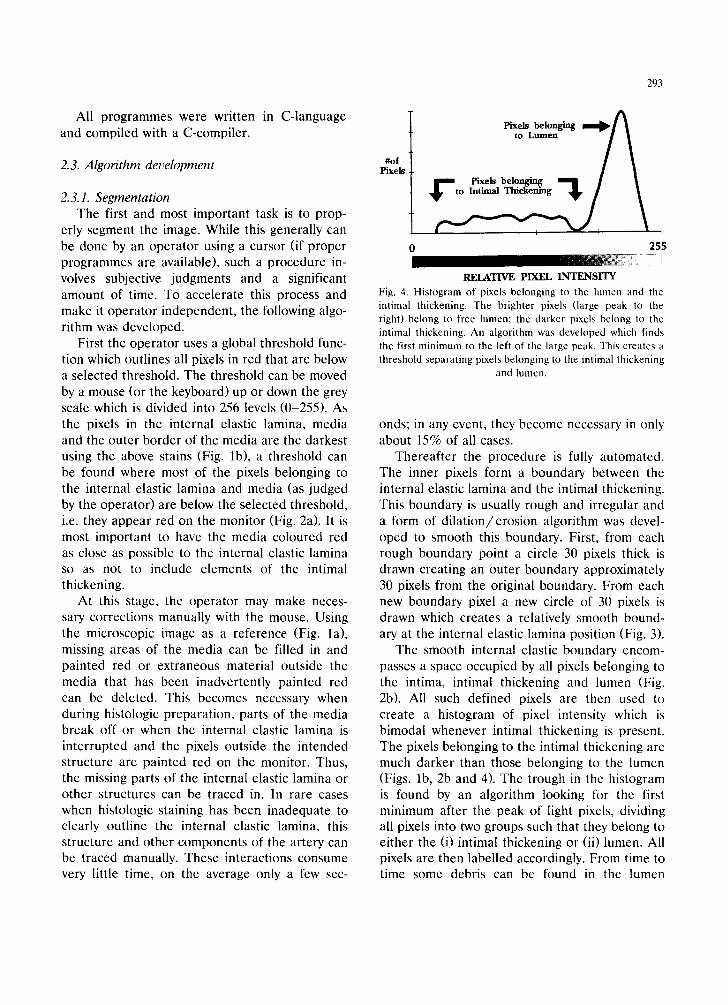
Fig. 5. Repe t i t i ve m e a s u r e m e n t s o f (a) c i r c u m f e r e n c e a n d (b) to ta l a r t e r i a l a r e a shows a very s t r o n g co r r e l a t i on : r = 0.967 a n d
0.975, respectively.
. ~ -~ 6"0 / - ~ / "
/ ] ,.
N=284
° ,
0 0 f ~
295
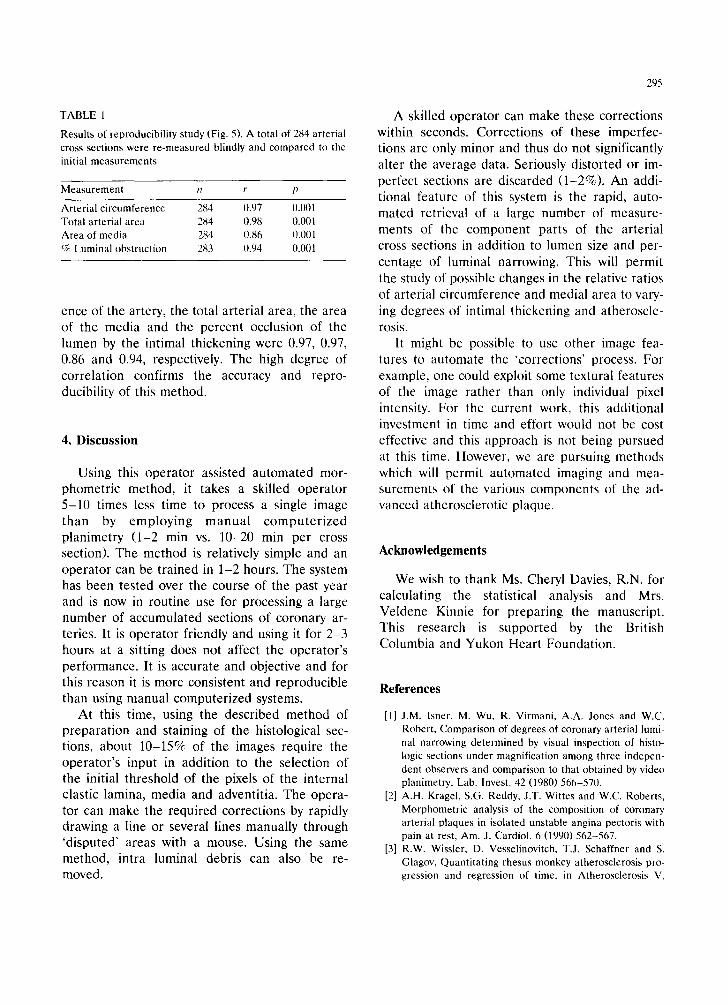
TABLE 1
Results of reproducibility study (Fig. 5). A total of 284 arterial cross sections were re-measured blindly and compared to the initial measurements
Measurement n r p
Arterial circumference 284 0.97 0.001 Total arterial area 284 0.98 0.00l Area of media 284 0.86 0.001 % Luminal obstruction 283 0.94 0.001
ence of the artery, the total arterial area, the area of the media and the percent occlusion of the lumen by the intimal thickening were 0.97, 0.97, 0.86 and 0.94, respectively. The high degree of correlation confirms the accuracy and repro- ducibility of this method.
4. Discussion
Using this operator assisted automated mor- phometric method, it takes a skilled operator 5-10 times less time to process a single image than by employing manual compute r ized planimetry (1-2 min vs. 10-20 min per cross section). The method is relatively simple and an operator can be trained in 1-2 hours. The system has been tested over the course of the past year and is now in routine use for processing a large number of accumulated sections of coronary ar- teries. It is operator friendly and using it for 2-3 hours at a sitting does not affect the operator 's performance. It is accurate and objective and for this reason it is more consistent and reproducible than using manual computerized systems.
At this time, using the described method of preparation and staining of the histological sec- tions, about 10-15% of the images require the operator 's input in addition to the selection of the initial threshold of the pixels of the internal elastic lamina, media and adventitia. The opera- tor can make the required corrections by rapidly drawing a line or several lines manually through 'disputed' areas with a mouse. Using the same method, intra luminal debris can also be re- moved.
A skilled operator can make these corrections within seconds. Corrections of these imperfec- tions are only minor and thus do not significantly alter the average data. Seriously distorted or im- perfect sections are discarded (1-2%). An addi- tional feature of this system is the rapid, auto- mated retrieval of a large number of measure- ments of the component parts of the arterial cross sections in addition to lumen size and per- centage of luminal narrowing. This will permit the study of possible changes in the relative ratios of arterial circumference and medial area to vary- ing degrees of intimal thickening and atheroscle- rosis.
It might be possible to use other image fea- tures to automate the 'corrections' process. For example, one could exploit some textural features of the image rather than only individual pixel intensity. For the current work, this additional investment in time and effort would not be cost effective and this approach is not being pursued at this time. However, we are pursuing methods which will permit automated imaging and mea- surements of the various components of the ad- vanced atherosclerotic plaque.
Acknowledgements
We wish to thank Ms. Cheryl Davies, R.N. for calculating the statistical analysis and Mrs. Veldene Kinnie for preparing the manuscript. This research is supported by the British Columbia and Yukon Heart Foundation.
References
[1] J.M. Isner, M. Wu, R. Virmani, A.A. Jones and W.C. Robert, Comparison of degrees of coronary arterial lumi- nal narrowing determined by visual inspection of histo- logic sections under magnification among three indepen- dent observers and comparison to that obtained by video planimetry, Lab. Invest. 42 (1980) 566-570.
[2] A.H. Kragel, S.G. Reddy, J.T. Wines and W.C. Roberts, Morphometric analysis of the composition of coronary arterial plaques in isolated unstable angina pectoris with pain at rest, Am. J. Cardiol. 6 (1990) 562-567.
[3] R.W. Wissler, D. Vesselinovitch, T.J. Schaffner and S. Glagov, Quantitating rhesus monkey atherosclerosis pro- gression and regression of time, in Atherosclerosis V,
296
Proc. 5th Int. Symp. on Atherosclerosis, eds. A.M. Gotto, Jr., L.C. Smith and B. Allen, pp. 757-761 (Springer- Verlag, NY, 1980).
[4] H.F. Mizgala, L. Gray, J. Ferris, V. Bociek and P. Allard, Extent of coronary narrowing in 329 cases of unexpected deaths, age 40 years and under, Modern Pathol. 4 (1991) 19A.
[5] B. Palcic and B. Jaggi, Image cytometry system for mor- phometric measurements of live cells, in Bioinstrumenta- tion: Developments and Applications, ed. D.L. Wise, pp. 923-991 (Butterworth, Stoneham, MA, 1990).
[6] B. Palcic, Digital imaging techniques in biology, Proc. 9th Int. Congress Radiat. Res. (1991) 849-855.
[7] W.N. O'Connor and S. Valle, A combination Verhoeff's
elastic and Masson's Trichrome stain for routine histol- ogy, Stain Technol. 57 (1991) 207-210.
[8] B. Jaggi and B. Palcic, Charge-coupled device require- ments in the design of a quantitative microscope for image cytometry, in Inst. for Graphic Comm., ed. S. Smith, pp. 177-182 (Pasadena, CA, Waltham, MA, 1989).
[9] B. Jaggi, S.S.S. Poon, B. Pontifex, J.J.P. Fengler and B. Palcic, Evaluation of a quantitative microscope for image cytometry, in Advances in Analytical Cellular Pathology, eds. G. Burger et al., pp. 31-32 (Elsevier, Amsterdam, 1990).
[10] B. Jaggi, S. Poon, B. Pontifex, J. Fengler, J. Marquis and B. Palcic, A quantitative microscope for image cytometry, SPIE Proc. 1448 (1991) 89-97.