42
CyRCE: JavierM árquez Diez-Canedo. M arch 2002 A CreditRisk defaultm odelthat m easures concentration,single obligorlim its and bank capital adequacy.
CyRCE:
Javier M árquez Diez-Canedo.M arch 2002
A Credit Risk default m odel thatm easures concentration, singleobligor lim its and bank capitaladequacy.
I. I. IntroductionIntroduction
II.II. CyRCE m odelCyRCE m odel
III.III. System ic Credit Risk analysisSystem ic Credit Risk analysis
Index

Introduction
One of the m ain concerns of regulators is having a proper
assessm ent of the solvency of the Financial System .
It is im portant to have an adequate picture of the level of risk of the
Financial System as a whole, where risk is concentrated, and the
individual banks’ contribution to overall risk.
This represents a technically form idable problem for several
reasons:
Inform ation
Credit risk m ethodologies:
No accepted paradigm
Num erical techniques w ith heavy com putational requirem ents
How to draw the picture?
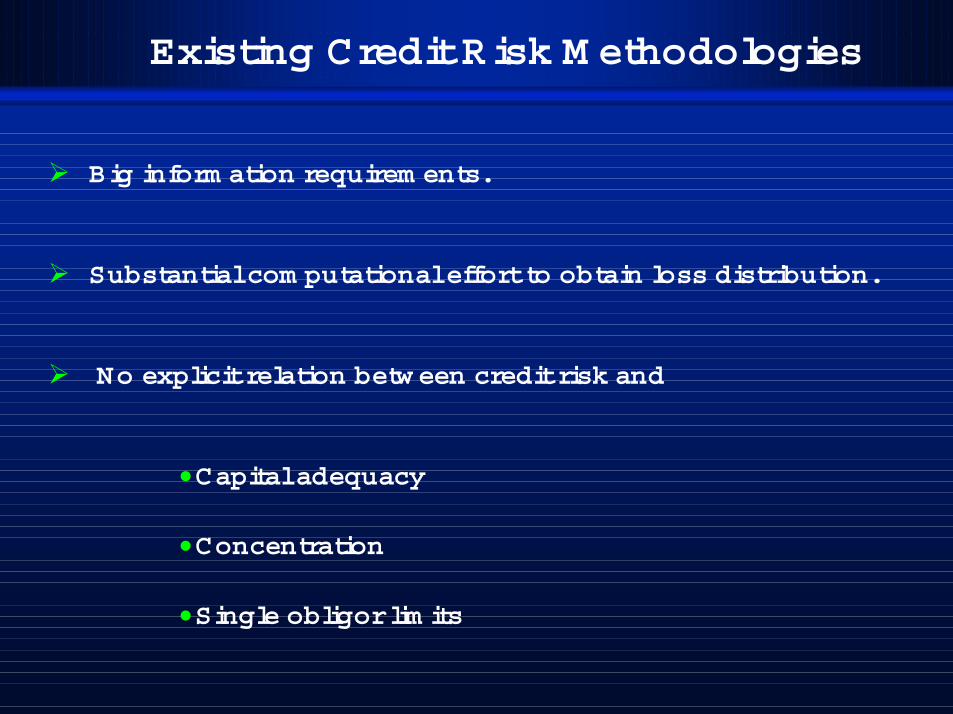
Existing Credit Risk M ethodologies
Big inform ation requirem ents.
Substantial com putational effort to obtain loss distribution.
No explicit relation betw een credit risk and
• Capital adequacy
• Concentration
• Single obligor lim its
I. I. IntroductionIntroduction
II.II. CyRCE m odelCyRCE m odel
III.III. System ic Credit Risk analysisSystem ic Credit Risk analysis
Index
CyRCE: Properties
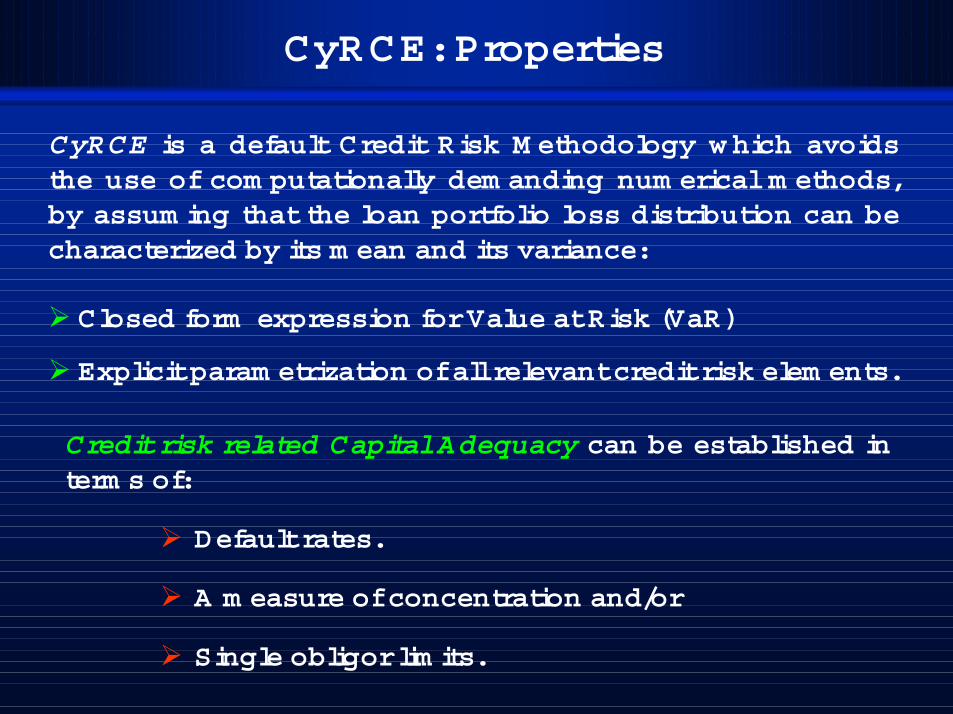
CyRCE is a default Credit Risk M ethodology which avoidsthe use of com putationally dem anding num erical m ethods,by assum ing that the loan portfolio loss distribution can becharacterized by its m ean and its variance:
Closed form expression for Value at Risk (VaR)
Explicit param etrization of all relevant credit risk elem ents.
Credit risk related Capital Adequacy can be established interm s of:
Default rates.
A m easure of concentration and/or
Single obligor lim its.
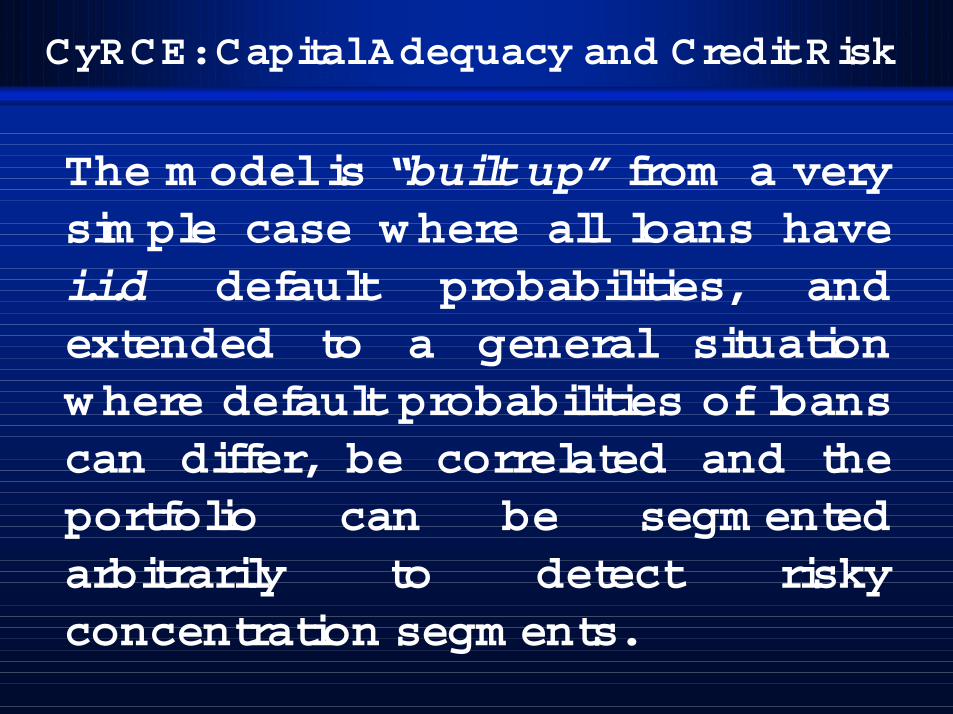
The m odel is “built up” from a verysim ple case where all loans havei.i.d default probabilities, andextended to a general situationwhere default probabilities of loanscan differ, be correlated and theportfolio can be segm entedarbitrarily to detect riskyconcentration segm ents.
CyRCE: Capital Adequacy and Credit Risk

Let fi be the ith loan am ount in the portfolio; i = 1,2,....,N
Define “N” binary i.i.d random variables:
CyRCE: A sim ple M odel
Xi
====0fi
w ith probability 1 - p w ith probability p
The m ean and standard deviation of the total portfolio lossare:
pV====µµµµ
∑∑∑∑====
====N
1iifV
==== ∑∑∑∑====
N
1i
2if−−−− p1p )(σσσσ
CyRCE: Value at Risk
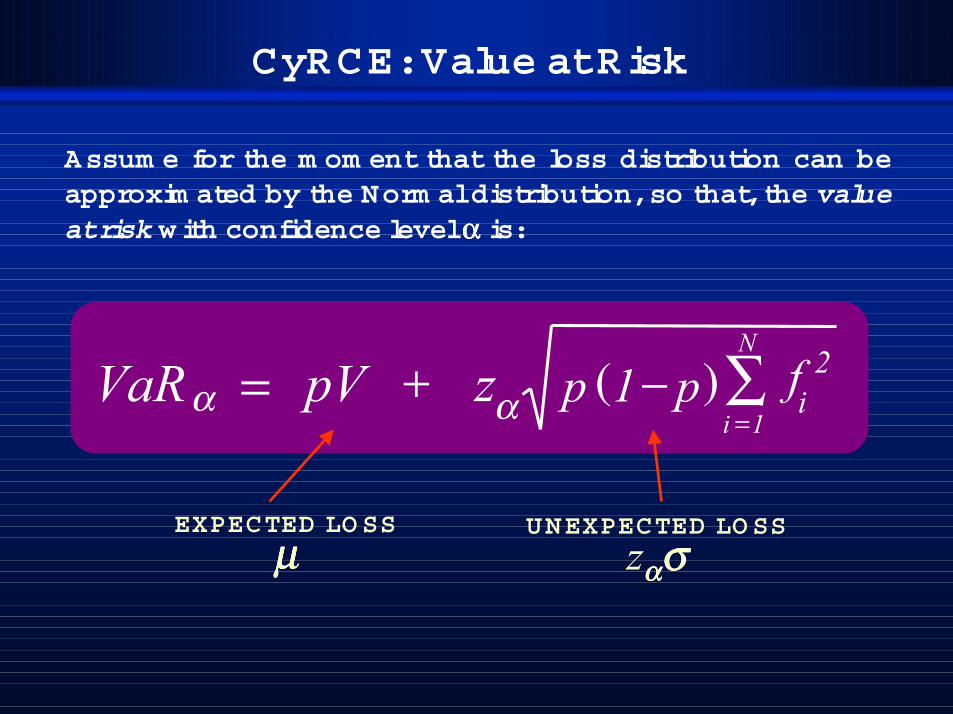
Assum e for the m om ent that the loss distribution can beapproxim ated by the Norm al distribution, so that, the valueat risk with confidence level αααα is:
+=VaRα zα ∑=
N
1i
2if− p1p )(pV
EXPECTED LOSS
µµµµUNEXPECTED LOSS
zαααασσσσ
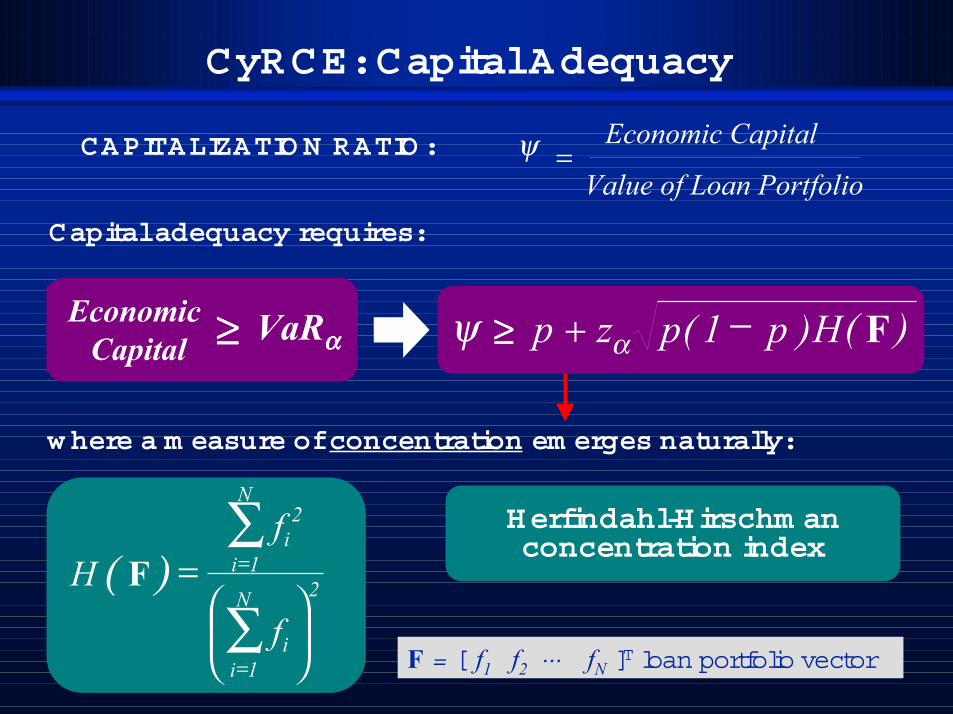
CyRCE: Capital Adequacy
CAPITALIZATIO N RATIO :
Value of Loan Portfolio
Economic Capital=ψ
VaRααααEconomic Capital ≥≥≥≥
Capital adequacy requires:
FH)p1(pzp −+≥≥≥≥ αψ ( )
( ) 2N
1ii
N
1i
2i
f
fH
=
∑
∑
=
= FHerfindahl-Hirschm anconcentration index
F = [ f1 f2 ⋅⋅⋅ fN ]T loan portfolio vector
w here a m easure of concentration em erges naturally:

CyRCE: Concentration Lim it
The VaR expression establishes a lim it onconcentration through H(F):
( )( )p1pz
p
f
f
2
2
2N
1ii
N
1i
2i
−
−≤
∑
∑
=
=
α
ψH(F) =
From which single obligor lim its can be obtained.
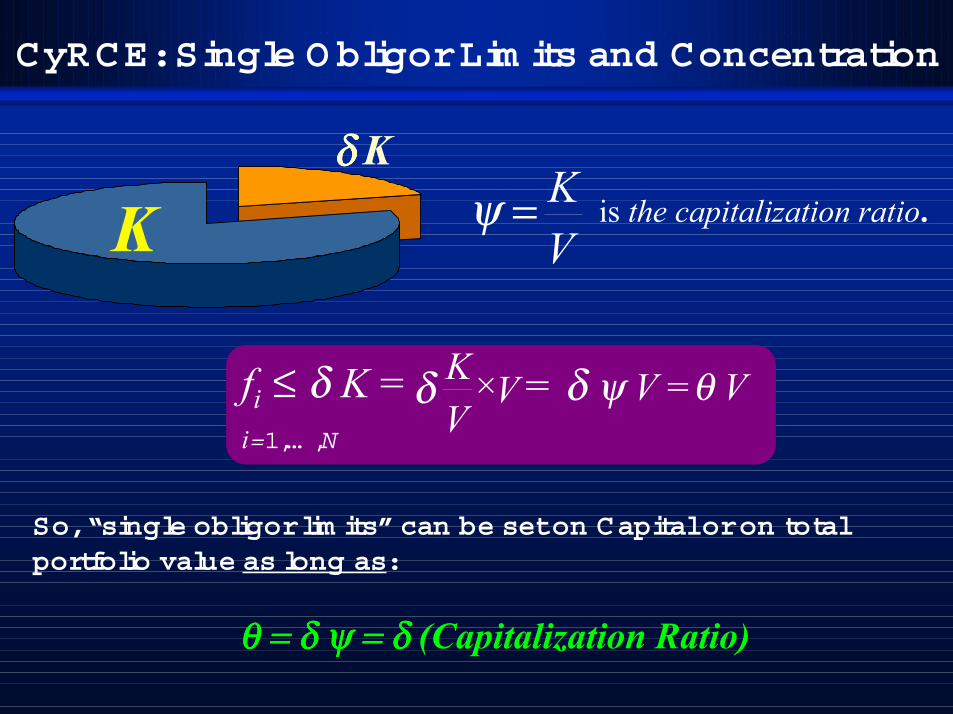
CyRCE: Single Obligor Lim its and Concentration
Kδδδδ
K
θ = δ ψ = δ θ = δ ψ = δ θ = δ ψ = δ θ = δ ψ = δ (Capitalization Ratio)
is the capitalization ratio.VK=ψ
fi ≤ δ K =i=1,… ,N
VVKδ × = δ ψ V =θ V
So, “single obligor lim its” can be set on Capital or on totalportfolio value as long as:
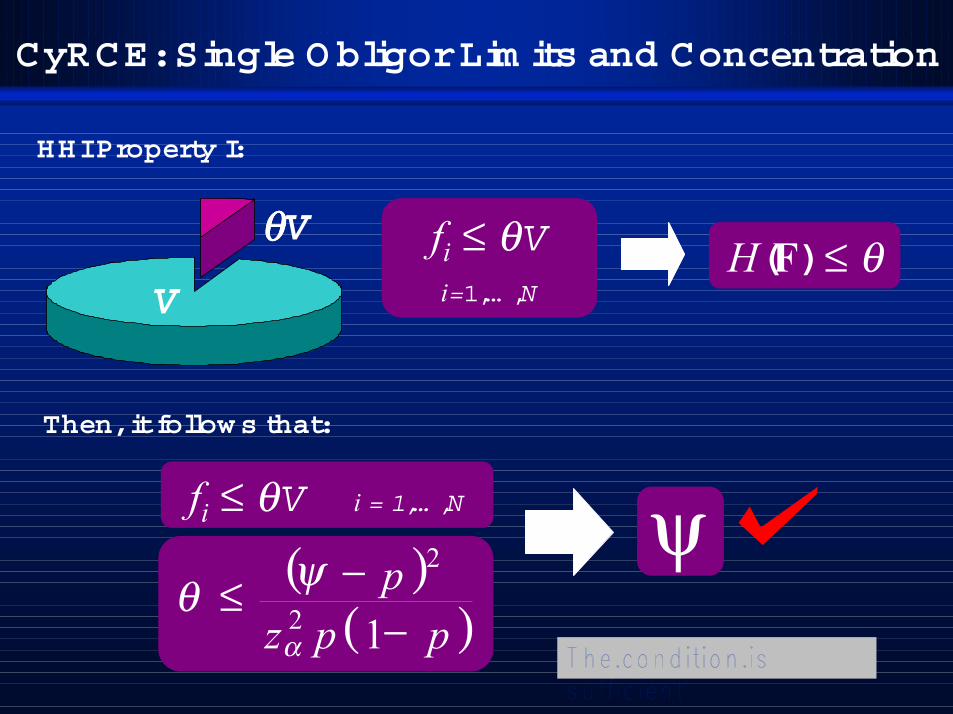
CyRCE: Single Obligor Lim its and Concentration
ψ
H(F) ≤ θ
Then, it follows that:
V
Vθθθθ fi ≤ θVi=1,… ,N
( )( )ppz
p−
−≤ 12
2
α
ψθ
fi ≤ θV i = 1,… ,N
HHI Property I:
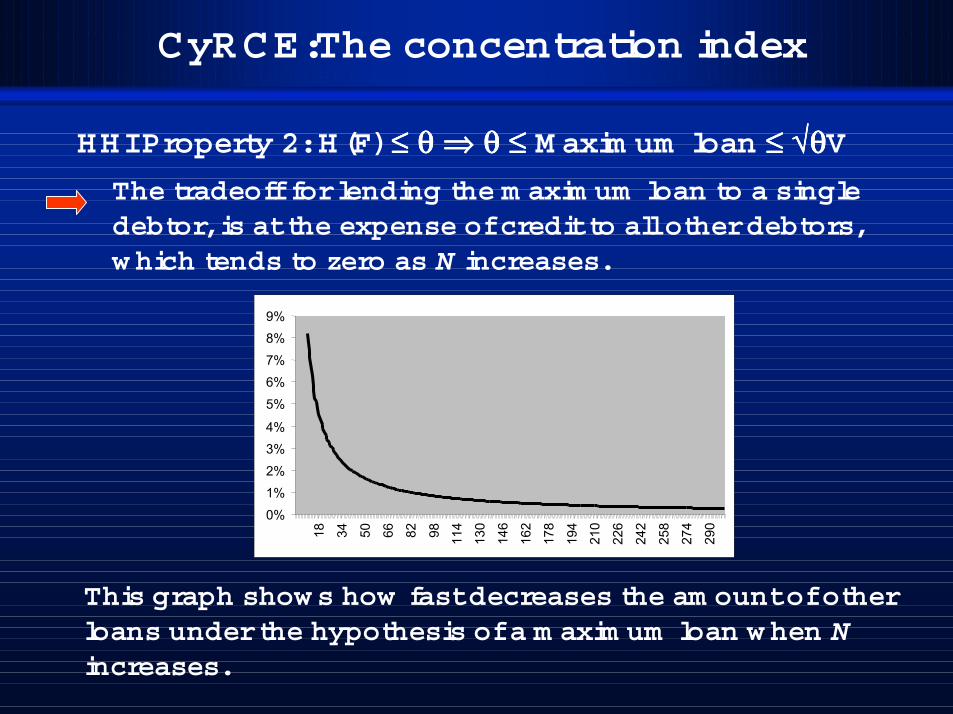
The tradeoff for lending the m axim um loan to a singledebtor, is at the expense of credit to all other debtors,w hich tends to zero as N increases.
1%
3%
5%
7%
9%18 34 50 66 82 98 11
4
130
146
162
178
194
210
226
242
258
274
290
0%
2%
4%
6%
8%
This graph shows how fast decreases the am ount of otherloans under the hypothesis of a m axim um loan w hen Nincreases.
CyRCE:The concentration index
HHI Property 2: H(F) ≤≤≤≤ θθθθ ⇒⇒⇒⇒ θθθθ ≤≤≤≤ M axim um loan ≤≤≤≤ √θ√θ√θ√θV
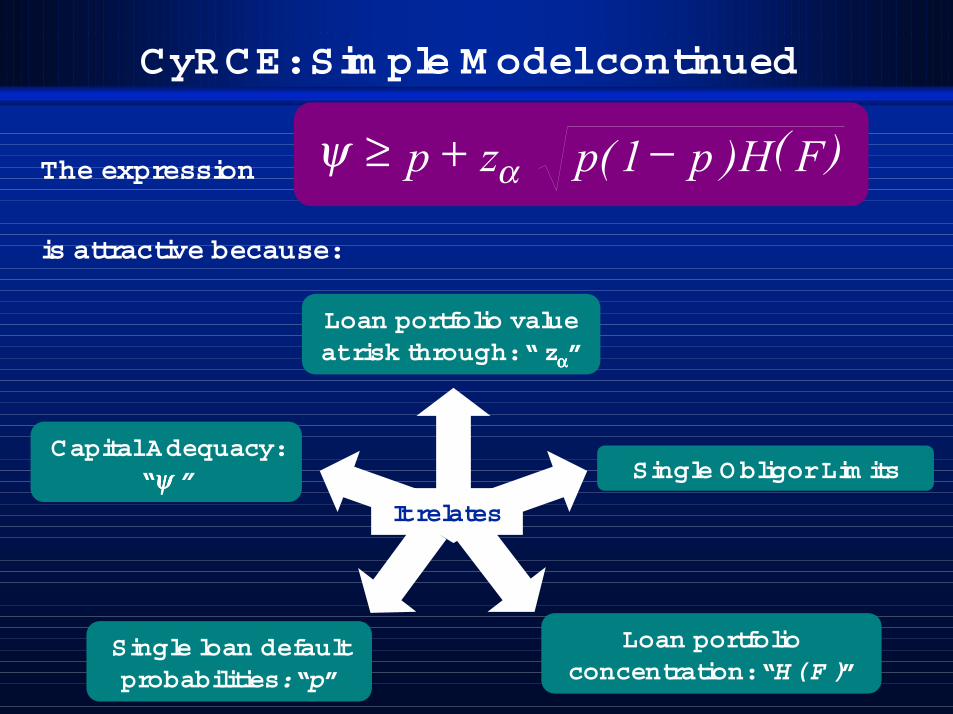
CyRCE: Sim ple M odel continued
Loan portfolio valueat risk through: “ zαααα”
Loan portfolioconcentration: “H( F )”
Capital Adequacy:“ψψψψ ”
Single loan defaultprobabilities: “p”
FH)p1(pzp −+≥ αψ ( )
is attractive because:
Single Obligor Lim its
It relates
The expression
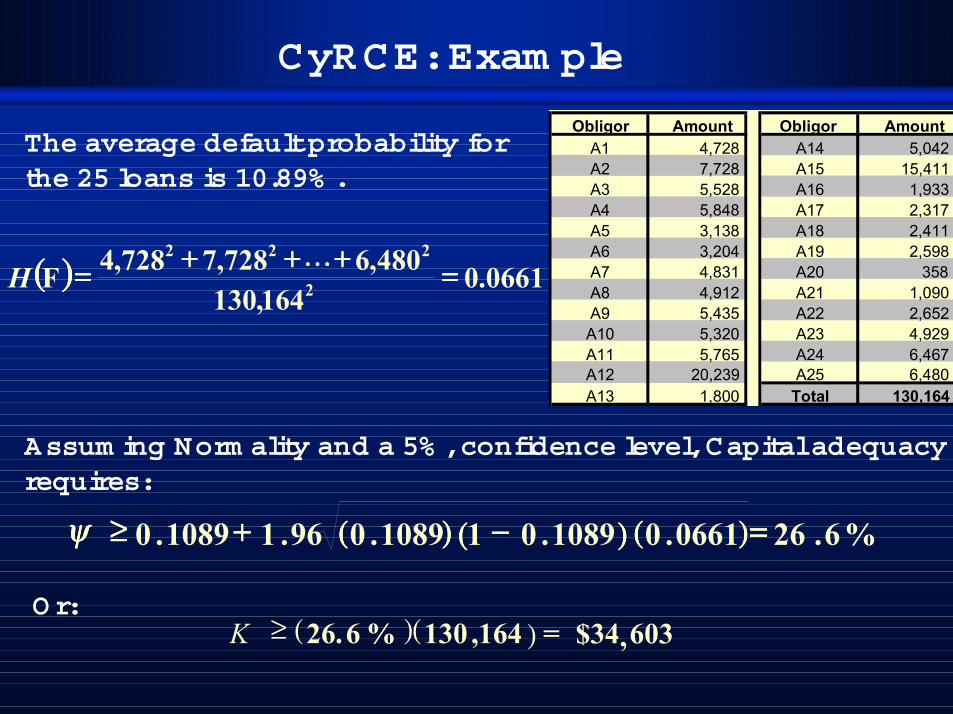
Obligor Amount Obligor AmountA1 4,728 A14 5,042 A2 7,728 A15 15,411 A3 5,528 A16 1,933 A4 5,848 A17 2,317 A5 3,138 A18 2,411 A6 3,204 A19 2,598 A7 4,831 A20 358 A8 4,912 A21 1,090 A9 5,435 A22 2,652 A10 5,320 A23 4,929 A11 5,765 A24 6,467 A12 20,239 A25 6,480 A13 1,800 Total 130,164
CyRCE: Exam ple
The average default probability forthe 25 loans is 10.89% .
(((( )))) 0661.0164,130
480,6728,7728,42
222====++++++++++++==== LLLLFH
,( , )164130( )%6.26 603$34=≥K
Assum ing Norm ality and a 5% , confidence level, Capital adequacyrequires:
O r:
. %62696.11089.0 ====)))).(((( 06610.(((( ))))10890 (((( ))))1089.01 −−−−++++≥≥≥≥ψψψψ
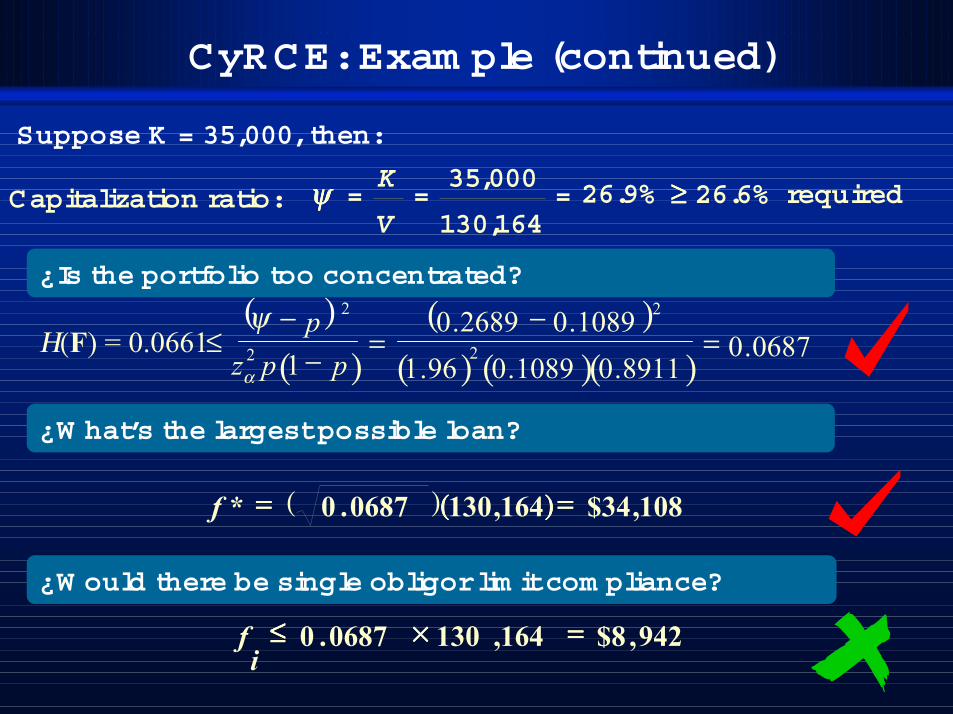
CyRCE: Exam ple (continued)
Capitalization ratio:
Suppose K = 35,000, then:
26.9%164,130
000,35===
V
Kψψψψ ≥≥≥≥ 26.6% required
¿Is the portfolio too concentrated?
¿W hat’s the largest possible loan?
(((( ))))164,130( )0687.0* 108 ,$34========f
¿W ould there be single obligor lim it com pliance?
( )( ( ) ( )( ) 0687.0
1089.02689.0 2
=−
=≤2− pψ( )) 0. 8911.1089096.1
21 − pp2zα
Η(F) = 0.0661
942 ,$8164,1300687.0 ====××××≤≤≤≤i
f
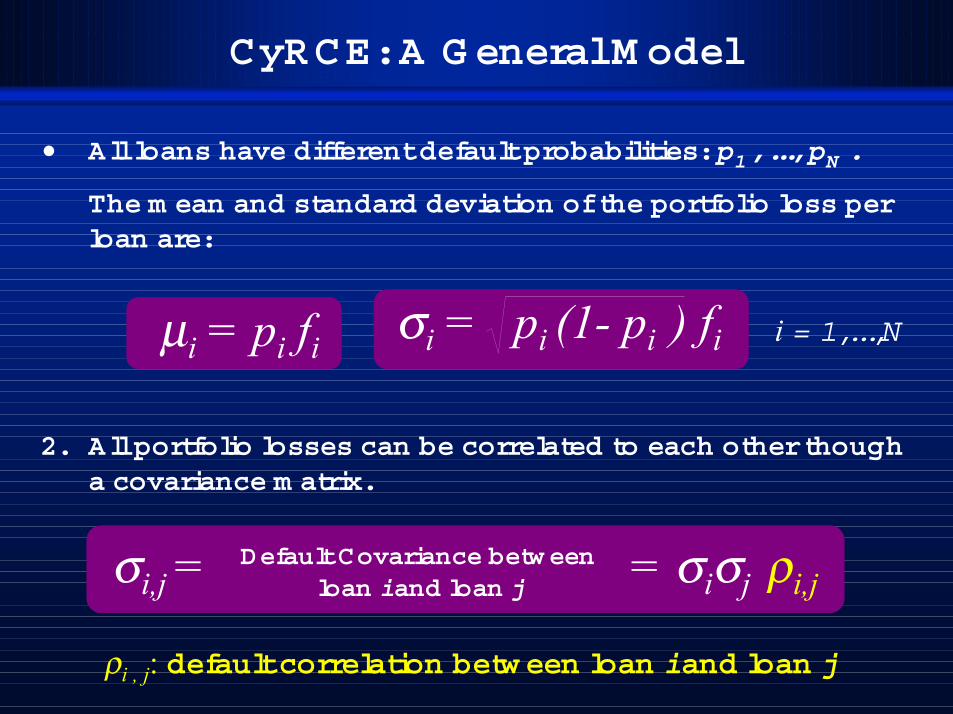
CyRCE: A General M odel
• All loans have different default probabilities: p1 , ..., pN .
The m ean and standard deviation of the portfolio loss perloan are:
2. All portfolio losses can be correlated to each other thougha covariance m atrix.
ρi , j: default correlation between loan i and loan j
= σiσj ρi,jDefault Covariance between
loan i and loan jσi,j =
µi = pi fi i = 1,...,Nσi = pi (1- pi ) fi
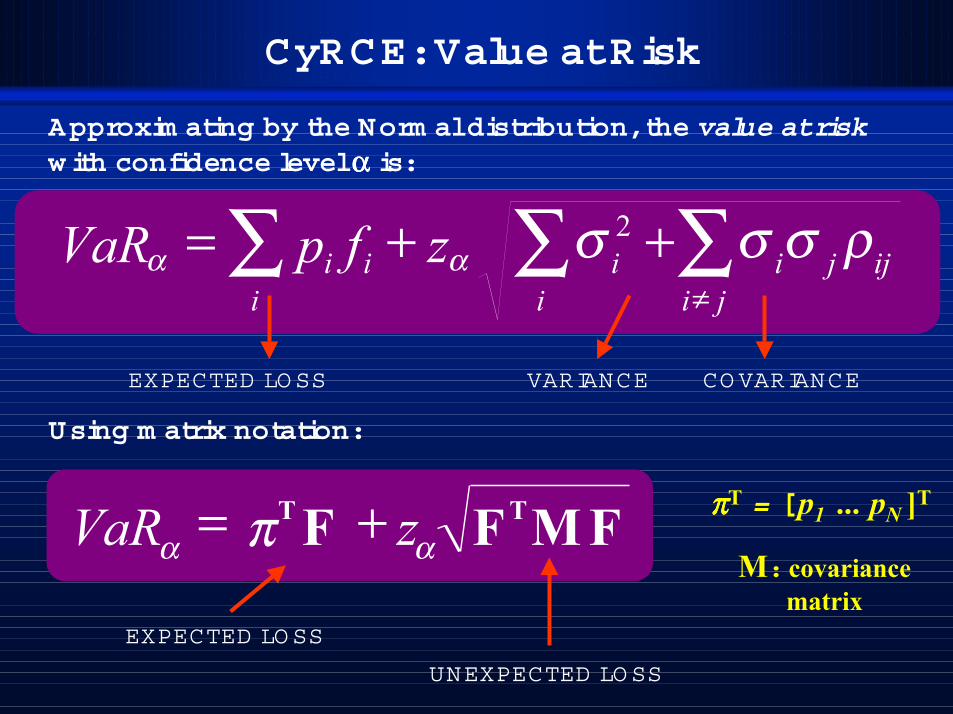
CyRCE: Value at Risk
∑∑∑≠
++=ji
ijjii
ii
ii zfpVaR ρσσσαα2
+= z FMFTαVaRα
T Fπ
EXPECTED LOSS
UNEXPECTED LO SS
Approxim ating by the Norm al distribution, the value at riskw ith confidence level αααα is:
Using m atrix notation:
M: covariancematrix
ππππT = [ p1 ... pN ]T
EXPECTED LOSS VARIANCE CO VARIANCE
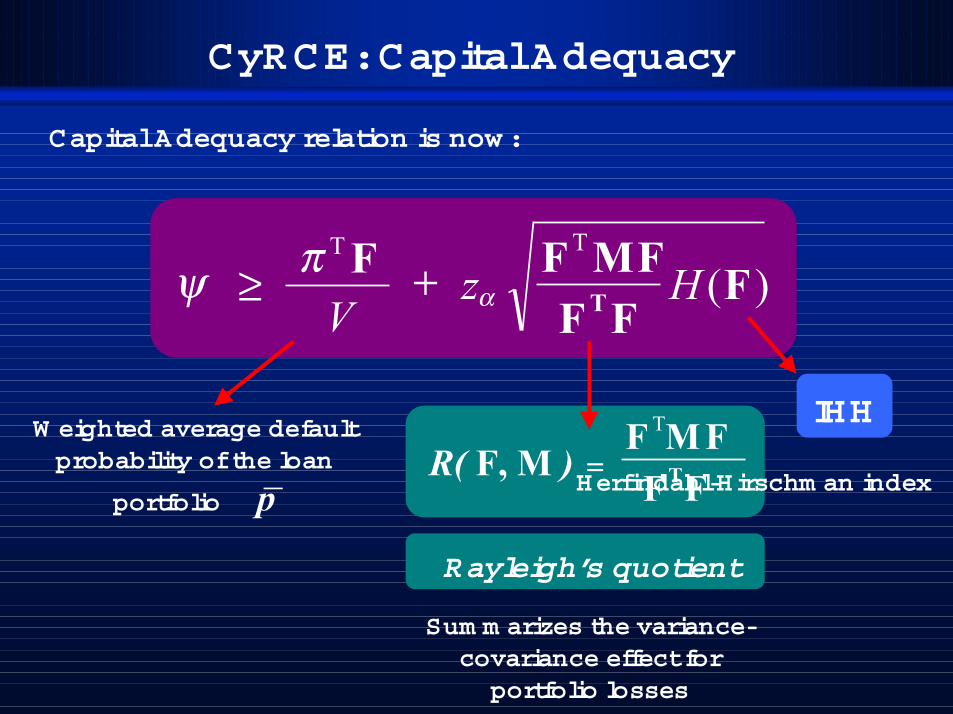
CyRCE: Capital Adequacy
Capital Adequacy relation is now :
T
T
FHFF
MFz )(αψ +≥T
VFπ F
Sum m arizes the variance-covariance effect forportfolio losses
R( F, M ) = T
T
FFMF F
Rayleigh’s quotient
IHHW eighted average defaultprobability of the loan
portfolio p_ Herfindahl-Hirschm an index
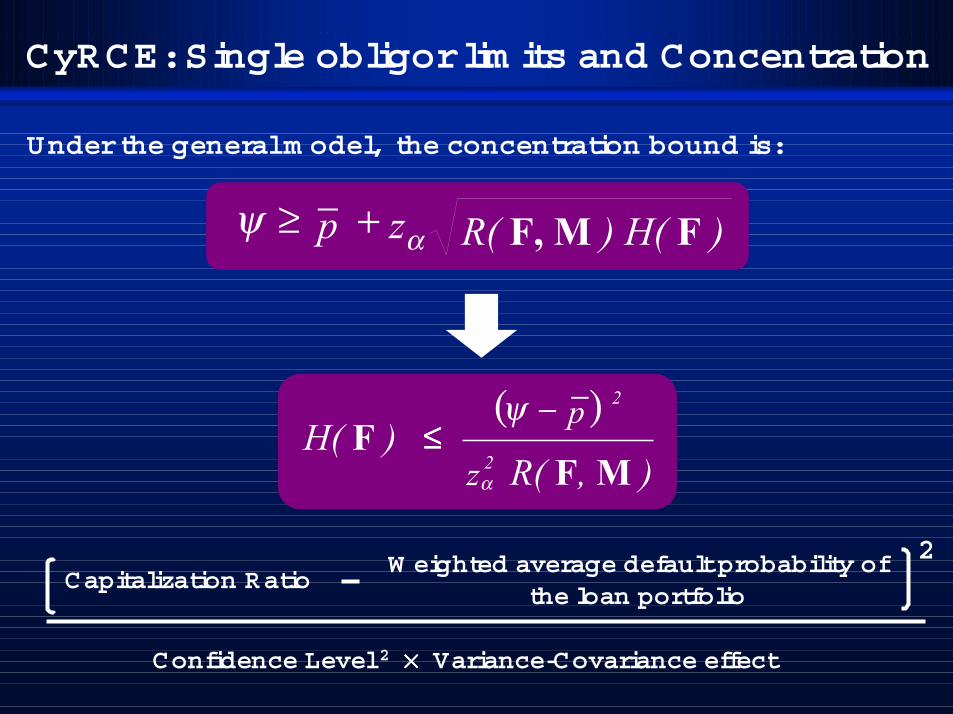
Under the general m odel, the concentration bound is:
CyRCE: Single obligor lim its and Concentration
R( F, M ) H( F )+≥ zαψ p_
R( F, M )≤≤≤≤
z 2α
H( F )p( ) 2−ψ −
Capitalization RatioW eighted average default probability of
the loan portfolio
2
Confidence Level 2 ×××× Variance-Covariance effect
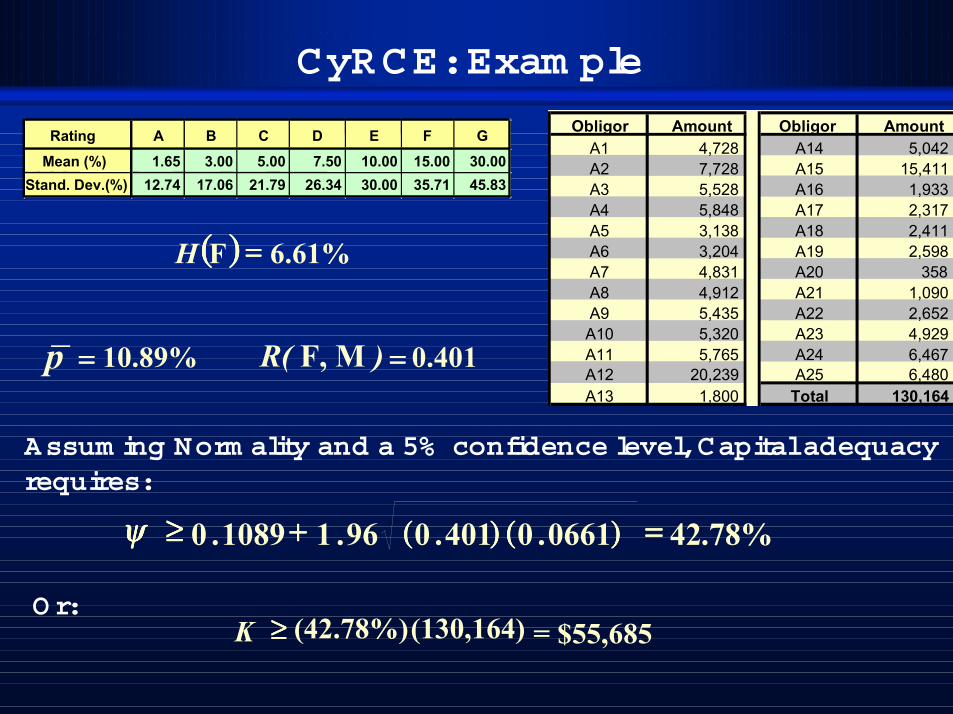
CyRCE: Exam ple
Assum ing Norm ality and a 5% confidence level, Capital adequacyrequires:
O r:
Rating A B C D E F GMean (%) 1.65 3.00 5.00 7.50 10.00 15.00 30.00
Stand. Dev.(%) 12.74 17.06 21.79 26.34 30.00 35.71 45.83
(((( )))) 6.61%====FH
p_
==== 10.89% R( F, M ) 0.401====
)))).(((( 06610.(((( ))))401096.11089.0 . %7842====++++≥≥≥≥ψψψψ
(42.78%) $55,685=≥≥≥≥K (130,164)
Obligor Amount Obligor AmountA1 4,728 A14 5,042 A2 7,728 A15 15,411 A3 5,528 A16 1,933 A4 5,848 A17 2,317 A5 3,138 A18 2,411 A6 3,204 A19 2,598 A7 4,831 A20 358 A8 4,912 A21 1,090 A9 5,435 A22 2,652 A10 5,320 A23 4,929 A11 5,765 A24 6,467 A12 20,239 A25 6,480 A13 1,800 Total 130,164
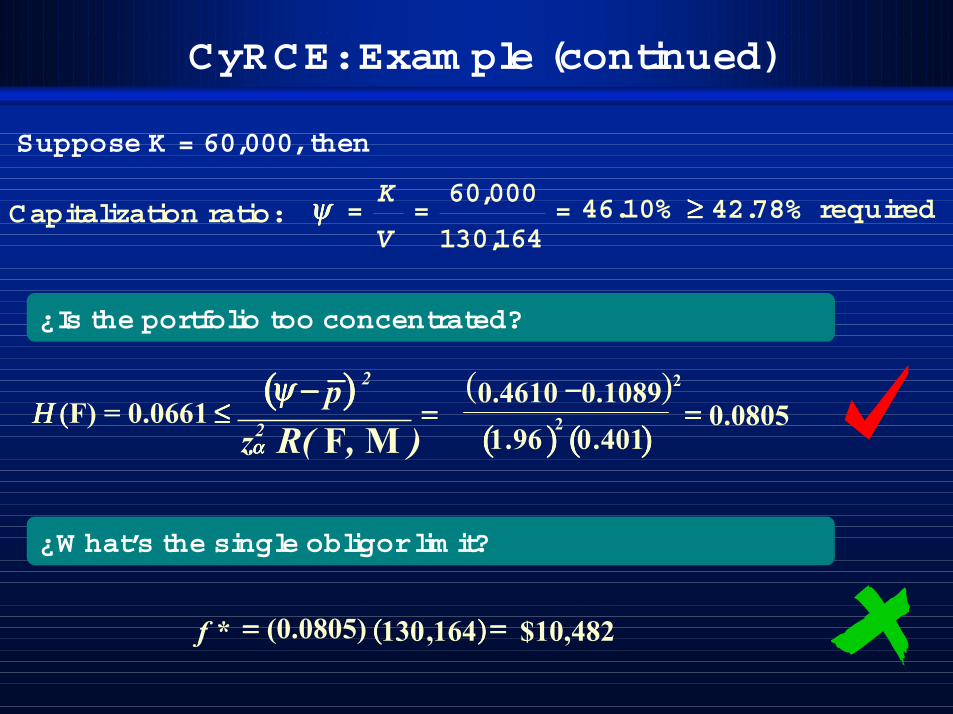
CyRCE: Exam ple (continued)
Suppose K = 60,000, then
Capitalization ratio: 46.10%164,130
000,60===
V
Kψψψψ ≥≥≥≥ 42.78% required
¿Is the portfolio too concentrated?
¿W hat’s the single obligor lim it?
0.0805====( 0.10890.4610 )2−−−−
====≤≤≤≤(((((((( )))))))) .401096.1 2Η Η Η Η ((((F) = 0.0661
R( F, M )z2αααα
p(((( )))) 2−−−−ψψψψ −−−−
(((( ))))164,130(0.0805) $10,482====* ==== f

CyRCE: Portfolio Segm entation
The loan portfolio can be partitioned arbitrarily in segm entssuch that:
ρρρρ1,3ρρρρ1,2
– Extra-group: am ong defaults of different segm ents.
ρρρρ1
• The covariance m atrix M includes tw o kinds of covariation:
– Idiosincratic: am ong defaults within the sam e segm ent.
p1
p2
p3
• Each group has its ow n default probabilities.
CyRCE: Value at Risk
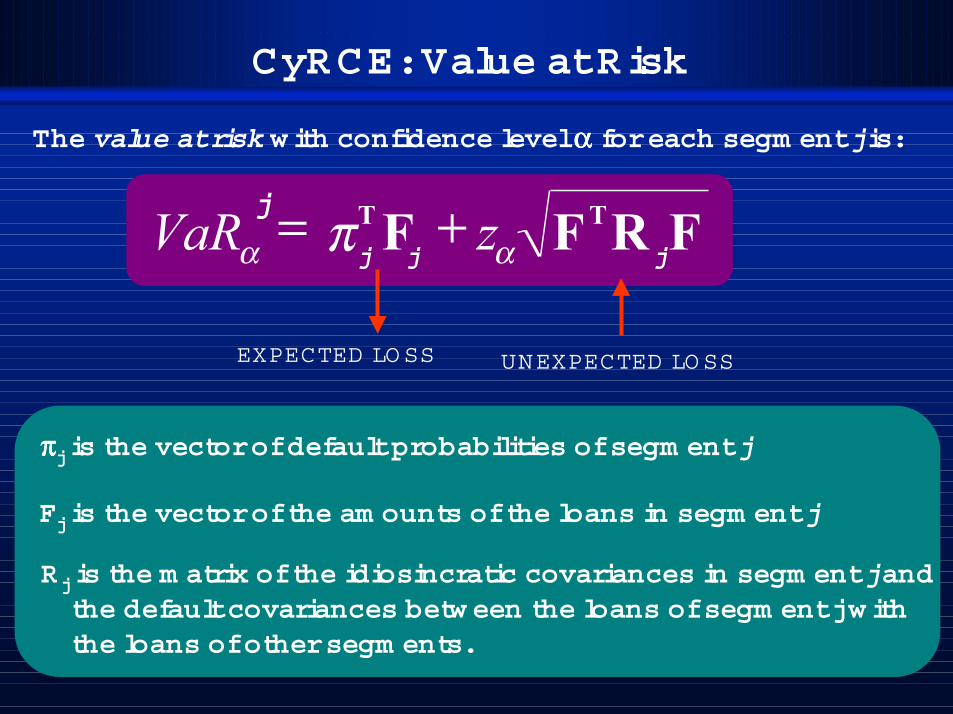
The value at risk with confidence level αααα for each segm ent j is:
+= z FRFTαVaRα
T Fπj
j j j
ππππj is the vector of default probabilities of segm ent j
Rj is the m atrix of the idiosincratic covariances in segm ent j andthe default covariances betw een the loans of segm ent j w iththe loans of other segm ents.
Fj is the vector of the am ounts of the loans in segm ent j
EXPECTED LO SS UNEXPECTED LO SS
CyRCE: Value at Risk (continued)
=
0C0
CMC
0C0
R
j,N
N,jj1,j
j,1
j
LL
MMMMM
LL
MMMMM
LL
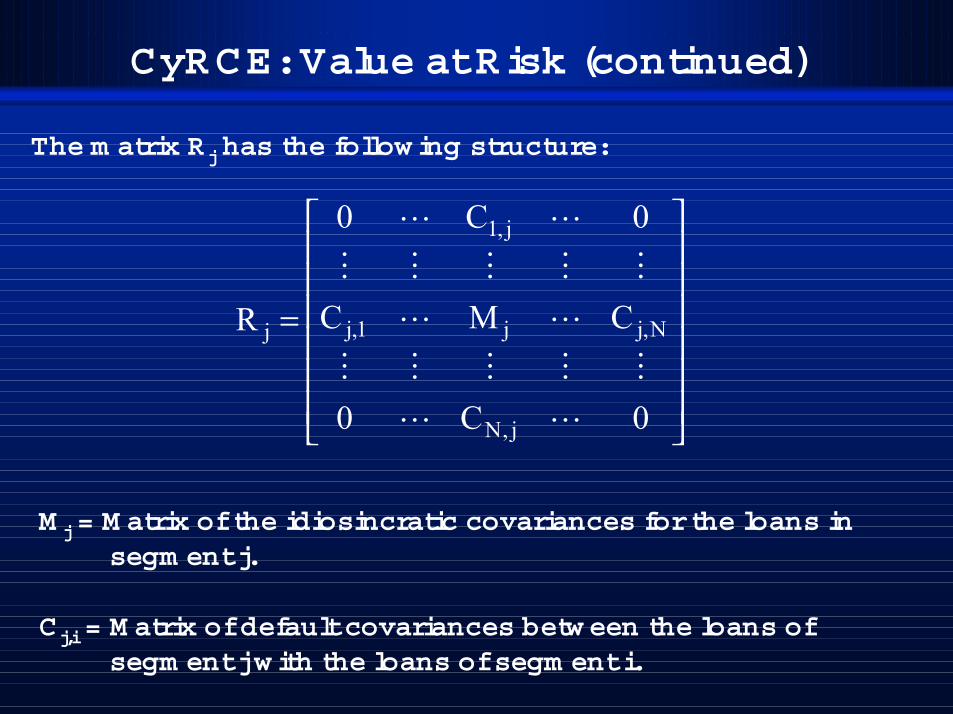
The m atrix Rj has the follow ing structure:
M j = M atrix of the idiosincratic covariances for the loans insegm ent j.
Cj,i = M atrix of default covariances betw een the loans ofsegm ent j w ith the loans of segm ent i.
CyRCE: Capital Adequacy
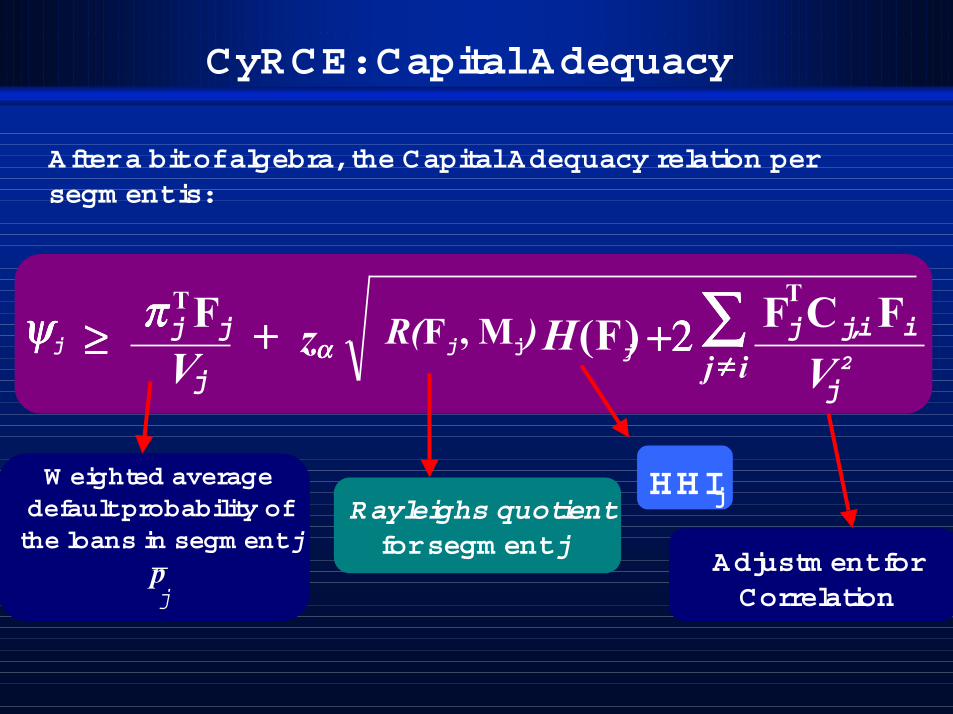
After a bit of algebra, the Capital Adequacy relation persegm ent is:
z FjH )(ααααψψψψj ++++≥≥≥≥T
VFππππ R(Fj , Mj )j j
j
+2+2+2+2 ∑∑∑∑≠≠≠≠ ij
FjTCj,iFiVj2
W eighted averagedefault probability ofthe loans in segm ent j
p_
j
Rayleighs quotientfor segm ent j
HHIj
Adjustm ent forCorrelation
CyRCE: Single obligor lim its and Concentration
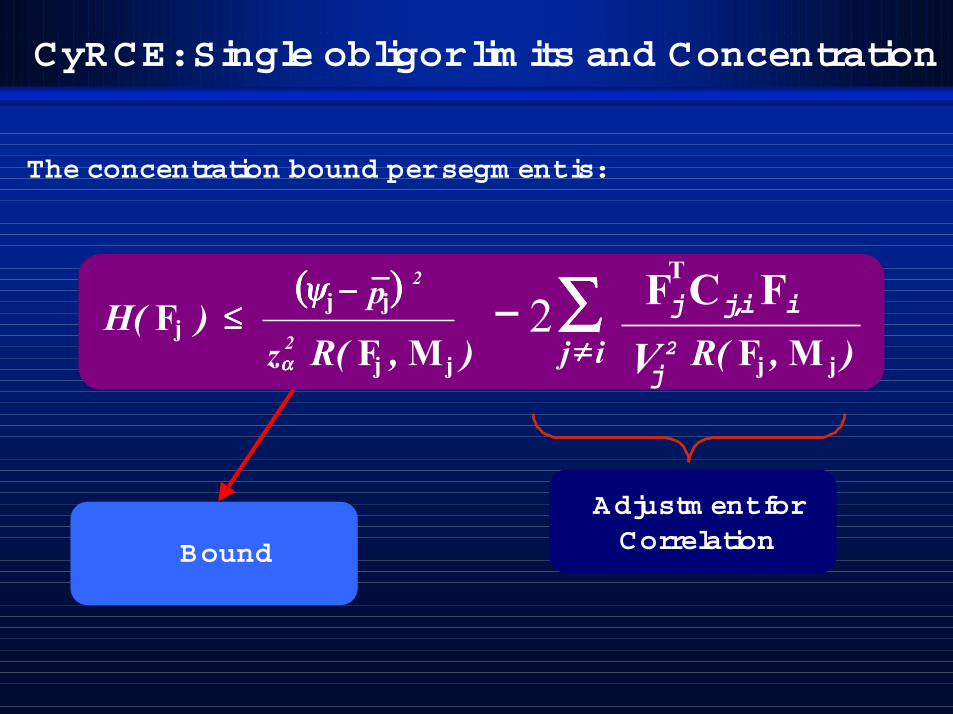
The concentration bound per segm ent is:
R( F , M )≤≤≤≤
z 2αααα
H( F )p(((( )))) 2−−−−ψψψψ −−−−
jj
j
j j
- 2∑∑∑∑≠≠≠≠ ij
FjTCj,iFi
Vj2 R( F , M )j j
Bound
Adjustm ent forCorrelation
Num erical com parison to CreditRisk+
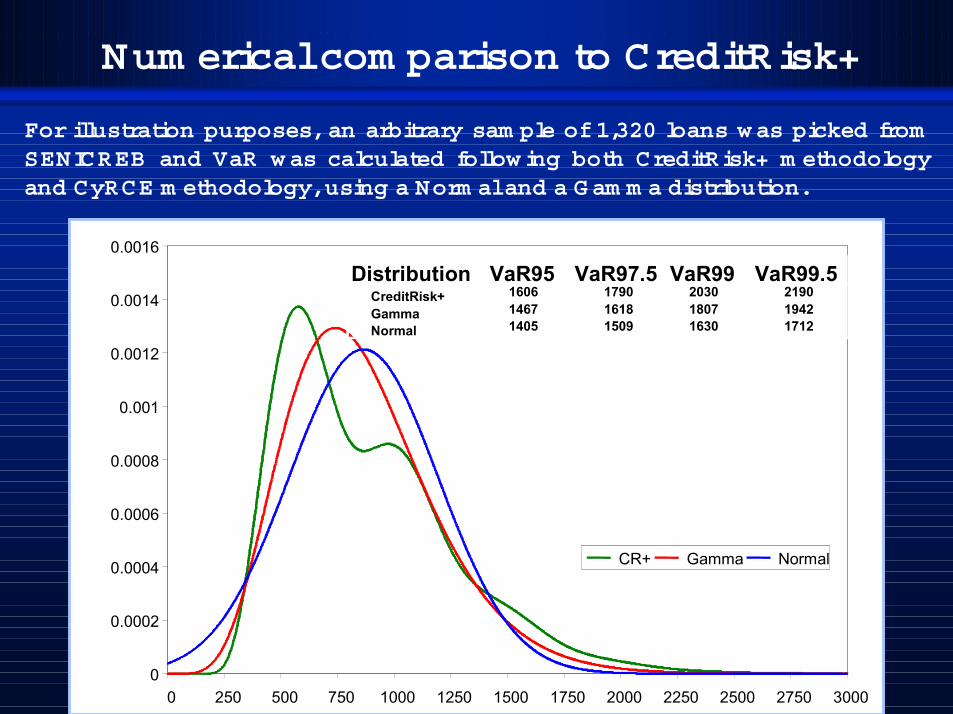
For illustration purposes, an arbitrary sam ple of 1,320 loans was picked fromSENICREB and VaR was calculated follow ing both CreditRisk+ m ethodologyand CyRCE m ethodology, using a Norm al and a Gam m a distribution.
0
0.0002
0.0004
0.0006
0.0008
0.001
0.0012
0.0014
0.0016
0 250 500 750 1000 1250 1500 1750 2000 2250 2500 2750 3000
CR+ Gamma Normal
Distribution VaR95 VaR97.5 VaR99 VaR99.5CreditRisk+ 1606 1790 2030 2190Gamma 1467 1618 1807 1942Normal 1405 1509 1630 1712
0
0.0002
0.0004
0.0006
0.0008
0.001
0.0012
0.0014
0.0016
0 250 500 750 1000 1250 1500 1750 2000 2250 2500 2750 3000
CR+ Gamma NormalCR+ Gamma Normal
Distribution VaR95 VaR97.5 VaR99 VaR99.5CreditRisk+ 1606 1790 2030 2190Gamma 1467 1618 1807 1942Normal 1405 1509 1630 1712
I. I. IntroductionIntroduction
II.II. CyRCE m odelCyRCE m odel
•• System ic Credit Risk analysisSystem ic Credit Risk analysis
III.IIII.I PositionPosition
III.II VaR analysisIII.II VaR analysis
Index
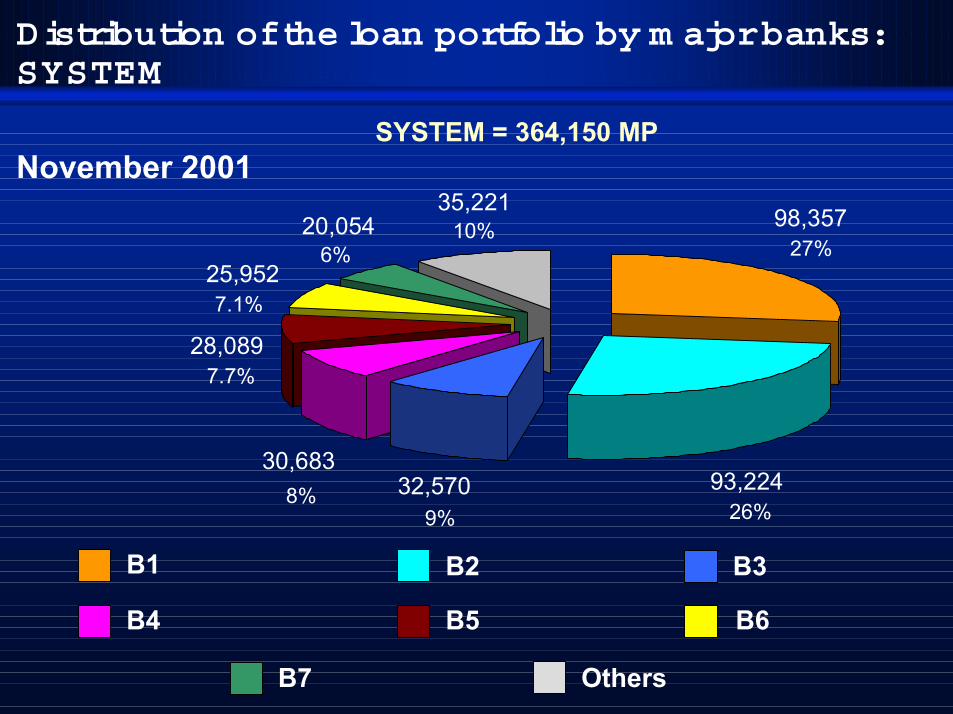
Distribution of the loan portfolio by m ajor banks:SYSTEM
November 2001
27%
26%9%8%
7.7%
7.1%
6%10% 98,357
93,22432,57030,683
28,089
25,952
20,05435,221
SYSTEM = 364,150 MP
B1 B2
B4
B3
B5 B6
B7 Others
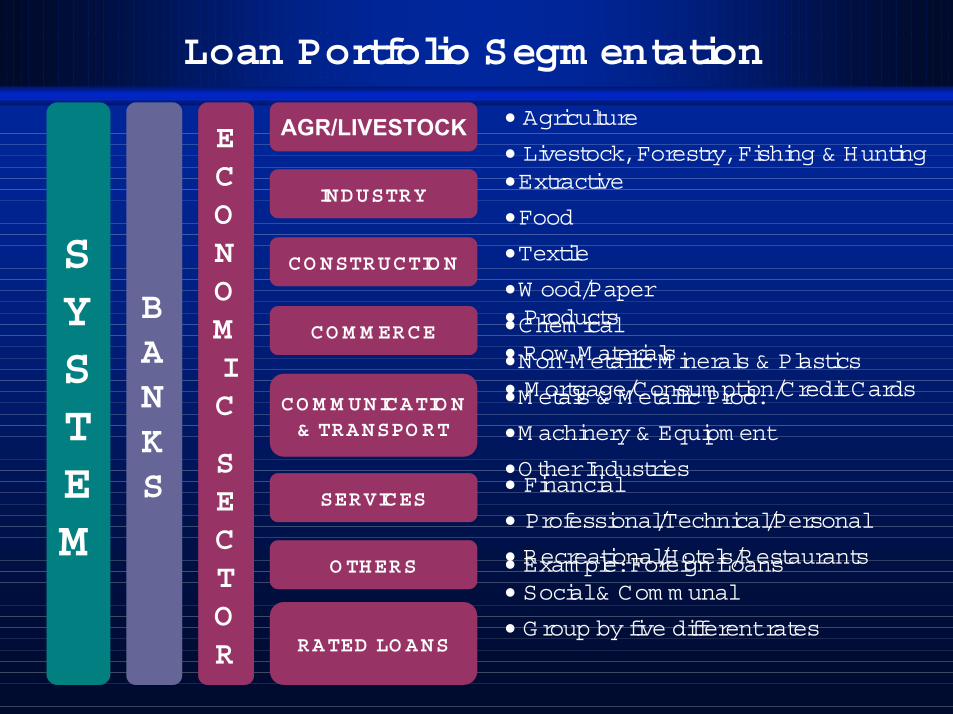
Loan Portfolio Segm entation
BANKS
CONSTRUCTIO N
INDUSTRY• Extractive
• Food
• Textile
• W ood/Paper
• Chem ical
• Non-M etallic M inerals & Plastics
• M etals & M etallic Prod.
• M achinery & Equipm ent
• Other Industries
CO M M ERCE• Products
• Row M aterials
• M ortgage/Consum ption/Credit Cards
SERVICES• Financial
• Professional/Technical/Personal
• Recreational/Hotels/Restaurants
• Social & Com m unal
AGR/LIVESTOCK • Agriculture
• Livestock, Forestry, Fishing & Hunting
CO M M UNICATIO N& TRANSPO RT
O THERS
RATED LO ANS
• Exam ple: Foreign Loans
• G roup by five different rates
SYSTEM
ECONOMIC
SECTOR
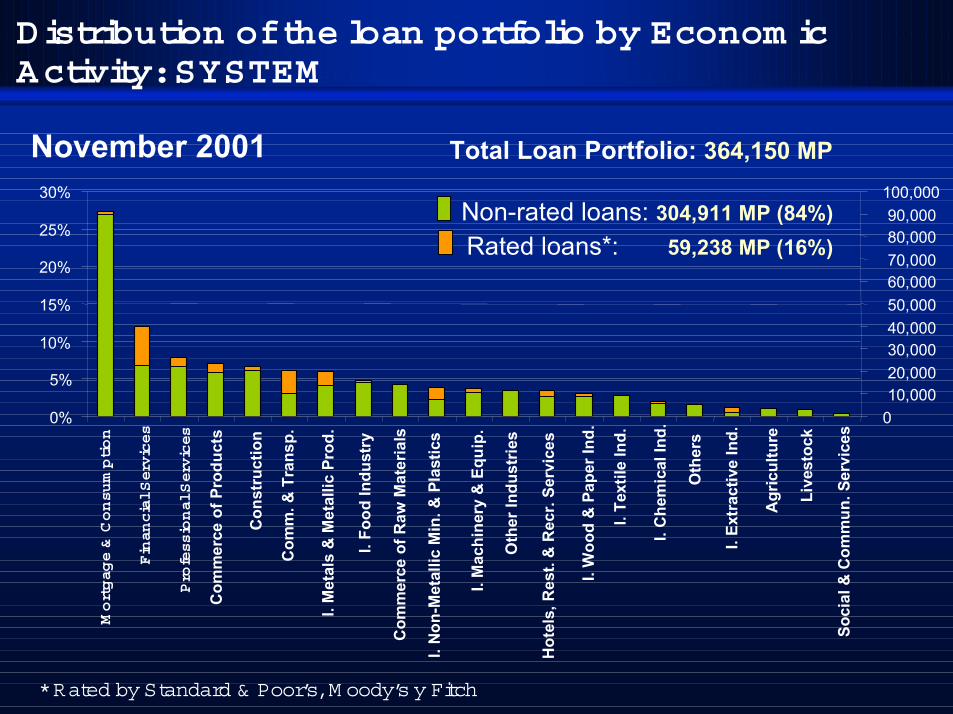
Distribution of the loan portfolio by Econom icActivity: SYSTEM
November 2001Mortgage & Consumption
Financial Services
Professional Services
Com
mer
ce o
f Pro
duct
s
Con
stru
ctio
n
Com
m. &
Tra
nsp.
I. M
etal
s &
Met
allic
Pro
d.
I. Fo
od In
dust
ry
Com
mer
ce o
f Raw
Mat
eria
ls
I. N
on-M
etal
lic M
in. &
Pla
stic
s
I. M
achi
nery
& E
quip
.
Oth
er In
dust
ries
Hot
els,
Res
t. &
Rec
r. Se
rvic
es
I. W
ood
& P
aper
Ind.
I. Te
xtile
Ind.
I. C
hem
ical
Ind.
I. Ex
trac
tive
Ind.
Agr
icul
ture
Live
stoc
k
Soci
al &
Com
mun
. Ser
vice
s
Oth
ers
Non-rated loans: 304,911 MP (84%) Rated loans*: 59,238 MP (16%)
* Rated by Standard & Poor’s, M oody’s y Fitch
0%
5%
10%
15%
20%
25%
30%
010,00020,00030,00040,00050,00060,00070,00080,00090,000
100,000
Total Loan Portfolio: 364,150 MP
I. I. IntroductionIntroduction
II.II. CyRCE m odelCyRCE m odel
•• System ic Credit Risk analysisSystem ic Credit Risk analysis
III.IIII.I PositionPosition
III.II VaR analysisIII.II VaR analysis
Index
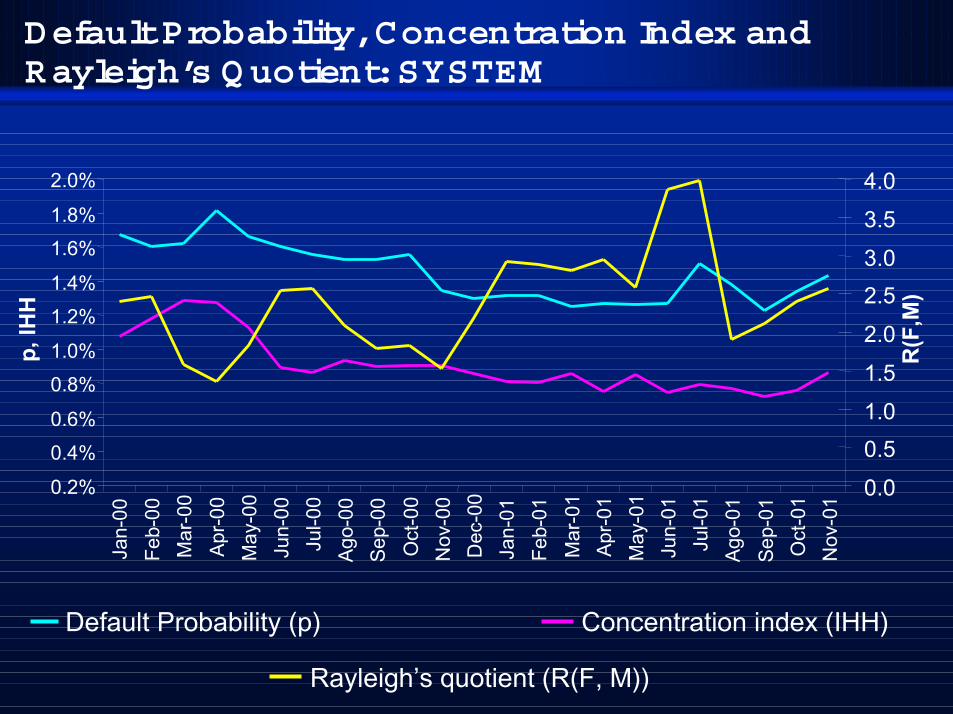
Default Probability, Concentration Index andRayleigh’s Q uotient: SYSTEM
0.2%
0.4%0.6%
0.8%1.0%
1.2%1.4%
1.6%1.8%
2.0%
Jan-
00Fe
b-00
Mar
-00
Apr-0
0M
ay-0
0Ju
n-00
Jul-0
0Ag
o-00
Sep-
00O
ct-0
0N
ov-0
0D
ec-0
0Ja
n-01
Feb-
01M
ar-0
1Ap
r-01
May
-01
Jun-
01Ju
l-01
Ago-
01Se
p-01
Oct
-01
Nov
-01
p, IH
H
0.0
0.51.01.5
2.0
2.53.0
3.54.0
R(F
,M)
Concentration index (IHH)Default Probability (p)
Rayleigh’s quotient (R(F, M))
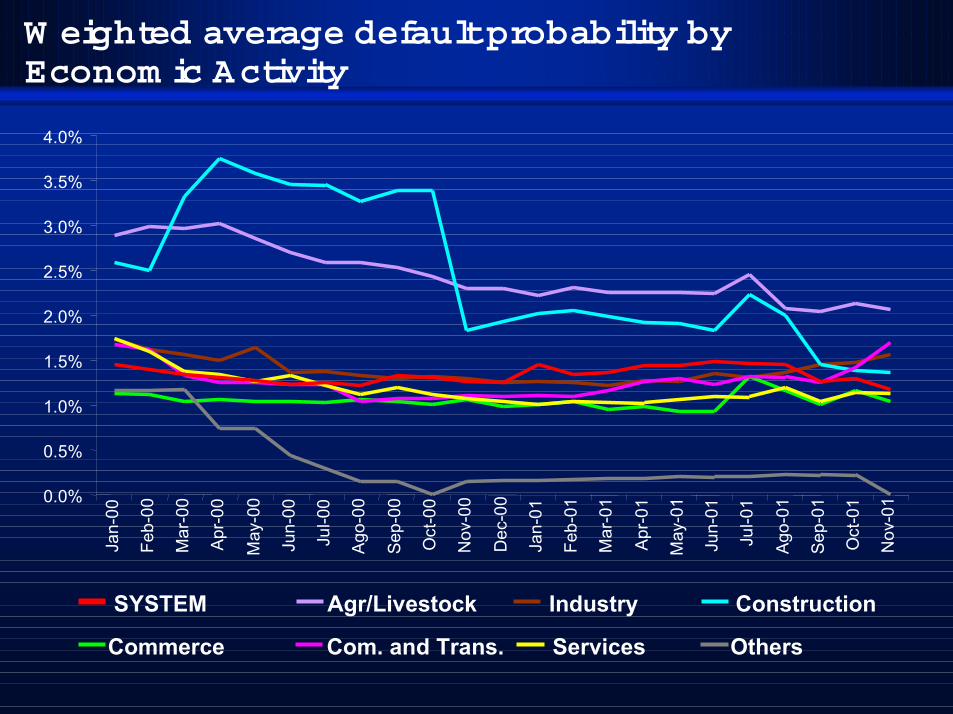
W eighted average default probability byEconom ic Activity
SYSTEM Agr/Livestock Industry Construction
Commerce Com. and Trans. Services Others
0.0%
0.5%
1.0%
1.5%
2.0%
2.5%
3.0%
3.5%
4.0%Ja
n-00
Feb-
00
Mar
-00
Apr-0
0
May
-00
Jun-
00
Jul-0
0
Ago-
00
Sep-
00
Oct
-00
Nov
-00
Dec
-00
Jan-
01
Feb-
01
Mar
-01
Apr-0
1
May
-01
Jun-
01
Jul-0
1
Ago-
01
Sep-
01
Oct
-01
Nov
-01
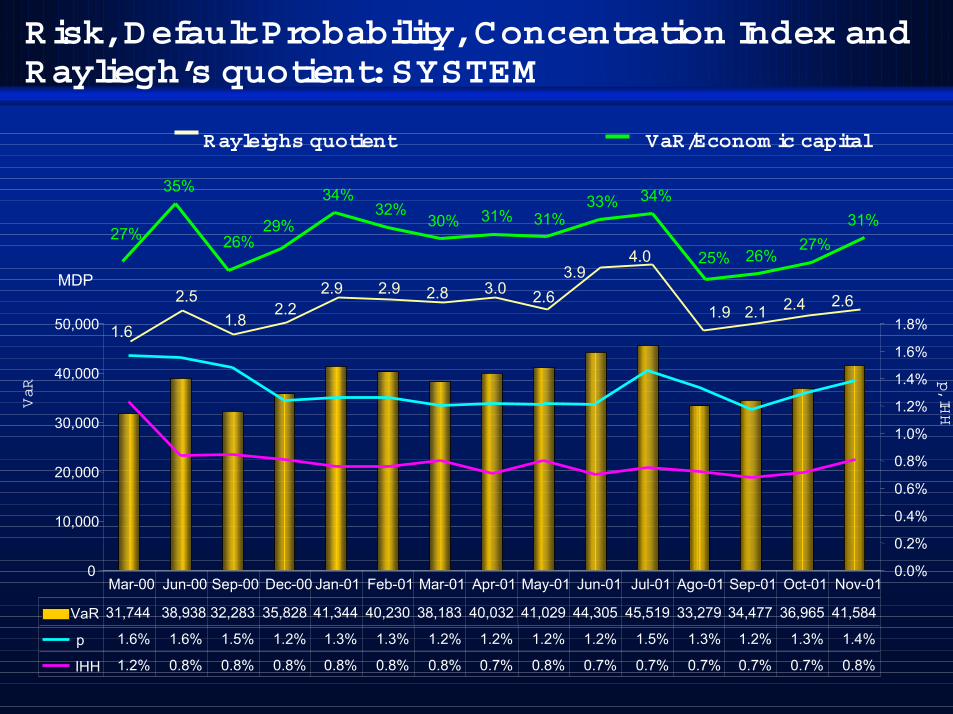
Risk, Default Probability, Concentration Index andRayliegh’s quotient: SYSTEM
VaR/Econom ic capital
27%
35%
26%29%
34%32%
30% 31% 31%33% 34%
25% 26%27%
31%
0
10,000
20,000
30,000
40,000
50,000
MDP
0.0%
0.2%
0.4%
0.6%
0.8%
1.0%
1.2%
1.4%
1.6%
1.8%
VaR 31,744 38,938 32,283 35,828 41,344 40,230 38,183 40,032 41,029 44,305 45,519 33,279 34,477 36,965 41,584
p 1.6% 1.6% 1.5% 1.2% 1.3% 1.3% 1.2% 1.2% 1.2% 1.2% 1.5% 1.3% 1.2% 1.3% 1.4%
IHH 1.2% 0.8% 0.8% 0.8% 0.8% 0.8% 0.8% 0.7% 0.8% 0.7% 0.7% 0.7% 0.7% 0.7% 0.8%
Mar-00 Jun-00 Sep-00 Dec-00 Jan-01 Feb-01 Mar-01 Apr-01 May-01 Jun-01 Jul-01 Ago-01 Sep-01 Oct-01 Nov-01
1.6
2.51.8
2.22.9 2.9 2.8 3.0 2.6
3.94.0
1.9 2.1 2.4 2.6
Rayleighs quotient
VaR p
, IHH
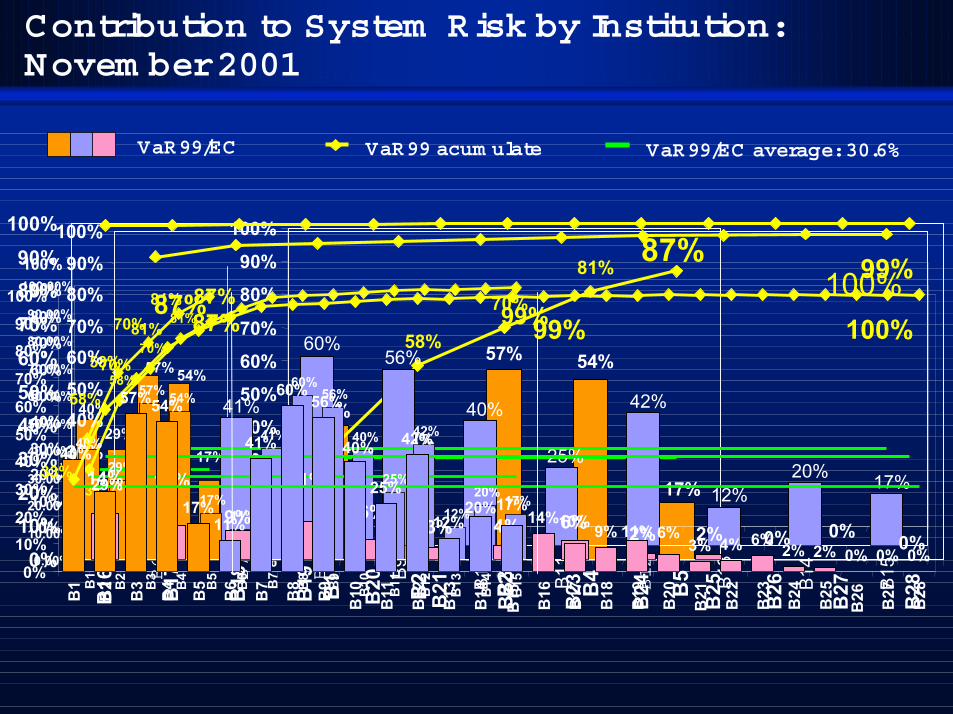
Contribution to System Risk by Institution:Novem ber 2001
VaR99/EC VaR99 acum ulate VaR99/EC average: 30.6%
54%57%
29%40%
17%33%
58%
70%
81%
0%10%20%
30%40%50%60%70%
80%90%
100%
B1
B2 B3
B4
B5
87%
40%29%
57% 54%
17%
81%70%
33%
58%
87%
0%10%20%30%40%50%60%70%80%90%
100%
B1
B2
B3 B4
B5
B6
B7
B8 B9 B10
B11
20%12%
42%
25%
40%
56%60%
41%
11%17%
99%
0%10%20%30%40%50%60%70%80%90%
100%
B12
B13
B14
B15
29%
57% 54%
17%11%
41%
60%56%
40%
25%
42%
12%20% 17%
40%
87%
58%
99%
33%
70%
81%
0.00%
10.00%
20.00%
30.00%
40.00%
50.00%
60.00%
70.00%
80.00%
90.00%
100.00%
B1
B2
B3
B4
B5
B6 B7
B8
B9
B10
B11
B12
B13
B14
B15
6%
14% 10%
9%
11%
3% 4% 6% 2% 2% 0% 0% 0%0%
10%20%30%40%50%60%70%80%90%
100%
B16 B17
B18
B19
B20
B21
B22
B23
B24
B25
B26
B27
B28
100%
57%54%
17%11%
41%
60%
25%
42%
12% 14%9%
3% 4% 6% 2% 2% 0% 0% 0%6%11%10%
17%
40%
29%
40%
20%
56%
87%
58%
33%
70%
81%
0%10%20%30%40%50%60%70%80%90%
100%
B1
B2
B3 B4
B5
B6
B7
B8
B9
B10
B11
B12
B13
B14
B15 B16 B17
B18
B19
B20
B21 B22
B23 B24
B25
B26 B27
B28
100%99%
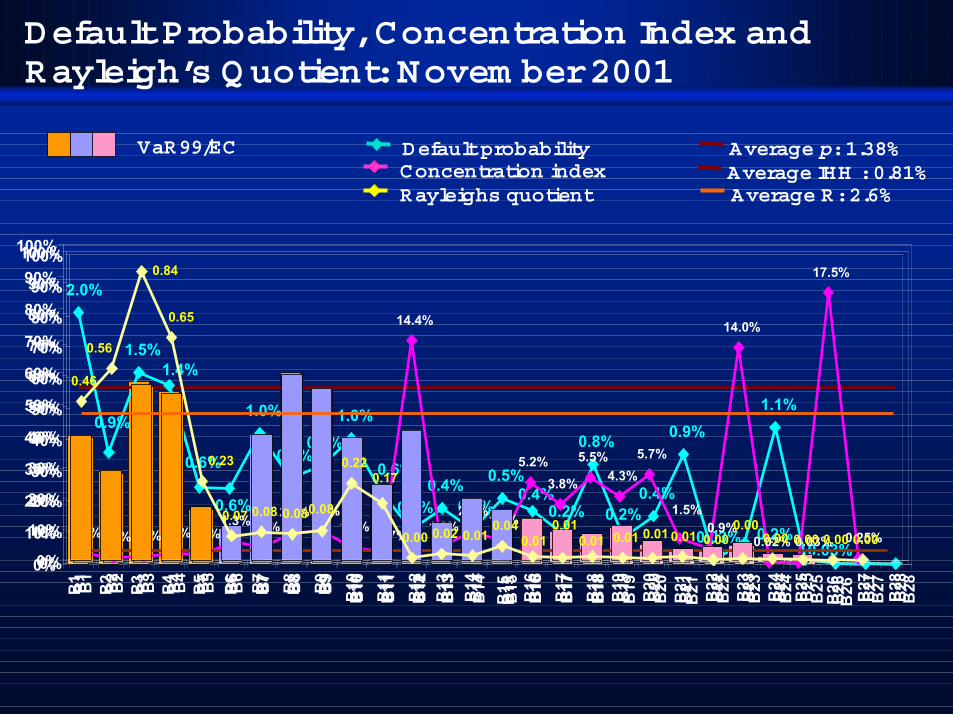
Default Probability, Concentration Index andRayleigh’s Q uotient: Novem ber 2001
VaR99/EC Average p: 1.38% Default probability
2.0%
0.9%
1.5%1.4%
0.6%
0.6%
1.0%
0.7%0.8%
1.0%
0.6%
0.3%0.4%
0.3%
0.5%0.4%
0.2%
0.8%
0.2%0.4%
0.9%
0.2%
1.1%
0.03%0.03%
0%
10%
20%
30%
40%
50%
60%
70%
80%
90%
100%
B1
B2
B3 B4
B5
B6
B7
B8
B9
B10
B11
B12 B13
B14
B15
B16
B17
B18
B19 B20
B21 B22
B23
B24
B25
B26 B27
B28
Average IHH : 0.81% Concentration index
0.6%0.3%0.4%0.6%0.5%1.3%1.0%
2.0%2.0%1.0% 0.7%
14.4%
1.0%2.0%1.4%
5.2%3.8%
5.5%4.3%
5.7%
0.9%
14.0%
17.5%
0.03% 0.25%0.02%
1.5%
0%
10%
20%
30%
40%
50%
60%
70%
80%
90%
100%
B1
B2 B3
B4
B5
B6 B7
B8
B9
B10
B11 B12
B13
B14
B15 B16
B17
B18 B19 B20
B21 B22
B23
B24 B25
B26 B27
B28
Rayleighs quotient Average R: 2.6%
0.46
0.56
0.84
0.65
0.23
0.07 0.08 0.080.08
0.220.17
0.00 0.02 0.010.04
0.010.01
0.01 0.01 0.01 0.01 0.000.00
0.00 0.00 0.00 0.000%
10%
20%
30%
40%
50%
60%
70%
80%
90%
100%
B1
B2
B3
B4 B5
B6
B7
B8
B9
B10
B11
B12
B13 B14
B15 B16
B17
B18
B19 B20
B21 B22 B23
B24
B25
B26 B27
B28
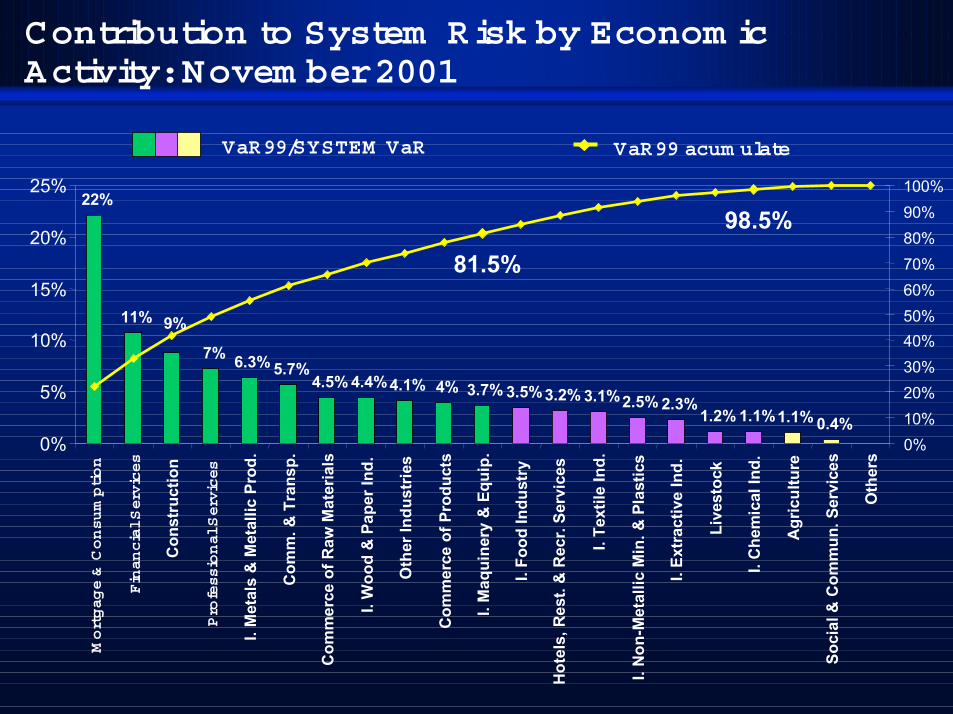
Contribution to System Risk by Econom icActivity: Novem ber 2001
VaR99 acum ulate VaR99/SYSTEM VaR
4.1% 3.7% 3.5%3.2% 3.1%2.5% 2.3%1.2% 1.1%1.1% 0.4%
6.3% 5.7%4.4%4.5%
22%
11% 9%
7%
4%
98.5%
81.5%
0%
5%
10%
15%
20%
25%
Mortgage & Consumption
Financial Services
Con
stru
ctio
n
Professional Services
I. M
etal
s &
Met
allic
Pro
d.
Com
m. &
Tra
nsp.
Com
mer
ce o
f Raw
Mat
eria
ls
I. W
ood
& P
aper
Ind.
Oth
er In
dust
ries
Com
mer
ce o
f Pro
duct
s
I. M
aqui
nery
& E
quip
.
I. Fo
od In
dust
ry
Hot
els,
Res
t. &
Rec
r. Se
rvic
es
I. Te
xtile
Ind.
I. N
on-M
etal
lic M
in. &
Pla
stic
s
I. Ex
trac
tive
Ind.
Live
stoc
k
I. C
hem
ical
Ind.
Agr
icul
ture
Soci
al &
Com
mun
. Ser
vice
s
Oth
ers
0%10%20%30%40%50%60%70%80%90%100%
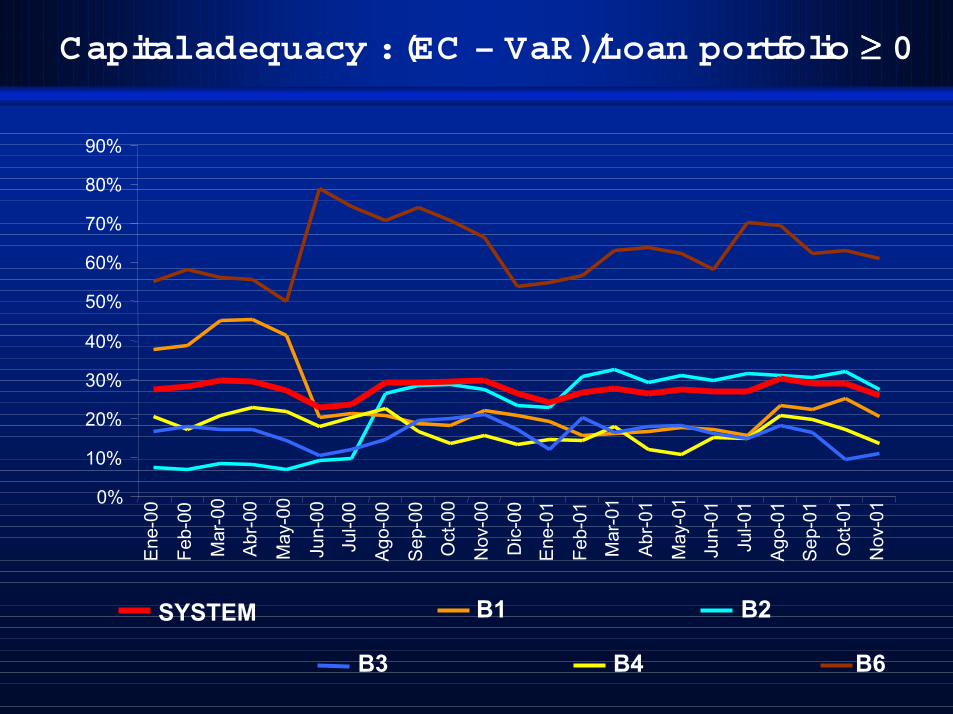
Capital adequacy : (EC – VaR)/Loan portfolio ≥≥≥≥ 0
B2 B1
B4 B6B3
SYSTEM
0%
10%
20%
30%
40%
50%
60%
70%
80%
90%En
e-00
Feb-
00
Mar
-00
Abr-0
0
May
-00
Jun-
00
Jul-0
0
Ago-
00
Sep-
00
Oct
-00
Nov
-00
Dic
-00
Ene-
01
Feb-
01
Mar
-01
Abr-0
1
May
-01
Jun-
01
Jul-0
1
Ago-
01
Sep-
01
Oct
-01
Nov
-01

END


