Open Access2008Peña-Castilloet al.Volume 9, Suppl 1, Article S2ResearchA critical assessment of Mus musculus gene function prediction using integrated genomic evidenceLourdes Peña-Castillo1, Murat Taşan2, Chad L Myers3, Hyunju Lee4, Trupti Joshi5, Chao Zhang5, Yuanfang Guan3, Michele Leone6, Andrea Pagnani6, Wan Kyu Kim7, Chase Krumpelman8, Weidong Tian2, Guillaume Obozinski9, Yanjun Qi10, Sara Mostafavi11, Guan Ning Lin5, Gabriel F Berriz2, Francis D Gibbons2, Gert Lanckriet12, Jian Qiu13, Charles Grant13, Zafer Barutcuoglu14, David P Hill15, David Warde-Farley11, Chris Grouios1, Debajyoti Ray16, Judith A Blake15, Minghua Deng17, Michael I Jordan18, William S Noble19, Quaid Morris1,11,20, Judith Klein-Seetharaman21, Ziv Bar-Joseph10, Ting Chen22, Fengzhu Sun22, Olga G Troyanskaya3, Edward M Marcotte7, Dong Xu5, Timothy R Hughes1,20 and Frederick P Roth2,23
Addresses: 1Donnelly Centre for Cellular and Biomolecular Research, University of Toronto, Toronto, ON M5S3E1, Canada. 2Department of Biological Chemistry and Molecular Pharmacology, Harvard Medical School, Boston, MA 02115, USA. 3Lewis-Sigler Institute for Integrative Genomics and Department of Molecular Biology, Princeton University, Princeton, NJ 08544, USA. 4Department of Information and Communications, Gwangju Institute of Science and Technology, Gwangju, 500-712 Republic of Korea. 5Digital Biology Laboratory, Computer Science Department and Christopher S Bond Life Sciences Center, University of Missouri, Columbia, MO 65211, USA. 6ISI Foundation, Torino, 10133, Italy. 7Center for Systems and Synthetic Biology, Institute for Cellular and Molecular Biology, University of Texas at Austin, Austin, TX 78712, USA. 8Department of Electrical and Computer Engineering, Institute for Cellular and Molecular Biology, University of Texas at Austin, Austin, TX 78712, USA. 9Department of Statistics, UC Berkeley, Berkeley, CA 94720-3860, USA. 10School of Computer Science, Carnegie Mellon University, Pittsburgh, PA 15213, USA. 11Department of Computer Science, University of Toronto, Toronto, ON M5S3G4, Canada. 12Department of Electrical and Computer Engineering, UC San Diego, La Jolla, CA 92093-0407, USA. 13Department of Genome Sciences, University of Washington, Seattle, WA 98195-5065, USA. 14Department of Computer Science, Princeton University, Princeton, NJ 08544, USA. 15Bioinformatics and Computational Biology, The Jackson Laboratory, Bar Harbor, ME 04609, USA. 16Gatsby Computational Neuroscience Unit, London, WC1N 3AR, UK. 17School of Mathematical Sciences and Center for Theoretical Biology, Peking University, Beijing 100871, PRC. 18Department of Electrical Engineering and Computer Science, and Department of Statistics, UC Berkeley, Berkeley, CA 94720-1776, USA. 19Department of Genome Sciences, and Department of Computer Science and Engineering, University of Washington, Seattle, WA 98195, USA. 20Banting and Best Department of Medical Research, University of Toronto, Toronto, ON M5S 3E1, Canada. 21Department of Structural Biology, University of Pittsburgh School of Medicine, Pittsburgh, PA 15260, USA. 22Molecular and Computational Biology Program, Department of Biological Sciences, University of Southern California, Los Angeles, CA 90089, USA. 23Center for Cancer Systems Biology, Dana-Farber Cancer Institute, Boston, MA 02115, USA.
Background: Several years after sequencing the human genome and the mouse genome, muchremains to be discovered about the functions of most human and mouse genes. Computationalprediction of gene function promises to help focus limited experimental resources on the mostlikely hypotheses. Several algorithms using diverse genomic data have been applied to this task inmodel organisms; however, the performance of such approaches in mammals has not yet beenevaluated.
Results: In this study, a standardized collection of mouse functional genomic data was assembled;nine bioinformatics teams used this data set to independently train classifiers and generatepredictions of function, as defined by Gene Ontology (GO) terms, for 21,603 mouse genes; and thebest performing submissions were combined in a single set of predictions. We identified strengthsand weaknesses of current functional genomic data sets and compared the performance of functionprediction algorithms. This analysis inferred functions for 76% of mouse genes, including 5,000currently uncharacterized genes. At a recall rate of 20%, a unified set of predictions averaged 41%precision, with 26% of GO terms achieving a precision better than 90%.
Conclusion: We performed a systematic evaluation of diverse, independently developedcomputational approaches for predicting gene function from heterogeneous data sources inmammals. The results show that currently available data for mammals allows predictions with bothbreadth and accuracy. Importantly, many highly novel predictions emerge for the 38% of mousegenes that remain uncharacterized.
BackgroundDetermination of gene function is a central goal of modernbiology, and is a starting point for detailed mechanistic stud-ies. Computational approaches can provide predictions ofgene function based on the integration of heterogeneous datasources [1-10]. These predictions can serve as a principledmethod of 'triage', focusing experimental resources on thehypotheses (predictions) that are more likely to be true.Moreover, predictions that are associated with measures ofconfidence allow experimental biologists to adjust thenumber of predictions they are willing to consider based onthe trade-off between false positive rate, the importance ofthe biological question, and the cost of follow-up experi-ments. For example, mouse researchers have been faced foryears with the problem of deciding which genes to mutate inreverse-genetic studies, and the problem of deciding whichphysiological and molecular phenotypes to assay for eachmutant strain. Today, there are thousands of Gene Trap alle-les [11], and within a few years investigators will have accessto a virtually complete collection of engineered knockouts[12]. Issues of both expense and ethics that are associatedwith model organism experiments motivate the thoughtfuljustification of planned experiments.
Several algorithms have been applied to heterogeneous datasources to predict gene function [1-10,13], with the integra-tion of these sources clearly improving prediction perform-ance [14,15]. However, these studies have been primarilyfocused on the yeast Saccharomyces cerevisiae and othernon-mammalian model organisms [16-18], and it has not
been clear how well such algorithms will scale to the largegenomes and networks of mammals, despite the basicgenetic, biochemical and cellular organizational principlesthat are shared across the eukaryotic kingdom [19-21]. More-over, it is unclear whether accurate function predictions canbe made given the amount and quality of genomic and func-tion annotation data available for mammals. (Although geneswith even a single annotation are often referred to as genes of'known function', only a minority has been exhaustively stud-ied. Therefore, most 'known function' genes are still incom-pletely annotated.) Although comparisons usingstandardized data sets and performance criteria are the bestway to assess the strengths and weaknesses of the algorithmsemployed [22-24], our ability to predict gene function usingintegrated genomic data has not been systematically com-pared in this way across multiple bioinformatics groups inany organism.
We assembled a large collection of Mus musculus data, inde-pendently developed nine different computational methodsusing these data to predict gene functions, and compared thepredictive performance of each submission using held-outgenes, a prospective evaluation, and a focused literature-based assessment of the top novel predictions. We have pro-vided confidence scores and estimates of prediction accuracy(precision) at different levels of sensitivity (recall), and com-bined the best submissions in a single set of predictions. Wereport thousands of predicted functions for mouse genes thatare supported by multiple data types and algorithms, andshare the results via a web resource that facilitates searching
and browsing in the context of the underlying supporting evi-dence.
This community effort has suggested new function assign-ments or refinements of previous annotations for the major-ity of mouse genes. Based on a prospective evaluation ofentirely novel predictions, including many for uncharacter-ized (without any function annotations) genes, we expect thatpredictions provided here will productively guide furtherexperimentation towards more likely hypotheses.
ResultsOrganization of a community function prediction comparisonThe overall structure of our study was to provide groups ofinvestigators (participants) with a collection of data sets inwhich the gene identifiers were standardized and associatedwith known functional annotations. The participants thenused their algorithms to assign a score reflecting confidencein whether each gene had each function. To enable evaluationof the results, and to calibrate confidence scores for novel pre-dictions within each category, a subset of genes with knownfunctions was 'held out' (that is, function annotations werenot given to the participants).
We therefore began by assembling an extensive collection ofM. musculus data, including gene expression across multipletissues, protein sequence pattern annotations, protein-pro-tein interactions, phenotype annotations, disease associa-tions (of human orthologs), gene function annotations, andphylogenetic profiles from a variety of publicly availablesources. (Table 1 summarizes the data sources; for a fulldescription of the data see the references cited in Table 1.)These data sets were chosen because they encompass manygenes, and have been shown to contain information reflectinggene function [7,21,25-27]. Protein interaction data include'interologs' transferred from other organisms via orthology[28,29]. To avoid circularity, the data collection did notdirectly include protein or DNA sequences, since homologywas employed in establishing many of the annotations, butallowed sequenced-based inference indirectly via phyloge-netic profiles and matches to protein sequence patterns. Thecomplete data collection is available from the MouseFunc Iwebsite [30].
To integrate these diverse data sets and associate them withfunctional annotations, we mapped the gene (or gene prod-uct) identifiers used in each data set to a common set ofMouse Genome Informatics (MGI) gene identifiers (asdefined 21 February 2006), which are, in turn, associatedwith Gene Ontology (GO) terms curated by MGI [31,32].Thus, annotations for each gene were the union of annota-tions made to the set of the gene products for that gene. Weexcluded GO annotations based solely on the 'inferred fromelectronic annotation' (IEA) evidence code, since many of
these annotations are themselves computational predictionsthat have not been reviewed by a curator [33]. We alsoexcluded GO terms with too few training examples, that is,those annotated to fewer than three genes in the training set,expecting that it would be extremely difficult for current clas-sifiers to deal with such a limited number of positive trainingexamples. To focus on predictions most likely to suggest spe-cific follow-up experiments, we considered only GO termsassociated with 300 or fewer mouse genes in the training set.(This threshold was chosen by manually examining GO termsranked in descending order by the number of genes currentlyannotated to each term, and subjectively assessing whetherpredictions of that GO term would immediately suggest a fol-low-up validation experiment.) The final data collection con-tained information on 21,603 MGI genes, of which 8,506were associated with at least one of the 2,815 individual GOterms we considered.
An invitation to participate in this assessment was circulatedamong research groups known to work in gene function pre-diction. Nine groups ultimately participated by submittingpredictions. (For a brief description of the methods used byeach, see Table 2; for more details see Additional data files 20and 21.) The data and annotations were distributed in a formintended to prevent participants from using additional datasources, and to enable cross-validation. First, data were dis-tributed to participants in an 'anonymized' form, with eachMGI gene identifier replaced with a randomly generatedidentifier and presented to participants in permuted order.Thus, participants made predictions without knowing thegene identities or any gene information outside the trainingdata. Second, annotations were omitted for a randomlyselected 10% of genes (the 'held-out set').
Each group developed and implemented their predictionmethodology independently. Each submission was required,for each gene-GO term combination, to include a score (rang-ing from 0 to 1) reflecting prediction confidence. The data col-lection was released in July 2006 (with GO annotationsobtained from the GO website on 17 February 2006; version1.612). Initial prediction results were submitted in October2006, with seven groups submitting complete prediction sets.After viewing performance measures (but not gene identitiesor information on the veracity of any specific prediction), itwas noted that some groups did not provide a complete set ofpredictions; also, one group withdrew their predictions upondiscovering a coding error. In an effort to increase thenumber and quality of submitted predictions, all groups weregiven the opportunity to alter their methods and submit newpredictions for a second December 2006 deadline, and fivegroups did so.
Performance evaluationTo evaluate each set of predictions, we first used the set ofheld-out genes. GO annotations are an evolving target (anno-tations are continuously added, deleted, and modified),
which enabled us also to perform a prospective evaluation.For this purpose, we also identified the set of genes that hadnewly acquired an association to a GO term during the eightmonths since downloading of the version of MGI GO annota-tion used in training. The GO annotations used for prospec-tive evaluation were obtained from the GO website on 20October 2006 (version 1.641). To obtain a baseline perform-ance against which to compare predictions from eachapproach, we employed a naïve Bayes 'straw man' approach.To train this 'straw man' classifier, we used the six sets ofbinary gene features that are natively in the (gene, property)form, and did not use feature selection (Additional data file21). We assessed success for each GO term using area underthe receiver operating characteristic (ROC) curve (AUC) [34];precision was assessed at several fixed recall values (all meas-ures used are defined in Materials and methods). For evalua-tion purposes, we grouped GO terms in twelve evaluationcategories corresponding to all combinations of the three GObranches - Biological process, Molecular function, or Cellularcomponent - with four ranges of 'specificity', that is, thenumber of genes in the training set with which each term isannotated ({3-10}, {11-30}, {31-100}, and {101-300}).
Figure 1 shows some performance measures of the first roundof submissions. Note that team I submitted partial results andwas, therefore, not assessed for overall performance in eachevaluation category. Team E's results for the prospective eval-uation were based on a partial implementation of their algo-
rithm (see details in Additional data file 20, Box 5). Figure1a,b shows the mean AUC of GO terms within each evaluationcategory, evaluated using the held-out and newly annotatedgenes, respectively. Figure 1c,d shows for each submissionhow often its AUC value was significantly better (or worse)than the AUC value of another submission. We assessed sig-nificance of difference in AUC between two submissions foreach GO term (α = 0.05) using a Z-test [34].
In this analysis, most submissions beat the 'straw man' in allcategories (both by mean AUC and by number of wins andlosses); however, the overall differences among groups werenot dramatic. (See Additional data file 1 for a summary of thenumber of significant wins and losses per evaluation cate-gory.) The complete set of performance measures evaluatedwith the held-out gene set may be found in Additional datafile 7 (initial predictions) and Additional data file 9 (revisedpredictions), while the corresponding prospective evaluationresults may be found in Additional data files 8 and 10. Per-formance measures reported here are conservative in thesense that false positive predictions (genes predicted as hav-ing a GO term that were not currently annotated with that GOterm) may actually be correct but not yet annotated as such.
In contrast to AUC, the precision at fixed recall values wasdramatically higher for all submissions than for the 'strawman'; Figure 1e,f shows the proportion of GO annotationsreaching various precision values at 20% recall (a threshold
Table 1
Data collection description: summary of the data sources
Data type Description Representation
Gene expression Expression data from oligonucleotide arrays for 13,566 genes across 55 mouse tissues (Zhang et al. [21])
Median-subtracted, arcsinh intensity measurements
Expression data from Affymetrix arrays for 18,208 genes across 61 mouse tissues (Su et al. [44])
gcRMA-condensed intensity measurements
Tag counts at quality 0.99 cut-off from 139 SAGE libraries for 16,726 genes [45]
Average and total tag counts
Sequence patterns Protein sequence pattern annotations from Pfam-A (release 19) for 15,569 genes with 3,133 protein families [46]
Binary annotation patterns
Protein sequence pattern annotations from InterPro (release 12.1) for 16,965 genes with 5,404 sequence patterns [47]
Binary annotation patterns
Protein interactions Protein-protein interactions from OPHID for 7,125 genes [28] (downloaded on 20 April 2006)
Binary interaction patterns and shortest path between genes
Phenotypes Phenotype annotations from MGI for 3,439 genes with 33 phenotypes [48] (downloaded on 21 February 2006 from [49])
Binary annotation patterns
Conservation profile Conservation pattern from Ensembl (v38) for 15,939 genes across 18 species [50]
Binary conservation patterns and conservation scores
Conservation pattern from Inparanoid (v4.0) for 15,703 genes across 21 species [51]
Binary conservation patterns and Inparanoid scores
Disease associations Disease associations from OMIM for 1,938 genes to 2,488 diseases/phenotypes [52,53] (downloaded on 6 June 2006 from [54])
Binary annotation patterns
gcRMA, robust multi-array analysis with background adjustment for GC content of probes; OMIM, Online Mendelian Inheritance in Man; OPHID, Online Predicted Human Interaction Database; SAGE, serial analysis of gene expression.
selected as 'midrange' for display). Additional data file 2shows the mean precision at 20% recall for GO terms withineach evaluation category, evaluated using both held-out andnewly annotated genes. Due to the small number of positives(genes carrying a given annotation) relative to negatives(genes that do not carry the annotation), this characteristicwould usually be reflected only in the very left part of theROC, and is not generally captured by the more commonlyused AUC measure. However, precision is a more relevantmeasure to many end users, since it reflects the proportion ofvalidation experiments for top-scoring predictions that wouldprove successful.
Performance of all submissions differed markedly dependingon whether evaluation was on the held-out genes or on newlyannotated genes (Figure 1a,c,e compared with Figure 1b,d,f),
suggesting that emerging annotations are qualitatively differ-ent from a random sample of previously existing annotations- a variable that is only rarely considered in large-scale pre-dictions of gene function.
In fact, the main type of evidence supporting the annotationsdiffers between the new and the held-out annotations; while50% and 2.5% of newly acquired annotations were derivedfrom sequence or structural similarity (ISS) and reviewedcomputational analysis (RCA), respectively, the correspond-ing proportions for held-out annotations were 9% and 31%(Additional data file 3).
Figure 2 shows the performance of the second round of sub-missions (Additional data file 2). In most cases, revised pre-dictions slightly outperform the original ones. All subsequent
Table 2
Brief description of function prediction methods used
Submissionidentifier
Approach Name Author initials
A Compute several kernel matrices (SVM) for each data matrix, train one GO term specific SVM per kernel, and map SVMs' discriminants to probabilities using logistic regression
Calibrated ensembles of SVMs GO, GL, JQ, CG, MJ, and WSN
B Four different kernels are used per data set. Integration of best kernels and data sources is done using the kernel logistic regression model
Kernel logistic regression [55] HL, MD, TC, and FS
C Construct similarity kernels, assign a weight to each kernel using linear regression, combine the weighted kernels, and use a graph based algorithm to obtain the score vector
geneMANIA SM, DW-F, CG, DR, and QM
D Train SVM classifiers on each GO term and individual data sets, construct several Bayesian networks that incorporate diverse data sources and hierarchical relationships, and chose for each GO term the Bayes net or the SVM yielding the highest AUC
Multi-label hierarchical classification [56] and Bayesian integration
YG, CLM, ZB, and OGT
E Combination of an ensemble of classifiers (naïve Bayes, decision tree, and boosted tree) with guilt-by-association in a functional linkage network, choosing the maximum score
Combination of classifier ensemble and gene network
WKK, CK, and EMM
F Code the relationship between functional similarity and the data into a functional linkage graph and predict gene functions using Boltzmann machine and simulated annealing
GeneFAS (gene function annotation system) [2,3]
TJ, CZ, GNL, and DX
G Two methods with scores combined by logistic regression: guilt-by-association using a weighted functional linkage graph generated by probabilistic decision trees; and random forests trained on all binary gene attributes
Funckenstein WT, MT, FDG, and FPR
H Pairwise similarity features for gene pairs were derived from the available data. A Random Forest classifier was trained using pairs of genes for each GO term. Predictions are based on similarity between the query gene and the positive examples for that GO term
Function prediction through query retrieval
YQ, JK, and ZB
I Construct an interaction network per data set, merge data set graphs into a single graph, and apply a belief propagation algorithm to compute the probability for each protein to have a specific function given the functions assigned to the proteins in the rest of the graph
Function prediction with message passing algorithms [57]
ML and AP
AUC, area under the receiver operating characteristic curve; GO, Gene Ontology.
Measures of performance for the initial round of GO term predictionsFigure 1Measures of performance for the initial round of GO term predictions. (a) Mean area under the receiver operating characteristic curve (AUC) within each evaluation category, evaluated using the held-out genes. Gene Ontology Biological process (GO-BP), Cellular component (GO-CC), and Molecular function (GO-MF) branches are indicated on the x-axis, grouped by specificity (indicated by the minimum number of genes in the training set associated with each GO term in a given category). Upper case letters associated with the color code correspond to submission identifier. (b) Mean AUC within each evaluation category, evaluated prospectively using newly annotated genes. (c) For each pair of submissions X and Y, we test for difference in AUC value for every GO term (evaluated using held-out genes). Color bars indicate fraction of pairwise comparisons for which X's AUC is significantly higher (blue), not significantly different (beige), and significantly lower (maroon). (d) As (c), except evaluated using the newly annotated genes. (e) The fraction of GO terms exceeding the indicated precision at 20% recall (P20R) value, evaluated using held-out genes. The black line corresponds to the fraction of GO terms for which the 'straw man' approach achieved the indicated precision. (f) As (e), except with P20R values derived prospectively from newly annotated genes.
Measures of performance for the second round of GO term predictionsFigure 2Measures of performance for the second round of GO term predictions. (a, b) As described in Figure 1a, b, except that the gray color area indicates performance in the first set of submissions. (c-f) As described in Figure 1c-f, except that asterisks in (c) and (d) indicate second-round submissions and dashed lines in (e) and (f) indicate the performance of an earlier submission by the same group. GO, Gene Ontology.
analyses described here used only one submission per group,choosing the most recent where there were two submissions.The complete evaluation results are available from theMouseFunc I website [30].
Factors affecting prediction performanceTo ask whether some data sets were more useful than others,and how their value might vary among evaluation categories,we applied a simple guilt-by-association approach similar toa previously described method [35]. The confidence score forgene X and GO term Y is simply the number of 'neighbors' ofX that are currently annotated with Y (see Materials andmethods). We evaluated performance after applying thismethod to only one data set at a time. Figure 3a shows preci-sion at 20% recall (P20R) values obtained by each submissionon every GO term, and by using each one of the data types asinput to the guilt-by-association approach. A striking obser-vation is that protein sequence pattern annotations are themost predictive data type overall and are especially useful forpredicting Molecular function GO terms. Expression data,and phenotype and disease associations are important con-tributors for more general Cellular component and Biologicalprocess GO terms. Moreover, interaction data comprise aremarkably useful evidence source, considering that only asmall proportion of protein interactions in mammals isknown. Figure 3a also indicates that hard to learn GO termsare the ones where there is absence of predictive power in alldata types. This is especially clear in the specificity range {3-10} in all GO branches. We also examined maximum coverage(number of genes present in a given data set with at least oneannotated 'neighbor' when using the simple guilt-by-associa-tion method), noting that this coverage allowed functionalassociations for at most 30% of the 21,603 genes to be pre-dicted given any single data set (Figure 3b).
Analysis of variance (ANOVA; Additional data file 11) verifiedwhat is clear from Figures 1a,b, 2a,b and 3a; the branch of theontology is the main factor to explain variance in perform-ance as shown in Figure 3c,d. Biological process GO terms,which reflect what biologists would typically consider to bephysiological function of genes and most related to pheno-types, are apparently more difficult to predict than Molecularfunction or Cellular component terms. As expected, morespecific GO terms in each evaluation category were more dif-ficult to predict.
To explore whether there were commonalities in pattern ofperformance among the submissions, we examined the corre-lations among P20R values and grouped the submissionsusing hierarchical clustering (Additional data file 4). Weidentified three pairs of submissions that were groupedtogether by several correlation measures (data not shown).These pairs of submissions were ('F', 'G'), ('A', 'B'), and ('C','D'). Submissions 'F' and 'G' both employ functional linkage,while submissions 'A' and 'B' are mainly kernel-based meth-ods. (Despite the fact that submissions 'E' and 'I' also used
functional linkage, their results were uncorrelated with 'F'and 'G'.) Submissions 'A', 'B', 'C', and 'D' each used weightedcombinations of diverse data sets, but neither 'A' nor 'B' gavehighly correlated results with 'C' or 'D'. Since all participantmethods combine several algorithms, require the use of mul-tiple parameters, and vary the procedure for feature designand selection, it is not surprising that differences in resultscannot be simply attributed to any one algorithmic choice.
To assess the stability of the prediction performance, wemeasured the performance variability in five randomly cho-sen subsets of the training data and measured the standarddeviations of AUC and P20R performance measures withineach evaluation category. The median standard deviations ofAUC and P20R across all evaluation categories were 0.01 and0.02, respectively, suggesting that our performance measureswere robustly determined (Additional data file 12).
One of the major challenges in training a classifier is overfit-ting, that is, generating models that precisely fit the idiosyn-crasies of training data at the expense of their accuracy whenapplied to new data. We assessed overfitting using a standardapproach - examining the extent to which performance esti-mates are exaggerated when one calculates them based on thetraining data rather than on the held-out test set (Additionaldata file 12). For example, Biological process GO terms withspecificity {31-100} had a mean P20R value that wasincreased by a factor of 1.3 (averaged over all submissions)when it was calculated based on the training data rather thanthe held-out gene set.
We note that submissions 'C', 'D' and 'G' are among the topperformers on most evaluation categories by various meas-ures. The performance of submission 'C' was particularlystrong with respect to AUC. Submission 'D' performs stablyacross the range of the number of genes annotated to each GOterm and its performance was especially good for prospectivepredictions. Submission 'G' has a strong performance in pre-cision across a range of recalls (Additional data files 5 and 6).Submission 'E' and 'H' perform better for the most specificevaluation categories. Thus, different methods had differentstrengths and no prediction method was clearly superior byevery criterion.
Integration of submissions in a single set of predictionsTo simplify subsequent analyses for ourselves and otherinvestigators, we derived a single set of prediction scores fromthe set of submitted scores. We unified the independent sub-missions for each evaluation category by adopting the scoresfrom the submission with the best P20R value for that evalu-ation category (evaluated using held-out genes). The com-bined predictions averaged 41% precision at 20% recall with26% of GO terms having a P20R value greater than 90%. Fig-ure 4 indicates the proportion of GO terms at different preci-sion and recall values. (Also see Additional data file 19;Additional data file 13 lists the precision achieved by the uni-
Factors affecting prediction performanceFigure 3Factors affecting prediction performance. (a) Precision at 20% recall (P20R) values evaluated using held-out annotations on all Gene Ontology (GO) terms (vertical axis) within each of the 12 evaluation categories for each submission (left panel) and for a simple guilt-by association using each data set in turn as its sole evidence source (right panel). The number of genes in each evaluation category is shown in parentheses. GO-BP, GO Biological process; GO-CC, GO Cellular component; GO-MF, GO Molecular function; NB, naïve Bayes. Data sets are described in Table 1. (b) Fraction of the 21,603 genes in the data collection with at least one annotated neighbor per data set. (c) Analysis of variance (ANOVA), exploring the effects of various factors on P20R values. (d) Fraction of total variance in P20R values that is explained by each effect. Asterisks in (c, d) indicate interaction between two factors.
Distribution of GO terms at several precision/recall performance pointsFigure 4Distribution of GO terms at several precision/recall performance points. Proportion of Gene Ontology (GO) terms per evaluation category with a precision/recall performance point that is both above and to the right of a given precision/recall point in the contour plots. GO-BP, GO Biological process; GO-CC, GO Cellular component; GO-MF, GO Molecular function.
fied predictions at several recall values for each GO term.) Toput this prediction performance into perspective, randompredictions for a GO term with 30 genes left to be identifiedwould be expected to yield a P20R value of 0.15%. In addition,these precision estimates are conservative since many predic-tions may ultimately prove correct despite not being currentlyannotated.
Impact of predictions among GO terms for which precision can be well estimatedTo gain insight into the potential impact of predictions on thecurrent state of gene function annotation, we more closelyexamined a subset of GO terms in the unified set of predic-tions. For each GO term, we established the lowest score atwhich a precision of 30% or better was achieved while recov-ering at least 10 true positives within the held-out test set(allowing precision to be well estimated). There were 71 GOterms with predictions meeting this criterion (tending to bethe less specific GO terms due to the number of required pos-itive genes in the training set). Figure 5 shows the number ofcurrently annotated and predicted genes for each GO term,including 9,429, 2,087, and 19,849 predictions in the Biolog-ical process, Cellular component, and Molecular functionbranches, respectively. (The maximum number of predictionsdisplayed was limited to 1,000.) This figure illustrates thepotential future impact of these predictions on the state offunction annotation should the expected 30% or more ofthese predictions prove true.
While Figure 5 shows the impact for more general GO terms,we note that performance for more specific GO terms was alsoquite good. For example, the mean P20R from the best-per-forming submission for the most specific {3-10} versus leastspecific {101-300} category was 21% versus 37%, 38% versus50%, and 51% versus 53% for Biological process, Cellularcomponent, and Molecular function branches, respectively.Thus, predictions for more specific GO terms offer a similarlyhigh impact on current function annotation (and there aremany more specific GO terms than general GO terms).
Predictions have varying degrees of novelty, ranging from 're-predictions' and 'refinement predictions' to 'highly novel'. Re-predictions are cases in which the gene is currently annotatedwith that GO term based solely on IEA evidence; these areoften unverified predictions made previously by others.Refinement predictions are cases in which the gene is cur-rently annotated with an ancestor of the predicted GO term.We describe all other predictions as 'highly novel'. Among thenumber of predictions displayed in Figure 5, the percentagesof refinements are 18%, 21%, and 17% for Biological process,Cellular component, and Molecular function branches,respectively, while the percentages of re-predictions are 43%,37%, and 32%. Thus, 3,677 (39%), 877 (42%), and 10,123(51%) predictions for Biological process, Cellular component,and Molecular function branches, respectively, were highlynovel.
Literature evaluation for top-scoring predictions with a high degree of noveltyTo gain intuition into the quality of those predictions with thehighest degree of novelty, we performed a focused literatureanalysis on highly novel top-scoring predictions. For this, weidentified the top three predictions from each of the twelveevaluation categories, excluding re-predictions and refine-ment predictions.
To avoid over-weighting particular GO terms or genes, wealso allowed only one prediction per evaluation category forany given gene or GO term. Investigators with extensive expe-rience with literature curation and knowledge of mouse genefunction (DPH and JAB) examined published literature relat-ing to these 36 high-scoring highly novel predictions, andscored each prediction according to the nature of publishedevidence. Additional data file 14 contains the list of highlynovel predictions investigated.
Out of the 36 high-scoring predictions examined, 21 (58%)were found to be true or likely to be true based on experimen-tal data reported in the literature. Since six other cases couldneither be confirmed nor refuted by current literature, weestimate that the true precision for top novel high-scoringpredictions lies between 58% and 75%. Of the 21 found to betrue, 9 (43%) were strongly supported but were not annotatedsimply because the literature had not yet been curated. Forexample, annotation of the gene encoding Slfn8 (schlafen 8)with the GO term 'negative regulation of cell proliferation' issupported [36], with evidence corresponding to the inferredfrom direct assay (IDA) evidence code [33]. This gene cur-rently does not have any functional annotation in the MGIsystem, and thus exemplifies the novel assignment of func-tion to unannotated genes.
Other reasonable annotations identified in this set of 36examples include 12 cases where the genes are members ofcharacterized gene families. It is likely that the genes play atleast a similar role as predicted, although the evidence is notstrong enough to support the annotation using GO Consor-tium annotation policy. An example of this is the mouse gene4930430D24Rik, which is predicted to be involved in biolog-ical process 'protein amino acid methylation'. This gene isdefined solely by cDNA clone data and has no experimentalinformation associated with it. However, it has sequence sim-ilarity with the gene encoding Btg1, which has been docu-mented as interacting with protein methyl transferases.
Another 6 cases (17%) of the 36 examined could be neitherconfirmed nor refuted by current literature. For example, thegene Klhl12 (encoding Kelch-like 12) was associated with thecellular component term 'stress fiber'. This gene is homolo-gous to members of the kelch family of genes found in Dro-sophila. The Drosophila gene products are found in a varietyof cellular locations. Although some members of this familyregulate stress fiber formation through the Ras pathway,
Number of high-precision predictions among GO terms for which precision can be confidently estimatedFigure 5Number of high-precision predictions among GO terms for which precision can be confidently estimated. Number of currently annotated (green) versus predicted genes (orange, predictions expected to be correct; gray, predictions expected to be incorrect) for a subset of Gene Ontology (GO) terms for which 30% precision on held-out annotations was achieved while recovering at least 10 positives in the held-out set. The number of predicted genes displayed was limited to 1,000. GO terms were ordered according to similarity of prediction/annotation patterns. Terminal digits of GO term identifiers are shown in parentheses. GO-BP, GO Biological process; GO-CC, GO Cellular component; GO-MF, GO Molecular function.
there is evidence that the human ortholog binds proteins in avariety of locations and that this protein functions in the con-text of the ubiquitin E3 ligase complex. As a result, we cur-rently cannot infer cellular location of this gene product andthereby judge the prediction.
The remaining 9 (25%) of the 36 predictions examined wereconsidered to be incorrect based on current literature (seeAdditional data file 14 for the list of predictions investigated).For example, the gene Grm4 (encoding the metabotropicglutamate receptor 4) is predicted to have the molecular func-tion 'calcium channel regulator activity'. However, althoughother G protein coupled receptors regulate calcium levels,there is no current evidence that this gene functions in thisway.
Taken together, these results suggest that high-scoring pre-dictions based on large-scale data integration comprise apromising resource to guide both curators and experimental-ists to correct hypotheses about gene function in mammals.
A resource for browsing predictions and underlying evidenceSo that researchers may browse predictions and gain intui-tion about evidence that underlies predicted annotations, anonline resource allowing browsing by GO term or gene isavailable [37]. To facilitate follow-up experimental study, thisresource contains links to existing Gene Trap alleles availableas heterozygous mouse embryonic stem cell lines.
Illustration of the evidence underlying predictions for two GO termsTo gain insight into the prediction process and the nature ofsupporting evidence, we examined predictions for two spe-cific GO terms in greater detail. Genes currently annotatedwith 'Cell adhesion' (Figure 6) and 'Mitochondrial part' (Fig-ure 7) are shown together with genes newly predicted to havethese GO terms, in the context of supporting evidence. TheseGO terms were chosen to illustrate different facets of biologyand the utility of multiple data types. Based on the predictivepower of each data source in isolation, protein sequence pat-tern annotations are the most useful source to predict genesinvolved in cell adhesion, while gene expression data aremore relevant for predictions of mitochondrial part. (Thevalue of each data set is based on precision of predictions at20% recall based solely on that data set, considering genespresent in each data set.)
To further validate mitochondrial part predictions, we askedif mitochondrially localized proteins (according to [38]) wereenriched among mitochondrial part predictions. Indeed, outof 108 mitochondrial part predictions with available data[38], 83 were mitochondrially localized (P = 2.3 × 10⁻⁷; cumu-lative hypergeometric test). Additional data file 15 containsmitochondrial part predictions with available mitochondriallocalization data [38].
Figures 6 and 7 illustrate that, as intuitively expected, the pat-terns of expression and other data types among genes anno-tated and predicted in these categories are quite similar. Inaddition, the graph formed by protein interactions amongannotated and predicted genes contains a connected compo-nent (that is, a subset of nodes that are mutually connected bysome path) that is larger than expected by chance (P <0.0001; based on a permutation test of 10,000 random net-works). Collectively, this figure illustrates the origin of predic-tions within diverse genomic and proteomic evidence (seeAdditional data files 16 and 17 for the data underlying Figures6 and 7).
DiscussionPrediction confidence scores fall along a continuum from 0(predicted not to be true) to 1 (predicted to be true). Whethera score between 0 and 1 should be treated as a prediction foror against the annotation (or as a non-prediction) depends onthe user's application-dependent trade-off between precisionand recall, and an expert biologist may wish to filter the listfurther based on their knowledge and intuition before pro-ceeding to carry out experiments. Users performing medium-scale genomic experiments may favor recall over precisionand select predictions using a higher recall threshold wherethe search space (and costs) will be reduced without losingrecall. Alternatively, users requiring higher precision can takeonly the top few predictions.
The performance differences among the methods examinedhere could have a substantial practical impact. For example,suppose a user plans to order ten mouse mutant strains at acost of $10,000 each to assay a physiological phenotypecaused by 20 unidentified genes. Since the combined predic-tions averaged 41% precision at 20% recall, the user mayexpect to see four mutants showing the expected phenotype ata cost of $25,000 per successful experiment; on the otherhand, if a simple guilt-by-association approach having onlyone source of evidence as input (with average precision at20% recall of 10%) is used to select the genes to assay, the usermay expect to see only one mutant with the desired pheno-type at a cost of $100,000 per successful experiment.
Annotation efforts such as FANTOM [39] have populated ahigh-quality reference database of function assignments inwhich each annotation is highly likely to be true. This encyclo-pedic approach is valuable, but necessarily discards partialinformation, or 'medium-confidence' predictions. A full spec-trum of confidence measures can serve as a form of principledtriage, in which experimentalists are guided towards thosehypotheses that are more likely to prove true but which havenot yet been proven. Furthermore, quantitative function pre-diction should also prove useful as a resource to assist morequalitative encyclopedic efforts.
Variation in performance between submissions is more sub-stantial when the evaluation criterion is precision at a givenrecall, rather than AUC, as shown in Figure 3. The variationin performance between groups and between first and secondsubmissions from the same group indicates that, as a commu-nity, we have not yet converged on an asymptotic limit to per-formance. Also, ANOVA results indicate that GO branch is agreater contributor to variation in performance than the pre-diction method used. The difficulty of predicting GO terms ishighest in the Biological process branch followed by the Cel-lular component and then Molecular function branches. Also,
the difficulty decreases as the number of genes currentlyannotated to that GO term increases.
Our assessment indicates that many submissions were moresuccessful in predicting for held-out genes than for the newlyannotated set of genes. This suggests the problem of predict-ing novel annotations may be qualitatively different from theproblem of predicting previously known but held-out annota-tions. Approximately 50% of new annotations were annotatedon the basis of sequence or structural similarity (evidencecode ISS; Additional data file 3), as opposed to 9% for held-
Illustration of evidence underlying predictions for the GO term 'Cell adhesion'Figure 6Illustration of evidence underlying predictions for the GO term 'Cell adhesion'. As an assessment of predictive usefulness, the precision at 20% recall (P20R) value based on each single data source is shown in parentheses. (a) Expression levels of annotated genes (dark green) and predictions (orange), grouped by Pearson correlation and complete-linkage hierarchical clustering. (b) Protein domains in common among predictions and annotated genes. (c) Largest protein-protein interaction network among predictions and annotated genes. OPHID, Online Predicted Human Interaction Database. (d) Disease and (e) phenotype annotations in common between predictions and annotated genes. Terminal digits of identifiers are shown in parentheses. OMIM, Online Mendelian Inheritance in Man.
out annotations. This indicates that a greater proportion ofrecent annotations has been made by transfer of annotationfrom other species via homology.
Although we considered homology to proteins in other spe-cies through phylogenetic profiling and use of protein domainmatches, we did not allow transfer of functions from otherspecies via orthology for several reasons. First, functiontransfer by orthology is the most mature method for functionprediction and we consider that the need is greatest toimprove methods that integrate and analyze newer large-scale experimental data types. Second, use of GO annotationfrom other species would have rendered our cross-validationperformance estimates uninterpretable by allowing circularpredictions. For example, a held-out mouse GO annotation
that had previously been transferred by homology from amouse gene to a human gene might then be transferred backto mouse as a 'prediction'. Third, a function determined in asingle organism can quickly spread via orthology to manyorganisms so that a single piece of evidence might be over-counted as an independent fact in multiple organisms. Thesecond and third issues might be circumvented by only con-sidering annotation from other species based on experimentscarried out in that organism. While some evidence codes inGO annotations indicate within-organism support (for exam-ple, IDA, IMP [inferred from mutant phenotype], IEP[inferred from expression pattern], IPI [inferred from physi-cal interaction]), other evidence codes such as TAS [traceableauthor statement], NAS [non-traceable author statement],ISS, and RCA are ambiguous [33]. Careful curation of the
Illustration of evidence underlying predictions for the GO term 'Mitochondrial part'Figure 7Illustration of evidence underlying predictions for the GO term 'Mitochondrial part'. (a-e) As described in Figure 6a-e. GO, Gene Ontology.
organism from which function annotation evidence has beenderived would greatly facilitate the use of orthology-basedfunction transfer in future integrative studies.
We found that submissions from every group were subject tooverfitting in most GO categories. While the presence of over-fitting is not surprising given the paucity of available trainingdata, it does suggest that future performance gains will comefrom classifier training methodology that further limits over-fitting. Another future improvement to predictions might bea unified score based on all submissions, via an ensemble or'combination of experts' method [40]. In addition, to facili-tate interpretation, scores might be transformed to accuratelyreflect the probability that a prediction is correct. Anotherpossible improvement would be the use of a more refinedsubset of GO terms as gold standard. For example, predic-tions could be judged according to a reduced subset of GOterms that are relatively independent of one another and eachspecific enough to suggest a follow-up experiment [24]. Fur-thermore, to improve prediction accuracy in future functionprediction efforts, data sources containing additional evolu-tionary, structural, enzymatic and sequence similarity infor-mation might be integrated. It would also be interesting toperform a factorial analysis on variations of the classifiersthat performed best here, in order to obtain biological intui-tion or insight into why these classifiers performed well. Ourprediction effort was focused on identifying 'errors of omis-sion' in GO annotation. It would also be worthwhile to explorewhether low prediction scores for current annotations(apparently 'false negatives') could be useful in recognizingerroneous functional annotations ('errors of commission').
A major implication of our analysis is that protein sequencepatterns from Pfam and InterPro are extremely useful evi-dence sources not only for Molecular function GO terms (asexpected, since these primarily reflect biochemical activities)but also for inference of Cellular component and Biologicalprocess terms. This trend may be due, in part, to the incorpo-ration of biochemical terms in the Biological process ontology(for example, 'protein amino acid phosphorylation' is listed asa Biological process, and its known members overlap with'protein kinase activity', which is a Molecular function) as wellas the fact that protein sequence patterns do relate to sub-strates associated with specific physiological processes andcellular compartments (for example, DNA-binding proteinsare primarily found in the nucleus). Nevertheless, we notethat the proportion of genes with protein sequence patternannotations is much lower in the 8,851 unannotated genes(62%; this includes genes with annotations based solely onIEA evidence) than it is among the 12,752 annotated mousegenes (90%) in the data collection. This indicates thatsequence features may be less useful in future predictions offunction for currently uncharacterized genes. This is particu-larly true of Biological process terms, which are the least pre-dictable using sequence features alone, and conceptuallymost closely related to phenotype. In future, it will be valua-
ble to predict phenotypes as well as functions. Phenotype pre-dictions are immediately testable, and phenotype data inmammalian organisms and cell culture models have a rapidrate of emergence that will permit prospective evaluation ofpredictions.
ConclusionWe performed a systematic evaluation of diverse, independ-ently developed computational approaches for predictinggene function from heterogeneous data sources in mammals.The results show that currently available data for mammalsallow predictions with both breadth and accuracy. At a recallrate of 20%, a unified set of predictions averaged 41% preci-sion, with 26% of GO terms achieving a precision better than90%. Predictions with comparable precision have been suc-cessfully used in yeast [41]. A striking finding is that predic-tions for GO terms in the most specific evaluation category(ten or fewer annotated genes) have a precision comparableto that obtained in the more general evaluation categories.For Biological process GO terms, we achieved a mean preci-sion at 20% recall for blinded predictions ranging from 28%to 46%, depending on evaluation category specificity. Corre-sponding performance for Cellular component and Molecularfunction terms was even higher, ranging from 38% to 58%and from 56% to 64%, respectively. Importantly, many highlynovel function predictions emerge for the 38% of mousegenes that remain uncharacterized.
Materials and methodsPerformance statisticsTo assess performance of function predictions by eachmethod, we obtained the ROC curve and the AUC for each GOterm using the trapezoidal rule [42]. (The AUC correspondsto the probability that a random positive instance will bescored higher than a random negative instance.) For thisassessment, GO annotations were up-propagated. That is, if agene is associated with a GO term, then this gene is also asso-ciated with all the ancestor GO terms of that GO term. Duringevaluation, refinement predictions are considered false posi-tives.
We assessed whether observed differences in AUC between
submissions X and Y were statistically significant [34] and
computed the precision at various recall rates as previously
described [43]. Precision is defined as the number of genes
correctly classified as having a given GO term divided by the
total number of genes classified as having that GO term
. Recall is defined as the percentage of genes anno-
tated with a given GO term that were classified as having that
GO term . Other performance measures included
the AUC up to the first 50 false positives, and the recall
obtained at 1% false positive rate. False positive rate is
defined as the fraction of genes not annotated with a given GO
term that were classified as having that GO term .
Tables with the median, mean and standard deviation of all
performance measures over the GO terms in each evaluation
category are provided for each submission (Additional data
files 7 to 10).
Assessing the predictive value of each data typeTo determine the value of each data type in predicting func-tion, we used the following simple guilt-by-associationmethod; for protein-protein interaction data, we counted thenumber of times each GO term is annotated among directinteraction partners ('neighbors'). For data sets composed ofbinary gene features, we considered the neighbors of gene Xto be those genes annotated to have the same specific feature,for example, a specific phenotype, disease association, or pro-tein sequence pattern annotation. In the case of non-binarydata, for example, expression or phylogenetic profile, neigh-bors are genes that correlate with X (Pearson correlation coef-ficient > 0.5). After determining the neighbors of each gene,we sum for each GO term, based on the type of data, either thecorrelation coefficients, or the number of shared features perneighbor, or the number of the neighbors annotated with GOterm X. This value is then used as a score of the function pre-diction. The contribution of each data set is then assessedconsidering genes with at least one annotated neighbor in thedata set. Tables with the median, mean, and standard devia-tion of the performance measures over GO terms in each eval-uation category per data set are provided in Additional datafile 18.
Score transformationSince scores were not necessarily calibrated across GO terms,
we developed a monotonic transformation to make scores for
different GO terms more comparable. Letting n be the total
number of genes considered, t be the number of existing pos-
itive annotations for the current GO term, and si be the un-
calibrated score for the ith gene, the calibrated score for the ith
gene is defined as: where L is the free (non-
negative) parameter chosen such that . L is found
separately for each GO term via a MATLAB optimization rou-
tine. After this transformation, the average score for each GO
term is equal to the fraction of genes currently annotated with
that GO term.
Generating a list of high scoring novel predictions for manual investigationTo evaluate the quality of top-scoring predictions moreclosely, we identified the set of submitted predictions thatperformed best within each of the 12 evaluation categories
(according to the P20R measure on held-out genes). Withineach of the 12 evaluation categories, gene/term pairs werepooled and ranked by calibrated scores (described above). Allcurrently annotated gene/term pairs were removed, resultingin a ranked list of predictions that are considered classifica-tion errors according to current GO annotations, but may infact be correct. To focus on the highly novel predictions, wealso excluded re-predictions and refinement predictions fromthe list.
AbbreviationsANOVA, analysis of variance; AUC, area under the ROCcurve; GO, Gene Ontology; IDA, inferred from direct assay;IEA, inferred from electronic annotation; ISS, inferred fromsequence or structural similarity; MGI, Mouse Genome Infor-matics; P20R, precision at 20% recall; RCA, reviewed compu-tational analysis; ROC, receiver operating characteristic.
Competing interestsThe authors declare that they have no competing interests.
Authors' contributionsThe study was designed and organized by LP-C, TRH, andFPR, with advice from many others. LP-C assembled the dataset (with help from GFB), anonymized gene identifiers in iso-lation from all participants, and calculated performancemeasures. Team A analysis was performed by GO with contri-butions from GL, JQ, CG, and MJ, and design and supervisionfrom WSN. Team B analysis was performed by HL with con-tributions from MD and design and supervision from TC andFS. Team C analysis was performed by SM with contributionsfrom CG, DW-F, and DR, and design and supervision fromQM. Team D analysis was performed by YG and CLM withcontributions by ZB, and design and supervision from OGT.Team E analysis was performed by WKK and CK with designand supervision from EMM. Team F analysis was performedby TJ and CZ with contributions from GNL and design andsupervision from DX. Team G analysis was performed by MTand WT with contributions from FDG, and design and super-vision from FPR. Team H analysis was performed by YQ withdesign and supervision from JK and ZB. Team I analysis wasdesigned and implemented by ML and AP. Post-submissionanalysis was performed by LP-C, except that CLM performedANOVA on submission performance and MT generated'straw man' predictions and classified prediction novelty.DPH and JAB performed literature evaluation. The manu-script was prepared by LP-C, TRH, and FPR and figures byLP-C. All authors read and approved the final manuscript.
Additional data filesThe following additional data are available with the onlineversion of this paper. Additional data file 1 is a figure showing
bar graphs of pairwise comparisons of AUC within each eval-uation category. Additional data file 2 is a figure showing bargraphs of mean P20R values within each evaluation category.Additional data file 3 is a figure showing bar graphs compar-ing properties of GO annotations in the held-out gene set, inthe newly annotated gene set, and in the training set. Addi-tional data file 4 is a figure showing a clustergram indicatingPearson correlation coefficients of the P20R performancemeasure among different submissions. Additional data file 5is a figure showing heatmaps of precision at several recall val-ues evaluated using held-out annotations on all GO termswithin each of the 12 evaluation categories for each submis-sion. Additional data file 6 is a figure showing a heatmap ofmedian precision at several recall values evaluated usingheld-out annotations within each of the 12 evaluation catego-ries per submission. Additional data file 7 is a table listingperformance measures for the initial round of GO term pre-dictions within each evaluation category evaluated usingheld-out genes. Additional data file 8 is a table listing per-formance measures for the initial round of GO term predic-tions within each evaluation category evaluated using thenewly annotated genes (prospective evaluation). Additionaldata file 9 is a table listing performance measures for the sec-ond round of GO term predictions within each evaluation cat-egory evaluated using held-out genes. Additional data file 10is a table listing performance measures for the second roundof GO term predictions within each evaluation category eval-uated using the newly annotated genes (prospective evalua-tion). Additional data file 11 is a table listing the results of theanalysis of variance in prediction performance. Additionaldata file 12 is a table listing performance and variance on fivesubsets of the training data. Additional data file 13 is a tablelisting performance measures of the unified predictions foreach GO term. Additional data file 14 is a table listing high-scoring predictions evaluated against existing literature.Additional data file 15 is a table listing mitochondrial partpredictions with data from a previous study [38]. Additionaldata file 16 is a table listing data underlying Figure 6. Addi-tional data file 17 is a table listing data underlying Figure 7.Additional data file 18 is a table listing performance measuresfor various individual evidence sources within each evalua-tion category evaluated using held-out genes. Additional datafile 19 is a Flash animation showing a fraction of GO termswith higher precision and recall than a given precision/recallpoint for the unified predictions. Additional data file 20 con-tains a 300 word description of the function predictionmethod used in each submission. Additional data file 21describes in detail the submission methods and the strawman classifier (57 pages in total).Additional data file 1Bar graphs of pairwise comparisons of AUC within each evaluation categoryBar graphs of pairwise comparisons of AUC within each evaluation category.Click here for fileAdditional data file 2Bar graphs of mean P20R values within each evaluation categoryBar graphs of mean P20R values within each evaluation categoryClick here for fileAdditional data file 3Bar graphs comparing properties of GO annotations in the held-out gene set, in the newly annotated gene set and in the training setBar graphs comparing properties of GO annotations in the held-out gene set, in the newly annotated gene set and in the training set.Click here for fileAdditional data file 4Clustergram indicating Pearson correlation coefficients of the P20R performance measure among different submissionsClustergram indicating Pearson correlation coefficients of the P20R performance measure among different submissions.Click here for fileAdditional data file 5Heatmaps of precision at several recall values evaluated using held-out annotations on all GO terms within each of the 12 evaluation categories for each submissionHeatmaps of precision at several recall values evaluated using held-out annotations on all GO terms within each of the 12 evaluation categories for each submission.Click here for fileAdditional data file 6Heatmap of median precision at several recall values evaluated using held-out annotations within each of the 12 evaluation catego-ries per submission.Heatmap of median precision at several recall values evaluated using held-out annotations within each of the 12 evaluation catego-ries per submissionClick here for fileAdditional data file 7Performance measures for the initial round of GO term predictions within each evaluation category evaluated using held-out genesPerformance measures for the initial round of GO term predictions within each evaluation category evaluated using held-out genes.Click here for fileAdditional data file 8Performance measures for the initial round of GO term predictions within each evaluation category evaluated using the newly anno-tated genes (prospective evaluation)Performance measures for the initial round of GO term predictions within each evaluation category evaluated using the newly anno-tated genes (prospective evaluation).Click here for fileAdditional data file 9Performance measures for the second round of GO term predic-tions within each evaluation category evaluated using held-out genesPerformance measures for the second round of GO term predic-tions within each evaluation category evaluated using held-out genes.Click here for fileAdditional data file 10Performance measures for the second round of GO term predic-tions within each evaluation category evaluated using the newly annotated genes (prospective evaluation)Performance measures for the second round of GO term predic-tions within each evaluation category evaluated using the newly annotated genes (prospective evaluation).Click here for fileAdditional data file 11Results of the analysis of variance in prediction performanceResults of the analysis of variance in prediction performance.Click here for fileAdditional data file 12Performance and variance on five subsets of the training dataPerformance and variance on five subsets of the training data.Click here for fileAdditional data file 13Performance measures of the unified predictions for each GO termPerformance measures of the unified predictions for each GO term.Click here for fileAdditional data file 14High-scoring predictions evaluated against existing literatureHigh-scoring predictions evaluated against existing literature.Click here for fileAdditional data file 15Mitochondrial part predictions with data from a previous study [38]Mitochondrial part predictions with data from a previous study [38].Click here for fileAdditional data file 16Data underlying Figure 6Data underlying Figure 6.Click here for fileAdditional data file 17Data underlying Figure 7Data underlying Figure 7.Click here for fileAdditional data file 18Performance measures for various individual evidence sources within each evaluation category evaluated using held-out genesPerformance measures for various individual evidence sources within each evaluation category evaluated using held-out genes.Click here for fileAdditional data file 19Fraction of GO terms with higher precision and recall than a given precision/recall point for the unified predictionsFraction of GO terms with higher precision and recall than a given precision/recall point for the unified predictions.Click here for fileAdditional data file 20Description of the function prediction method used in each sub-missionDescription of the function prediction method used in each sub-mission.Click here for fileAdditional data file 21Detailed description of the submission methods and the straw man classifierDetailed description of the submission methods and the straw man classifier.Click here for file
AcknowledgementsTeam A (GO, GL, JQ, CG, MJ, and WSN) was supported by NIH awardR33 HG003070. Team B (HL, MD, TC, and FS) was supported by NIH/NSFjoint mathematical biology initiative DMS-0241102 and NIH P50 HG002790; HL is supported by the systems biology infrastructure establish-ment grant provided by Gwangju Institute of Science and Technology in2008; MD is supported by the National Natural Science Foundation of
China (No. 30570425), the National Key Basic Research Project of China(No. 2003CB715903), and Microsoft Research Asia (MSRA). Team C (SM,DW-F, CG, DR, QM) was supported by an NSERC operating grant to QMas well as a Genome Canada grant administered by the Ontario GenomicsInstitute. Team D (YG, CLM, ZB, and OGT) was partially supported by NIHgrant R01 GM071966 and NSF grant IIS-0513552 to OGT and NIGMSCenter of Excellence grant P50 GM071508. Team E (WKK, CK, and EMM)was supported by grants from the NIH, NSF, Packard and Welch Founda-tions. Team F (TJ, CZ, GNL, and DX) was supported by USDA/CSREES-2004-25604-14708 and NSF/ITR-IIS-0407204. Team G (MT, WT, FDG,GFB, and FPR) was supported by NIH grants (HG003224, HG0017115,HL81341, HG004233 and HG004098), by the Keck Foundation, and by NSFTeraGrid resources. Team H (YQ, JK, and ZB) was supported in part byNational Science Foundation NSF grants EIA0225656, EIA0225636,CAREER CC044917 and National Institutes of Health NIH grant LM07994-01. Team I (ML and AP) warmly thanks A Vazquez for his support. DPH andJAB were supported by HG002273. LP-C and TRH were supported by aCIHR grant and thank O Meruvia for helping with the design of figures.
This article has been published as part of Genome Biology Volume 9 Supple-ment 1, 2008: Quantitative inference of gene function from diverse large-scale datasets. The full contents of the supplement are available online athttp://genomebiology.com/supplements/9/S1
References1. Aerts S, Lambrechts D, Maity S, Van Loo P, Coessens B, De Smet F,
Tranchevent LC, De Moor B, Marynen P, Hassan B, Carmeliet P,Moreau Y: Gene prioritization through genomic data fusion.Nat Biotechnol 2006, 24:537-544.
2. Chen Y, Xu D: Global protein function annotation throughmining genome-scale data in yeast Saccharomyces cerevisiae.Nucleic Acids Res 2004, 32:6414-6424.
3. Joshi T, Chen Y, Becker JM, Alexandrov N, Xu D: Genome-scalegene function prediction using multiple sources of high-throughput data in yeast Saccharomyces cerevisiae. OMICS2004, 8:322-333.
4. Karaoz U, Murali TM, Letovsky S, Zheng Y, Ding C, Cantor CR, KasifS: Whole-genome annotation by using evidence integrationin functional-linkage networks. Proc Natl Acad Sci USA 2004,101:2888-2893.
5. Lanckriet GR, De Bie T, Cristianini N, Jordan MI, Noble WS: A sta-tistical framework for genomic data fusion. Bioinformatics 2004,20:2626-2635.
6. Massjouni N, Rivera CG, Murali TM: VIRGO: computational pre-diction of gene functions. Nucleic Acids Res 2006, 34:W340-344.
7. Myers CL, Robson D, Wible A, Hibbs MA, Chiriac C, Theesfeld CL,Dolinski K, Troyanskaya OG: Discovery of biological networksfrom diverse functional genomic data. Genome Biol 2005,6:R114.
8. Shenouda EAMA, Morris Q, Bonner AJ: Connectionistapproaches for predicting mouse gene function from geneexpression. In Neural Information Processing: 13th International Con-ference, ICONIP 2006, Hong Kong, China, October 3-6, 2006, ProceedingsEdited by: King I, Wang J, Chan L, Wang DL. Heidelberg, Berlin;Springer; 2006:280-289.
9. Troyanskaya OG, Dolinski K, Owen AB, Altman RB, Botstein D: ABayesian framework for combining heterogeneous datasources for gene function prediction (in Saccharomyces cere-visiae). Proc Natl Acad Sci USA 2003, 100:8348-8353.
10. Yao Z, Ruzzo WL: A regression-based K nearest neighbor algo-rithm for gene function prediction from heterogeneousdata. BMC Bioinformatics 2006, 7(suppl 1):S11.
12. Collins FS, Rossant J, Wurst W: A mouse for all reasons. Cell2007, 128:9-13.
13. Letovsky S, Kasif S: Predicting protein function from protein/protein interaction data: a probabilistic approach. Bioinformat-ics 2003, 19(suppl 1):i197-204.
14. Lu LJ, Xia Y, Paccanaro A, Yu H, Gerstein M: Assessing the limitsof genomic data integration for predicting protein networks.Genome Res 2005, 15:945-953.
15. Tanay A, Steinfeld I, Kupiec M, Shamir R: Integrative analysis ofgenome-wide experiments in the context of a large high-throughput data compendium. Mol Syst Biol 2005, 1:2005.0002.
16. Clare A, Karwath A, Ougham H, King RD: Functional bioinfor-matics for Arabidopsis thaliana. Bioinformatics 2006,22:1130-1136.
17. King RD, Karwath A, Clare A, Dehaspe L: Accurate prediction ofprotein functional class from sequence in the Mycobacteriumtuberculosis and Escherichia coli genomes using data mining.Yeast 2000, 17:283-293.
18. van Noort V, Snel B, Huynen MA: Predicting gene function byconserved co-expression. Trends Genet 2003, 19:238-242.
19. Milo R, Shen-Orr S, Itzkovitz S, Kashtan N, Chklovskii D, Alon U:Network motifs: simple building blocks of complex net-works. Science 2002, 298:824-827.
21. Zhang W, Morris QD, Chang R, Shai O, Bakowski MA, Mitsakakis N,Mohammad N, Robinson MD, Zirngibl R, Somogyi E, Laurin N,Eftekharpour E, Sat E, Grigull J, Pan Q, Peng WT, Krogan N, Green-blatt J, Fehlings M, Kooy D van der, Aubin J, Bruneau BG, Rossant J,Blencowe BJ, Frey BJ, Hughes TR: The functional landscape ofmouse gene expression. J Biol 2004, 3:21.
22. Godzik A, Jambon M, Friedberg I: Computational protein func-tion prediction: Are we making progress? Cell Mol Life Sci 2007,64:2505-2511.
23. Murali TM, Wu CJ, Kasif S: The art of gene function prediction.Nat Biotechnol 2006, 24:1474-1475.
25. Chen Y, Xu D: Computational analyses of high-throughputprotein-protein interaction data. Curr Protein Pept Sci 2003,4:159-181.
26. Grunenfelder B, Winzeler EA: Treasures and traps in genome-wide data sets: case examples from yeast. Nat Rev Genet 2002,3:653-661.
27. Steinmetz LM, Deutschbauer AM: Gene function on a genomicscale. J Chromatogr B Analyt Technol Biomed Life Sci 2002,782:151-163.
28. Brown KR, Jurisica I: Online Predicted Human InteractionDatabase. Bioinformatics 2005, 21:2076-2082.
29. Yu H, Luscombe NM, Lu HX, Zhu X, Xia Y, Han JD, Bertin N, ChungS, Vidal M, Gerstein M: Annotation transfer between genomes:protein-protein interologs and protein-DNA regulogs.Genome Res 2004, 14:1107-1118.
30. MouseFunc I [http://hugheslab.med.utoronto.ca/supplementary-data/mouseFunc_I/]
31. The Gene Ontology Consortium: Gene ontology: tool for theunification of biology. Nat Genet 2000, 25:25-29.
32. The Jackson Laboratory Mouse Genome Database (MGD),Mouse Genome Informatics Web Site [www.informatics.jax.org]
33. Guide to GO Evidence Codes [www.geneontology.org/GO.evidence.shtml]
34. Hanley JA, McNeil BJ: A method of comparing the areas underreceiver operating characteristic curves derived from thesame cases. Radiology 1983, 148:839-843.
35. Marcotte EM, Pellegrini M, Thompson MJ, Yeates TO, Eisenberg D: Acombined algorithm for genome-wide prediction of proteinfunction. Nature 1999, 402:83-86.
36. Geserick P, Kaiser F, Klemm U, Kaufmann S, Zerrahn J: Modulationof T cell development and activation by novel members ofthe Schlafen (slfn) gene family harbouring an RNA helicase-like motif. Int Immunol 2004, 16:1535-1548.
37. MFunc: Predictions of Gene Function [http://llama.med.harvard.edu/cgi/Mfunc/mfunc.py]
38. Kislinger T, Cox B, Kannan A, Chung C, Hu P, Ignatchenko A, ScottMS, Gramolini AO, Morris Q, Hallett MT, Rossant J, Hughes TR, FreyB, Emili A: Global survey of organ and organelle proteinexpression in mouse: combined proteomic and transcrip-tomic profiling. Cell 2006, 125:173-186.
39. Maeda N, Kasukawa T, Oyama R, Gough J, Frith M, Engstrom PG,Lenhard B, Aturaliya RN, Batalov S, Beisel KW, Bult CJ, Fletcher CF,Forrest AR, Furuno M, Hill D, Itoh M, Kanamori-Katayama M,Katayama S, Katoh M, Kawashima T, Quackenbush J, Ravasi T, RingBZ, Shibata K, Sugiura K, Takenaka Y, Teasdale RD, Wells CA, ZhuY, Kai C, et al.: Transcript annotation in FANTOM3: mousegene catalog based on physical cDNAs. PLoS Genet 2006, 2:e62.
40. Kittler J, Hatef M, Duin RPW, Matas J: On combining classifiers.IEEE Trans Pattern Analysis Machine Intelligence 1998, 20:226-239.
41. Peng WT, Robinson MD, Mnaimneh S, Krogan NJ, Cagney G, MorrisQ, Davierwala AP, Grigull J, Yang X, Zhang W, Mitsakakis N, RyanOW, Datta N, Jojic V, Pal C, Canadien V, Richards D, Beattie B, WuLF, Altschuler SJ, Roweis S, Frey BJ, Emili A, Greenblatt JF, Hughes TR:A panoramic view of yeast noncoding RNA processing. Cell2003, 113:919-933.
42. Fawcett T: An introduction to ROC analysis. Pattern Recogn Lett2006, 27:861-874.
43. Davis J, Goadrich M: The relationship between Precision-Recalland ROC curves. In Proceedings of the 23rd International Conferenceon Machine Learning: June 25-29, 2006; Pittsburgh, Pennsylvania Editedby: Cohen WW, Moore A. New York: ACM Press; 2006:233-240.
44. Su AI, Wiltshire T, Batalov S, Lapp H, Ching KA, Block D, Zhang J,Soden R, Hayakawa M, Kreiman G, Cooke MP, Walker JR, HogeneschJB: A gene atlas of the mouse and human protein-encodingtranscriptomes. Proc Natl Acad Sci USA 2004, 101:6062-6067.
45. Siddiqui AS, Khattra J, Delaney AD, Zhao Y, Astell C, Asano J,Babakaiff R, Barber S, Beland J, Bohacec S, Brown-John M, Chand S,Charest D, Charters AM, Cullum R, Dhalla N, Featherstone R, Ger-hard DS, Hoffman B, Holt RA, Hou J, Kuo BY, Lee LL, Lee S, Leung D,Ma K, Matsuo C, Mayo M, McDonald H, Prabhu AL, et al.: A mouseatlas of gene expression: large-scale digital gene-expressionprofiles from precisely defined developing C57BL/6J mousetissues and cells. Proc Natl Acad Sci USA 2005, 102:18485-18490.
46. Finn RD, Mistry J, Schuster-Bockler B, Griffiths-Jones S, Hollich V,Lassmann T, Moxon S, Marshall M, Khanna A, Durbin R, Eddy SR, Son-nhammer EL, Bateman A: Pfam: clans, web tools and services.Nucleic Acids Res 2006, 34:D247-251.
47. Mulder NJ, Apweiler R, Attwood TK, Bairoch A, Bateman A, Binns D,Bradley P, Bork P, Bucher P, Cerutti L, Copley R, Courcelle E, Das U,Durbin R, Fleischmann W, Gough J, Haft D, Harte N, Hulo N, KahnD, Kanapin A, Krestyaninova M, Lonsdale D, Lopez R, Letunic I, Mad-era M, Maslen J, McDowall J, Mitchell A, Nikolskaya AN, et al.: Inter-Pro, progress and status in 2005. Nucleic Acids Res 2005,33:D201-205.
48. Eppig JT, Blake JA, Bult CJ, Kadin JA, Richardson JE: The mousegenome database (MGD): new features facilitating a modelsystem. Nucleic Acids Res 2007, 35:D630-637.
49. Phenotype Annotations from MGI [ftp.informatics.jax.org/pub/reports]
50. Kasprzyk A, Keefe D, Smedley D, London D, Spooner W, Melsopp C,Hammond M, Rocca-Serra P, Cox T, Birney E: EnsMart: a genericsystem for fast and flexible access to biological data. GenomeRes 2004, 14:160-169.
51. O'Brien KP, Remm M, Sonnhammer EL: Inparanoid: a compre-hensive database of eukaryotic orthologs. Nucleic Acids Res2005, 33:D476-D480.
52. Wheeler DL, Barrett T, Benson DA, Bryant SH, Canese K,Chetvernin V, Church DM, DiCuccio M, Edgar R, Federhen S, GeerLY, Kapustin Y, Khovayko O, Landsman D, Lipman DJ, Madden TL,Maglott DR, Ostell J, Miller V, Pruitt KD, Schuler GD, Sequeira E,Sherry ST, Sirotkin K, Souvorov A, Starchenko G, Tatusov RL, Tatus-ova TA, Wagner L, Yaschenko E: Database resources of theNational Center for Biotechnology Information. Nucleic AcidsRes 2007, 35:D5-12.
53. Hamosh A, Scott AF, Amberger JS, Bocchini CA, McKusick VA:Online Mendelian Inheritance in Man (OMIM), a knowledge-base of human genes and genetic disorders. Nucleic Acids Res2005, 33:D514-D517.
54. Disease Associations from OMIM [ftp.ncbi.nih.gov/repository/OMIM/]
55. Lee H, Tu Z, Deng M, Sun F, Chen T: Diffusion kernel-based logis-tic regression models for protein function prediction. OMICS2006, 10:40-55.
56. Barutcuoglu Z, Schapire RE, Troyanskaya OG: Hierarchical multi-label prediction of gene function. Bioinformatics 2006,22:830-836.
57. Leone M, Pagnani A: Predicting protein functions with messagepassing algorithms. Bioinformatics 2005, 21:239-247.


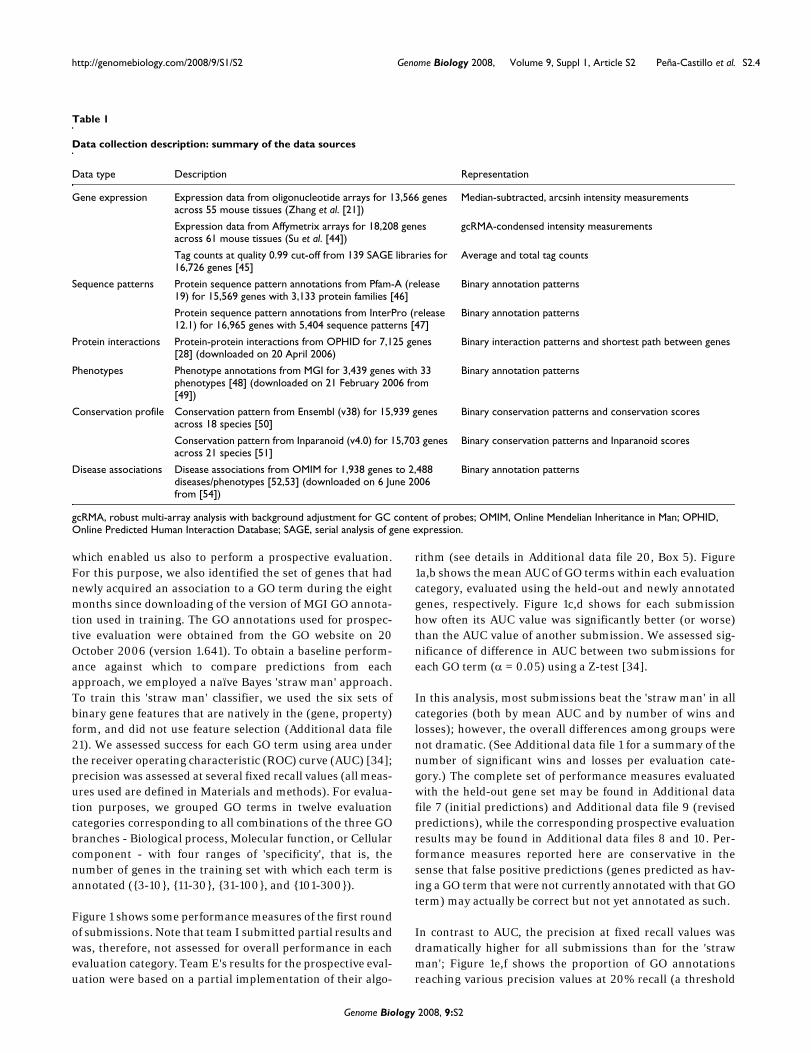


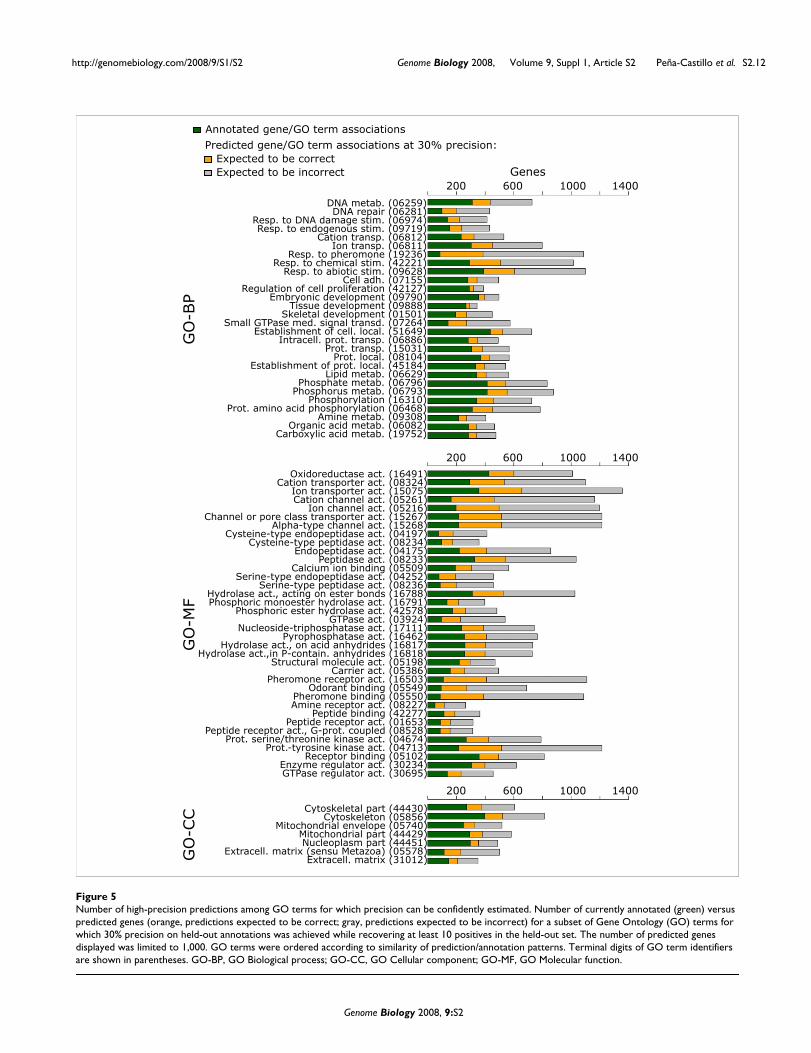

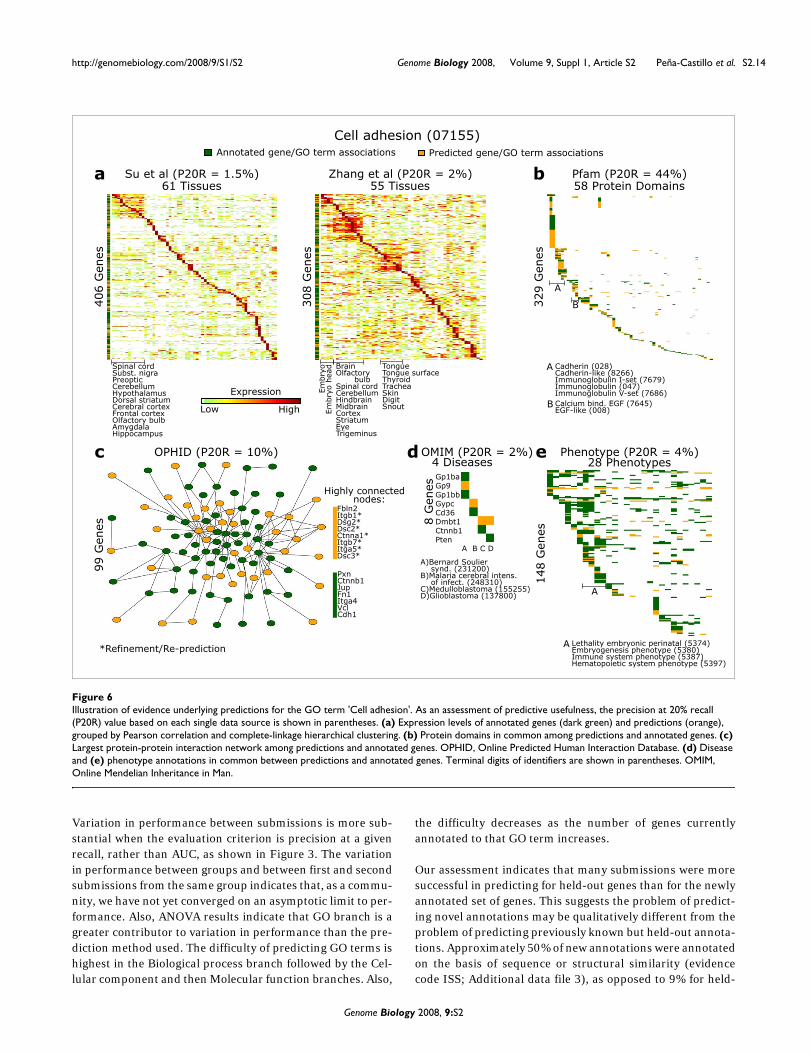


![WELCOME [wachtelshop.swiss]GR ˜ ΠΑΓΙˆΑ ΓΙΑ ΠΟΝΤΙΚΙΑ ΜΙΑΣ ΧΡΗΣΗΣ ˜ Χ ΡΙΣ ˆΗΛΗΤΗΡΙΟ RU ˜ ˜ • TOPO DOMESTICO Mus Musculus 2046AF000, 2046AF200](https://static.documents.pub/doc/80x56/5edb215080170867277b6d87/welcome-gr-oe-oe-oe.jpg)


![The amylase gene cluster in house mice (Mus musculus) was ...AMY1 enzyme in human saliva, correlated to starch-rich diet shifts [2]. In dogs, copy number variation at the Amy2b gene](https://static.documents.pub/doc/80x56/60bd1f32488cae6bea1ca926/the-amylase-gene-cluster-in-house-mice-mus-musculus-was-amy1-enzyme-in-human.jpg)