86
A Critical Evaluation of Supply-Chain Temperature Profiles to Optimise Food Safety and Quality of Australian Oysters Thomas L Madigan Project No. 2007/700

A Critical Evaluation of Supply-Chain Temperature Profiles to Optimise Food Safety
and Quality of Australian Oysters
Thomas L Madigan
Project No. 2007/700

A Critical Evaluation of Supply-Chain Temperature Profiles to Optimise Food Safety
and Quality of Australian Oysters
Thomas L Madigan
ISBN….
Copyright Australian Seafood CRC and the South Australian Research and Development Institute 2008. This work is copyright. Except as permitted under the Copyright Act 1968 (Cth), no part of this publication may be reproduced by any process, electronic or otherwise, without the specific written permission of the copyright owners. Neither may information be stored electronically in any form whatsoever without such permission. The Australian Seafood CRC is established and supported under the Australian Government’s Cooperative Research Centres Programme. Other investors in the CRC are the Fisheries Research and Development Corporation, Seafood CRC company members, and supporting participants.
Important Notice Although SARDI has taken all reasonable care in preparing this report, neither SARDI nor its officers accept any liability from the interpretation or use of the information set out in this document. Information contained in this document is subject to change without notice.

Project No: 2007/700
1
Table of Contents Non-Technical Summary...................................................................................................2
Acknowledgements ............................................................................................................5
1. Introduction....................................................................................................................6 1.1 The Australian Oyster Industry..................................................................................6 1.2 Current Australian Temperature Requirements .........................................................9 1.3 Changes to Export Control (Fish & Fish Products) Orders 2005 ..............................9 1.4 Need ...........................................................................................................................9 1.5 Objectives ................................................................................................................10
2. Methods.........................................................................................................................11 2.1 Examination of Australian Supply-chains. ..............................................................11 2.2 Profiling Current Oyster Supply-chains...................................................................11
2.2.1 Detailed examination of a Pacific Oyster supply-chain....................................11 2.2.2 Overview of Australian oyster supply-chain temperature profiles ...................11
2.3 Evaluation of Pallet Stacking Techniques ...............................................................12 2.4 Microbiological Analysis.........................................................................................12
3. Results and Discussion.................................................................................................13 3.1 Detailed Examination of Australian Supply-chains.................................................13 3.2 Temperature:Time Regimes.....................................................................................15
3.2.1 South Australia..................................................................................................15 3.2.2 New South Wales..............................................................................................18 3.2.3 Tasmania ...........................................................................................................20
3.3 Profiling Current Oyster Supply-chains...................................................................21 3.3.1 Detailed profile of an oyster shipment..............................................................21 3.3.2 Overview of Australian oyster supply-chain temperature profiles ...................25 3.3.3 Summary of temperature profiling....................................................................55
3.4 Evaluation of Pallet Stacking Techniques ...............................................................56 3.5 Microbiology of Oysters at 8°C and 15°C...............................................................58 3.6 Identification of Future Research, Investment, Education and Training
Priorities for the Australian Oyster Industry..........................................................61 3.7 Providing Input to the Development of the Australian Oyster Refrigeration
Index ......................................................................................................................62
4. Benefits and Adoption .................................................................................................63
5. Further Development...................................................................................................64
6. Planned Outcomes .......................................................................................................65
7. Conclusion ....................................................................................................................66
References.........................................................................................................................67
Appendix 1: Marine Vibrio spp. .....................................................................................69
Appendix 2: Survey Letter, Form and Profile Letter...................................................71
Appendix 3: Temperature Profiles.................................................................................74
Appendix 4: How to use an iButton® data logger..........................................................84

Project No: 2007/700
2
Non-Technical Summary
2007/700 A Critical Evaluation of Supply-Chain Temperature Profiles to Optimise Food Safety and Quality of Australian Oysters PRINCIPAL INVESTIGATOR : T.L. Madigan ADDRESS: 33 Flemington Street Glenside, 5065 South Australia OBJECTIVES: 1. Evaluate Australian oyster cool-chain processes to underpin food safety and optimise
commercial quality. 2. Identify future research, investment, education and training priorities to implement
best practice time temperature regimes for the Australian oyster industry. 3. Provide input to the development of an Australian Oyster Refrigeration Index to assist
industry and regulators to optimise time temperature regimes that assure food safety. NON TECHNICAL SUMMARY:
OUTCOMES ACHIEVED TO DATE
• Temperature profiling of problematic supply-chains has provided immediate capacity for reduced business risk from losses due to unacceptable food safety and quality risk. These losses have traditionally occurred in lengthy/complex supply-chains and represent a significant economic loss to industry.
• This work has developed a framework for Australian oyster industries (Pacific and Sydney Rock) to evaluate their cool-chains. This has provided the oyster industry with capacity to optimise its cool-chain management, which in turn will lead to both increased food safety and quality and position industry to negotiate premium prices in both the domestic and export markets.
The majority of Australian oyster production occurs in New South Wales, Tasmania and South Australia. New South Wales industry produces both the Sydney Rock Oyster and the Pacific Oyster. The Tasmanian and South Australian industries produce the Pacific Oyster. Temperature requirements in the Export Control (Fish & Fish Products) Orders 2005 were changed to enforce temperature requirements for export. The new requirements were lower than temperatures specified by the Australian Shellfish Quality Assurance Manual and the NSW state dispensation for Sydney Rock Oysters. Growers believed that the new AQIS requirement of 5°C was too low for the storage of live product and they would struggle to produce a quality product. A Hazard Identification, undertaken as part of SIDF 2007-406, identified that the new requirements were aimed at reducing the post-harvest growth of naturally occurring pathogenic bacteria from the Genus Vibrio. That project recommended that industry required a two-staged approach to this problem. Firstly to profile current Australian oyster supply-chains to establish what temperature regimes are being implemented.

Project No: 2007/700
3
Secondly, to use these profiles to develop predictive models for Vibrio parahaemolyticus in live oysters. This report details the first step of the process of profiling current oyster supply-chains. To establish current Australian supply-chain practices, a targeted survey was sent to all oyster producers in New South Wales (NSW), Tasmania (Tas) and South Australia (SA) to map transport chains from these states. There are clear differences between modes of storage and transport between states, particularly in NSW, where the proportion of producers with access to chillers and refrigerated transport is a much lower. The latter reflects the state temperature dispensation for Sydney Rock Oysters based on the perception that ambient temperatures, as opposed to refrigerated storage, are favourable for this genus. An additional feature is that transport chains in NSW are much shorter compared with other states. Real temperature profiles were developed using iButton® Thermochron temperature loggers. Oyster producers placed these loggers with oyster shipments and supply-chains were logged through to the processor or end customer. Only one serious case of heat abuse was detected from the 45 supply-chains that were profiled. However, the present study has highlighted that a significant proportion of oysters in Australia are transported at temperatures not in conformance with State Shellfish Quality Assurance Programs of NSW, Tas and SA where 50%, 42% and 45% of trips were non-compliant. In SA and Tas, many of the violations were a result of slow cooling rates following harvest, while in NSW, breaches occurred because product was stored for 72 hours or longer prior to transport. Several instances have been noted that could result in severely stressed or moribund product arriving at the customer due to cold stress, particularly in transport chains longer than 48 hours. Industry has reported that cold abuse often occurs when the insides of trailers are baffled to transport different types of stock at different temperatures and oysters may be placed in the bay next to frozen stock. Cold abuse has resulted in significant losses of product being transported interstate, particularly in the long complex chains such as SA to far north Queensland. Taken together with the violations of the relevant standards, these profiles highlight the need to educate both growers and transporters in ways to cool product effectively and to maintain an optimum temperature. A detailed assessment of a Pacific Oyster supply-chain has indicated that it can take up to 60 hours for product temperature to cool to 10°C. An evaluation of temperature profiles of hollow-style and solid-style oyster pallets has indicated that the cooling in hollow-style pallets appear to be more efficient. It has also highlighted the need for the amount of time where product is stored in a chiller prior to collection by refrigerated transport to be maximised. Microbial data generated in storage trials undertaken in this project indicate that Pacific Oysters and Sydney Rock Oysters respond differently to refrigerated storage. The organoleptic shelf-life of Sydney Rock Oysters was longer than for Pacific Oysters. Microbial results for these oysters were unexpected as lower counts were recorded for oysters stored at 15°C than at 8°C. These results indicate that in this study, there was no reduced risk from storing oysters at the warmer temperature. The exact reason for this is unexplained; however, at the warmer temperature the oysters may have been more active allowing their natural immune defenses to be more effective. This data indicates that there is a need for the differing NSW dispensation as there was no reduced risk in storing oysters at the cooler temperature.

Project No: 2007/700
4
This work has highlighted the usefulness of profiling oyster supply-chains. Further temperature profiling should be undertaken by industry to build confidence in their supply-chain. Ideally, in the longer term, transport companies should be persuaded to provide temperature profiles as part of their service to companies. Information should be prepared and sent to the growing associations in each state to highlight the advantages of temperature profiling, to ensure maximum uptake of this work. KEYWORDS: oysters, refrigerated transport, storage temperature

Project No: 2007/700
5
Acknowledgements
The author would like to gratefully acknowledge the support of the Australian oyster industries and in particular the support of Tony Troup, Hayden Dyke and Judd Evans for their assistance. The author also wishes to acknowledge the support and advice from Professor Mark Tamplin from the University of Tasmania.

Project No: 2007/700
6
1. Introduction
1.1 The Australian Oyster Industry
The majority of Australian oyster production occurs in New South Wales (NSW), Tasmania (Tas) and South Australia (SA). In NSW, three genera are cultured: the Sydney Rock Oyster (Saccostrea glomerata), the Pacific Oyster (Crassostrea gigas) and to a lesser extent the native oyster (Ostrea angasi). Commercial oyster production in NSW began in 1870 (Nell, 2001). Today, the majority of production in NSW is undertaken using an intertidal rack and tray technique (Figure 1.1) with juveniles supplied by natural spat fall and increasingly, through hatchery-produced stock. Farming of Pacific Oysters began during the 1960s in Tasmania and the 1970s in SA (Nell, 2001). The majority of production undertaken in Tasmania and SA uses an intertidal rack and bag technique (Figure 1.2) with juveniles supplied solely through hatchery produced stock. The bulk of production from all states is sold domestically, with a small proportion exported to countries such as Singapore, Dubai, Japan and Germany. However, increased production underpins the expansion into export markets. A summary of production figures is provided in Figure 1.3.
Figure 1.1: Photograph of rack and tray culture tec hnique used in New South Wales.
Figure 1.2: Photograph of rack and bag culture tech nique used in South Australia and Tasmania.

Project No: 2007/700
7
2004/2005 2005/2006 2006/20070
10000
20000
30000
40000
50000
60000
70000
80000
90000
100000
110000
120000NSWSA
Aust.Exported
Tas.
Year
Val
ue (
$'00
0)
2004/2005 2005/2006 2006/20070
2000
4000
6000
8000
10000
12000
14000
16000
18000 NSWSA
Aust.Exported
Tas.
Year
Pro
duct
ion
amou
nt (
t)
A B
Figure 1.3: Value (A) and volume (B) of oyster prod uction in Australia
The majority of Australian oysters are transported by road, either in hessian sacks or cardboard boxes, each containing approximately 30 dozen oysters, stacked on pallets (Figures 1.4 and 1.5). Collections of oysters being transported are portrayed in Figures 1.6 and 1.7.
Figure 1.4: Oysters in Hessian sacks loaded onto a pallet.

Project No: 2007/700
8
Figure 1.5: Oysters in cardboard boxes loaded onto a pallet.
Figure 1.6: Oysters being collected for transport.
Figure 1.7: Oysters packed into a curtain sided ref rigerated truck as a baffled load.

Project No: 2007/700
9
1.2 Current Australian Temperature Requirements
The Australian Shellfish Quality Assurance Manual dictates that shellstock intended for consumption as raw product must be placed under ambient refrigeration at 10°C or less within 24 hours of harvest or depuration. Under the NSW Shellfish Quality Assurance Program producers of Sydney Rock Oysters are allowed to store product at no warmer than 25°C for the first 72 hours post-harvest and no warmer than 15°C thereafter. All producers of Pacific Oysters in NSW must comply with the ASQAP regulation of 10°C or less within 24 hours of harvest.
1.3 Changes to Export Control (Fish & Fish Products ) Orders 2005
Temperature requirements in the Export Control (Fish & Fish Products) Orders 2005 require that: 18.1 Fish and fish products that are to be chilled must:
(a) be cooled to a temperature of 5°C or cooler (but not cooler than minus 1°C); or (b) be cooled in accordance with the alternative temperature controls specified for chilling the fish and fish products in the applicable approved arrangement.
18.2 If paragraph 18.1 (b) applies, the applicable approved arrangement must validate that:
(a) achieving the alternative temperature controls; and (b) the way in which the chilling is to be done; minimises the growth of pathogens that could adversely affect the fitness for human consumption of the fish and fish products given the conditions under which they are to be stored, handled, loaded and transported.
The requirement that oysters be stored below 5°C, unless otherwise validated, was considered to be untenable by growers because storage below 5°C can lead to mortality and consequent economic loss. Seafood Services Australia (SSA) commissioned a study (SIDF 2007/406) to ascertain the drivers for the change to enforcement of storage temperatures. As part of this study a Hazard Identification established that the hazards likely to occur in Australian shellfish were biotoxins, enteric viruses and naturally-occurring marine bacteria from the genus Vibrio. However, since the concentration of viruses and biotoxins post-harvest is not affected by temperature, marine Vibrio spp. were considered to be the only likely hazard to be impacted by reducing storage temperatures. Detailed information about pathogenic vibrios is provided in Appendix 1.
1.4 Need
Pathogenic marine Vibrio spp. are receiving increased international attention and the Codex Alimentarius Commission is in the process of developing a Code of Practice for these species in seafood. This process will require an understanding of the occurrence and growth of Vibrio spp. in Australian oysters as they progress through the supply-chain. To optimise returns, fisheries need to increase product value. This can be achieved by ensuring that seafood is safe and of high quality which will increase trade and market

Project No: 2007/700
10
access opportunities and allow producers to achieve higher prices. Consequently, a thorough understanding of the potential impact on product from inappropriate cool-chains is imperative, both in terms of food safety and product quality. There are anecdotal reports from producers of transport problems which have resulted in losses. The factors behind these quality issues remain unclear and warrant investigation. All of the main oyster-producing sectors (NSW, Tasmania and SA) have indicated that a detailed examination of the supply-chains of both Pacific and Sydney Rock Oysters would be beneficial to industry. SIDF 2007/406 Food Safety Validation of Storage/Transport Temperatures for Live Australian Oyster Species was undertaken to assist in regulating the position of export live oysters within the overall context of live seafood export. The project identified a need to validate current industrial processes and enable further evaluation of time/temperature arrangements underpinning ASQAP. It recommended a series of research steps, including growth studies of V. parahaemolyticus in live oysters and development of a predictive model for V. parahaemolyticus in oysters. However, commercial cool-chain profiles for Australian oysters are undefined and in order to fulfil the needs identified in SIDF 2007/406 to increase food safety and the quality of product, an evaluation of supply-chain temperature profiles and cool-chain steps for Pacific Oysters and Sydney Rock Oysters is required. Data generated can then be used to underpin and inform the development of growth studies and predictive modelling in future research.
1.5 Objectives
1. Evaluate Australian oyster cool-chain processes to underpin food safety and optimise commercial quality.
2. Identify future research, investment, education and training priorities to implement best practice time temperature regimes for the Australian oyster industry.
3. Provide input to the development of an Australian Oyster Refrigeration Index to assist industry and regulators to optimise time temperature regimes that assure food safety.

Project No: 2007/700
11
2. Methods
2.1 Examination of Australian Supply-chains.
To establish current Australian supply-chain practices, a targeted survey was developed with input from the managers of the state shellfish quality assurance programs to ensure relevance to each sector. The survey was sent to all growers in NSW (n=300), Tasmania (n=70) and SA (n=110) by the shellfish quality assurance programs. A copy of the survey is provided in Appendix 2. To further understand how product travels through the supply-chain, more detailed information was requested from 13 industry members (growers and distributors). Flow sheets were developed from the information provided by the six members who responded.
2.2 Profiling Current Oyster Supply-chains
2.2.1 Detailed examination of a Pacific Oyster supp ly-chain
A detailed examination of a chain used by two different establishments to supply Pacific Oysters from Smoky Bay in SA was undertaken. Temperature profiles were developed using iButton® Thermochron DS1921G temperature loggers (Maxim, California, USA). Loggers were placed in the middle of oyster sacks and then stacked onto pallets. A total of seven sacks containing loggers from Establishment 1 were placed onto the top of a pallet containing approximately 40 sacks of oysters which was immediately transferred to the communal chiller at 08.00 on Day 1. At 09.00 the following morning, a further 20 loggers were placed into oysters sacks from Establishment 2. These oysters had been stored on an oyster barge overnight. Sacks were stacked onto the bottom of a pallet which contained approximately 32 sacks of oysters and transferred to the communal chiller at 13.15 on Day 2. Three loggers were placed on the outside of the oyster pallet to record the ambient temperature. All of the logged oyster sacks were sent to the same customer on the Sunshine Coast in Queensland. 2.2.2 Overview of Australian oyster supply-chain te mperature profiles
A plastic snap lock bag containing a temperature logger, information sheet (also for recording data) and a stamped self-addressed envelope for returning loggers via Australia Post were sent to oyster growers. Oyster producers were requested to place loggers near the tops of oyster bags and boxes to develop ambient temperature profiles and to place loggers within harvested product as soon as possible post-harvest. Oyster harvesters were requested to record all possible information about the harvested stock. Temperature loggers were collected by wholesalers or customers and times and dates recorded at time of retrieval. Upon return, data was retrieved and stored as Microsoft Excel files. A total of 45 supply-chains were profiled. Flow sheets were prepared based on information of critical points provided by the grower. Where possible, further details were included based on knowledge of the individual producer and supply-chain.

Project No: 2007/700
12
2.3 Evaluation of Pallet Stacking Techniques
A commercial supply-chain of Pacific Oysters harvested from Smoky Bay in SA on 16 March 2009 was used to collect temperature profiles of oysters stacked using two alternative pallet stacking methods. Ambient temperature on this day was a maximum of 22°C. A total of 24 loggers were placed in the middle of 24 individual oyster sacks. Twelve of these sacks were placed into a hollow-style pallet spread across the bottom three layers; an additional logger was attached to the outside of the pallet to record ambient temperature. This hollow-style pallet was placed into the chiller at 10.20. The remaining 12 sacks were placed into a solid-style pallet, also from the bottom of the pallet upwards and an additional logger was placed on the outside of the pallet to record ambient temperature. This solid-style pallet was placed into the chiller at 13.30. Loggers were removed from the oyster sacks at 08.00 the following morning at an Adelaide depot.
2.4 Microbiological Analysis
A study of the microbiology of oysters stored at 5 and 8°C was undertaken to develop a spoilage profile of Australian oysters. Sydney Rock Oysters were harvested from Camden Haven, NSW in February 2008 from water with salinity of 21 ppt and temperature 25°C and from Pambula, NSW in February 2009 (salinity and water temperature not known). Pacific Oysters were harvested in February 2008 from Little Swanport, Tasmania from water with salinity of 39 ppt and temperature 16°C and from Coffin Bay, SA from water with salinity of 38 ppt and temperature 21°C. Oysters from NSW and Tasmania were packed in Styrofoam boxes with frozen gel packs and sent overnight to Adelaide via courier. SA samples were packed in hessian sacking and transported by refrigerated transport overnight. All samples were received within 24 hours of harvest and were analysed immediately upon receipt. Half of the oysters received were stored in a chiller operating at 8°C (+/-1°C) and the remainder in a chiller operating at 15°C (+/-1°C). Samples (single replicates of six pooled oysters) were removed at intervals of two or three days until the oysters had reached organoleptic spoilage as evidenced by putrid odours. Each sample was analysed for Aerobic Plate Count (APC) and sulphide-producing bacteria, such as Shewanella and other Gram-negative psychrotrophs. Oyster samples were prepared following Australian Standard 5013.11.3-2006. Six oysters were aseptically shucked and the meat and intra-valvular liquor diluted with two volumes of Peptone Saline Solution (PSS) (Media Production Unit, University of Melbourne) in a Waring blender (Connecticut, USA) for 30 seconds to give a 1:3 dilution. Thirty grams of this 1:3 homogenate was made up to 100 g with PSS in a sterile stomacher bag and homogenised for 60 seconds to give a 1:10 dilution. Serial dilutions were prepared and inoculated onto Petrifilm™ Aerobic Plate Count media (3M Corp, Minnesota, USA) and Lyngby Agar (Handbook of Microbiological Media for the Examination of Food (Second Edition), published by CRC Press, Taylor and Francis Group, Florida, USA) pour plates at 46ºC with an overlay. All inoculated media were incubated at 25ºC for 72 hours. The minimum level of detection for both tests was 10 cfu/g.

Project No: 2007/700
13
3. Results and Discussion
3.1 Detailed Examination of Australian Supply-chain s
A total of 121 responses to the survey were received and the results are summarised in Table 3.1 and 3.2.
Table 3.1: Summary of responses on Australian stora ge and transport practices.
Detail NSW Tas SA Number of responses 58 18 45
Percentage of respondents producing Sydney Rock Oysters 97 0 0
Percentage of respondents producing Pacific Oysters 10 100 100
Percentage of respondents who have of sub-tidal leases 16 22 7 Percentage of respondents using a chiller 29 50 87
Percentage of respondents who co-ordinate with refrigerated transport
49 72 64
Percentage of respondents who use frozen gel packs NA 6 13
Percentage of respondents who use wet ice NA 0 2
Percentage respondents not using refrigerated transport 33 17 2
Percentage respondents requesting transport at ambient 28 0 0 Average longest length of transport in hours 24 69 72
Percentage of respondents using distribution centres/depots 24 67 82
Percentage of respondents who have lost product due to heat abuse 7 28 36
Percentage of respondents who have lost product due to cold abuse 19 44 18 Note: Not all respondents answered all questions NA: NSW was sent an earlier version of the document that did not include these two questions.
As can be seen from Table 3.1 there are clear differences between modes of storage and transport between states, particularly in NSW, where the proportion of producers with access to chillers and using refrigerated transport is a much lower. The latter reflects the state temperature dispensation for Sydney Rock Oysters based on the perception that ambient temperatures, as opposed to refrigerated storage, are favourable for this genus. An additional feature is that transport chains in NSW are much shorter compared with other states. Table 3.2: Summary of responses by state detailing the main transport destinations by production location.
State Location Destinations Streaky Bay Brisbane, Cairns, Sydney, Melbourne, Adelaide, Eastern Australia,
Asia, Canberra, export, Qld, Vic, WA Coffin Bay Perth, Melbourne, Sydney, Qld, export, WA, Cairns, Canberra,
NSW, Vic, SA, Brisbane, Darwin, Adelaide, Singapore, Germany Cowell Perth, Melbourne, Sydney, Brisbane, Cairns, Canberra, Darwin,
Katherine, Tasmania, Adelaide
SA
Ceduna Perth, Melbourne, Sydney, Brisbane, Darwin, Katherine, Tasmania, Qld, NSW, Vic, SA, WA

Project No: 2007/700
14
State Location Destinations Smoky Bay Cairns, Canberra, Brisbane, Adelaide, Melbourne, Sydney, Darwin,
Qld, Perth, locally Stansbury Darwin, locally Kangaroo Island Adelaide, Melbourne, Brisbane, locally Dunalley Melbourne, Qld, NSW, SA, Vic, WA St Helens Melbourne, Sydney, export Pittwater Qld, NSW, SA, Vic, WA, Melbourne, Brisbane, Sydney, East Coast
Tas Little Swanport Qld, NSW, SA, Vic, WA Pipeclay Qld, NSW, SA, Vic, WA Smithton Sydney, NSW, Melbourne, Vic, South East Qld, Perth, Gold Coast Bruny Island Melbourne, Brisbane, Sydney, Hobart Swansea Melbourne, Tas Coles Bay Melbourne
Tas
Montagu Vic, Qld Camden Haven NSW North Coast, Sydney, Brisbane Clarence River Local restaurants and shops Manning River Sydney, Brisbane, locally, Newcastle Wagonga Inlet Sydney, Brisbane, locally South Coast NSW Sydney, Melbourne, regional NSW Hastings River Sydney, Ballina, Tweed Heads, Southport, Adelaide, Perth,
Brisbane, Cairns, locally Port Stephens Sydney, Newcastle, Hunter Valley, Brisbane, Cairns, Canberra,
locally, Gold Coast, Wollongong Tweed Heads Sydney Pambula Sydney, Canberra, locally, Brisbane, Melbourne Wallis Lake Melbourne, Sydney, Woy Woy, Queensland, Brisbane, Gold Coast Macleay River Sydney, Inland NSW Greenwell Point Sydney Crookhaven River Sydney South West Rocks Queensland Brunswick and Tweed Rivers
Sydney, locally
Clyde River North Coast NSW, Sydney, Melbourne Hawkesbury River Sydney, locally Greenwell Point Locally (Shoalhaven) Shoalhaven River Sydney, Wollongong, locally Hunter River Port Stephens, Newcastle Botany Bay Sydney Nelsons lake Locally, Sydney, Australian Capital Territory, Melbourne Macleay River Sydney Bellinger Locally, Sydney Mid North Coast Sydney
NSW
Wapengo Lake Sydney, Canberra, far South Coast NSW, North East Victoria The pattern of distribution from the three oyster-producing states is summarised in Table 3.2 where it can be seen that the majority of product is sold in Sydney. By contrast, in Tasmania and SA the proportion of interstate destinations is greater, as is the increased need for shipping via distribution centres, factors which increase the potential for temperature abuse.

Project No: 2007/700
15
3.2 Temperature:Time Regimes
Typical supply-chains from each state to major markets are defined in Tables 3.3 to 3.10. 3.2.1 South Australia
Table 3.3 Typical supply-chain from Smoky Bay, Sout h Australia to Adelaide.
Operation Time Day Time per Operation (h)
Total Elapsed Time (h)
Harvest completed 09:00 1 0 0
Transferred to processing shed 09:00 1 0.5 0.5
Prepared for sale 09.30 1 1.5 2
Transferred to chiller 11:00 1 0.25 2.25 Stored in chiller 11:15 1 2.75 5
Removed from chiller and loaded for transport
14:00 1 0.75 5.75
Transit (Smoky Bay-Pt Augusta) 14:45 1 4.25 10
Stored at Pt. Augusta depot 19:00 1 4.5 14.5
Loaded for transport 23:30 1 0.25 14.75 Transit (Pt Augusta-Adelaide) 23:45 1-2 6.25 21
Transferred to depot chiller 06:00 2 0.25 21.25
Stored in chiller 06:15 2 0.75 22
Loaded for transport 07:00 2 0.25 22.25 In transit (depot-customer) 07:15 2 0.25 22.5
Delivered to Adelaide wholesaler 07:30 2 0 22.5 Table 3.4 Typical supply-chain from Smoky Bay, Sout h Australia to Sydney. Time points as per Table 3.3 until storage in Adelaide depot chill er.
Operation Time Day Time per Operation (h)
Total Elapsed Time (h)
Stored in Adelaide depot chiller 06:15 2 1.75 23
Loaded for transport 08:00 2 0.25 23.25
In transit (depot-Sydney depot) 08:15 2-3 16 39.25 Transferred to depot chiller 00:15 3 0.5 39.75
Stored in chiller 00:45 3 3.25 43
Loaded for transport 04:00 3 0.25 43.25
Transit (depot-Sydney customer) 04:15 3 0.45 44 Delivered to customer 05:00 3 0 44 Tables 3.3 and 3.4 are indicative of supply-chains from Smoky Bay. This supply-chain utilises a refrigerated pantech to Port Augusta, where there is a depot change to Adelaide. This depot change increases transport time by 4.5 hours and also the potential for temperature abuse through extra handling. Travelling to Sydney via Adelaide does not increase transport time aside from time lost in storage at the Adelaide depot (2 hours) as driving via Broken Hill is essentially the same transit time as travelling via Adelaide and Mildura.

Project No: 2007/700
16
Table 3.4 Typical supply-chain from Coffin Bay, Sou th Australia to Sydney.
Operation Time Day Time per Operation (h)
Total Elapsed Time (h)
Harvest completed 07:30 1 0 0
Transferred to processing shed 07:30 1 0.5 0.5
Prepared for sale 08:00 1 5 5.5
Transferred to chiller 13:00 1 0.25 5.75 Stored in chiller 13:15 1 4.75 10.5
Loaded for transport 18:00 1 0.5 11
Transit (Coffin Bay-Adelaide depot) 18:30 1-2 9 20 Transferred to depot chiller 03:30 2 0.25 20.25
Stored in chiller 03:45 2 6.75 27
Loaded for transport 10:30 2 0.25 27.25
Transit (Adelaide-Sydney depot) 10:45 2-3 14.25 41.5 Transferred to depot chiller 01:00 3 0.25 41.75
Stored in chiller 01:15 3 3 44.75
Loaded for transport 04:15 3 0.25 45
Transit (depot to Sydney Fish Market 04:30 3 0.5 45.5 Delivered to customer 05:00 3 0 45.5 Table 3.5 Typical supply-chain from Coffin Bay, Sou th Australia to Melbourne. Time points as per Table 3.3 until storage in Adelaide depot ch iller.
Operation Time Day Time per Operation (h)
Total Elapsed Time (h)
Stored in Adelaide depot chiller 03:45 2 14.25 34.5
Loaded for transport 18:00 2 0.25 34.75
Transit (Adelaide-Melbourne depot) 18:15 2-3 8.75 43.5
Transferred to depot chiller 03:00 3 3 46.5 Loaded for transport 06:00 3 0.25 46.75
Transit (depot to customer) 06:15 3 0.75 47.5
Delivered to Melbourne wholesaler 07:00 3 0 47.5 The supply-chains in Tables 3.4 and 3.5 travel direct to Adelaide without stopping. This is preferable to the transit model used from Smoky Bay, which adds complexity to the supply-chain. In these chains, five hours is used in preparation for sale. This operation includes grading oysters to uniform size, removing dead oysters and bagging ready for sale.

Project No: 2007/700
17
Table 3.6 Typical supply-chain from Cowell, South A ustralia to Brisbane.
Operation Time Day Time per Operation (h)
Total Elapsed Time (h)
Harvest completed 09:00 1 0 0
Transferred to processing shed 09:00 1 0.75 0.75
Prepared for sale 09.45 1 4.25 5
Transferred to chiller 14:00 1 0.25 5.25 Stored in chiller 14:15 1 2.75 8
Removed from chiller and loaded for transport
17:00 1 0.5 8.5
Transit (Cowell-Adelaide depot) 17:30 1 5.5 14
Transferred to depot chiller 23:00 1 0.25 14.25
Stored in chiller 23:15 1-2 16.25 30.5 Loaded for transport 15:30 2 0.25 30.75
In transit (depot-Brisbane depot) 15:45 2-3 29.25 60
Transferred to depot chiller 21:00 3 0.5 60.5
Stored in chiller 21:30 3-4 8.25 68.75 Loaded for transport 05:45 4 0.25 69
Transit (depot-Brisbane customer) 06:00 4 0.5 69.5
Delivered to customer 06:30 4 0 69.5 The supply-chain summarised in Table 3.6 takes 72 hours for product to reach the final destination. During this time, the product was stored for approximately 25 hours in cold-storage during transit layovers. Minimising this time would reduce transport times. Furthermore, approximately five hours transit time was added to the journey by transiting through Adelaide instead of a direct route from Port Augusta via Broken Hill. The supply-chains summarised in Tables 3.3-3.6 indicate several inefficiencies with regard to time.

Project No: 2007/700
18
3.2.2 New South Wales
Table 3.7 Typical supply-chain from Batemans Bay, N ew South Wales to Sydney.
Operation Time Day Time per Operation (h)
Total Elapsed Time (h)
Harvest completed 07:00 1 0 0
Transferred to processing shed 07:00 1 1 1
Tipped and prepared for grading 08:00 1 1 2
Transferred to store room 09:00 1 0.25 2.25
Held in store room (<25°C) 09:15 1-3 47.75 50
Oysters graded and prepared for sale
09:00 3 6 56
Transferred to store room 15:00 3 0.25 56.25
Held in store room (<25°C) 15:15 3-4 22.25 78.5
Loaded for transport 13:30 4 0.5 79
Transit (Batemans Bay-Sydney retailer)
14:00 4 5 84
Delivered to customer 19:00 4 0 84 During the supply-chain from Batemans Bay to Sydney, the product is stored at ambient temperature in a storage room in the processing shed for extended periods. The producer reported that this practice is undertaken as it allows the product to slowly cool prior to subsequent transit and refrigerated storage as this reduces stress upon the oysters and reduces mortalities. Nevertheless, it extends what is essentially a 12 hour supply-chain to 84 hours, which creates increased opportunity for temperature abuse. This producer transports product at ambient temperature. Table 3.8 Typical supply-chain from Camden Haven, N ew South Wales to Brisbane.
Operation Time Day Time per Operation (h)
Total Elapsed Time (h)
Harvest completed 11:00 1 0 0
Transferred to processing shed 11:00 1 0.75 0.75
Stored in processing shed 11:45 1-2 31.25 32
Transferred to depuration tank 19:00 2 0.5 32.5 Depurated 19:30 2-4 35.5 68
Removed from depuration tank 07:00 4 0.5 68.5
Prepared for sale 07:30 4 1.5 70
Stored in processing shed 09:00 4 6.5 76.5 Loaded for transport 15:30 4 0.25 76.75
Transit (Camden Haven-Brisbane processor)
15:45 4-5 16.25 93
Delivered to customer 08:00 5 0 93

Project No: 2007/700
19
Table 3.9 Typical supply-chain from Camden Haven, N ew South Wales to Sydney. Time points as per Table 3.3 until storage in processing shed.
Operation Time Day Time per Operation (h)
Total Elapsed Time (h)
Stored in processing shed 09:00 4-5 28.5 98.5
Loaded for transport 13:30 5 0.5 99
Transit (Camden Haven-Sydney processor)
14:00 5 15 114
Delivered to customer 05:00 5 0 114 The supply-chains from Camden Haven to Brisbane and Sydney (Tables 3.8 and 3.9) also included excessive storage at ambient temperatures both before and after depuration. This producer transports product mainly using a refrigerated, insulated pantech and to a lesser extent using a refrigerated taut liner. These supply-chains from Batemans Bay and Camden Haven indicate that NSW producers rely on not only the state dispensation for storage, but also upon the long shelf-life of the Sydney Rock Oyster.

Project No: 2007/700
20
3.2.3 Tasmania
Table 3.10: Typical supply-chain from Little Swanpo rt, Tasmania to Melbourne.
Operation Time Day Time per Operation (h)
Total Elapsed Time (h)
Harvest completed 08:30 1 0 0
Transferred to processing shed 08:30 1 0.5 0.5
Prepared for sale 09:00 1 3 3
Loaded for transport 12:00 1 0.25 3.25 Transit (Little Swanport to Melbourne Fish Market via St Helens and ferry)
12:15 1-2 19.75 23
Delivered to customer 08:00 2 0 23 Table 3.10 represents a short efficient supply-chain to Melbourne. Product is collected by a refrigerated insulated pantech. In St. Helens, more product is usually collected at the depot. This would normally involve loading more oyster pallets into the back of the refrigerated vehicle. However, in some rare instances this may necessitate rearranging (removing and re-stacking) all pallets on board the vehicle. Table 3.11 Typical supply-chain from St Helens, Tas mania to Sydney.
Operation Time Day Time per Operation (h)
Total Elapsed Time (h)
Harvest completed 08:00 1 0 0
Transferred to processing shed 08:00 1 0.5 0.5 Prepared for sale 08:30 1 3 3.5
Transferred to chiller 11:30 1 0.25 3.75
Stored in chiller 11:45 1-2 24 27.75
Loaded for transport 11:45 2 0.25 28 Transit (St Helens-Melbourne via ferry)
12:00 2-3 20.5 48.5
Arrives Melbourne depot, product stored on truck
08:30 3 1 49.5
Transit (Adelaide-Sydney Fish Market)
09:30 3 9.5 59
Delivered to customer 19:00 3 0 59 Table 3.11 summarises a supply-chain from St Helens to Sydney. This producer uses a 24-hour chill down period by placing product in their chiller to cool product effectively. This practice is undertaken to reduce temperature of product prior to transport and to adhere to their regulatory obligations. Product is generally collected by a refrigerated insulated pantech. If small volumes are being transported, product may occasionally be collected by a smaller refrigerated truck or by a refrigerated taut liner. At the Melbourne depot, other product is transferred on and off the truck, however, in St Helens oysters on route to Sydney are packed towards the front of the vehicle so they do not need to be removed. The same vehicle then travels to Sydney Fish Market and unloads directly to the market building. On occasion, the truck may make a stop in Sydney prior to delivery to the market.

Project No: 2007/700
21
3.3 Profiling Current Oyster Supply-chains
3.3.1 Detailed profile of an oyster shipment
A supply-chain from Smoky Bay, South Australia to the Sunshine Coast was profiled. Data loggers were placed in sacks of oysters on pallets (Figure 3.1) from two establishments, which were merged into one shipment to the Sunshine Coast via Adelaide. Flow sheets of the supply-chain from each establishment are provided in Tables 3.12 and 3.13. On arrival at the Adelaide depot, seven sacks from Establishment 1 and 20 sacks from Establishment 2 were combined onto a single pallet and forwarded to the Sunshine Coast. The temperature profiles generated are presented in Figures 3.3-3.4. Table 3.12: Flow sheet describing a supply-chain fr om Establishment 1 in Smoky Bay, South Australia to the Sunshine Coast.
Operation Time Day Time per Operation (h)
Total Elapsed Time (h)
Harvest completed 13:00 1 0 0
Transferred to processing shed 13:00 1 1 1
Graded and prepared for sale 14:00 1 3 4 Stored at ambient 17:00 1 3 7
Transferred to communal chiller 20:00 1 0.25 7.25
Stored in chiller 20:15 1-2 19.75 27
Removed from chiller and loaded for transport to a taut liner
16:00 2 0.75 27.75
Transit (Smoky Bay- Whyalla via Streaky Bay)
16:45 2 5.75 33.5
Stored at Whyalla depot 22:30 2 1 34.5
Loaded for transport to a small refrigerated truck
23:30 2 0.25 34.75
Transit (Whyalla-Adelaide) 23:45 2-3 4.25 39
Transferred to depot chiller 04:00 3 0.25 39.25 Stored in chiller 04:15 3 3.75 43
Pallets re-stacked for transport 08:00 3 1 44
Stored in chiller 09:00 3 5.75 49.75
Loaded for transport to pantech 14:45 3 0.25 50 In transit (depot-Brisbane depot) 15:00- 3-4 28.5 78.5
Stored in pantech 19:30 4-5 5 83.5
Transferred to depot chiller 00:30 5 0.25 83.75 Stored in chiller 00:45 5 2.5 86.25
Loaded for transport to a refrigerated truck owned by customer
03:15 5 0.25 86.5
Transit (depot—Sunshine Coast) 03:30 5 2 88.5
Transferred to chiller 05:30 5 0.25 88.75
Stored in chiller 05:45 5 2.25 91
Logger retrieved 08:00 5 0 91

Project No: 2007/700
22
Figure 3.1: Photograph of an oyster pallet from Est ablishment 2 just prior to transfer to the communal chiller.
0 24 48 72 96-5
0
5
10
15
20
25OystersAmbientASQAP
Placedin chiller
In transit
ArriveWhyalla
Transit toAdelaide
Re-packedfor transport
ArrivedBrisbane
Collected byprivate vehicle
Transferred todepot chiller
Hours
Tem
pera
ture
(°° °°C
)
Figure 3.3: Temperature profile of oysters from Est ablishment 1 to the Sunshine Coast, Queensland. Ambient temperatures from Establishment 2 were included from the time where product was collected for transport from Smok y Bay. Following this time, all oysters were stored side by side. Oyster results are mean r esults from seven oyster sacks. Standard deviations have been omitted for clarity.

Project No: 2007/700
23
Table 3.13: Flow sheet describing a supply-chain fr om Establishment 2 in Smoky Bay, South Australia to the Sunshine Coast.
Operation Time Day Time per Operation (h)
Total Elapsed Time (h)
Harvest completed 17:30 1 0 0
Transferred to processing shed 17:30 1 0.5 0.5
Stored at ambient 18:00 1-2 12 12.5 Graded and prepared for sale 06:00 2 7 19.5
Transferred to communal chiller 13:00 2 0.5 20
Stored in chiller 13:30 2 2.5 22.5
Removed from chiller and loaded for transport to a taut liner
16:00 2 0.75 23.25
Transit (Smoky Bay- Whyalla via Streaky Bay)
16:45 2 5.75 29
Stored at Whyalla depot 22:30 2 1 30
Loaded for transport to a small refrigerated truck
23:30 2 0.25 30.25
Transit (Whyalla-Adelaide) 23:45 2-3 4.25 34. 5 Transferred to depot chiller 04:00 3 0.25 34.75
Stored in chiller 04:15 3 3.75 38.5
Pallets re-stacked for transport 08:00 3 1 39.5
Stored in chiller 09:00 3 5.75 45.25 Loaded for transport 14:45 3 0.25 45.5
In transit (depot-Brisbane depot) 15:00 3-4 28.5 74
Stored in pantech 19:30 4-5 5 79
Transferred to depot chiller 00:30 5 0.25 79.25 Stored in chiller 00:45 5 2.5 81.75
Loaded for transport to a refrigerated truck owned by customer
03:15 5 0.25 82
Transit (depot—Sunshine Coast) 03:30 5 2 84
Transferred to chiller 05:30 5 0.25 84.25
Stored in chiller 05:45 5 2.25 86.5
Logger retrieved 08:00 5 0 86.5

Project No: 2007/700
24
0 24 48 72 96-5
0
5
10
15
20
25OystersAmbientASQAP
Arri veWhyalla
Transit toAdelaide
Re-packedfor transport
Arri vedBrisbane
Collected byp rivate veh icle
Placedin chiller
In transit
Transferred todepot chiller
Hours
Tem
pera
ture
(°° °°C
)
Figure 3.4: Temperature profile of oysters from Est ablishment 2 to the Sunshine Coast, Queensland. Oyster results are mean results from 20 oyster sacks. Standard deviations have been omitted for clarity.
Profiles presented in Figure 3.3 indicate that, while some oysters cooled at a steady rate in the chiller during the 27 hours prior to loading, some data loggers were still >10°C after 24 hours. In general, product warmed significantly around 30 hours after harvest, due to opening of the truck sides to load product at Streaky Bay. Only after storage at the Adelaide depot, was product temperature stabilised below 10°C where it remained during the return trip to Brisbane. For product from Establishment 2 (Figure 3.4) a similar but inferior, temperature profile was established with some product not reaching 10°C until almost 60 hours after harvest. Stable temperature was not reached for some product until after 62 hours when placed on board the refrigerated pantech truck to Brisbane. The final stage of the chain was transport from Brisbane to Warana, on the Sunshine Coast and subsequent storage in the customer’s chiller. During this time, product was subjected to an ambient temperature of -5.5°C with product being chilled to below zero. The trip highlights a number of problems with product temperature:
1. Failure of Establishments 1 and 2 to reduce product temperature to 10°C prior to loadout by refrigerated transport. This is especially so in the case of Establishment 2, which was in the cool room for less than three hours prior to loadout.
2. Use of a taut lined refrigerated truck (as pictured in Figure 1.7). This type of transport lacks the refrigeration capacity to remove heat from the load. In addition, where multiple stops are made, product temperature is exposed to ambient temperature over a large area of the truck surface.
3. The chiller where oysters were stored in the Brisbane depot was set to 2°C, which is considered too cold for the storage of oysters. The chiller only contained oysters and could have been set to 6-7°C to mimic transport on the pantech.
4. The final link in the chain, customer transport from the depot subjected product to extreme cold abuse.

Project No: 2007/700
25
3.3.2 Overview of Australian oyster supply-chain te mperature profiles
Oyster producers placed iButton®temperature loggers into product and recorded likely depot changes and critical time points. Follow up conversations were held with oyster producers to get a better understanding of the flow of product through a trip. These typical journeys were combined with the recorded critical time points to develop a likely flow for the product. Flow sheets and temperature profiles from each state are presented in Tables 3.10 to 3.34 and Figures 3.5 to 3.30 respectively. Remaining profiles, where insufficient data to prepare flow sheets was provided by growers, are presented in the Appendix 3, Figures A3.1 to A3.19. 3.3.2.1 South Australia
The South Australian oyster industry is comprised of approximately 110 producers spread across seven growing regions (Figure 3.5), with the bulk of production coming from five regions on the Eyre Peninsula: Coffin Bay, Smoky Bay, Cowell, Streaky Bay and Denial Bay. Approximately 10% of produce from SA is sold into the Adelaide market, with the bulk of product being sold into interstate markets. Nearly all oyster shipments that are transported in SA from the Eyre Peninsula follow a similar pattern. Product is harvested and normally prepared for sale on the day of harvest and placed into a private or communal chiller. A refrigerated truck collects the product that afternoon and either transports directly to Adelaide (Coffin Bay and Cowell) or transfers via a depot in either Whyalla or Port Augusta (Denial Bay, Smoky Bay and Streaky Bay). On arrival at the Adelaide depot, product is transferred onto another refrigerated truck for interstate delivery, transferred to another depot for interstate delivery or delivered by refrigerated vehicle to customers in Adelaide (wholesalers, fish processors or restaurants). Interstate transport chains generally travel direct to capital cities where product is delivered to customers via refrigerated transport, or for destinations such as Cairns or the Gold Coast, transferred to another refrigerated truck. Product transported to Perth from the Eyre Peninsula also travels via Adelaide.
Figure 3.5: Outline map of South Australia showing oyster producing regions

Project No: 2007/700
26
Table 3.14: Flow sheet describing a supply-chain fr om Streaky Bay, South Australia to Perth
Operation Time Day Time per Operation (h)
Total Elapsed Time (h)
Harvest completed 07:45 1 0 0
Transferred to processing shed 07:45 1 0.75 0.75
Prepared for sale 08.30 1 4.5 5.25 Transferred to chiller 13:00 1 0.25 5.5
Stored in chiller 13:15 1 4.25 9.75
Loaded for transport 17:30 1 0.5 10.25
Transit (Streaky Bay-Adel) 18:00 1-2 14 24.25 Transferred to depot chiller 08:00 2 0.5 24.75
Stored in chiller 08:30 2 1 25.75
Loaded for transport 09:30 2 0.25 26
In transit (depot-Perth depot) 09:45 2-3 33 59 Transferred to depot chiller 18:45 3 0.25 59.25
Stored in chiller 19:00 3-4 12 71.25
Loaded for transport 07:00 4 0.5 71.75 Transit (depot-Perth processor) 07:30 4 0.5 72.25
Delivered to customer 08:00 4 0 72.25
0 24 48 720
5
10
15
20
25 Oysters atAdelaide depot
ASQAP
ASQAP regulation (10 oC after 24 hours)
Temp
Collectedfor transport
Delivered tocustomer
Hours
Tem
pera
ture
(°° °°C
)
Figure 3.6: Temperature profile of a Pacific Oyster cool-chain from Streaky Bay, South Australia to Perth. Zero hours is the point of harv est completion.
The supply-chain presented in Table 3.14 and Figure 3.6 has a steady temperature profile without large fluctuations. However, this supply-chain has not complied with the ASQAP standard as the temperature is not below 10°C at 24 hours. This product was in the supply-chain for 26 hours before being loaded for transport at the Adelaide depot, it would take a further 9.5 hours to reach Ceduna on route to Perth. It is extremely poor practice for a product to be in the supply-chain for 35 hours at an inappropriate temperature to reach a location that is 1.5 hours from the geographical origin of the supply-chain.

Project No: 2007/700
27
Table 3.15: Flow sheet describing a supply-chain fr om Streaky Bay, South Australia to Tweed Heads, New South Wales.
Operation Time Day Time per Operation (h)
Total Elapsed Time (h)
Harvest completed 11:30 1 0 0
Transferred to processing shed 11:30 1 0.5 0.5
Prepared for sale 12:00 1 2 2.5 Transferred to chiller 14:00 1 0.25 2.75
Stored in chiller 14:15 1 3.25 6
Loaded for transport 17:30 1 0.5 6.5
Transit (Smoky Bay-Adelaide) 18:00 1-2 14 20.5 Transferred to depot chiller 08:00 2 0.5 21
Stored in chiller 08:30 2 7 28
Loaded for transport 15:30 2 0.25 28.25
In transit (depot-Tweed Heads customer)
15:45 2-4 41.25 69.5
Delivered to customer 09:00 4 0 69.5
0 24 48 720
5
10
15
20
25
ASQAP
ASQAP regulation
(10 oC after 24 hours)
Temp
Collectedby transport
Adelaidedepot
Delivered tocustomer
Hours
Tem
pera
ture
(°° °°C
)
Figure 3.7: Temperature profile of a Pacific Oyster cool-chain from Streaky Bay, South Australia to Tweed Heads, New South Wales.
The supply-chain presented in Table 3.15 and Figure 3.7 has a steady temperature without large fluctuations. However, this supply-chain, from the same producer as the previous chain, has again not complied with the ASQAP standard, suggesting an ongoing problem with the supply-chain. This indicates that the type of transit vehicle being used is not appropriate and the producer should ensure that an insulated refrigerated vehicle (pantech) is used for transport. Furthermore, the 41 hour transit time from the Adelaide depot to Tweed Heads is excessively long. This may indicate that there was a depot change and layover in Sydney that the producer was unaware of.

Project No: 2007/700
28
Table 3.16: Flow sheet describing a supply-chain fr om Smoky Bay, South Australia to Melbourne, Victoria.
Operation Time Day Time per Operation (h)
Total Elapsed Time (h)
Harvest completed 10:00 1 0 0
Transferred to processing shed 10:00 1 0.5 0.5
Prepared for sale 10:30 1 1.5 2 Transferred to chiller 12:00 1 0.25 2.25
Stored in chiller 12:15 1 1.75 4
Removed from chiller/loaded for transport 14:00 1 0.75 4.75
Transit (Smoky Bay-Pt Augusta) 14:45 1 4.25 9 Stored at Pt. Augusta depot 19:00 1 4.5 13.5
Loaded for transport 23:30 1 0.25 13.75
Transit (Pt Augusta-Adelaide) 23:45 1-2 5.25 19
Transferred to depot chiller 05:00 2 0.25 19.25 Stored in chiller 05:15 2 4.25 23.5
Loaded for transport 09:30 2 0.25 23.75
In transit (depot-Melbourne depot) 09:45 2 9 32.75 Transferred to depot chiller 18:45 2 0.25 33
Stored in chiller 19:00 2-3 12 45
Loaded for transport 07:00 3 0.25 45.25
Transit (depot-Melbourne Fish market) 07:15 3 0.75 46 Delivered to customer 08:00 3 0 46
0 12 24 36 480
5
10
15
20
25Product collected
Adelaide depot
ASQAP
ASQAP regulation (10 oC af ter 24 hours)
Temp
Hours
Tem
pera
ture
(°° °°C
)
Figure 3.8: Temperature profile of a short Pacific Oyster cool-chain from Smoky Bay, South Australia to Melbourne. Zero hours is the poi nt of harvest completion.
The supply-chain profile summarised in Table 3.16 and Figure 3.8 has complied with the ASQAP standard. The storage temperature has decreased rapidly in comparison to the profiles observed in Streaky Bay and decreased to approximately 5°C upon arrival at the Adelaide depot, indicating that a more appropriate storage vehicle has been used than the previous supply-chains from Streaky Bay. During the transit from Adelaide to Melbourne, storage temperature decreased to nearly 0°C; oysters stored at these temperatures would be severely stressed due to this low storage temperature.

Project No: 2007/700
29
Table 3.17: Flow sheet describing a supply-chain fr om Smoky Bay, South Australia to Melbourne, Victoria.
Operation Time Day Time per Operation (h)
Total Elapsed Time (h)
Harvest completed 9:00 1 0 0
Transferred to processing shed 9:00 1 0.5 0.5
Prepared for sale 9:30 1 1.5 2 Transferred to chiller 11:00 1 0.25 2.25
Stored in chiller 11:15 1 2.75 5
Removed from chiller/loaded for transport 14:00 1 0.75 5.75
Transit (Smoky Bay-Pt Augusta) 14:45 1 4.25 10 Stored at Pt. Augusta depot 19:00 1 4.5 14.5
Loaded for transport 23:30 1 0.25 14.75
Transit (Pt Augusta-Adelaide) 23:45 1-2 5.25 20
Transferred to depot chiller 05:00 2 0.25 20.25 Stored in chiller 05:15 2 4.25 24.5
Loaded for transport 09:30 2 0.25 24.75
In transit (depot-Melbourne depot) 09:45 2 9 33.75 Transferred to depot chiller 18:45 2 0.25 34
Stored in chiller 19:00 2-3 12 46
Loaded for transport 07:00 3 0.25 46.25
Transit (depot-Melbourne Fish market) 07:15 3 0.75 47 Delivered to customer 08:00 3 0 47
0 12 24 36 48 600
5
10
15
20
25
Adelaide depot
ASQAPTemp
ASQAP regulation
(10 oC after 24 hours)
Collected fortransport
Delivered tocustomer
Hours
Tem
pera
ture
(°° °°C
)
Figure 3.9: Temperature profile of a Pacific Oyster cool-chain from Smoky Bay, South Australia to Melbourne. Zero hours is the point of harvest completion.
The supply-chain profile summarised in Table 3.17 and Figure 3.9 is from the same producer in Smoky Bay. However, despite being stored in the chiller for an hour longer than the previous chain, the product has failed to reach 10°C within 24 hours and has not complied with the ASQAP standard.

Project No: 2007/700
30
Table 3.18: Flow sheet describing a supply-chain fr om Smoky Bay, South Australia to Melbourne, Victoria.
Operation Time Day Time per Operation (h)
Total Elapsed Time (h)
Harvest completed 9:00 1 0 0
Transferred to processing shed 9:00 1 0.5 0.5
Prepared for sale 9:30 1 1.5 2 Transferred to chiller 11:00 1 0.25 2.25
Stored in chiller 11:15 1 2.75 5
Removed from chiller/loaded for transport 14:00 1 0.75 5.75
Transit (Smoky Bay-Pt Augusta) 14:45 1 4.25 10 Stored at Pt. Augusta depot 19:00 1 4.5 14.5
Loaded for transport 23:30 1 0.25 14.75
Transit (Pt Augusta-Adelaide) 23:45 1-2 5.25 20
Transferred to depot chiller 05:00 2 0.25 20.25 Stored in chiller 05:15 2 4.25 24.5
Loaded for transport 09:30 2 0.25 24.75
In transit (depot-Melbourne depot) 09:45 2 9 33.75 Transferred to depot chiller 18:45 2 0.25 34
Stored in chiller 19:00 2-3 12 46
Loaded for transport 07:00 3 0.25 46.25
Transit (depot-Melbourne Fish market) 07:15 3 0.75 47 Delivered to customer 08:00 3 0 47
0 12 24 36 480
5
10
15
20
25
TempASQAP
ASQAP regulation(10 oC after 24 hours)
Placed incommunal chiller
Collected fortransport
Adelaidedepot
Delivered tocustomer
Hours
Tem
pera
ture
(o C
)
Figure 3.10: Temperature profile of a Pacific Oyste r cool-chain from Smoky Bay, South Australia to Melbourne. Time zero is the point of h arvest completion.
The profile shown in Table 3.18 and Figure 3.10, which is again from the same producer in Smoky Bay, has adhered to the ASQAP standard. These three profiles from the same producer are distinct, indicating that there are variations between individual trips. During three separate trips to the same location and using the same transport carriers, there has

Project No: 2007/700
31
been one chain with cold abuse, one chain with mild heat abuse and one chain which would be considered to be a model supply-chain. This suggests a need for industry to monitor supply-chains on a regular basis in order to detect variations between trips. These South Australian profiles have highlighted problems with the supply-chains from the Eyre Peninsula in South Australia to Perth. Industry was questioned as to why this route (via Adelaide) was used as it obviously extended the supply-chain. They reported that initial attempts to have drivers on route to Perth collect Eyre Peninsula product at Ceduna were problematic, primarily due to drivers having to load product themselves (leading to forgotten stock) and also collection times were often in the middle of the night. Nevertheless, these problems are not insurmountable and industry should again consider sending product direct to Perth via Ceduna. There may also be efficiencies in transiting product directly via Port Augusta to Brisbane as this would also reduce transit time. However, this would be unacceptable to two large oyster distributors who act as intermediaries between producers and customers. These companies are based in Adelaide and use Adelaide depots to combine large shipments of oysters from differing locations and then forward stock to customers.

Project No: 2007/700
32
3.3.2.2 Tasmania
The bulk of Tasmanian oyster production is concentrated along the East Coast, with some production occurring in the North (Figure 3.11). The majority of Tasmanian oysters are still distributed to domestic markets with the bulk of interstate sales going to Victoria. However, Queensland and New South Wales are now taking an increasing proportion of Tasmania’s production (Tasmanian Rural and Marine Industry Profiles 2004-Department of Primary Industries and Water). The majority of oyster shipments from Tasmania to interstate destinations travel via refrigerated transport onboard the ferry based at Devonport, boarding at 20:00 and disembarking at 07:00. Oysters from locations closer to Hobart send product to a depot in Hobart, where product is then transferred to refrigerated vehicles and transported to Melbourne via the ferry. Once in Melbourne, oysters are either delivered directly to a customer, or delivered to a depot, where they are either transferred to a refrigerated vehicle for delivery to a customer or to interstate destinations. Shipments to Brisbane travel direct and do not stop at Sydney. Many growers in Tasmania who do not have access to chillers coordinate harvest to coincide with refrigerated transport. One grower based in the North East of the state reported that they rely on having product delivered to their Melbourne-based customer within 24 hours of harvest in order to adhere to the ASQAP regulation.
Hobart
LittleSwanport
Montagu
PortSorell
Devonport
MoultingBay
Great oyster bay
Great Swanport
Spring Bay
Blackman Bay
Dunalley
Eaglehawk Bay/Dart Island
Port Arthur
Pittwater
Pipe clay lagoon
Great Bay
Simpsons Bay
Deep BayPort Esperance
Hastings BayRecherche
BayCloudy Bay Lagoon
Hobart
LittleSwanport
Montagu
PortSorell
Devonport
MoultingBay
Great oyster bay
Great Swanport
Spring Bay
Blackman Bay
Dunalley
Eaglehawk Bay/Dart Island
Port Arthur
Pittwater
Pipe clay lagoon
Great Bay
Simpsons Bay
Deep BayPort Esperance
Hastings BayRecherche
BayCloudy Bay Lagoon
Figure 3.11: Outline map of South Australia showin g oyster producing regions and Devonport, where the ferry to the mainland is locat ed.

Project No: 2007/700
33
Table 3.19: Flow sheet describing a supply-chain fr om Blackman Bay, Tasmania to Brisbane.
Operation Time Day Time per Operation (h)
Total Elapsed Time (h)
Harvest completed 09:00 1 0 0 Transferred to processing shed 09:00 1 0.5 0.5 Prepared for sale 09:30 1 4.5 5 Transferred to chiller 14:00 1 0.25 5.25 Stored in chiller 14:15 1-2 21.5 26.75 Loaded for transport 11:45 2 0.25 27 Transit (Blackman Bay to Hobart depot) 12:00 2 1.5 28.5 Transferred to depot chiller 13:30 2 0.25 28.75 Stored in chiller 13:45 2 0.5 29.25 Loaded for transport 14:15 2 0.5 29.75 Transit (Hobart to Melb depot via ferry) 14:45 2-3 18.25 48 Transferred to depot chiller 09:00 3 0.25 48.25 Stored in chiller 09:15 3 0.75 49 Loaded for transport 10:00 3 0.25 49.25 Transit (depot to Brisbane depot) 10:15 3/4 19.75 69 Transferred to chiller 06:00 4 0.25 69.25 Stored in chiller 06:15 4 7.75 77 Collected by customer 14:00 4 0 77
0 24 48 72 96 1200
5
10
15
20
25
Collec ted fortransport
Hobartdepot
Melbournedepot
Queens landdepot
Collec ted bycustomer
ASQAPTemp
ASQAP regulation (10 oC af ter 24 hours)
Hours
Tem
pera
ture
(°° °°C
)
Figure 3.12: Temperature profile of a long Pacific Oyster cool-chain from Blackman Bay, Tasmania to Queensland. Zero hours is the point of harvest completion.
The long, complex supply-chain profile from Tasmania to Queensland, summarised in Table 3.19 and Figure 3.12, has not adhered to the ASQAP standard due to slight temperature abuse. The customer rejected this lot of oysters as they were gaping and had a strong odour upon inspection on arrival. This data profile revealed that the loss of product probably occurred following a drop in temperature after customer receival; as a result the customer incurred the loss. Interestingly, this profile is not dissimilar to other profiles seen in this study where no stock was lost. The biochemical profile of the oyster changes significantly over the reproductive cycle (Mason & Nell, 1995). The effect of biochemical composition of oysters on shelf-life has not been evaluated as part of this project. However, several industry members have indicated that this is an important factor

Project No: 2007/700
34
when estimating shelf-life and also indicated that they are hesitant to send pre-spawn oysters over long transport distances. Shelf-life studies should be undertaken to examine the effects upon shelf-life of oysters over the reproductive cycle. This information could be used to target exact triggers in the reproductive cycle that reduce effective shelf-life.
Table 3.20: Flow sheet describing a supply-chain fr om Blackman Bay, Tasmania to Sydney. Time points until storage in Melbourne chil ler as per Table 3.19
Operation Time Day Time per Operation (h)
Total Elapsed Time (h)
Stored in Melbourne depot chiller 09:15 3 4.25 52.5
Loaded for transport 13:30 3 0.5 53
Transit (depot to Sydney depot) 14:00 3-4 10.5 63.5
Transferred to chiller 00:30 4 0.25 63.75
Stored in chiller 00:45 4 6.25 70 Loaded for transport 07:00 4 0.25 70.25
Transit (depot to customer) 07:15 4 0.75 71
Delivered to Sydney wholesaler 08:00 4 0 71
0 24 48 720
5
10
15
20
25
Collected fortransport
Hobart depot
Melbournedepot
ASQAPASQA P regulation (10 oC after 24 hours)
Temp
Sydneydepot
Hours
Tem
pera
ture
(°° °°C
)
Figure 3.13: Temperature profile of a Pacific Oyste r cool-chain from Blackman Bay, Tasmania to Sydney. Time zero is the point of harve st completion.
Product in this supply-chain, from the same producer in Blackman Bay, has again been stored for 21 hours in the chiller, prior to transport. This producer’s practice is to store product overnight to appropriately cool it prior to transport. However, mild cases of heat abuse have occurred during transit and transfer to the Hobart depot resulting in incursions of the ASQAP standard as it is over 24 hours before product is collected for transport. Despite these minor incursions, product is maintained at a stable temperature.

Project No: 2007/700
35
Table 3.21: Flow sheet describing a supply-chain fr om Blackman Bay, Tasmania to Sydney. Time points until storage in Melbourne chil ler as per Table 3.19
Operation Time Day Time per Operation (h)
Total Elapsed Time (h)
Stored in Melbourne chiller 09:15 3 4.25 52.5
Loaded for transport 13:30 3 0.5 53
Transit (depot to Sydney depot) 14:00 3-4 10.5 63.5
Transferred to chiller 00:30 4 0.25 63.75 Stored in chiller 00:45 4 6.25 70
Loaded for transport 07:00 4 0.25 70.25
Transit (depot to customer) 07:15 4 0.75 71
Delivered to Sydney wholesaler 08:00 4 0 71
0 24 48 720
5
10
15
20
25
Product collected
Hobart Depot
Melbourne depot
Sydney depot
ASQAP
ASQAP regulation (10 oC after 24 hours)
Temp
Hours
Tem
pera
ture
(°° °°C
)
Figure 3.14: Temperature profile of a Pacific Oyste r cool-chain from Blackman Bay, Tasmania to Sydney. Time zero is the point of harve st completion.
The profile summarised in Table 3.21 and Figure 3.14, from the same producer in Blackman Bay has again not adhered to the ASQAP standard due to overnight storage of oysters prior to transport. However, from the Melbourne depot to Sydney the product has been stored at a stable temperature, which is below the optimum for the transport of Pacific Oysters. This indicates that the refrigerated vehicle is set at too low a temperature for Pacific oysters. This could be easily addressed through communication with the transport company.

Project No: 2007/700
36
Table 3.22: Flow sheet describing a supply-chain fr om Blackman Bay, Tasmania to Melbourne.
Operation Time Day Time per Operation (h)
Total Elapsed Time (h)
Harvest completed 07:00 1 0 0
Transferred to processing shed 07:00 1 0.75 0.75
Prepared for sale 07:45 1 4.25 5 Stored in processing shed 12:00 1 2.00 7
Loaded for transport 14:00 1 0.50 7.5
Transit (Blackman Bay to Hobart depot) 14:30 1 1.25 8.75
Transferred to chiller 15:45 1 0.25 9 Stored in chiller 16:00 1-2 22 31
Loaded for transport 14:00 2 0.25 31.25
Transit (Hobart to Melb depot via ferry) 14:15 2-3 17.75 49
Transferred to depot chiller 08:00 3 0.25 49.25 Stored in chiller 08:15 3 1.25 50.5
Loaded for transport 09:30 3 0.25 50.75
Transit (depot to Melb Fish Market) 09:45 3 0.75 51.5 Delivered to customer 10:30 3 0 51.5
0 12 24 36 48 600
5
10
15
20
25Temp
Hobartdepot
On ferryDelivered tocustomer
ASQAP
ASQAP regulation
(10 oC after 24 hours)
Collected fortransport
Hours
Tem
pera
ture
(°° °°C
)
Figure 3.15: Temperature profile of a Pacific Oyste r cool-chain from Blackman Bay, Tasmania to Melbourne. Zero hours is the point of h arvest completion.
The profile summarised in Table 3.22 and Figure 3.15 is also from Blackman Bay, but from a different producer than the previous three supply-chains. This producer does not store product overnight prior to transport. However, there was an unusual event in this supply-chain, whereby product was stored overnight in the Hobart depot. Consequently, the product arrived in Melbourne in a similar time frame to the previous three supply-chains from Blackman Bay. This supply-chain has not adhered to the ASQAP standard.

Project No: 2007/700
37
Table 3.23: Flow sheet describing a supply-chain fr om Little Swanport, Tasmania to Melbourne.
Operation Time Day Time per Operation (h)
Total Elapsed Time (h)
Harvest completed 08:30 1 0 0
Transferred to processing shed 08:30 1 0.5 0.5
Prepared for sale 09:00 1 3 3 Loaded for transport 12:00 1 0.25 3.25
Transit (Little Swanport to Melbourne Fish Market via St Helens and ferry)
12:15 1-2 19.75 23
Delivered to customer 08:00 2 0 23
0 2 4 6 8 10 12 14 16 18 20 22 240
5
10
15
20
25
Collected fortransport
St Helens
Arrives Melbournefish market
Hours
Tem
pera
ture
(°° °°C
)
Figure 3.16: Temperature profile of a short Pacific Oyster cool-chain from Little Swanport, Tasmania to Melbourne. Zero hours is the point of h arvest completion.
The supply-chain profile summarised in Table 3.23 and Figure 3.16 is a short (24-hour) supply to Melbourne. This producer harvests oysters to co-ordinate with the arrival time of the refrigerated transport vehicle. This minimises the time of removal from water to delivery to the Melbourne customer without the use of refrigerated storage prior to transport. The time for this product to reach Melbourne is approximately 24 hours faster than that of the supply-chains from Blackman Bay. Following an initial drop in temperature, the product has been stored at a stable temperature of approximately 6°C. This supply-chain has adhered to the ASQAP standard and could be considered to be a model, with little wasted time between harvest and a stable storage temperature.

Project No: 2007/700
38
Table 3.24: Flow sheet describing a supply-chain fr om Little Swanport, Tasmania to Melbourne.
Operation Time Day Time per Operation (h)
Total Elapsed Time (h)
Harvest completed 09:30 1 0 0
Transferred to processing shed 09:30 1 0.5 0.5
Prepared for sale 10:00 1 2 2.5 Loaded for transport 12:00 1 0.25 2.75
Transit (Little Swanport to Melbourne via St Helens and ferry)
12:15 1-2 20.25 23
Delivered to customer 08:30 2 0 23
0 2 4 6 8 10 12 14 16 18 20 22 240
5
10
15
20
25
Collected fortransport
St Helens
Delivered tocustomer
Hours
Tem
pera
ture
(°° °°C
)
Figure 3.17: Temperature profile of a Pacific Oyste r cool-chain from Little Swanport, Tasmania to Melbourne. Zero hours is the point of h arvest completion.
The supply-chain profile summarised in Table 3.24 and Figure 3.17, from the same producer in Little Swanport has again reached the customer within 24 hours. During this trip, slight fluctuations in storage temperature were apparent that were not present in the previous chain. This product has adhered to the ASQAP standard.
Project No: 2007/700
39
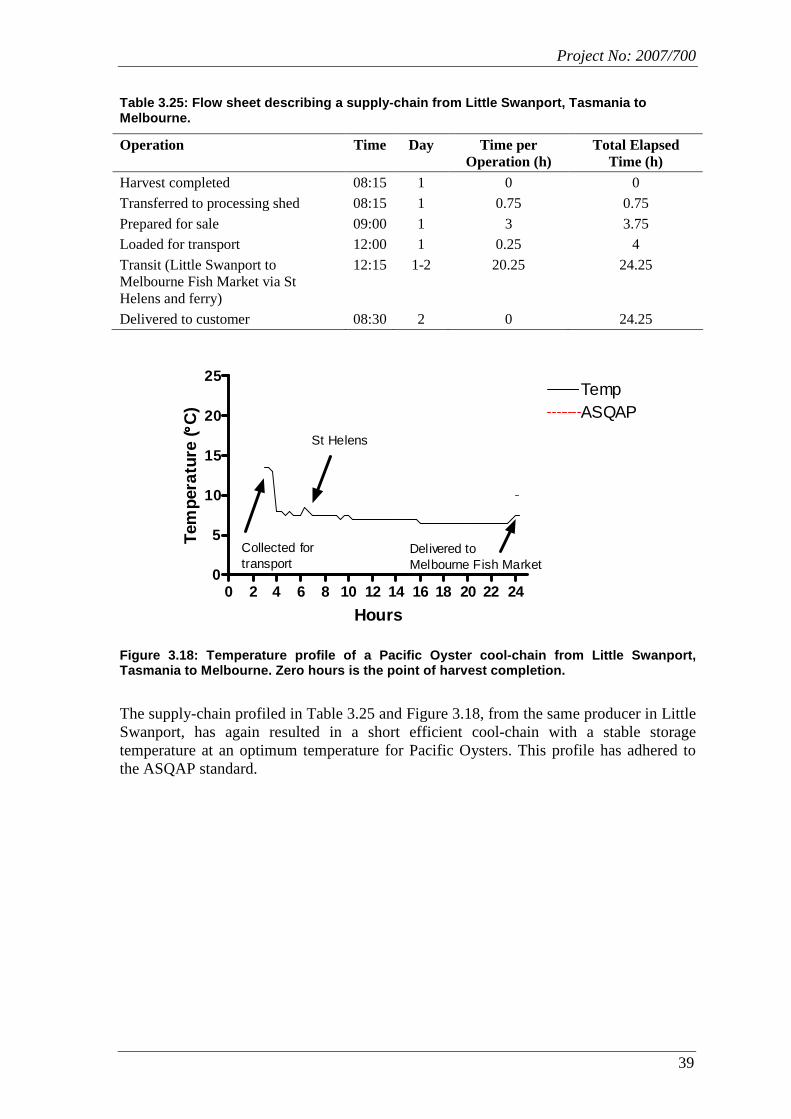
Table 3.25: Flow sheet describing a supply-chain fr om Little Swanport, Tasmania to Melbourne.
Operation Time Day Time per Operation (h)
Total Elapsed Time (h)
Harvest completed 08:15 1 0 0
Transferred to processing shed 08:15 1 0.75 0.75
Prepared for sale 09:00 1 3 3.75 Loaded for transport 12:00 1 0.25 4
Transit (Little Swanport to Melbourne Fish Market via St Helens and ferry)
12:15 1-2 20.25 24.25
Delivered to customer 08:30 2 0 24.25
0 2 4 6 8 10 12 14 16 18 20 22 240
5
10
15
20
25
Collected fortransport
St Helens
Delivered toMelbourne Fish Market
TempASQAP
Hours
Tem
pera
ture
(°° °°C
)
Figure 3.18: Temperature profile of a Pacific Oyste r cool-chain from Little Swanport, Tasmania to Melbourne. Zero hours is the point of h arvest completion.
The supply-chain profiled in Table 3.25 and Figure 3.18, from the same producer in Little Swanport, has again resulted in a short efficient cool-chain with a stable storage temperature at an optimum temperature for Pacific Oysters. This profile has adhered to the ASQAP standard.

Project No: 2007/700
40
Table 3.26: Flow sheet describing a supply-chain fr om Little Swanport, Tasmania to Melbourne.
Operation Time Day Time per Operation (h)
Total Elapsed Time (h)
Harvest completed 07:00 1 0 0
Transferred to processing shed 07:00 1 0.5 0.5
Prepared for sale 07:30 1 4.5 5 Loaded for transport 12:00 1 0.25 5.25
Transit (Little Swanport to Melbourne via St Helens and Ferry)
12:15 1-2 19.75 25
Delivered to customer 08:00 2 0 25
0 4 8 12 16 20 240
5
10
15
20
25
St HelensCollected fortransport
Delivered tocustomer
TempASQAP
Hours
Tem
pera
ture
(°° °°C
)
Figure 3.19: Temperature profile of a Pacific Oyste r cool-chain from Little Swanport, Tasmania to Melbourne. Zero hours is the point of h arvest completion.
The supply-chain profiled in Table 3.26 and Figure 3.19, from the same producer in Little Swanport, has again resulted in a short efficient cool-chain with stable storage. However, despite adhering to the ASQAP standard, the storage temperature was slightly warmer than the previous supply-chains, indicating a possible change in vehicle temperature settings for this trip. The exact reason for this slight increase is not confirmed.

Project No: 2007/700
41
Table 3.27: Flow sheet describing a supply-chain fr om Little Swanport, Tasmania to Melbourne.
Operation Time Day Time per Operation (h)
Total Elapsed Time (h)
Harvest completed 07:00 1 0 0
Transferred to processing shed 07:00 1 0.5 0.5
Prepared for sale 07:30 1 5.25 5.75 Loaded for transport 12:45 1 0.25 6
Transit (Little Swanport to Melbourne via St Helens and Ferry)
13:00 1-2 19.5 25.5
Delivered to customer 08:30 2 25.5
0 4 8 12 16 20 240
5
10
15
20
25
St HelensCollected fortransport Delivered to
MelbourneFish Market
TempASQAP
Hours
Tem
pera
ture
(°° °°C
)
Figure 3.20: Temperature profile of a Pacific Oyste r cool-chain from Little Swanport, Tasmania to Melbourne. Zero hours is the point of h arvest completion.
The supply-chain profiled in Table 3.27 and Figure 3.20, from the same producer in Little Swanport, has again resulted in a short efficient cool-chain with stable storage. However, despite adhering to the ASQAP standard (temperature recorded as 10°C at 24 hours), the storage temperature was again slightly warmer than the previous three supply-chains, again indicating a possible change in vehicle temperature settings. The exact reason for this slight increase is not confirmed. The three initial transport chains from Little Swanport are examples of efficient supply-chains, where time between harvest and the customer is minimised (resulting in a longer practical shelf-life of product) and product is stored at a stable temperature. Furthermore, there were no incursions of the ASQAP standard in any of the five supply-chains profiled from this producer. This producer uses a dedicated seafood transport company and all refrigerated vehicles used are insulated rear loading pantechs.

Project No: 2007/700
42
Table 3.28: Flow sheet describing a supply-chain fr om St Helens, Tasmania to Adelaide.
Operation Time Day Time per Operation (h)
Total Elapsed Time (h)
Harvest completed 07:30 1 0 0
Transferred to processing shed 07:30 1 0.75 0.75
Prepared for sale 08:15 1 4.75 5.5
Transferred to chiller 13:00 1 0.25 5.75 Stored in chiller 13:15 1-2 23.75 29.5
Loaded for transport 13:00 2 0.5 30
Transit (St Helens-Melb depot via ferry) 13:30 2-3 18.5 48.5 Transferred to another vehicle 08:00 3 0.5 49
Transit (depot to alternate Melb depot) 08:30 3 0.5 49.5
Transferred to chiller 09:00 3 0.25 49.75
Stored in chiller 09:15 3-4 36.75 86.5 Loaded for transport 22:00 4 0.5 87
Transit (depot to Adelaide depot) 22:30 4-5 9 96
Transferred to delivery vehicle 07:30 5 0.25 96.25
Transit (depot to Adelaide processor) 07:45 5 0.25 96.5 Delivered to customer 08:00 5 0 96.5
0 24 48 72 960
5
10
15
20
25
Collected fortransport
ASQAPTemp
ASQAP regulation (10 oC after 24 hours)
Melbournedepot
Delivered toAdelaide processor
Hours
Tem
pera
ture
(°° °°C
)
Figure 3.21: Temperature profile of a Pacific Oyste r cool-chain from St Helens, Tasmania to Adelaide. Zero hours is the point of harvest comple tion.
The supply-chain from a producer in St Helens (Moulting Bay harvest area) summarised in Table 3.28 and Figure 3.21, incorporates overnight storage in a chiller prior to transport as part of their supply-chain. This practice is undertaken as it allows product to cool to an appropriate temperature under ideal conditions rather than relying on refrigerated transport to cool the product (refrigerated transport vehicles are designed to maintain product temperature rather than reduce it). However, this practice has again resulted in a mild incursion of the ASQAP standard. Furthermore, this product has been stored for an unacceptable period of time at the Melbourne depot resulting in an unnecessarily long supply-chain to Adelaide. This producer needs to address the issue with the transport company to increase efficiencies within the supply-chain.

Project No: 2007/700
43
Table 3.29: Flow sheet describing a supply-chain fr om St Helens, Tasmania to Melbourne.
Operation Time Day Time per Operation (h)
Total Elapsed Time (h)
Harvest completed 07:00 1 0 0
Transferred to processing shed 07:00 1 0.5 0.5
Prepared for sale 07:30 1 5 5.5
Transferred to chiller 12:30 1 0.75 6.25 Stored in chiller 13:15 1-2 23.75 30
Loaded for transport 13:00 2 0.5 30.5
Transit (St Helens-Melb depot via ferry) 13:30 2-3 17.5 48 Transfer to alternate delivery vehicle 07:00 3 0.5 48.5
Transit (depot to alternate Melb depot) 07:30 3 0.5 49
Delivered to customer 08:00 0 49
0 12 24 36 480
5
10
15
20
25
Collected fortransport
Delivered toprocessor
ASQAP
ASQAP regulation (10 oC after 24 hours)
Temp
Hours
Tem
pera
ture
(°° °°C
)
Figure 3.22: Temperature profile of a Pacific Oyste r cool-chain from St Helens, Tasmania to Melbourne. Zero hours is the point of harvest compl etion.
The supply-chain profile summarised in Table 3.29 and Figure 3.22, from the same producer in St Helens, has taken 48 hours to reach the customer. The supply-chain model used by the producer in Little Swanport is far more efficient in terms of time to reach customer and product is still placed into a commercial chiller within 24 hours of harvest. This supply-chain from St Helens has adhered to the ASQAP standard.

Project No: 2007/700
44
Table 3.30: Flow sheet describing a supply-chain fr om Pittwater, Tasmania to Melbourne.
Operation Time Day Time per Operation (h)
Total Elapsed Time (h)
Harvest completed 07:00 1 0 0
Transferred to processing shed 07:30 1 0.5 0.5
Prepared for sale 07:30 1 1.25 1.75
Loaded for transport 08:45 1 0.25 2 Transit (Pittwater-Hobart depot) 09:00 1 0.5 2.5
Transferred to depot chiller 09:30 1 0.25 2.75
Stored in chiller 09:45 1 4.25 7 Loaded for transport 14:00 1 0.5 7.5
Transit (Hobart-Melb Fish Market) 14:30 1-2 21 28.5
Delivered to customer 11:30 2 0 28.5
0 2 4 6 8 10 12 14 16 18 20 22 24 26 280
5
10
15
20
25
ASQAP
ASQAP regulation
(10 oC after 24 hours )
Temp
Collected fortransport
Hobart depot
Retrieved bycustomer
Hours
Tem
pera
ture
(°° °°C
)
Figure 3.23: Temperature profile of a Pacific Oyste r cool-chain from Pittwater, Tasmania to Melbourne. Zero hours is the point of harvest compl etion.
The supply-chain profile summarised in Table 3.30 and Figure 3.23 from Pittwater to Melbourne can also be used as an exemplar supply-chain example. This chain has adhered to the ASQAP standard.

Project No: 2007/700
45
3.3.2.3 New South Wales
NSW has 137 commercial shellfish harvest areas located in 31 estuaries between Eden and Tweed Heads (Figure 3.24) with around 360 individual oyster producers (NSW Health Authority Status report June 2009). Most oysters are sold to specialist processors or seafood wholesalers who distribute to restaurants and clubs, fish retail and supermarkets. A small amount is purchased directly by supermarkets, restaurants and consumers. On the domestic market 50% of all produce is sold in Sydney, 20% locally, 20% to regional areas and 10% interstate (http://www.nswfarmers.org.au). The bulk of oysters in NSW are sold into Sydney and then transported via refrigerated vehicles or transported at ambient temperature. The temperature allowance under the NSW Food Authority for oysters, provides growers with the ability to harvest and store product for up to 72 hours at temperatures below 25°C following harvest or depuration. Depuration is a process of storing oysters in clean water to purge pathogens from oyster tissues following adverse events such as rainfall. Many growers use this 72 hour period to transport their product at an ambient temperature. In Sydney, product is either transferred through a depot, or delivered directly to customers such as wholesalers at the Sydney Fish Market, other wholesalers or restaurants. Oysters traveling to Melbourne and Canberra are usually transferred through a depot in Batemans Bay. Oyster shipments from Northern Sydney traveling to Canberra and Melbourne transfer via a depot based in Sydney.
Conjula & Burril Lks.
Hastings River
Sydney
Tweed RiverBrunswick RiverRichmond River
Wooli Wooli RiverClarence River
Nambuca RiverBelinger River
Macleay River
Camden HavenManning RiverWallis Lakes
Hunter RiverPort Stephens
Wagonga inlet
Brisbane WatersHawkesbury River
Georges RiverBotany Bay
Shoalhvn./Crookhvn.
Clyde RiverTomaga/Moruya R.Tuross Lakes
Bermagui/Wapengo
Merimbula/Pambula
Twofold/TowambaWonboyn Lakes
Figure 3.24: Outline map of NSW showing oyster pro ducing estuaries

Project No: 2007/700
46
Table 3.31: Flow sheet describing a supply-chain fr om Pambula, New South Wales to Sydney.
Operation Time Day Time per Operation (h)
Total Elapsed Time (h)
Harvest completed 09:00 1 0 0
Transferred to processing shed 09:00 1 1 1
Prepared for sale 10:00 1 5.5 6.5 Stored in processing shed 15:30 1-2 19.5 26
Loaded for transport 11:00 2 0.25 26.25
Transit (Pambula-Batemans Bay depot) 11:15 2 2.75 29
Unloaded at depot 14:00 2 0.5 29.5 Stored at depot 14:30 2 1.5 31
Loaded for transport 16:00 2 0.25 31.25
Transit (depot to Sydney Fish Market) 16:15 2-3 8.25 39.5
Delivered to customer 00:30 3 0 39.5
0 6 12 18 24 30 360
5
10
15
20
25
30
NSW FoodAuthority
Temp
NSW Food Authority temperature regulation
Batemans Baydepot
Collected fromdepot
Arrives SydneyFish Market
Hours
Tem
per
atur
e°° °°C
Figure 3.25: Temperature profile of a short Sydney Rock Oyster cool-chain from Pambula, New South Wales to Sydney. Zero hours is the point of harvest completion.
The temperature profile of a short supply-chain from NSW, summarised in Table 3.31 and Figure 3.25, has adhered to the NSW state dispensation for the storage of shellfish. This supply-chain took 36 hours from harvest to reach the customer. For 50% of this time, product was stored in the processing shed at ambient temperature.

Project No: 2007/700
47
Table 3.32: Flow sheet describing a supply-chain fr om Pambula, New South Wales to Canberra.
Operation Time Day Time per Operation (h)
Total Elapsed Time (h)
Harvest completed 06:45 1 0 0
Transferred to processing shed 06:45 1 0.5 0.5
Stored in shed 07:15 1 2.75 3.25 Prepared for sale 10:00 1 6 9.25
Stored in shed 16:00 1-2 18 27.25
Loaded for transport 10:00 2 0.25 27.5
Transit (Pambula-Batemans Bay depot) 10:15 2 2.75 30.25 Unloaded at depot 13:00 2 0.5 30.75
Stored in depot 13:30 2-3 22 52.75
Loaded for transport 11:30 3 0.5 53.25
Transit (Batemans Bay depot-Canberra customer
12:00 3 2 55.25
Delivered to customer 14:00 3 0 55.25
0 6 12 18 24 30 36 42 48 54 600
5
10
15
20
25
30
Productcollected
Batemans BayDepot
Productdelivered NSW Food Authority
Temp
NSW Food Authority temp regulation
Hours
Tem
pera
ture
°° °°C
Figure 3.26: Temperature profile of a long Sydney R ock Oyster cool-chain from Pambula, New South Wales to Canberra. Zero hours is the poi nt of harvest completion.
The temperature profile of a long supply-chain from NSW, summarised in Table 3.32 and Figure 3.26, has not adhered to the NSW state dispensation for the storage of shellfish. This product (from a different producer than the supply-chain profiled in Figure 3.25) has also been stored for an extensive time period. Upon arrival at the Batemans Bay depot, product has been stored overnight prior to transport the following afternoon, adding unnecessary time to the supply-chain. The peak in temperature that occurs at 48 hours, is most likely associated with the increase in daily temperature as the product was transported.

Project No: 2007/700
48
Table 3.33: Flow sheet describing a supply-chain fr om Pambula, New South Wales to Wollongong, New South Wales.
Operation Time Day Time per Operation (h)
Total Elapsed Time (h)
Harvest completed 10:00 1 0 0
Transferred to processing shed 10:00 1 0.5 0.5
Stored in shed 10:30 1 2 2.5 Prepared for sale 12:30 1 3.5 6
Stored in shed 16:00 1-2 17.5 23.5
Loaded for transport 09:30 2 0.25 23.75
Transit (Pambula-Batemans Bay depot) 09:45 2 3.25 27 Unloaded at depot 13:00 2 0.5 27.5
Stored in depot 13:30 2-3 16 43.5
Loaded for transport 05:30 3 0.5 44
Transit (Batemans Bay depot-Wollongong customer
06:00 3 4 48
Delivered to customer 10:00 3 0 48
0 12 24 36 480
5
10
15
20
25
30
NSW Food AuthorityTemp
NSW Food Authority temperature regulation
Collected fortransport
BatemansBay depot
Delivered tocustomer
Hours
Tem
pera
ture
°° °°C
Figure 3.27: Temperature profile of a Sydney Rock O yster cool-chain from Pambula, New South Wales (NSW) to Wollongong, NSW. Zero hours is the point of harvest completion.
The supply-chain temperature profile summarised in Table 3.33 and Figure 3.27, from the same producer as the previous supply-chain from Pambula, has adhered to the NSW state dispensation for the storage of shellfish. However, the product is again stored overnight at the Batemans Bay depot indicating an ongoing inefficiency with this supply-chain. The grower needs to work with the transport companies to resolve these issues.

Project No: 2007/700
49
Table 3.34: Flow sheet describing a supply-chain fr om Port Stephens, New South Wales to Sydney.
Operation Time Day Time per Operation (h)
Total Elapsed Time (h)
Harvest completed 11:00 1 0 0
Transferred to processing shed 11:00 1 0.5 0.5
Stored in processing shed 11:30 1-6 115.5 116 Prepared for sale 07:00 6 7 123
Loaded for transport 14:00 6 0.5 123.5
Transit (Pt Stephens-Sydney depot) 14:30 6 3.5 127
Unloaded at depot 18:00 6 0.25 127.25 Stored at depot 18:15 6-7 11.75 139
Loaded for transport 06:00 7 0.5 139.5
Transit (depot to Sydney processor) 06:30 7 0.5 140
Delivered to customer 07:00 7 0 140
0 24 48 72 96 120 1440
5
10
15
20
25
30
NSW Food AuthorityTemp
NSW Food Authoritytemperature regulation
Collected fortransport
Sydneydepot
Delivered toprocessor
Hours
Tem
pera
ture
°° °°C
Figure 3.28: Temperature profile of a Sydney Rock O yster cool-chain from Port Stephens, New South Wales to Sydney. Zero hours is the point of harvest completion.
The product in the supply-chain profile summarised in Table 3.34 and Figure 3.28 has been stored for an inordinate amount of time (115 hours) in the processing shed. No reason for this was provided. This has resulted in a six-day rather than a 20-hour supply-chain. A possible explanation for this long period of storage is that the grower may have harvested ahead of adverse weather conditions, which could result in closure of the harvesting area. This supply-chain has not adhered to the NSW state dispensation for the storage of shellfish.

Project No: 2007/700
50
Table 3.35: Flow sheet describing a supply-chain fr om Port Stephens, New South Wales to Warners Bay, New South Wales.
Operation Time Day Time per Operation (h)
Total Elapsed Time (h)
Harvest completed 13:30 1 0 0
Transferred to processing shed 13:30 1 1 1
Stored in processing shed 14:30 1-4 68 69 Prepared for sale 10:30 4 1 70
Loaded for transport 11:30 4 0.5 70.5
Transit (Pt Stephens to Warners Bay) 12:00 4 1.5 72
Delivered to customer 13:30 4 0 72
0 24 48 720
5
10
15
20
25
30
NSW Food Authority
NSW Food Authority temperature regulation
TempThe 2 hoursupply chain
Hours
Tem
pera
ture
°° °°C
Figure 3.29: Temperature profile of a Sydney Rock O yster cool-chain from Port Stephens, New South Wales (NSW) to Warners Bay (NSW). Time ze ro is the point of harvest completion.
The supply-chain temperature profile summarised in Table 3.35 and Figure 3.29 has just failed to adhere to the NSW state dispensation for the storage of shellfish (17°C at 72 hours). This producer from Port Stephens has also held oysters in the processing shed for a long period of time prior to transit, again leading to an unnecessarily long supply-chain.

Project No: 2007/700
51
Table 3.36: Flow sheet describing a supply-chain fr om the Clyde River, New South Wales to Melbourne.
Operation Time Day Time per Operation (h)
Total Elapsed Time (h)
Harvest completed 08:30 1 0 0
Transferred to processing shed 08:30 1 0.5 0.5
Prepared for sale 09:00 1 3.5 4 Loaded for transport 12:30 1 0.5 4.5
Transit (growing location- depot) 13:00 1 4 8.5
Unloaded at depot 17:00 1 0.5 9
Stored at depot 17:30 1 2.5 11.5 Loaded for transport 20:00 1 0.25 11.75
Transit (depot to Melb restaurant) 20:15 1-2 12.75 24.5
Delivered to customer 09:00 2 0 24.5
0 6 12 18 240
5
10
15
20
25
30
NSW Food AuthorityTemp
NSW Food Authority temperature regulation
Collected fortransport
Depot
Delivered tocustomer
Hours
Tem
pera
ture
°° °°C
Figure 3.30: Temperature profile of a Sydney Rock O yster cool-chain from the Clyde River, New South Wales to Melbourne. Zero hours is the poi nt of harvest completion.
The supply-chain temperature profile summarised in Table 3.36 and Figure 3.30 has adhered to the NSW state dispensation for the storage of shellfish. Furthermore, in comparison to other supply-chains from NSW, product is transported efficiently to the customer with no time wasted in storing the product prior to transport. These practices are an example of a model supply-chain.

Project No: 2007/700
52
Table 3.37: Flow sheet describing a supply-chain fr om the Clyde River, New South Wales to Sydney.
Operation Time Day Time per Operation (h)
Total Elapsed Time (h)
Harvest completed 08:30 1 0 0
Transferred to processing shed 08:30 1 0.5 0.5
Prepared for sale 09:00- 1 7 7.5 Stored in processing shed 16:00 1 0.75 8.25
Loaded for transport 16:45 1 0.25 8.5
Transit (growing location - Sydney depot)
17:00 1 4 12.5
Unloaded at depot 21:00 1 0.5 13
Stored at depot 21:30 1-2 11 24 Loaded for transport 08:30 2 0.25 24.25
Transit (depot to Sydney restaurant) 08:45 2 0.75 25
Delivered to customer 09:30 2 0 25
0 6 12 18 24 300
5
10
15
20
25
30
NSW Food AuthorityTemp
NSW Food Authority temperature regulation
Collec ted fortransport
Depot Delivered tocustomer
Hours
Tem
pera
ture
°° °°C
Figure 3.31: Temperature profile of a Sydney Rock O yster cool-chain from the Clyde River, New South Wales to Sydney. Zero hours is the point of harvest completion.
The supply-chain temperature profile summarised in Table 3.37 and Figure 3.31 from the same producer as the previous profile has again adhered to the NSW state dispensation for the storage of shellfish. This supply-chain to Sydney is also an example of a good model, particularly as it reaches its destination approximately five days faster than the supply-chain profiled from Port Stephens (Figure 3.28).

Project No: 2007/700
53
Table 3.38 Flow sheet describing a supply-chain fro m Batemans Bay, New South Wales to Sydney.
Operation Time Day Time per Operation (h)
Total Elapsed Time (h)
Harvest completed 06:00 1 0 0
Transferred to processing shed 06:00 1 1 1
Tipped and prepared for grading 07:00 1 2 3 Transferred to store room 09:00 1 0.25 3.25
Held in store room (<25°C) 09:15 1-3 47.75 51
Oysters graded and prepared for sale
09:00 3 6 57
Transferred to store room 15:00 3 0.25 57.25
Held in store room (<25°C) 15:15 3-4 22.75 80
Loaded for transport 14:00 4 0.25 80.25
Transit (Batemans Bay-Sydney depot)
14:15 4 3.75 84
Unloaded at depot 18:00 4 0.25 84.25
Stored at depot 18:15 4-5 13.25 97.5
Loaded for transport 07:30 5 0.25 97.75 Transit (Sydney depot to Sydney customer)
07:45 5 1 98.75
Delivered to customer 08:45 5 0 98.75
0 24 48 72 96 1200
5
10
15
20
25
30
NSW Food AuthorityTemp
NSW Food Authoritytemperature regulation
DepotDelivered tocustomer
Hours
Tem
pera
ture
°° °°C
Figure 3.32: Temperature profile of a Sydney Rock O yster cool-chain from Bateman’s bay, New South Wales to Sydney. Time zero is the point of harvest completion.
The supply-chain temperature profile, summarised in Table 3.38 and Figure 3.32, has adhered to the NSW state dispensation for the storage of shellfish. This grower has indicated that the three days of storage allows product to slowly cool and reduces any mortalities that may be associated with cold storage. This product was transported at ambient temperature.

Project No: 2007/700
54
Table 3.39: Flow sheet describing a supply-chain fr om Batemans Bay, New South Wales to Sydney.
Operation Time Day Time per Operation (h)
Total Elapsed Time (h)
Harvest completed 07:00 1 0 0
Transferred to processing shed 07:00 1 1 1
Tipped and prepared for grading 08:00 1 1 2 Transferred to store room 09:00 1 0.25 2.25
Held in store room (<25°C) 09:15 1-3 47.75 50
Oysters graded and prepared for sale
09:00 3 6 56
Transferred to store room 15:00 3 0.25 56.25
Held in store room (<25°C) 15:15 3-4 22.75 79
Loaded for transport 14:00 4 0.5 79.5
Transit (Batemans Bay-Sydney retailer)
14:30 4 4.5 84
Delivered to customer 19:00 4 0 84
0 24 48 72 96 1200
5
10
15
20
25
30
Delivered tocustomer
NSW Food AuthorityTemp
NSW Food Authoritytemperature regulation
Collected fortransport
Hours
Tem
pera
ture
°° °°C
Figure 3.33: Temperature profile of a Sydney Rock O yster cool-chain from Bateman’s bay, New South Wales to Sydney.
The supply-chain temperature profile, summarised in Table 3.39 and Figure 3.33, indicates that in this instance, the three days of storage prior to transport has led to the chain failing to adhere to the NSW state dispensation for the storage of shellfish.

Project No: 2007/700
55
3.3.3 Summary of temperature profiling
A summary by state of the number of supply-chains profiled, number of violations of the relevant standard and number of serious cold abuse cases are provided in Table 3.40. Table 3.40: Summary of supply-chain profiling.
State Number profiled
Number in excess of relevant temperature regulation
No. of cold abuse cases*
SA 22 11 7
Tas 12 5 1
NSW 11 5 0 Total 45 21 8 * 2°C has been used as an indicator for severe cold abuse in Pacific Oysters and 5°C for Sydney Rock
Oysters (5°C and 8°C represents the lower band of what is considered optimum for Pacific Oysters and Sydney Rock oysters respectively, consequently 2°C and 5°C have been used as indicators of severe abuse).
This study has shown that a significant proportion of oysters in Australia are transported at temperatures that do not conform to the state Shellfish Quality Assurance Programs of NSW, Tasmania and South Australia where 50%, 42% and 45% of trips were non-compliant. In SA and Tas, many of the violations were as a result of slow cooling rates following harvest, while in NSW, breaches occurred because product was stored for 72 hours or longer prior to transport. Several instances were noted that could result in severely stressed or moribund product arriving at the customer due to cold stress, particularly where transport chains were longer than 48 hours. Industry has reported that cold abuse often occurs when the insides of trailers are baffled to transport different types of stock at different temperatures and oysters are placed in a bay next to frozen stock. Cold abuse has resulted in significant losses of product being transported interstate, particularly in the long complex chains such as SA to far north Queensland. Taken together with the violations of the relevant standards, these profiles highlight the need to educate both growers and transporters in ways to cool product effectively and maintain optimum temperatures. Temperature profiling of current supply-chains can identify problems occurring within the cool-chain such as: 1. Failure to reduce product temperature prior to loadout to 10°C in SA and Tas and to
15°C in NSW, when product is stored for 72 hours or longer at ambient temperature. 2. Using a taut-lined refrigerated truck for stock which must be no warmer than 10°C,
especially when multiple loads are required, involving regular opening (and warming) when the truck side is lifted.
3. Customer transport and storage that subjects product to extreme cold abuse. 4. Unnecessary journeys e.g. Smoky Bay and Streaky Bay to Port Augusta, then
Adelaide only to be shipped to Perth via Port Augusta and Ceduna (40 km from Smoky Bay).
5. Storing stock for several days in either chilled or ambient rooms reducing practical shelf-life and leading to regulatory violations.
6. Oysters stored in commercial transit vehicles subjected to abuse. 7. Commercial chillers in depots being set to 2°C. 8. Inconsistencies in storage temperatures in repeat supply-chains.

Project No: 2007/700
56
Temperature profiling may be undertaken by individual companies, collecting data as part of their routine operations, or by collaborative growing bodies in each state. The South Australian Oyster Growing Association has indicated an interest in continuing the temperature profiling work with the aim of reducing abuse of product from SA. This will include temperature profiles in different chambers that are divided to allow for different storage temperatures, a practice often used in transport chains. The data indicate that some transporters and wholesalers are unaware of how to appropriately store live product. Industry would benefit by producing information that details appropriate cooling methods and storage temperatures for oysters. Not surprisingly, given the foregoing, most of the supply-chains did not conform with the AQIS requirement of less than 5°C. This requirement could cause stress on oysters resulting in reduced shelf-life and potentially increased mortalities.
3.4 Evaluation of Pallet Stacking Techniques
Industry stacks pallets in two ways: loading sacks in a solid mass (Fig 3.34) or as a hollow shell (Fig 3.35). In general, the industry uses the former as this allows for more bags per pallet. However, some growers believe that the hollow stacking technique allows for more effective cooling of product as it allows for a ‘chimney-like’ flow of air up through the centre of the stack. Data loggers were inserted in sacks in a hollow and a solid pallet; the temperature profiles are presented in Fig 3.36.
Layer 1 Layer 2 Layer 3 Layer 4
Figure 3.34: Method for stacking a solid-style oyst er pallet.
Layer 1 Layer 2 Layer 3 Layer 4
Figure 3.35: Method for stacking a hollow-style oys ter pallet.

Project No: 2007/700
57
A
0 2 4 6 8 10 12 14 16 18 20 220
5
10
15
20
25
Hours
Tem
pera
ture
(°° °°C
)
B
0 2 4 6 8 10 12 14 16 18 20 220
5
10
15
20
25
Hours
Tem
pera
ture
(°° °°C
)
Figure 3.36: Graph A depicts temperature profiles f rom a solid-style oyster pallet and Graph B represents temperature profiles of a hollow -style pallet. Zero minutes is the point that the pallet was placed in the communal chiller (note: the hollow-style pallet was placed in the chiller approximately three hours prior to t he solid-style pallet). In both graphs, black lines represent profiles of individual oyster sacks, red lines represent ambient temperatures and dotted green lines represent an op timum storage temperature of 10 °°°°C.

Project No: 2007/700
58
The profiles presented in Figure 3.36 indicate clear differences between the two pallet stacking methods. However, the hollow-style pallet was stored in the chiller for approximately three hours longer than the solid pallet prior to collection by refrigerated transport (initial collection by the refrigerated transport vehicle can be seen by the first large peaks in ambient temperature in both graphs). The hollow stack resulted in a narrower range of temperatures than in the solid pallet, reflecting the slower cooling rate of product in the centre of the latter. The majority of logged oyster sacks in the hollow stack reached 10°C by 13 hours. By comparison, nearly all of the oyster sacks in the solid pallet were above 10°C at this time. An alternative way to cool product effectively would be to chill individual sacks of oysters prior to being stacked onto pallets. Ideally, oysters should be packed for transport the day prior to collection for transport to allow sufficient time for cooling in a proper chiller rather than on board a refrigerated vehicle.
3.5 Microbiology of Oysters at 8°C and 15°C
Pacific Oysters from SA and Tas and Sydney Rock Oysters from NSW were stored at 8°C and 15°C. Samples were withdrawn at intervals and the Aerobic Plate Count (APC) and sulphide-producing bacteria measured. Summaries of results are provided in Figures 3.37 and 3.38.
3.5.1 Sydney Rock Oysters In two storage trials, Sydney Rock Oysters were stored at 8°C and 15°C. In the first trial, oysters took 20 days to reach organoleptic spoilage as evidenced by odour formation. APCs and H2S producing bacteria stored at 8°C and 15°C both remained around log 5 cfu/g until Day 18 when there was a 2-log increase. H2S producing bacteria remained around log 3 cfu/g throughout the storage period. APCs and sulphide reducers were at similar concentrations at 8°C and 15°C. In the second trial, oysters remained acceptable organoleptically for 21 days with APCs remaining at log 5 cfu/g. Sulphide-producers fluctuated between log 1-3 cfu/g through the trial.
3.5.2 Tasmanian oysters Stored Tasmanian Pacific Oysters took 16 days to reach organoleptic spoilage at 8°C and 12 days at 15°C. APCs remained at log 5 cfu/g while acceptable organoleptically, rising to >log 8 cfu/g at the end of shelf-life, while sulphide-producers remained in the range log 1-3 cfu/g.
3.5.3 South Australian Pacific Oysters South Australian Pacific Oysters had shelf-lives, APCs and sulphur-producer counts similar to those of Pacific oysters from Tasmania. These data confirm the traditionally-held belief that Pacific Oysters and Sydney Rock Oysters respond differently to refrigerated storage, with the latter having a considerably longer shelf-life both at 8°C and 15°C – a result pointing to no increased risk from storing oysters at the warmer temperature. Why Sydney Rock Oysters have longer shelf-lives when stored at relatively high temperatures is not known. It is known, however, that at warmer temperatures oysters may be more active allowing natural immune defences to be more effective. Haemocytes have been reported to contain hydrolytic enzymes and to produce reactive oxygen species (ROS), which play a key role in pathogen degradation

Project No: 2007/700
59
(Gagnaire et al., 2006). Further work is planned in the Seafood CRC project 2007/719 Predicting the Safety and Quality of Australian Oysters with Integrated Predictive Tools. A study by Bird et al. (1995) examined the effects of storage at 5°C and ambient temperature on purified, live Sydney Rock and Pacific Oysters. Counts per gram for Pacific Oysters stored at 5°C for 14 days increased from log 2.4 to 3.5 cfu/g. When Pacific Oysters were stored at ambient temperature, counts increased to log 3.5 cfu/g after eight days of storage. However, in this study Pacific Oyster counts were much higher. At Day zero both Tas and SA counts were log 5.5 cfu/g. When stored at 8°C counts were log 6.1 cfu/g (Tas) and log 7 cfu/g (SA). For oysters stored at 15°C counts were log 8 cfu/g (Tas) and log 8.3 cfu/g (SA). The counts noted in this study are more in keeping with those reported by Madigan et al. (2007) in a storage trial of whole live Pacific Oysters. In that study, counts were log 5.2 cfu/g at Day zero and over the eight days increased to 6.5 for oysters stored at 8°C and 7.8 for oysters stored at 15°C. Counts per gram for Sydney Rock Oyster examined by Bird et al. (1995) were approximately log 4 cfu/g at time zero and in oysters stored at 5°C decreased to 2.1 after 14 days and 1.5 after eight days of storage in oysters stored at ambient temperatures. Counts for Sydney Rock Oysters in this study by comparison were slightly higher at log 4.6 and log 5 cfu/g at Day zero in the first and repeated study respectively. Potentially the purification process used in the earlier study, where oysters were depurated in UV treated seawater may have decreased the amount of bacteria present in the both species of oysters used in the experiments.

Project No: 2007/700
60
0 5 10 15 20 250
1
2
3
4
5
6
7
8
APC8APC15
A
Day
Log
10C
ount
s pe
r gr
am
B
0 5 10 15 20 250
1
2
3
4
5
H2S8H2S15
Day
Log
10C
ount
s pe
r gr
am
C
0 1 2 3 4 5 6 7 8 9 10111213141516170123456789
APC8APC15
Day
Log
10C
ount
s pe
r gr
am
D
0 1 2 3 4 5 6 7 8 9 10111213141516170
1
2
3
4
H2S8H2S15
Day
Log
10C
ount
s pe
r gr
am
E
0 1 2 3 4 5 6 7 8 9 10 11 12 13 14 150123456789
APC8APC15
Day
Log
10C
ount
s pe
r gr
am
F
0 1 2 3 4 5 6 7 8 9 10 11 12 13 14 150
1
2
3
4
5
H2S8H2S15
Day
Log
10C
ount
s pe
r gr
am
Figure 3.37: Aerobic Plate Count (APC) and sulphide producers (H 2S) on oysters sourced from NSW (A, B), Tasmania (C, D) and SA (E, F).

Project No: 2007/700
61
0 5 10 15 20 250
1
2
3
4
5
6
APC 8APC 15
A
Day
Log
10 c
ount
s pe
r gr
am
0 5 10 15 20 250
1
2
3
4H2S 8H2S 15
B
Day
Log
10 c
ount
s pe
r gr
am
Figure 3.38: Aerobic Plate Count (APC) and sulphide producers (H 2S) on oysters sourced from NSW.
Shewanella and Shewanella-like organisms are considered to be typical psychrotrophic seafood spoilage organisms for product stored in ice (Gram & Huss, 1996). Lyngby iron agar is commonly used as an indicator to assess for counts of H2S-producing bacteria. In this study sulphur-producers typically comprised no more than 1% of the total microflora whereas, in seafood stored in ice or under refrigeration they become the dominant microflora. These results indicate that the use of sulphur-producers as an indicator of spoilage in oysters is not appropriate, since oysters remain alive for much of the storage period and at 8°C and 15°C psychrotrophs will not be selected over the short period between death and spoilage.
3.6 Identification of Future Research, Investment, Education and Training Priorities for the Australian Oyster Indus try
This work has identified two main areas for future education and training priorities:
1. Industry training is needed to assist oyster producers integrate temperature-logging technologies into their businesses. The training should provide growers with an understanding of the range of devices that are available, from the most basic through to the most advanced. This information should also include an estimation of the costs that are associated with the differing levels of devices. An excellent resource for industry would be a comprehensive listing of these technologies including contact details for companies that can provide and/or assist with integrating the technologies into their businesses.
2. Industry needs training into methods of appropriately cooling product in order to
meet regulatory requirements. The data contained in this report have indicated a serious failing within industry and the seriousness and extent of this problem warrants the development of tailored workshops that could be delivered to industry at meetings of oyster producers in each state.
Areas of future research are discussed under Section 5 of this report.

Project No: 2007/700
62
3.7 Providing Input to the Development of the Austr alian Oyster Refrigeration Index
Meetings were held with Professor Mark Tamplin, the Principal Investigator of the Australian Seafood CRC project 2007/719 Predicting the Safety and Quality of Australian Oysters with Integrated Predictive Tools. These meetings were used to discuss potential methodologies for the development of the predictive model for V. parahaemolyticus. Professor Tamplin received a Milestone Report from this project, submitted to the Australian Seafood CRC on the 5th May 2008. He has also been updated with all temperature profiles of note since this time for use in developing their predictive model. The submission of this final report will include Microsoft Excel files that contain raw data from all profiles presented in this report.

Project No: 2007/700
63
4. Benefits and Adoption
Industry will benefit directly from this research, initially through a reduction in losses associated with cold abuse that has been occurring in product transported from South Australia and Tasmania. In the longer term, uptake of this work will lead to an increase in the quality of oysters being supplied, allowing producers to achieve a premium price. Industry members and representative bodies are extremely interested in the methods used to collect temperature profiles of supply-chains. Particularly, as individual companies can routinely undertake this type of profiling in their operations at minimal cost. At least one large commercial producer of Pacific Oysters is now using the same technology used in this project in their operations and several companies have requested information on how to access this technology. The South Australian Oyster Growers Association is also considering taking this work on as part of their routine service for industry to assist in driving faster changes across the transport industry.

Project No: 2007/700
64
5. Further Development
• This work should be presented to industry to highlight the usefulness of profiling oyster supply-chains.
• This work should be presented to the State regulators and industry to highlight
failings in current cool-chains. • Further temperature profiling should be undertaken by industry to build
confidence in their supply-chain. • Ideally, in the longer term, transport companies should be persuaded to provide
temperature profiles as part of their service to companies. • Information should be prepared and sent to the growing associations in each state
to highlight the advantages of temperature profiling. • There is potential for the Australian Seafood CRC to provide specialist support for
other seafood industries to evaluate their supply-chains.
• Data generated in this project will be used in the follow-on project 2007/719 Protecting the Safety and Quality of Australian Oysters with Integrated Predictive Tools. This project will develop a predictive tool that can be used across the oyster supply-chain to control the risk of bacterial contamination by V. parahaemolyticus. Part of this work will validate different temperature regimes that are currently set by ASQAP and the NSW Food Authority and to establish if the new requirements set by AQIS are warranted. This data could then be used as part of presenting a formal further argument to AQIS to validate an external temperature as set out in the Export Control (Fish & Fish Products) Orders 2005.
• It may be beneficial to undertake an examination of shelf-life based on
biochemical composition of oysters over the reproductive cycle. This work would compare changes in shelf-life in comparison to the percentage of glycogen and lipids within oysters at time of harvest.

Project No: 2007/700
65
6. Planned Outcomes
Short Term: Temperature profiling of problematic supply-chains will provide immediate capacity to reduce business risk from losses due to unacceptable food safety risks and quality. These losses have occurred in lengthy/problematic supply-chains and currently represent a significant economic loss. This project has already begun to assist industry in this manner. Medium Term: Importantly, this project will also provide a framework for Australian oyster industries (Pacific and Sydney Rock) to evaluate their cool-chain profiles. This will be critical in presenting a further argument to AQIS that the ASQAP regulations and current NSW state dispensation for Sydney Rock Oysters should be accepted by AQIS for inclusion into their Export Control (Fish & Fish Products) Orders. Once methodologies used in this project are adopted by industry, the project will have provided the oyster industry with capacity to optimise its cool-chain management, which in turn will lead to both increased food safety and quality. This will underpin industry’s market development work, particularly to the US and EU markets and potentially position industry to negotiate premium prices in both the domestic and export markets. The work also provides a benchmark against which future cool-chain interventions and performance could be monitored. Long Term: Development and implementation of Australian oyster cool-chain systems that underpin the industry’s reputation for supply of consistent product and consumer confidence.

Project No: 2007/700
66
7. Conclusion
This project has developed a framework that can be used by industry to implement cool-chain evaluation practices to increase the food safety status and quality of their product. It has successfully mapped supply-chains Australia wide. Supply-chains profiled as part of this project are of concern as a large proportion of them failed to meet their regulatory requirements and there were also several instances of cold abuse noted in the study. These cold abuse events can lead to losses of entire shipments of oysters and represent a significant cost to industry. The use of the temperature profiling framework developed in this project will assist producers minimise violations of the regulatory standards in the future and also minimise the occurrence of losses associated with cold abuse. Microbial growth profiles developed in this project confirm that, as suggested by industry, Sydney Rock Oysters behave differently in cool storage. These results begin to validate the NSW state dispensation for these species. However, these results must be confirmed using growth models of V. parahaemolyticus. If these preliminary results are confirmed by that work, then it should be recommended that the NSW state dispensation be formalised into ASQAP.

Project No: 2007/700
67
References
Anon (2005) Case study: Ring ring. NSW Food Authority Annual Report 2004/2005, 30. Bird PD, Arnold GJ, Howell TL, Boronovshy A (1992) Effect of Storage on the Quality of Purified Live Pacific and Sydney Rock Oysters. Conf. Internationale sur la Purification des Coquillages, Rennes, (France), IFREMER, CENTRE DE BREST, PLOUZANE (FRANCE) Cook DW, Ruple AD (1989) Indicator bacteria and Vibrionaceae multiplication in post-harvest shellstock oysters. Journal of Food Protection 52, 343-349. Daniels NA, MacKinnon L, et al. (2000) Vibrio parahaemolyticus infections in the United States, 1973-1998. J Infect Dis 181, 1661-1666. Davey GR, Prendergast JK, Eyles MJ (1982) Detection of Vibrio cholerae in oysters, water and sediment from the Georges River. Food Technology Australia 34, 334-336. Desmarchelier P (1978) Vibrio parahaemolyticus and other vibrios. Food Technology Australia 30, 339-345. Eyles MJ, Davey GR, Arnold G (1985) Behavior and incidence of Vibro parahaemolyticus in Sydney Rock Oysters (Crassostrea commercialis). International Journal of Food Microbiology 1, 327-334. Gagnaire B, Frouin H, Moreau K, Thomas-Guyon H, Renault T (2006) Effects of temperature and salinity on haemocyte activities of the Pacific oyster, Crassostrea gigas (Thunberg). Fish & Shellfish Immunology 20, 536-547. Gram L, Huss HH (1996) Microbiological spoilage of fish and fish products. International Journal of Food Microbiology 33, 121-137. Goatcher L, Errgler S, Wagner D, Westhoff D (1974) Effect of storage at 5 degrees celcius on survival of Vibrio parahaemolyticus in processed Maryland oysters (Crassostrea virginica). Journal of Milk and Food Technology 37, 74-77. Gooch JA, DePaola A, Kaysner CA, Marshall DL (2002) Growth and Survival of Vibrio parahaemolyticus in post harvest American oysters. Journal of Food Protection 65, 970-974. Hood MA, Ness GE, Rodrick GE, Blake NJ (1983) Effects of storage on microbial loads of two commercially important shellfish species, Crassostrea virginica and Mercenaria campechiensis. Appl Environ Microbiol 45, 1221-1228. ICMSF (1996) 'Microorganisms in Food. Volume 5: Microbiological specifications of food pathogens.' (Blackie Academic and Professional: London). Johnson H, Liston J (1973) Sensitivity of Vibrio parahaemolyticus to cold in oysters, fish fillets and crab meat. Journal of Food Science 38, 437-441.

Project No: 2007/700
68
Kraa E (1995) Surveillance and epidemiology of foodborne illness in NSW, Australia. Food Australia 47, 418-423. Lewis T, Brown M, Abell G, McMeekin T, Sumner J (2002) Pathogenic Vibrio parahaemolyticus in Australian oysters. Madigan TL, Lee KJ, Pointon AM, Thomas CJ (2007) SIDF 2005/401 A supply--chain assessment of marine vibrios in Pacific Oysters in South Australia: prevalence, quantification and public health risk. South Australian Research and Development Institute Report. Martinez-Urtaza J, Lozano-Leon A, DePaola A, Ishibashi M, Shimada K, Nishibuchi M, Liebana E (2004) Characterization of pathogenic Vibrio parahaemolyticus isolates from clinical sources in Spain and comparison with Asian and North American pandemic isolates. J Clin Microbiol 42, 4672-4678. Maxwell EL, Mayall BC, Pearson SR, Stanley PA (1991) A case of Vibrio vulnificus septicaemia acquired in Victoria. Med J Aust 154, 214-215. McAnulty J (1990) Vibrio warning. New South Wales Public Health Bulletin, 1, 12-18. McLaughlin JB, DePaola A, et al. (2005) Outbreak of Vibrio parahaemolyticus gastroenteritis associated with Alaskan oysters. N Engl J Med 353, 1463-1470. Morris JG, Jr. (2003) Cholera and other types of vibriosis: a story of human pandemics and oysters on the halfshell. Clinical Infectious Diseases 37. Nell JA (2001) The history of oyster farming in Australia. Marine Fisheries Review. Summer, 14-25. Nordstrom JL, Kaysner CA, Blackstone GM, Vickery MC, Bowers JC, DePaola A (2004) Effect of intertidal exposure on Vibrio parahaemolyticus levels in Pacific Northwest oysters. J Food Prot 67, 2178-2182. Potasman I, Paz A, Odeh M (2002) Infectious outbreaks associated with bivalve shellfish consumption: a worldwide perspective. Clin Infect Dis 35, 921-928. Ralph A, Currie BJ (2007) Vibrio vulnificus and V. parahaemolyticus necrotising fasciitis in fishermen visiting an estuarine tropical northern Australian location. J Infect 54, e111-114. Tantillo GM, Fontanarosa M, Di Pinto A, Musti M (2004) Updated perspectives on emerging vibrios associated with human infections. Lett Appl Microbiol 39, 117-126.

Project No: 2007/700
69
Appendix 1: Marine Vibrio spp.
The predominant species of Vibrio involved in human infections worldwide are V. parahaemolyticus, V. vulnificus and V. cholerae. Marine Vibrio spp. are increasingly associated with disease caused by ingestion of raw, contaminated shellfish harvested from warmer waters (>20°C) (Potasman et al., 2002). Infections usually result in gastroenteritis, but can lead to severe septicaemia, especially in individuals with impaired renal capacity and the immuno-compromised. Over recent years there has been a world-wide trend of an increase in reports of illness caused by these marine bacteria. Illness resulting from consumption of foods contaminated by Vibrio spp., can present as gastroenteritis or septicaemia. Raw shellfish acquired Vibrio infections are a significant cause of food related gastrointestinal illness in Asia. V. parahaemolyticus is thought to be responsible for approximately half of the food poisoning outbreaks in Taiwan, Japan and Southeast Asian countries (Martinez-Urtaza et al., 2004). In the USA, between 1988 and 1997, a total of 345 cases of V. parahaemolyticus infections were reported from Florida, Alabama, Louisiana and Texas (Daniels et al., 2000) with most reported illnesses associated with seafood harvested from warmer waters of the Gulf of Mexico. In 1997 and 1998, there was a large increase in reported illnesses involving three large outbreaks (Daniels et al., 2000). However, not all outbreaks due to oyster consumption are from warmer waters. In 2004, there was an outbreak of illness due to V. parahaemolyticus in Alaska, attributed to consumption of oysters, during a time when there was a mean water temperature of 16.6°C (McLaughlin et al., 2005). Reports of illnesses associated with pathogenic marine Vibrio spp. in Australia have typically been associated with both the consumption of shellfish and wound infections. Three large outbreaks associated with V. parahaemolyticus infections in Australia were traced to consumption of imported prawns (Kraa, 1995). The first, which occurred in 1990 affected 100 people and caused one death. In 1992, two separate outbreaks occurred that affected more than 50 people. However, only four cases of V. parahaemolyticus related illness caused by consumption of Australian shellfish have been reported with one death (Kraa, 1995; Anon, 2005). Between 1995 and 1998, four cases of illness occurred as a result of V. vulnificus infections following the consumption of Sydney Rock Oysters; these illnesses resulted in two deaths (McAnulty, 1990; Kraa, 1995). Other incidents of mortalities attributed to V. vulnificus related wound infections have also been reported (McAnulty, 1990; Maxwell et al., 1991; Ralph & Currie, 2007). There have been numerous reports of V. parahaemolyticus in Australian oysters (Table 1.1).
Table 1.1: Total Vibrio parahaemolyticus in Australian oysters
Type of seafood % Positive (number of samples)
Level reported Reference
Oysters (pooled, closed) 69 (41/60) Not reported Desmarchelier 1978
Oysters (pooled, closed) 60 (3/5) 4.6 per gram Davey et al. 1982
Oysters (pooled, closed) 100 (16/16) 0.4-2.3x10⁴ per gram Eyles et al. 1985 Oysters (retail, half-shell) 93 (13/14) 4.3- >1.1×10³ per gram Eyles et al. 1985
Oysters 60 (24/40) 9.0×10²-2×10³ per gram Lewis et al. 2002

Project No: 2007/700
70
Factors that influence occurrence and distribution of marine vibrios are: water temperature, nutrient availability and association with marine organisms (Tantillo et al., 2004). Relevant optimum conditions and limits for growth of V. parahaemolyticus and V. vulnificus are shown in Table 1.2. Oysters, in particular, are known to concentrate these bacteria to levels 100-fold higher than those in the surrounding water (Morris, 2003). Inter-tidal exposure, which occurs in most Australian oyster leases, may also facilitate increased growth of V. parahaemolyticus during the summer months (Nordstrom, 2004).
Table 1.2: Optimum conditions and growth limits for V. parahaemolyticus and V. vulnificus
Optimum conditions Growth range V. parahaemolyticus V. vulnificus V. parahaemolyticus V. vulnificus
Temperature (°C) 37 37 5 – 43 8 – 43
pH 7.8 – 8.6 7.8 4.8 – 11 5 – 10
Water activity (aw)
0.981 0.98 0.940 – 0.996 0.960 – 0.997
NaCl (%) 3 2.5 0.5 – 10 0.5 – 5 Data from ICMSF (1996). Growth of V. parahaemolyticus in oysters has been studied and Cook and Ruple (1989) reported that this bacterium is able to grow at temperatures above 10°C but did not detect any increase in counts during storage at 10°C. During refrigerated storage, viable counts of this organism have been observed to decrease substantially (Table 1.3), with the rate of inactivation greatest between 3 and 7°C.
Table 1.3: Death of V. parahaemolyticus in oysters during post-harvest storage
Substrate Temperature (°C)
Initial log count/g
Log kill/days
Reference
Live 5 5 1.5/14 Johnson & Liston (1973)
Shucked 5 6 6/10 Goatcher et al. (1974)
Live 8 1.9 1.9/21 Hood et al. (1983)
Shucked 8 1 1/14 Hood et al. (1983)
Live 3 - 6/14 Gooch et al (2002)

Project No: 2007/700
71
Appendix 2: Survey Letter, Form and Profile Letter 21/2/08 Dear Grower The Australian Seafood CRC Oyster Consortium has commissioned SARDI to undertake a project as part of the Australian Seafood CRC that evaluates oyster supply-chains around Australia. This project aims to increase food safety and quality of Australian oysters by optimising cool-chain efficiency. As part of this project, we are undertaking a survey to map oyster cool-chains around the country. Growers are not individually identified and all information provided will be treated with the highest confidentiality. However, we do request that you identify your growing area as part of this survey. The attached form should only take a few minutes to complete, but will greatly increase our understanding of current conditions. Once completed the attached survey form can be returned to me by fax on (08) 8207 7854 or mailed to the address below. Please return as soon as possible to ensure that your information will be included in the survey. If you have any queries regarding this survey or would like more information on the project, please do not hesitate to contact me. My sincere thanks for your time. Regards Tom Madigan Research Officer SARDI Food Safety 33 Flemington Street Glenside SA 5065 Phone: (08) 8207 7937 Mobile: 0423 028 255 Fax: (08) 8207 7854 Email: [email protected]

Project No: 2007/700
72
Survey of Australian Oyster
Supply-chains Please tick the appropriate box or enter a description.
Location where oysters are packed for transport:
.........................................................................................................................................................................................
Do you produce � Sydney rock or � Pacific oysters
At time of harvest, is your culture technique � Intertidal or � Subtidal
Do you a) use a chiller on site or shared chiller facility
� Yes � No
b) co-ordinate harvest with refrigerated transport
� Yes � No
c) cool using frozen gel packs (freezer blocks)
� Yes � No
d) cool using wet ice
� Yes � No
Do you use refrigerated transport: � Yes � No
Can you list the main destinations where your product is sold (eg Melbourne, Newcastle):
.........................................................................................................................................................................................
What is the maximum time, from harvest, that your oysters are in transport prior to sale
(exclude returns):
.........................................................................................................................................................................................
At what temperature do you request that your product be transported:
.........................................................................................................................................................................................
Does your product go through distribution centres on route: � Yes �
No
Description: ..................................................................................................................................................................
How many times have you experienced loss or deterioration of product during transport
from:
a) heat abuse: � Nil � 1-3 � 3-5 � 5-10 � 10 or more
b) extreme cold: � Nil � 1-3 � 3-5 � 5-10 � 10 or more
Description: .................................................................................................................................................................
For further comments please use a blank sheet of pa per and attach

Project No: 2007/700
73
To whom it may concern, This work is being undertaken to define oyster storage and transport temperatures Australia wide for the Australian Seafood CRC Oyster Consortium. Could the grower please keep the data logger (the small metal button) within the snaplock bag and fill in the information box below. Could the processor/retailer nominated to collect the logger, please also fill in the information box below and place this information sheet and the temperature logger in the attached envelope and return via the post. If you have any problems or queries please do not hesitate to contact me using the details listed below. Your assistance with the project is greatly appreciated. Kind regards Tom Madigan SARDI Food Safety Research 33 Flemington Street Glenside SA 5065 Phone: (08) 8207 7937 Mobile: 0423 028 255 Fax: (08) 8207 7854 Email: [email protected]
Grower Growing Location:…………………………………………………………………………………………………………
Address/fax No. where data should be sent (if wanted):………………………………….
Harvest date and time:………………………………………………………………………………….……………
Date and time logger placed in product:…………………………………………………………………
Was the product chilled prior top transport: � Yes � No
At what temperature do you request that your product be
transported:………………………………………………………………………………………………………………
Date and time product collected for transport:…………… …………………………………….
Expected times and locations of critical points of supply-chain (i.e. depot changes, air
transport, delivery to processor/ retailer):……………………………………
…………………………………………………………………………………………………………………………………………
Processor/retailer Location logger retrieved:…………………………………………………………………………………………
Date and time logger retrieved:………………………………………………………………………………

Project No: 2007/700
74
Appendix 3: Temperature Profiles
0 24 48 72 96 120 144 168 192 2160
5
10
15
20
25
ASQAPTemp
ASQAP regulation (10oC after 24 hours)
Hours
Tem
pera
ture
(°° °°C
)
Figure A3.1: Temperature profile of a long Pacific Oyster cool-chain from Smoky Bay, South Australia to Cairns. Zero hours is the point of harvest completion.
Figure A3.1 is indicative of the longest supply-chain from SA. No information was provided regarding critical points of this supply-chain. In this case oysters have adhered to the ASQAP standard of 10°C within 24 hours. However, oysters are stored below 5°C for the majority of this supply-chain and at one point remained at a stable 1°C for approximately 48 hours.
12 24 36 480
5
10
15
20
25
ASQAP
ASQAP regulation
(10oC after 24 hours)
Temp
Collected fortransport
Adelaidedepot
Retrievedby customer
Hours
Tem
pera
ture
(°° °°C
)
Figure A3.2: Temperature profile of a Pacific Oyste r cool-chain from Coffin Bay, South Australia to Melbourne. Zero hours is the point of harvest completion.
The profile presented in Figure A3.2 complies with the ASQAP standard. It is unclear what caused the large temperature spike at approximately six hours as no data was recorded for this supply-chain at this time point. The small spikes seen across the remainder of the supply-chain are indicative of depot changes or opening of the truck causing a slight temperature increase.

Project No: 2007/700
75
0 12 24 36 48 60 720
5
10
15
20
25
Adelaide depot
ASQAP
ASQAP regulation
(10oC after 24 hours)
TempCollected fortransport
Hours
Tem
pera
ture
(°° °°C
)
Figure A3.3: Temperature profile of a Pacific Oyste r cool-chain from Smoky Bay, South Australia to Perth. Zero hours is the point of harv est completion.
The profile presented in Figure A3.3 does not comply with the ASQAP standard due to the temperature spike at the 48 time point. It is unclear what has caused this temperature spike as there was no information provided, however, this is a notable increase in storage temperature and is of concern.
0 24 48 72 96 120 144 168 1920
5
10
15
20
25
Product collectedfor transport
ASQAPTemp
ASQAP regulation (10oC after 24 hours)
Hours
Tem
pera
ture
(°° °°C
)
Figure A3.4: Temperature profile of a Pacific Oyste r cool-chain from Smoky Bay, South Australia to Gold Coast. Zero hours is the point of harvest completion.
The profile presented in Figure A3.4 adheres to the ASQAP standard. No further information was provided for this supply-chain.

Project No: 2007/700
76
0 12 24 36 480
5
10
15
20
25Collected fortransport
Adelaidedepot
ASQAP
ASQAP regulation
(10oC after 24 hours)
Temp
Delivered tocustomer
Hours
Tem
pera
ture
(°° °°C
)
Figure A3.5: Temperature profile of a Pacific Oyste r cool-chain from Smoky Bay, South Australia to Melbourne. Zero hours is the point of harvest completion.
The profile presented in Figure A3.5 adheres to the ASQAP standard. There were no rapid fluctuations in temperature for the majority of the supply-chain, however, the temperature drops suddenly to 1°C at approximately 45 hours. The cause of this drop is unknown, but likely corresponds to storage by the customer.
24 48 72 96-5
0
5
10
15
20
25
Collected fortransport
Retrieved bycustomer
ASQAP
ASQAP regulation (10oC after 24 hours)
Temp
Hours
Tem
pera
ture
(°° °°C
)
Figure A3.6: Temperature profile of a Pacific Oyste r cool-chain from Cowell, South Australia to the Sunshine Coast, Queensland. Time z ero is point of harvest.
The profile presented in Figure A3.6 adheres to the ASQAP standard and the temperature remains stable until 72 hours where the temperature drops rapidly to fluctuate below 0°C. This type of cold abuse can result in significant loss of product. However, no product losses were reported in this chain. Reportedly, this drop in temperature occurred when the processor transferred the stock to a private delivery vehicle.

Project No: 2007/700
77
0 24 48 72 960
5
10
15
20
25
Collected fortransport
ASQAP
ASQAP regulation (10oC after 24 hours)
Temp
Adelaidedepot Retrieved by
customer
Hours
Tem
pera
ture
(°° °°C
)
Figure A3.7: Temperature profile of a Pacific Oyste r cool-chain from Cowell, South Australia to Perth, Western Australia. Zero hours i s the point of harvest completion.
The profile presented in Figure A3.7 adheres to the ASQAP standard as the temperature rises to a maximum of 10°C shortly after the 48 hour time point.
0 24 48 720
5
10
15
20
25
Collected fortransport
ASQAPTemp
ASQAP regulation (10oC after 24 hours)
Adelaidedepot
Hours
Tem
pera
ture
(°° °°C
)
Figure A3.8: Temperature profile of a Pacific Oyste r cool-chain from Cowell, South Australia to the Sunshine Coast, Queensland. Zero h ours is the point of harvest completion.
The profile presented in Figure A3.8 does not adhere to the ASQAP standard due to an increase in temperature at approximately 24 hours.

Project No: 2007/700
78
0 24 48 72 96 1200
5
10
15
20
25
ASQAP
ASQAP regulation (10oC after 24 hours)
Temp
Hours
Tem
pera
ture
(°° °°C
)
Figure A3.9: Temperature profile of a Pacific Oyste r cool-chain from Coffin Bay, South Australia to Western Australia. Zero hours is the p oint of product collection.
No time of harvest or time of depot changes was specified for this supply-chain. The temperature profile presented in Figure A3.9 indicates that the product was subjected to rapid variations in temperature for the first 24 hours. However, it did not adhere to the ASQAP standard (temperature was 10.4°C at 24 hours). The temperature spike at the end of the chain would again correspond to the removal of the loggers from product.
0 24 48 72 96 120 1440
5
10
15
20
25
ASQAPTemp
ASQAP regulation (10oC after 24 hours)
Collected fortransport
Adelaidedepot
Retrieved byCustomer
Hours
Tem
pera
ture
(°° °°C
)
Figure A3.10: Temperature profile of a Pacific Oyst er cool-chain from Cowell, South Australia to Brisbane. Zero hours is the point of h arvest completion.
The profile shown in Figure A3.10 has failed to adhere to the ASQAP standard, because of the temperature peak at the 72 hour point. This peak probably corresponds to arrival at the customer as 72 hours would be considered usual for a supply-chain to Brisbane. However, the rapid drop in temperature following the 72 hours time point and fluctuations apparent after this point would likely have led to product being stressed.

Project No: 2007/700
79
0 24 48 72 96 120 144 1700
5
10
15
20
25
ASQAP
ASQAP regulation (10oC after 24 hours)
Temp
Collected fortransport
Adelaidedepot
Retrieved bycustomer
Hours
Tem
pera
ture
(°° °°C
)
Figure A3.11: Temperature profile of a Pacific Oyst er cool-chain from Cowell, South Australia to the Sunshine Coast, Queensland. Zero h ours is the point of harvest completion.
The profile shown in Figure A3.11 has adhered to the ASQAP standard. However, the temperature continues to decrease to approximately 2°C and fluctuates below 2°C until the logger was removed from product. However, a 73 hour period would be a usual transport time to the Sunshine Coast. So these low temperatures are likely reflective of the customer’s cool room.
0 24 48 72 96 120 144 168 192 216 240-5
0
5
10
15
20
25
ASQAP
ASQAP regulation (10 oC after 24 hours)
Temp
Collectedfor transport
Adelaidedepot
Retrieved bycustomer
Hours
Tem
pera
ture
(°° °°C
)
Figure A3.12: Temperature profile of a Pacific Oyst er cool-chain from Cowell, South Australia to Cairns, Queensland. Zero hours is the point of harvest completion.
The profile shown in Figure A3.12 has adhered to the ASQAP standard. However, at approximately 72 hours, the temperature drops suddenly to below 0°C and stays at approximately 0°C for 36 hours, before increasing slightly for the remainder of the supply-chain. This would have severely stressed product. This drop in temperature at 72 hours most likely represents a truck change in Brisbane.

Project No: 2007/700
80
0 12 24 36 480
5
10
15
20
25
ASQAP
ASQAP regulation
(10oC after 24 hours)
Temp
Collected fortransport
Retrieved bycustomer
Hours
Tem
pera
ture
(°° °°C
)
Figure A3.13: Temperature profile of a Pacific Oyst er cool-chain from Coffin Bay, South Australia to Melbourne. Zero hours is the point of harvest completion.
The profile shown in Figure A3.13 has adhered to the ASQAP standard. However, the temperature fluctuates rapidly after the 24 hours point.
0 4 8 12 16 20 24 280
5
10
15
20
25
AdelaideAirport
Productcollected
ASQAP
ASQAP regulation(10oC after 24 hours)
Temp
Hours
Tem
pera
ture
(°° °°C
)
Figure A3.14: Temperature profile of a Pacific Oyst er cool-chain from Coffin Bay, South Australia, to Broome in Western Australia.
The profile shown in Figure A3.14 has not adhered to the ASQAP standard. The slow cooling rates apparent over the first 12 hours is indicative of foam packaging being used, which was most likely used in this instance as this product was sent by airfreight to Broome.

Project No: 2007/700
81
0 24 48 72 960
5
10
15
20
25
30
35
ASQAP
ASQAP regulation (10 oC after 24 hours)
Temp
Collected for transport
Hours
Tem
pera
ture
(°° °°C
)
Figure A3.15: Temperature profile of a Pacific Oyst er cool-chain from Coffin Bay, South Australia, to Gladstone, Queensland. Zero hours is the point of harvest completion.
The profile shown in Figure A3.15 has not adhered to the ASQAP standard (note change of Y axis). This profile represents a severe case of heat abuse and could potentially represent a health risk to consumers. The data indicates that after approximately 18 hours, oysters were stored at ambient temperatures.
0 24 48 72 960
5
10
15
20
25
ASQAP
ASQAP reg (10 oC after 24 hours)
Temp
Collected fortransport
Retrieved bycustomer
Hours
Tem
pera
ture
(°° °°C
)
Figure A3.16: Temperature profile of a Pacific Oyst er cool-chain from Coffin Bay, South Australia to Melbourne. Zero hours is the point of harvest completion.
The profile shown in Figure A3.16 has not adhered to the ASQAP standard, due to a slow cooling time. However, after 30 hours, stable temperatures were apparent until approximately 100 hours, where the temperature drops to nearly zero degrees before the logger was retrieved. This drop likely occurred in the customer’s cool room.

Project No: 2007/700
82
0 24 48 720
5
10
15
20
25TempHiroshima airport
ASQAP
ASQAP regulation
(10oC after 24 hours)Collectedfor transport
Hours
Tem
pera
ture
(°° °°C
)
Figure A3.17: Temperature profile of a Pacific Oyst er cool-chain from Coffin Bay, South Australia to Japan.
The profile shown in Figure A3.17 has not adhered to the ASQAP standard and highlights the difficulties that can be associated with shipping in non-refrigerated transport. No further information was provided for this supply-chain.
0 6 12 18 24 30 36 420
5
10
15
20
25
30
LegendNSW Food Authority
NSW Food Authority temperature regulation
Collected fortransport
Batemans Baydepot
Productdelivered
Hours
Tem
pera
ture
°° °°C
Figure A3.18: Temperature profile of a Sydney Rock Oyster cool-chain from Pambula New South Wales to, Sydney. Zero hours is the point of harvest completion.
The supply-chain temperature profile shown in Figure A3.18 has adhered to the NSW state dispensation for the storage of shellfish.

Project No: 2007/700
83
0 24 48 72 96 1200
5
10
15
20
25
ASQAPTemp
ASQAP regulation
Oysterspacked
Collected fortransport
Sydneydepot
Transfer toSydney Airportcold store
Hours
Tem
pera
ture
°° °°C
Figure A3.19: Temperature profile of a Native Oyste r cool-chain from Pambula, New South Wales to Japan. Zero hours is the point of harvest completion.
This temperature profile shown in Figure A3.19 is from a trial shipment of the Native Oyster, Ostrea angasi, which were sent to Japan. These oysters should adhere to the ASQAP standard rather than the NSW State regulations for Sydney Rock Oysters. There are some large fluctuations in temperatures during thus supply-chain and it has not adhered to the ASQAP standard. However, the temperature remained below 15°C at all times.

Project No: 2007/700
84
Appendix 4: How to use an iButton ® data logger
A3.1 Technology
The temperatures loggers used in this study were DS1921G Thermochron® iButton® temperature recorders (Maxim, California, USA) as they are relatively simple to install and use. These loggers are available through a variety of sources: via the manufacturer’s website http://www.maxim-ic.com/ or through several software and information type businesses in Australia. Thermochrons and attachments used in this project were purchased from a company in the United Kingdom called Homechip via their website: http://www.homechip.com/catalog/, as this company was the most cost effective. These temperature loggers are a computer chip enclosed within a rugged stainless steel case that measures temperature and records the result in a protected memory section at a user defined rated. These loggers are interfaced via a standard personal computer using a USB attachment (DS9490R-USB 1-Wire/iButton Adapter) and a docking port (DS1402D-DR8 Blue Dot receptor iButton reader cable). Freely available software, available at the Maxim website (http://www.maxim-ic.com/products/ibutton/software/tmex/download_drivers.cfm) is used to either generate a quick graph of the data, or data can be exported as text files and can be imported to Microsoft Excel as comma separated files. iButton® keyfobs are used to secure the loggers if required. A3.2 Logging Process
The first step in the profiling process is to contact your customer to ensure that they are willing to return the temperature loggers. The loggers are then set to record data every 20 minutes using the free software, ensure that the box to roll data over is not ticked when setting the logger mission. Record all information about the shipment to be profiled, such as the time the logger is placed in product and also expected times of any depot changes and the estimated time of arrival to the customer. This information will allow identification of where any temperature abuse that is detected has occurred. The loggers should be attached or placed within a bag or box (with wire if using a key fob or placed in a snaplock bag if not). Do not advise the transport company that there are loggers contained within the shipment, as they may not treat product in the usual manner. Contact the customer and advise of when the logger will arrive and also what bag it is in within the shipment.


