108

@LMaccherone | [email protected] @Tasktop |
Lean-Agile city.
This place runs on folklore, intuition, and anecdotes.
If you want to know the truth about this town, stick with me. I’ll give you a tour you’ll never forget.
But if you don’t want your beliefs challenged with facts, you’d better beat it, kid. I don’t want to upset you.

@LMaccherone | [email protected] @Tasktop |
My sidekick down there? That’s Larry Maccherone. He’s worked in this town his entire professional life.

@LMaccherone | [email protected] @Tasktop |
Credits
Many thanks to my friends at Rally Softwareand their customers whose non-attributable data is the source for much of this research.
Much of this material was previously published when I was Director of Analytics and Research at Rally Software, and much of that is derived from my PhD work at Carnegie Mellon, while other aspects come from collaboration with the Software Engineering Institute.

@LMaccherone | [email protected] @Tasktop |
I’m going to give you the tools to find the real-world numbers that can help you make the economic case to get the resources you need and get your people to commit to change. Really.
-

@LMaccherone | [email protected] @Tasktop |
The Seven Deadly Sins of Agile Measurement
11 ManipulatingOthers
22 UnbalancedMetrics
33 QuantitativeIdolatry
4 OverpricedMetrics
5 LazyMetrics
6 BadAnalysis
7 LinearForecasting
@LMaccherone | [email protected] @Tasktop |
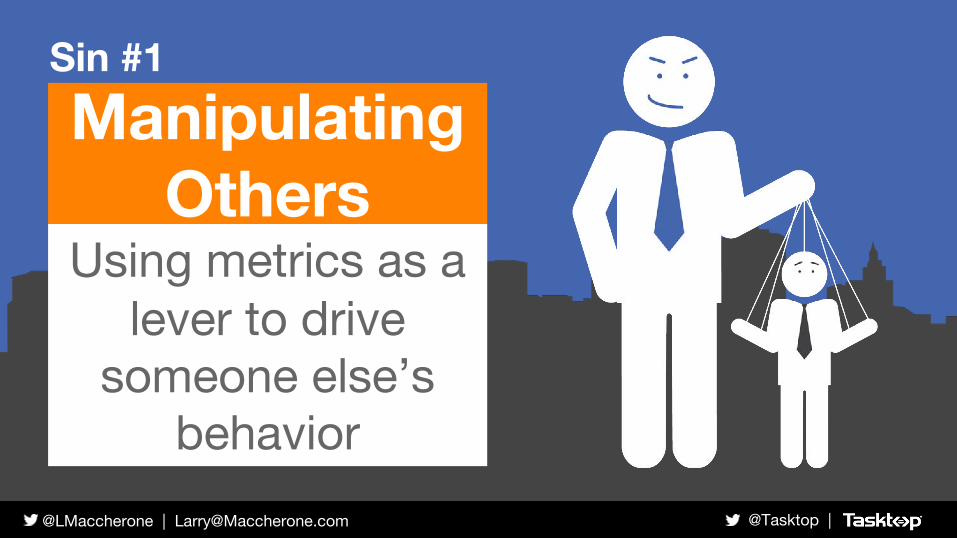
ManipulatingOthers
Sin #1
Using metrics as a lever to drive
someone else’s behavior

@LMaccherone | [email protected] @Tasktop |
Self Improvement
Heavenly Virtue #1
Using metrics to reflect on your own
performance

@LMaccherone | [email protected] @Tasktop |
LinearForecasting
Sin #7
Forecasting without discussing probability and risk
@LMaccherone | [email protected] @Tasktop |
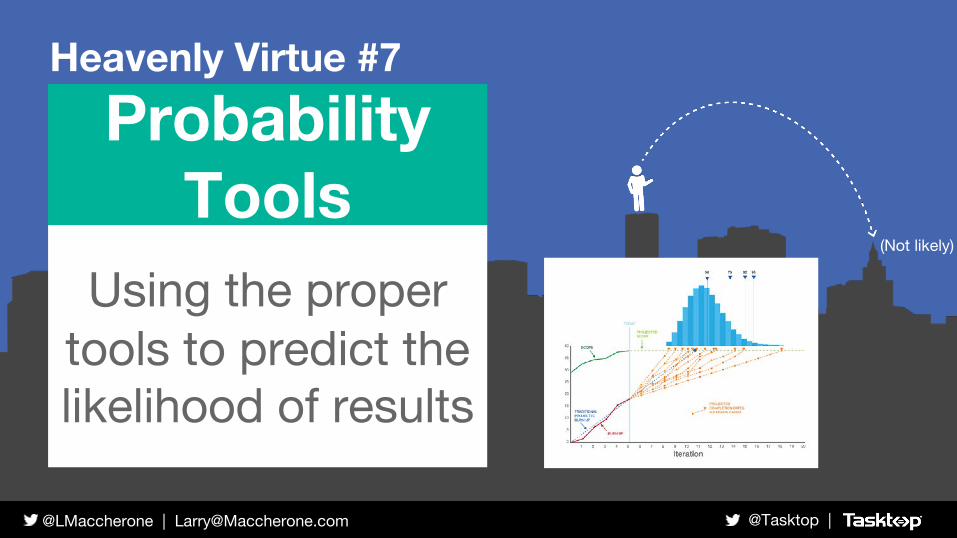
ProbabilityTools
Heavenly Virtue #7
Using the proper tools to predict the likelihood of results
(Not likely)

@LMaccherone | [email protected] @Tasktop |
CAUTION:
Only good practices in
context
There are no best practices

@LMaccherone | [email protected] @Tasktop |
Crowd wisdom or shared delusion?Iteration length Teams
using
1 week 6.2%
2 weeks 59.1%
3 weeks 23.4%
4 weeks 9.8%
5+ weeks 1.5%

@LMaccherone | [email protected] @Tasktop |
@LMaccherone | [email protected] @Tasktop |

@LMaccherone | [email protected] @Tasktop |
SDPI current dimensions
Productivity(Throughput)
Predictability(Stability of Throughput)
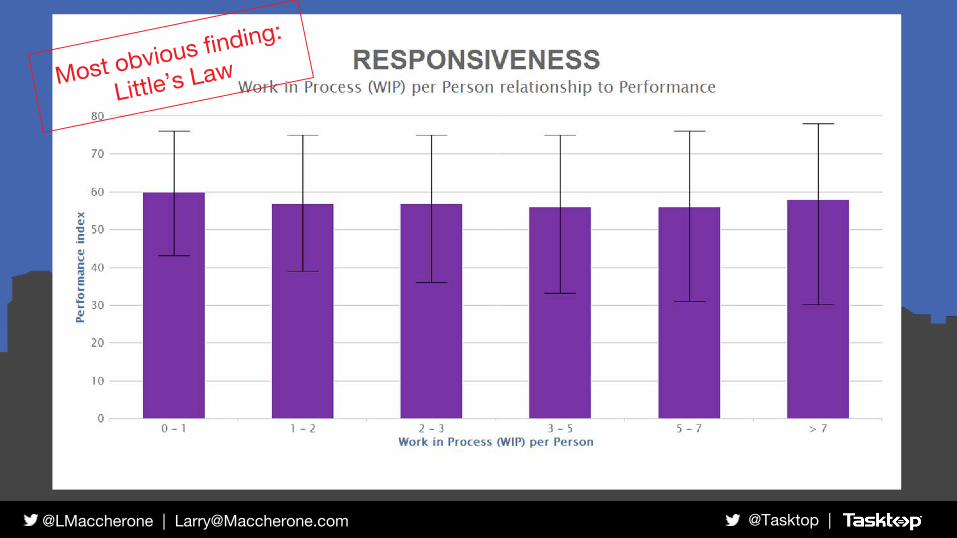
Responsiveness(Time in Process)
Quality(Defect Density)
@LMaccherone | [email protected] @Tasktop |
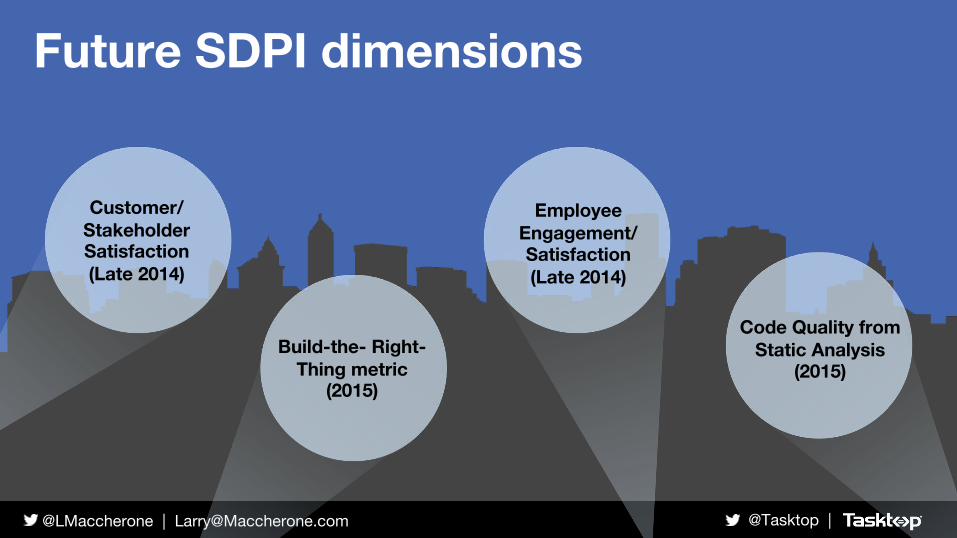
Future SDPI dimensions
Customer/ StakeholderSatisfaction(Late 2014)
Build-the- Right-Thing metric
(2015)
EmployeeEngagement/ Satisfaction(Late 2014)
Code Quality from Static Analysis
(2015)

@LMaccherone | [email protected] @Tasktop |

@LMaccherone | [email protected] @Tasktop |

@LMaccherone | [email protected] @Tasktop |

@LMaccherone | [email protected] @Tasktop |

@LMaccherone | [email protected] @Tasktop |
Facts Discovered:● Teams using two-week
iterations have the best balanced performance
● Longer iterations correlate with higher Quality
● Shorter iterations correlate with higher Productivity and Responsiveness
● However, some teams are acting like “tough guys” by pretending to operate at one-week iterations when they can’t back it up

@LMaccherone | [email protected] @Tasktop |
The investigation continues with ...
Ratio of testers to developers

@LMaccherone | [email protected] @Tasktop |

@LMaccherone | [email protected] @Tasktop |

@LMaccherone | [email protected] @Tasktop |

@LMaccherone | [email protected] @Tasktop |
Facts Discovered:● More testers lead to better
Quality● But they also generally lead
to worse Productivity and Responsiveness
● Interestingly, teams that self-identify as having no testers have:o The best Productivityo Almost as good Quality o But much wider variation
in Quality

@LMaccherone | [email protected] @Tasktop |

@LMaccherone | [email protected] @Tasktop |

@LMaccherone | [email protected] @Tasktop |
@LMaccherone | [email protected] @Tasktop |

@LMaccherone | [email protected] @Tasktop |

@LMaccherone | [email protected] @Tasktop |

@LMaccherone | [email protected] @Tasktop |
Evidence Found:● Motive has a small but statistically
significant impact on performance● Extrinsic motivation does not
have a negative impact on performance
● Executive support is critical for success with Agile
● Teamwork is not the dominant factor; talent, skills, and experience are
● Those motivated by quality perform best

@LMaccherone | [email protected] @Tasktop |

@LMaccherone | [email protected] @Tasktop |
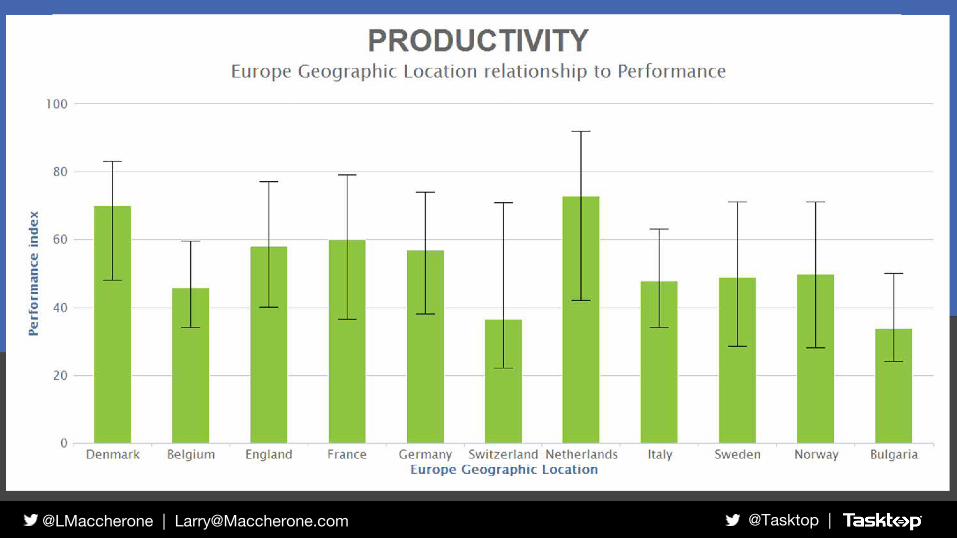
Evidence Found:● Teams distributed within the
same time zone have up to 25% better productivity.
● Is distraction a problem?

@LMaccherone | [email protected] @Tasktop |
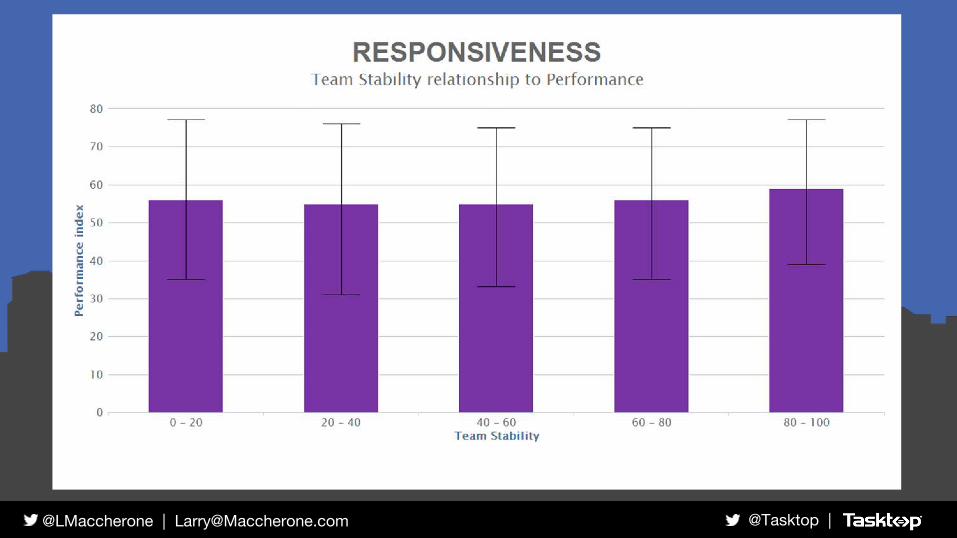
Stable teams result in up to:● 60% better Productivity● 40% better Predictability
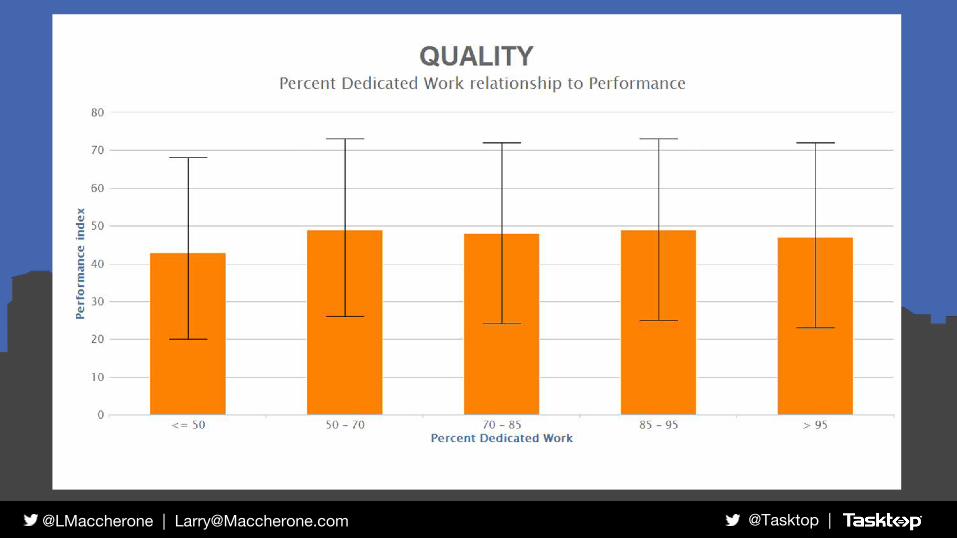
Dedicated teams: Teams made up of people who only work on that one team have double the Productivity
Smaller teams have better ProductivityLarger teams have better Quality
Teams with low WiP have up to:● 4x better Quality● 2x faster Time to market● But 34% worse productivity

§ Tasktop Data– Provides a single aggregated stream of Data from connected tools:
• ALM, Build, SCM, Support, Sales, etc.
– Operates in real time– Maintains complete history– Normalizes data models. Resolves users and projects– Supports analytics and reporting tools– Does not directly provide visualization or analysis
§ Get insights like the ones in this talk for your teams
Contact me to discuss analysis of your data, or getting help establishing your metrics regimen.
Start with a 1-day workshop.

@LMaccherone | [email protected] @Tasktop |
A fact without a theoryis like a ship without a sail,is like a boat without a rudder,is like a kite without a tail.
A fact without a figureis a tragic final act.
But one thing worsein this universeis a theory without a fact.
~ George Schultz

@LMaccherone | [email protected] @Tasktop |
Productivity = ThroughputThroughput is simply the count of User Stories completed in a given time period.
Productivity (by default) is the percentile scoring of the raw Throughput metric for User Stories normalized by team size.
©2014 Larry Maccherone

@LMaccherone | [email protected] @Tasktop |
Predictability = Stability of ThroughputPredictability measures how consistent you are at producing the same amount of work each month as measured by the Coefficient of Variation (CoV) of Throughput.
Predictability (by default) is the percentile scoring of the raw CoV of Throughput.
©2014 Larry Maccherone

@LMaccherone | [email protected] @Tasktop |
Responsiveness = Time in ProcessTiP shows how long it takes to get one work item through your system. It's the work days that a User Story spends in development and testing. Similar to lead time or cycle time.
Responsiveness (by default) is the percentile scoring of the raw Time In Process (TiP) metric for User Stories.
©2014 Larry Maccherone

@LMaccherone | [email protected] @Tasktop |
Quality = Defect DensityDefect Density is a representation of the number of defects found in your code. It's the count of defects found in a given time period, normalized by team size.
Quality (by default) is the percentile scoring of the raw defect density metrics for both defects found in test as well as those found in production.
©2014 Larry Maccherone

@LMaccherone | [email protected] @Tasktop |

@LMaccherone | [email protected] @Tasktop |

@LMaccherone | [email protected] @Tasktop |

@LMaccherone | [email protected] @Tasktop |

@LMaccherone | [email protected] @Tasktop |

@LMaccherone | [email protected] @Tasktop |
Facts Discovered:Teams that most aggressively control WiP:● Have ½ the Time in Process
(TiP)● Have ¼ as many defects● But have 34% lower
productivity

@LMaccherone | [email protected] @Tasktop |
Recommendations:● If your WiP is high, reduce it● If your WiP is already low,
consider your economic drivers○ If Productivity drives
your bottom line, don’t push WiP too low
○ If time to market or quality drives your bottom line, push WiP as low as it will go

@LMaccherone | [email protected] @Tasktop |
Estimating process
Process Type Teams UsingNo Estimates 3%
Full Scrum 79%Lightweight Scrum 10%
Hourly-Oriented 8%

@LMaccherone | [email protected] @Tasktop |

@LMaccherone | [email protected] @Tasktop |

@LMaccherone | [email protected] @Tasktop |

@LMaccherone | [email protected] @Tasktop |

@LMaccherone | [email protected] @Tasktop |

@LMaccherone | [email protected] @Tasktop |

@LMaccherone | [email protected] @Tasktop |
Facts Discovered:● Teams doing Full Scrum
have 250% better Quality than teams doing no estimating
● Lightweight Scrum performs better overall, with better Productivity, Predictability, and Responsiveness

@LMaccherone | [email protected] @Tasktop |
Recommendations:● Experienced teams may get
best results from Lightweight Scrum
● If new to Agile or focused strongly on Quality, choose Full Scrum

@LMaccherone | [email protected] @Tasktop |
The investigation continues with ...
Team stability &Dedication to one team

@LMaccherone | [email protected] @Tasktop |

@LMaccherone | [email protected] @Tasktop |

@LMaccherone | [email protected] @Tasktop |

@LMaccherone | [email protected] @Tasktop |
@LMaccherone | [email protected] @Tasktop |
@LMaccherone | [email protected] @Tasktop |

@LMaccherone | [email protected] @Tasktop |

@LMaccherone | [email protected] @Tasktop |

@LMaccherone | [email protected] @Tasktop |
Another Fact Discovered:One out of four team members changes every three months!

@LMaccherone | [email protected] @Tasktop |

@LMaccherone | [email protected] @Tasktop |

@LMaccherone | [email protected] @Tasktop |
@LMaccherone | [email protected] @Tasktop |

@LMaccherone | [email protected] @Tasktop |

@LMaccherone | [email protected] @Tasktop |
Facts Discovered:Stable teams result in up to:● 60% better Productivity● 40% better Predictability
Another Fact Discovered:One out of four team members changes every three months!

@LMaccherone | [email protected] @Tasktop |
Recommendations:● Dedicate people to a single
team● Keep teams intact and stable

@LMaccherone | [email protected] @Tasktop |
Agile recommends that the ideal team size is 7± 2. How ideal is that when we actually look at the data? Balance your team’s Performance

@LMaccherone | [email protected] @Tasktop |

@LMaccherone | [email protected] @Tasktop |

@LMaccherone | [email protected] @Tasktop |

@LMaccherone | [email protected] @Tasktop |

@LMaccherone | [email protected] @Tasktop |

@LMaccherone | [email protected] @Tasktop |
Facts Discovered:Small teams (of 1-3) people have:● 17% lower Quality● But 17% more Productivity
than teams of the recommended size.

@LMaccherone | [email protected] @Tasktop |
Recommendations:● Set up team size of 7±2
people for the most balanced performance
● If you are doing well with larger teams, there’s no evidence that you need to change

@LMaccherone | [email protected] @Tasktop |

@LMaccherone | [email protected] @Tasktop |
Israel-based teams● Find more defects overall● But find fewer in production● Theory: May correlate with
high use of static analysis tools
India-based teams● Find more defects overall● Released and unreleased● Theory: May correlate with
high use of static analysis tools
● Theory: Could be recording bias

@LMaccherone | [email protected] @Tasktop |
Facts Discovered:● Differences are slight but
statistically significant.● Australia has the best overall
performance.● India the worst. However,
there could be a reporting bias for defects.
● Israel seems to catch the most defects before production. Heavy use of static analysis?

@LMaccherone | [email protected] @Tasktop |
The investigation continues with ...
Geography: US and Europe

@LMaccherone | [email protected] @Tasktop |
@LMaccherone | [email protected] @Tasktop |