Protein Science (1997), 6:347-354. Cambridge University Press. Printed in the USA. Copyright 0 1997 The Protein Society A desolvation barrier to hydrophobic cluster formation may contribute to the rate-limiting step in protein folding JEFFREY A. RANK’ AND DAVID BAKER2 ‘Department of Physics, University of Washington, Seattle, Washington 98195 ’Department of Biochemistry, University of Washington, Seattle, Washington 98195 (RECEIVED July16, 1996; ACCEFTED November 5, 1996) Abstract To gain insight into the free energy changes accompanying protein hydrophobic core formation, we have used computer simulations to study the formation of small clusters of nonpolar solutes in water. A barrier to association is observed at the largest solute separation that does not allow substantial solvent penetration. The barrier reflects an effective increase in the size of the cavity occupied by the expanded but water-excluding cluster relative to both the close-packed cluster and the fully solvated separated solutes; a similar effect may contribute to the barrier to protein foldinghnfolding. Importantly for the simulation of protein folding without explicit solvent, we find that the interactions between nonpolar solutes of varying size and number can be approximated by a linear function of the molecular surface, but not the solvent-accessible surface of the solutes. Comparison of the free energy of cluster formation to that of dimer formation suggests that the assumption of pair additivity implicit in current protein database derived potentials may be in error. Keywords: hydrophobic interaction; potential of mean force; protein folding The hydrophobic interaction is extremely important in the folding and stabilization of proteins (Kauzmann, 1959; Dill, 1990), but is relatively poorly understood. In spite of this poor understanding, computer modeling of protein folding has developed substantially over the past IO years. One approach is to simulate protein folding in the presence of explicitly modeled water molecules, which, depending upon the accuracy of the water model, should at least in part reproduce the hydrophobic interaction. Molecular dynamics simulations with an explicit solvent model have provided valuable insights into possible foldinghnfolding trajectories (Daggett & Levitt, 1994; Karplus & Sali, 1995). However, because of the complexity of the processes being simulated and the absence of an obvious reaction coordinate, most studies have focused on quali- tative features of the trajectories and not sought to calculate free energy changes (the study of Brooks and Boczko [I9951 is an exception). A second approach avoids the complexity and high computational demands of simulations with hundreds of explicit water molecules by deriving effective potentials from the distri- bution of amino acid residues in known protein structures (re- viewed in Jones & Thornton, 1996). Although not modeled explicitly, the hydrophobic interaction dominates such “knowledge-based’ potentials. These relationships are not true interaction potentials in a rigorous sense, but they have been extremely useful in a wide variety of applications, including protein fold recognition (Jones & Reprint requests to: David Baker, Department of Biochemistry Univer- sity of Washington, Seattle, Washington 98195; e-mail: dabaker@ u.washington.edu. Thornton, 1996). Pair additivity is usually assumed in calculating the total energy or score: the energy is the sum of the solvation and interaction energies of individual and pairs of residues (Sippl, 1995). In this paper, we separate hydrophobic core formation from the multitude of other complex interactions involved in protein folding by investigating a considerably simplified problem: the association of methane molecules in water. We employ the widely used TIP4P model of water (Jorgenson et al., 1983), and standard free energy perturbation methods (Beveridge & DiCapua, 1989) to cakulate the free energy of interaction of pairs, triplets, and larger numbers of methane molecules as a function of separation distance. These studies help bridge the rather large gap between computer studies of nonpolar solvation (Pratt & Pohorille, 1992) and pair inter- actions of nonpolar solutes (Jorgenson et al., 1988) and studies of protein folding (Daggett & Levitt, 1994; Brooks & Boczko, 1995; Karplus & Sali, 1995). The simplicity of the problem relative to protein folding allows the calculation of free energies, and perhaps more importantly, facilitates the understanding of the physical prin- ciples underlying the interactions. The results have implications for both the modeling of hydrophobic interactions and the under- standing of the rate-limiting step in protein folding. Results and discussion Standard free energy perturbation methods were used to calculate the free energy of association or potential of mean force (PMF) for spherical nonpolar solutes of different sizes and numbers in TIP4P water. The four reactions studied are described schematically in Figure 1. These include the dimerization of two methane mol- 341
Transcript
Protein Science (1997), 6:347-354. Cambridge University Press. Printed in the USA. Copyright 0 1997 The Protein Society
A desolvation barrier to hydrophobic cluster formation may contribute to the rate-limiting step in protein folding
JEFFREY A. RANK’ AND DAVID BAKER2 ‘Department of Physics, University of Washington, Seattle, Washington 98195 ’Department of Biochemistry, University of Washington, Seattle, Washington 98195
(RECEIVED July 16, 1996; ACCEFTED November 5 , 1996)
Abstract
To gain insight into the free energy changes accompanying protein hydrophobic core formation, we have used computer simulations to study the formation of small clusters of nonpolar solutes in water. A barrier to association is observed at the largest solute separation that does not allow substantial solvent penetration. The barrier reflects an effective increase in the size of the cavity occupied by the expanded but water-excluding cluster relative to both the close-packed cluster and the fully solvated separated solutes; a similar effect may contribute to the barrier to protein foldinghnfolding. Importantly for the simulation of protein folding without explicit solvent, we find that the interactions between nonpolar solutes of varying size and number can be approximated by a linear function of the molecular surface, but not the solvent-accessible surface of the solutes. Comparison of the free energy of cluster formation to that of dimer formation suggests that the assumption of pair additivity implicit in current protein database derived potentials may be in error.
Keywords: hydrophobic interaction; potential of mean force; protein folding
The hydrophobic interaction is extremely important in the folding and stabilization of proteins (Kauzmann, 1959; Dill, 1990), but is relatively poorly understood. In spite of this poor understanding, computer modeling of protein folding has developed substantially over the past IO years. One approach is to simulate protein folding in the presence of explicitly modeled water molecules, which, depending upon the accuracy of the water model, should at least in part reproduce the hydrophobic interaction. Molecular dynamics simulations with an explicit solvent model have provided valuable insights into possible foldinghnfolding trajectories (Daggett & Levitt, 1994; Karplus & Sali, 1995). However, because of the complexity of the processes being simulated and the absence of an obvious reaction coordinate, most studies have focused on quali- tative features of the trajectories and not sought to calculate free energy changes (the study of Brooks and Boczko [I9951 is an exception). A second approach avoids the complexity and high computational demands of simulations with hundreds of explicit water molecules by deriving effective potentials from the distri- bution of amino acid residues in known protein structures (re- viewed in Jones & Thornton, 1996). Although not modeled explicitly, the hydrophobic interaction dominates such “knowledge-based’ potentials. These relationships are not true interaction potentials in a rigorous sense, but they have been extremely useful in a wide variety of applications, including protein fold recognition (Jones &
Reprint requests to: David Baker, Department of Biochemistry Univer- sity of Washington, Seattle, Washington 98195; e-mail: dabaker@ u.washington.edu.
Thornton, 1996). Pair additivity is usually assumed in calculating the total energy or score: the energy is the sum of the solvation and interaction energies of individual and pairs of residues (Sippl, 1995).
In this paper, we separate hydrophobic core formation from the multitude of other complex interactions involved in protein folding by investigating a considerably simplified problem: the association of methane molecules in water. We employ the widely used TIP4P model of water (Jorgenson et al., 1983), and standard free energy perturbation methods (Beveridge & DiCapua, 1989) to cakulate the free energy of interaction of pairs, triplets, and larger numbers of methane molecules as a function of separation distance. These studies help bridge the rather large gap between computer studies of nonpolar solvation (Pratt & Pohorille, 1992) and pair inter- actions of nonpolar solutes (Jorgenson et al., 1988) and studies of protein folding (Daggett & Levitt, 1994; Brooks & Boczko, 1995; Karplus & Sali, 1995). The simplicity of the problem relative to protein folding allows the calculation of free energies, and perhaps more importantly, facilitates the understanding of the physical prin- ciples underlying the interactions. The results have implications for both the modeling of hydrophobic interactions and the under- standing of the rate-limiting step in protein folding.
Results and discussion Standard free energy perturbation methods were used to calculate the free energy of association or potential of mean force (PMF) for spherical nonpolar solutes of different sizes and numbers in TIP4P water. The four reactions studied are described schematically in Figure 1 . These include the dimerization of two methane mol-
341
348
D
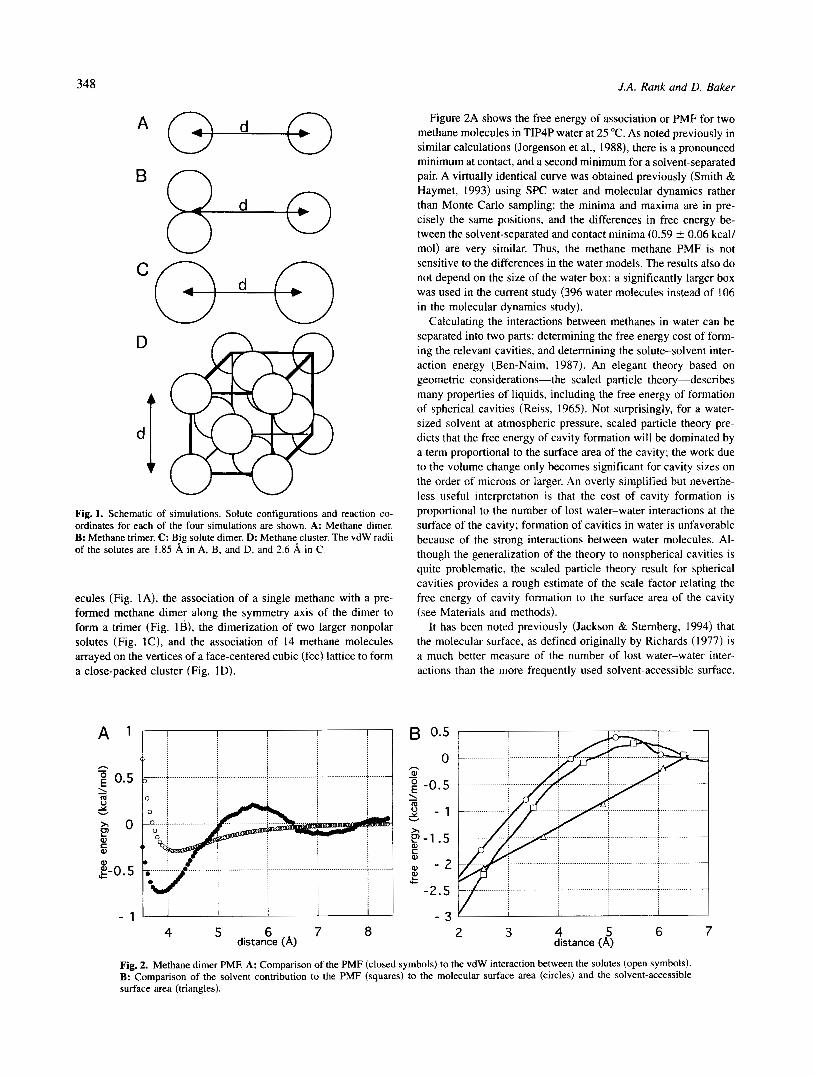
.; Fig. 1. Schematic of simulations. Solute configurations and reaction co- ordinates for each of the four simulations are shown. A: Methane dimer. B: Methane trimer. C: Big solute dimer. D: Methane cluster. The vdW radii of the solutes are 1.85 8, in A, B, and D, and 2.6 8, in C.
ecules (Fig. IA), the association of a single methane with a pre- formed methane dimer along the symmetry axis of the dimer to form a trimer (Fig. I B ) , the dimerization of two larger nonpolar solutes (Fig. lC), and the association of 14 methane molecules arrayed on the vertices of a face-centered cubic (fcc) lattice to form a close-packed cluster (Fig. 1 D).
2 0.5 5 x 0
1 m u
F
t"-0.5
C W
W
4 5 6 7 8 distance (A)
J.A. Rank and D. Baker
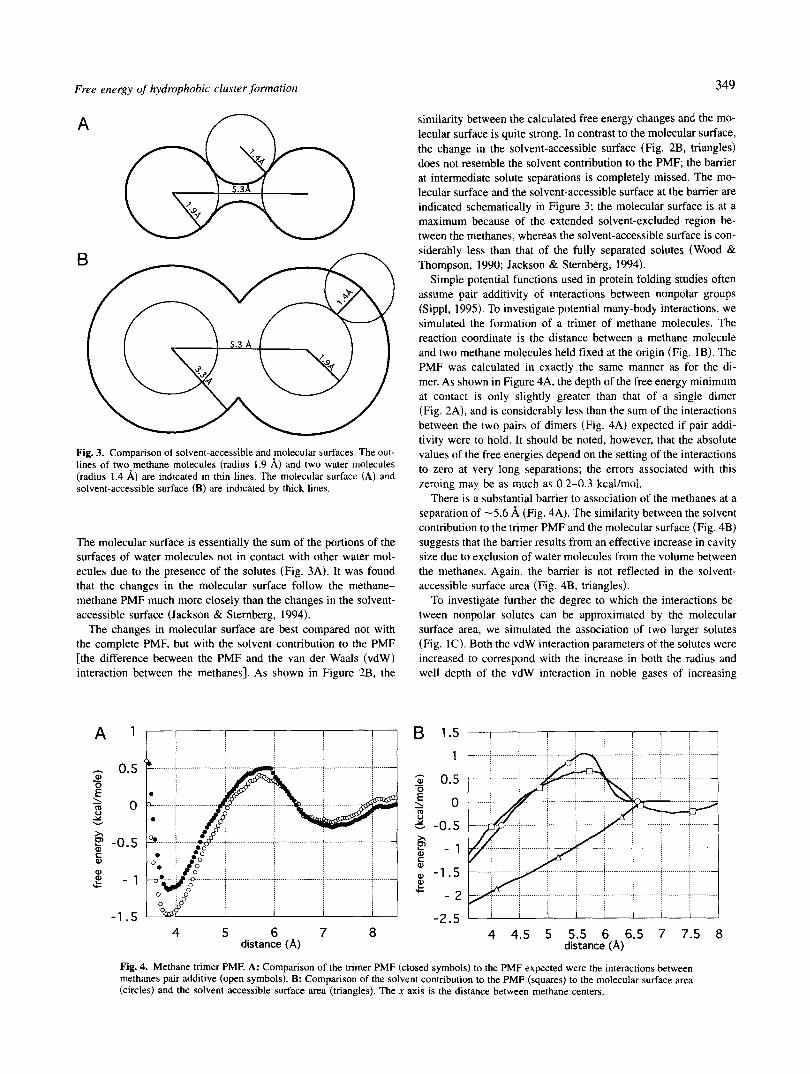
Figure 2A shows the free energy of association or PMF for two methane molecules in TIP4P water at 25 "C. As noted previously in similar calculations (Jorgenson et al., 1988), there is a pronounced minimum at contact, and a second minimum for a solvent-separated pair. A virtually identical curve was obtained previously (Smith & Haymet, 1993) using SPC water and molecular dynamics rather than Monte Carlo sampling: the minima and maxima are in pre- cisely the same positions, and the differences in free energy be- tween the solvent-separated and contact minima (0.59 t 0.06 kcal/ mol) are very similar. Thus, the methane methane PMF is not sensitive to the differences in the water models. The results also do not depend on the size of the water box: a significantly larger box was used in the current study (396 water molecules instead of 106 in the molecular dynamics study).
Calculating the interactions between methanes in water can be separated into two parts: determining the free energy cost of form- ing the relevant cavities, and determining the solute-solvent inter- action energy (Ben-Naim, 1987). An elegant theory based on geometric considerations-the scaled particle theory-describes many properties of liquids, including the free energy of formation of spherical cavities (Reiss, 1965). Not surprisingly, for a water- sized solvent at atmospheric pressure, scaled particle theory pre- dicts that the free energy of cavity formation will be dominated by a term proportional to the surface area of the cavity; the work due to the volume change only becomes significant for cavity sizes on the order of microns or larger. An overly simplified but neverthe- less useful interpretation is that the cost of cavity formation is proportional to the number of lost water-water interactions at the surface of the cavity; formation of cavities in water is unfavorable because of the strong interactions between water molecules. Al- though the generalization of the theory to nonspherical cavities is quite problematic, the scaled particle theory result for spherical cavities provides a rough estimate of the scale factor relating the free energy of cavity formation to the surface area of the cavity (see Materials and methods).
It has been noted previously (Jackson & Sternberg, 1994) that the molecular surface, as defined originally by Richards (1977) is a much better measure of the number of lost water-water inter- actions than the more frequently used solvent-accessible surface.
B 0.5
0
-0.5 h
W - 1 m g - 1 x a, c 0,
F -1.5
W - 2
-2.5
- 3
? Y-
... ! ........... ..................
w : 2 3 4 5 6 7
distance (A)
Fig. 2. Methane dimer PMF. A: Comparison of the PMF (closed symbols) to the vdW interaction between the solutes (open symbols). B: Comparison of the solvent contribution to the PMF (squares) to the molecular surface area (circles) and the solvent-accessible surface area (triangles).
Free energy of hydrophobic cluster formation
A
B n
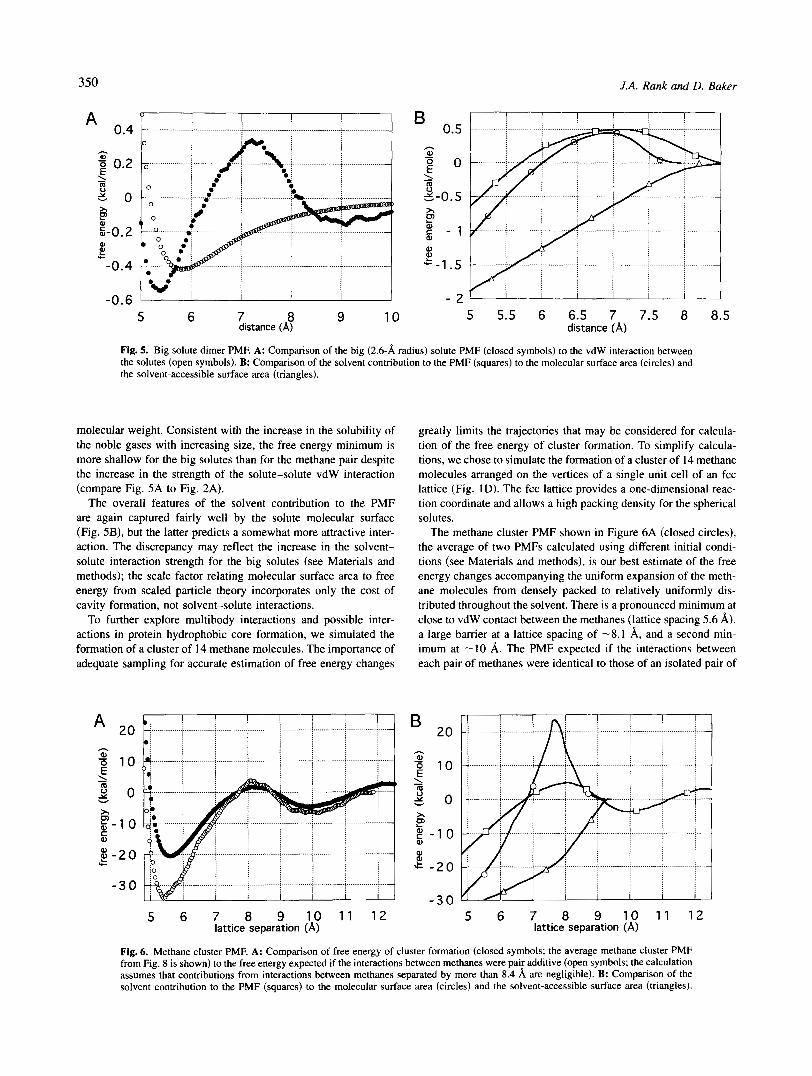
Fig. 3. Comparison of solvent-accessible and molecular surfaces. The out- lines of two methane molecules (radius 1.9 A) and two water molecules (radius 1.4 A) are indicated in thin lines. The molecular surface (A) and solvent-accessible surface (B) are indicated by thick lines.
The molecular surface is essentially the sum of the portions of the surfaces of water molecules not in contact with other water mol- ecules due to the presence of the solutes (Fig. 3A). It was found that the changes in the molecular surface follow the methane- methane PMF much more closely than the changes in the solvent- accessible surface (Jackson & Sternberg, 1994).
The changes in molecular surface are best compared not with the complete PMF, but with the solvent contribution to the PMF [the difference between the PMF and the van der Waals (vdW) interaction between the methanes]. As shown in Figure 2B, the
0.5 W - E 2 0 u 5
g -0.5
2 - 1
x
C
W W
LC
-1.5 4 5 6 7 a
distance (A)
349
similarity between the calculated free energy changes and the mo- lecular surface is quite strong. In contrast to the molecular surface, the change in the solvent-accessible surface (Fig. 2B, triangles) does not resemble the solvent contribution to the PMF; the barrier at intermediate solute separations is completely missed. The mo- lecular surface and the solvent-accessible surface at the barrier are indicated schematically in Figure 3; the molecular surface is at a maximum because of the extended solvent-excluded region be- tween the methanes, whereas the solvent-accessible surface is con- siderably less than that of the fully separated solutes (Wood & Thompson, 1990; Jackson & Sternberg, 1994).
Simple potential functions used in protein folding studies often assume pair additivity of interactions between nonpolar groups (Sippl, 1995). To investigate potential many-body interactions, we simulated the formation of a trimer of methane molecules. The reaction coordinate is the distance between a methane molecule and two methane molecules held fixed at the origin (Fig. 1 B). The PMF was calculated in exactly the same manner as for the di- mer. As shown in Figure 4A, the depth of the free energy minimum at contact is only slightly greater than that of a single dimer (Fig. 2A), and is considerably less than the sum of the interactions between the two pairs of dimers (Fig. 4A) expected if pair addi- tivity were to hold. It should be noted, however, that the absolute values of the free energies depend on the setting of the interactions to zero at very long separations; the errors associated with this zeroing may be as much as 0.2-0.3 kcallmol.
There is a substantial barrier to association of the methanes at a separation of -5.6 8, (Fig. 4A). The similarity between the solvent contribution to the trimer PMF and the molecular surface (Fig. 4B) suggests that the barrier results from an effective increase in cavity size due to exclusion of water molecules from the volume between the methanes. Again, the barrier is not reflected in the solvent- accessible surface area (Fig. 4B, triangles).
To investigate further the degree to which the interactions be- tween nonpolar solutes can be approximated by the molecular surface area, we simulated the association of two larger solutes (Fig. 1C). Both the vdW interaction parameters of the solutes were increased to correspond with the increase in both the radius and well depth of the vdW interaction in noble gases of increasing
B 1.5
1
C - 0.5
1 0 5 -0.5
E" m u
x g - 1 C W a -1.5
- 2
-2.5
w- 2
Fig. 4. Methane trimer PMF. A: Comparison of the trimer PMF (closed symbols) to the PMF expected were the interactions between methanes pair additive (open symbols). B: Comparison of the solvent contribution to the PMF (squares) to the molecular surface area (circles) and the solvent-accessible surface area (triangles). The x axis is the distance between methane centers.
350 J.A. Rank and D. Baker
h
0.2
5 0 1 0
>r
m m
s-0.2 m Y- e -0.4
I I I ! .................................................................................................... " .....................
-0.6 5 6 7 8 9 10
distance (A)
B 0.5
x a, W
F c - 1 W 2 "1.5
- 2 5 5.5 6 6.5 7 7.5 8 8.5
distance (A)
Fig. 5. Big solute dimer PMF. A: Comparison of the big (2.6-A radius) solute PMF (closed symbols) to the vdW interaction between the solutes (open symbols). B: Comparison of the solvent contribution to the PMF (squares) to the molecular surface area (circles) and the solvent-accessible surface area (triangles).
molecular weight. Consistent with the increase in the solubility of the noble gases with increasing size, the free energy minimum is more shallow for the big solutes than for the methane pair despite the increase in the strength of the solute-solute vdW interaction (compare Fig. 5A to Fig. 2A).
The overall features of the solvent contribution to the PMF are again captured fairly well by the solute molecular surface (Fig. 5B), but the latter predicts a somewhat more attractive inter- action. The discrepancy may reflect the increase in the solvent- solute interaction strength for the big solutes (see Materials and methods); the scale factor relating molecular surface area to free energy from scaled particle theory incorporates only the cost of cavity formation, not solvent-solute interactions.
To further explore multibody interactions and possible inter- actions in protein hydrophobic core formation, we simulated the formation of a cluster of 14 methane molecules. The importance of adequate sampling for accurate estimation of free energy changes
A I I I I ! 20 I ................ j ................................. i ................ i ................................. i ................ i ....
! [ !
$1 0 K W
Y- E - 2 0
-30
greatly limits the trajectories that may be considered for calcula- tion of the free energy of cluster formation. To simplify calcula- tions, we chose to simulate the formation of a cluster of 14 methane molecules arranged on the vertices of a single unit cell of an fcc lattice (Fig. ID). The fcc lattice provides a one-dimensional reac- tion coordinate and allows a high packing density for the spherical solutes.
The methane cluster PMF shown in Figure 6A (closed circles), the average of two PMFs calculated using different initial condi- tions (see Materials and methods), is our best estimate of the free energy changes accompanying the uniform expansion of the meth- ane molecules from densely packed to relatively uniformly dis- tributed throughout the solvent. There is a pronounced minimum at close to vdW contact between the methanes (lattice spacing 5.6 A), a large barrier at a lattice spacing of -8.1 A, and a second min- imum at -10 A. The PMF expected if the interactions between each pair of methanes were identical to those of an isolated pair of
B 20
-30 5 6 7 8 9 1 0 1 1 1 2 5 6 7 8 9 1 0 1 1 1 2
lattice separation (A) lattice separation (A)
Fig. 6. Methane cluster PMF. A: Comparison of free energy of cluster formation (closed symbols; the average methane cluster PMF from Fig. 8 is shown) to the free energy expected if the interactions between methanes were pair additive (open symbols; the calculation assumes that contributions from interactions between methanes separated by more than 8.4 8, are negligible). B: Comparison of the solvent contribution to the PMF (squares) to the molecular surface area (circles) and the solvent-accessible surface area (triangles).
Free energy of hydrophobic cluster.fonnotion
methanes (Fig. 2A) is shown in Figure 6A (open circles). Despite the uncertainties resulting from the incomplete convergence of the methane cluster PMF calculations (see Materials and methods), there appears to be significant departure from pair additivity (com- pare Fig. 6A. open circles to the curves in Fig. 8). Interestingly. methane aggregation was found to occur spontaneously in a mo- lecular dynamics study of a system composed of I8 methanes and 107 water molecules (Wallqvist, 1991), but because free energy changes were not calculated in the earlier study, it is difficult to make detailed comparisons.
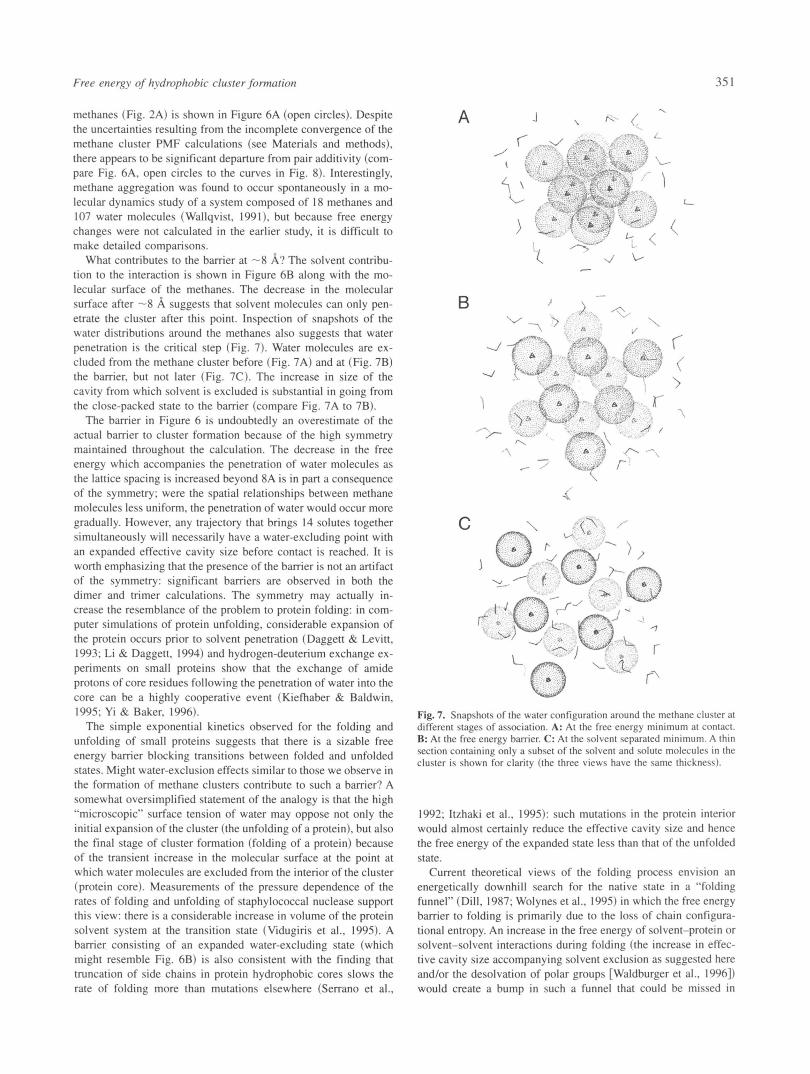
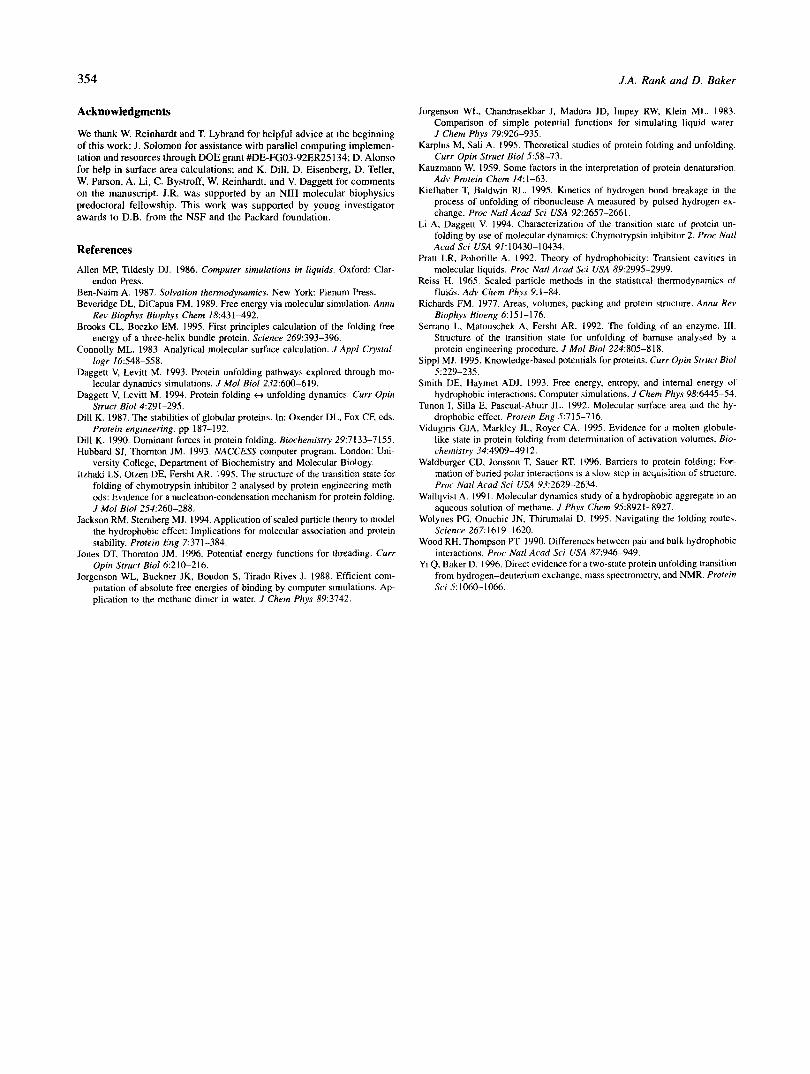
What contributes to the barrier at -8 A? The solvent contribu- tion to the interaction is shown in Figure 6B along with the mo- lecular surface of the methanes. The decrease in the molecular surface after -8 A suggests that solvent molecules can only pen- etrate the cluster after this point. Inspection of snapshots of the water distributions around the methanes also suggests that water penetration is the critical step (Fig. 7). Water molecules are ex- cluded from the methane cluster before (Fig. 7A) and at (Fig. 7B) the barrier, but not later (Fig. 7C). The increase in size of the cavity from which solvent is excluded is substantial in going from the close-packed state to the barrier (compare Fig. 7A to 7B).
The barrier in Figure 6 is undoubtedly an overestimate of the actual barrier to cluster formation because of the high symmetry maintained throughout the calculation. The decrease in the free energy which accompanies the penetration of water molecules as the lattice spacing is increased beyond 8A is in part a consequence of the symmetry; were the spatial relationships between methane molecules less uniform, the penetration of water would occur more gradually. However, any trajectory that brings 14 solutes together simultaneously will necessarily have a water-excluding point with an expanded effective cavity size before contact is reached. I t is worth emphasizing that the presence of the barrier is not an artifact of the symmetry: significant barriers are observed in both the dimer and trimer calculations. The symmetry may actually in- crease the resemblance of the problem to protein folding: in com- puter simulations of protein unfolding, considerable expansion of the protein occurs prior to solvent penetration (Daggett & Levitt, 1993; Li & Daggett. 1994) and hydrogen-deuterium exchange ex- periments on small proteins show that the exchange of amide protons of core residues following the penetration of water into the core can be a highly cooperative event (Kiefhaber & Baldwin. 1995: Yi & Baker, 1996).
The simple exponential kinetics observed for the folding and unfolding of small proteins suggests that there is a sizable free energy barrier blocking transitions between folded and unfolded states. Might water-exclusion effects similar to those we observe in the formation of methane clusters contribute to such a barrier? A somewhat oversimplified statement of the analogy is that the high "microscopic" surface tension of water may oppose not only the initial expansion of the cluster (the unfolding of a protein). but also the final stage of cluster formation (folding of a protein) because of the transient increase in the molecular surface at the point at which water molecules are excluded from the interior of the cluster (protein core). Measurements of the pressure dependence of the rates of folding and unfolding of staphylococcal nuclease support this view: there is a considerable increase in volume of the protein solvent system at the transition state (Vidugiris et al., 1995). A barrier consisting of an expanded water-excluding state (which might resemble Fig. 6B) is also consistent with the finding that truncation of side chains in protein hydrophobic cores slows the rate of folding more than mutations elsewhere (Serrano et al.,
A
B
C
I
r
3s I
Fig. 7. Snapshots of the water configuration around the methane cluster at different stages of association. A: At the free energy minimum at contact. R: At the free energy barrier. C: At the solvent separated minimum. A thin section containing only a subset of the solvent and solute molccules in the cluster is shown for clarity (the three views have the same thickness).
1992; ltzhaki et al., 1995): such mutations in the protein interior would almost certainly reduce the effective cavity size and hence the free energy of the expanded state less than that of the unfolded state.
Current theoretical views of the folding process envision an energetically downhill search for the native state in a "folding funnel'' (Dill, 1987: Wolynes et al., 1995) in which the free energy barrier to folding is primarily due to the loss of chain configura- tional entropy. An increase in the free energy of solvent-protein or solvent-solvent interactions during folding (the increase in effec- tive cavity size accompanying solvent exclusion as suggested here and/or the desolvation of polar groups [Waldburger et al.. 19961) would create a bump in such a funnel that could be missed in
352 J.A. Rank and D. Baker
simple models of folding that neglect the solvent. It seems possible that desolvation and loss of chain configurational entropy both could contribute to the free energy banier to folding; for example, both effects would disfavor the approach of core hydrophobic side chains prior to the formation of substantial favorable interactions.
The agreement between the free energy changes calculated using the explicit water simulation and the much simpler molec- ular surface calculation is quite encouraging for the computational modeling of protein folding because it appears that, at least for hydrophobic interactions, an explicit solvent model is not required for approximating free energy changes. However, the comparisons shown in Figures 4A and 6A suggest that the pair additivity as- sumed in the modeling of hydrophobic interactions using current database-derived potentials could be in error. Induced polarization effects neglected in the TIP4P model could lead to further devia- tions from pair additivity. Our results further dramatize the con- clusion (Tunon et al., 1992; Jackson & Sternberg, 1994) that the molecular surface area, not the solvent-accessible surface area, should be used in approximating hydrophobic interactions.
Materials and methods
Monte Carlo simulations The TIP4P model (Jorgenson et al., 1983) was used for water, and a united atom approximation for the solute molecules. The solute- solute and solute-solvent interactions were modeled by a Leonard Jones potential:
U,(r) = 4 ~ ( [ u / r ] ” - [u/rI6) (1)
with parameters urn-,, = 3.71 8,, E,,.,,, = 0.294 kcal/mol (Jorgen- son et al., 1988) for the methane molecules (Figs. 2,4, and 6), and
(Fig. 5). The parameters used for solute-solvent interactions were determined using the Lorentz-Berthelot mixing rules (Allen & Tildesly, 1986). All solvent interactions were quadratically damped to zero between 8.0 and 8.5 8, . Monte Carlo calculations were performed using a 20 X 20 X 30 8, box containing 396 water molecules for the calculations described in Figures 2, 3, and 4. A 25 X 25 X 25 8, box containing 5 15 water molecules was used for the methane cluster calculation (Fig. 6). All calculations used an NFT ensemble at 25 “C and 1 atm with periodic boundary conditions.
PMFs between solute molecules were computed using the per- turbation method (Beveridge & DiCapua, 1989):
C7b.b = 5.18 8, and Eb.b = 0.42 kcallmol for the “big” SOlUteS
AC(d) = -kTln(exp{-AEi (d)/kT})b (2)
where AC is the change in free energy and A & the change in energy of state i, for a change in the solute separation d. ( ) b
denotes a Boltzmann-weighted average over all states of the un- perturbed system. The reaction coordinates for the different sim- ulations are indicated in Figure 1; a perturbation step size of 0.05 8, was used in the first three calculations and a step size of 0.038 8, in the fcc calculation. Double-wide sampling and preferential sam- pling of waters around the solutes were used to increase sampling efficiency (Allen & Tildesly, 1986). Solutes were placed at a ran- dom position in one of 25 pre-equilibrated water boxes, high en- ergy waters were removed and the system was equilibrated for 1-1.5 million MC moves except in the methane cluster calculation described below. Sampling was then conducted over an additional 2-3 million moves for the methane dimer, 2 million moves for the methane trimer, and 6-9 million moves for the big solute dimer.
Solvent moves consisted of both a rotation between - 15 and 15” around one of the three axes parallel to the box edges, and a translation of between -0.15 and 0.15 8, in each of the x, y , and z directions. A volume move was performed every 2,375 moves: the center of mass coordinates of all molecules were multiplied by a scale factor between 0.994 and 1.006. Solutes were subjected to a random translation of between -0.08 and 0.08 8, in each of the x, y . and z directions every 90 moves. Because of the larger box size in the fcc simulation (Figs. lD, 6), solute and volume changes instead were attempted every 110 and 2,875 moves, respectively. Acceptance rates for solvent moves were about 40%.
A standard procedure for calculating errors in free energy per- turbation calculations is to calculate averages of the quantities of interest over blocks of 100,000-300,000 cycles, and then to cal- culate the standard deviations of these “block averages” (Allen & Tildesly, 1986). As will be described in more detail elsewhere, we found that such a procedure underestimated errors significantly; therefore, in all calculations reported here, free energies and stan- dard deviations were calculated from a minimum of 10 indepen- dently equilibrated runs except for the methane cluster calculation. The average error per angstrom for each PMF was estimated by adding the standard deviation of the mean free energy change for each point in quadrature and then dividing by the total length of the PMF; the errors were 0.044, 0.058, 0.064 kcal/(mol 8,) for the dimer, trimer, and big solute calculations, respectively, with the errors 1.5-2 times larger for points at the longest separations than for those at the shortest.
Slow solvent penetration into the methane cluster and trapping of high-energy waters within the cluster complicated the methane cluster PMF calculation. The existence of energy barriers too large to be crossed during the course of a simulation is clearly a problem for free energy calculations, as there is a possibility that important regions of phase space are sampled inadequately. To test the equil- ibration of the system, free energy changes were calculated using four different protocols. In one set of runs, the 36 highest-energy water molecules were removed after introduction of the methane cluster. Two PMFs were then calculated after equilibrating the system for 1 and 5 million moves, respectively (only five inde- pendent runs were performed for the calculations with 5 million equilibration moves). The PMF changed significantly after the in- creased equilibration (Fig. 8, triangles), suggesting the system had not fully equilibrated in 1 million moves. In a second set of runs, 46 waters were removed initially and two PMFs were again calculated after 1 and 5 million equilibration moves. The results (Fig. 8, squares) suggest clearly that equilibration is again incomplete. The statisti- cal errors within the sets of independent runs conducted for each of the four simulation protocols were at least an order of magnitude smaller than the systematic differences between the sets due to dif- ferences in initial conditions and equilibration times. Analysis of wa- ter configurations suggested that removal of 36 waters results in initial overpenetration of solvent in the methane cluster, whereas re- moval of 46 waters gives initial underpenetration.
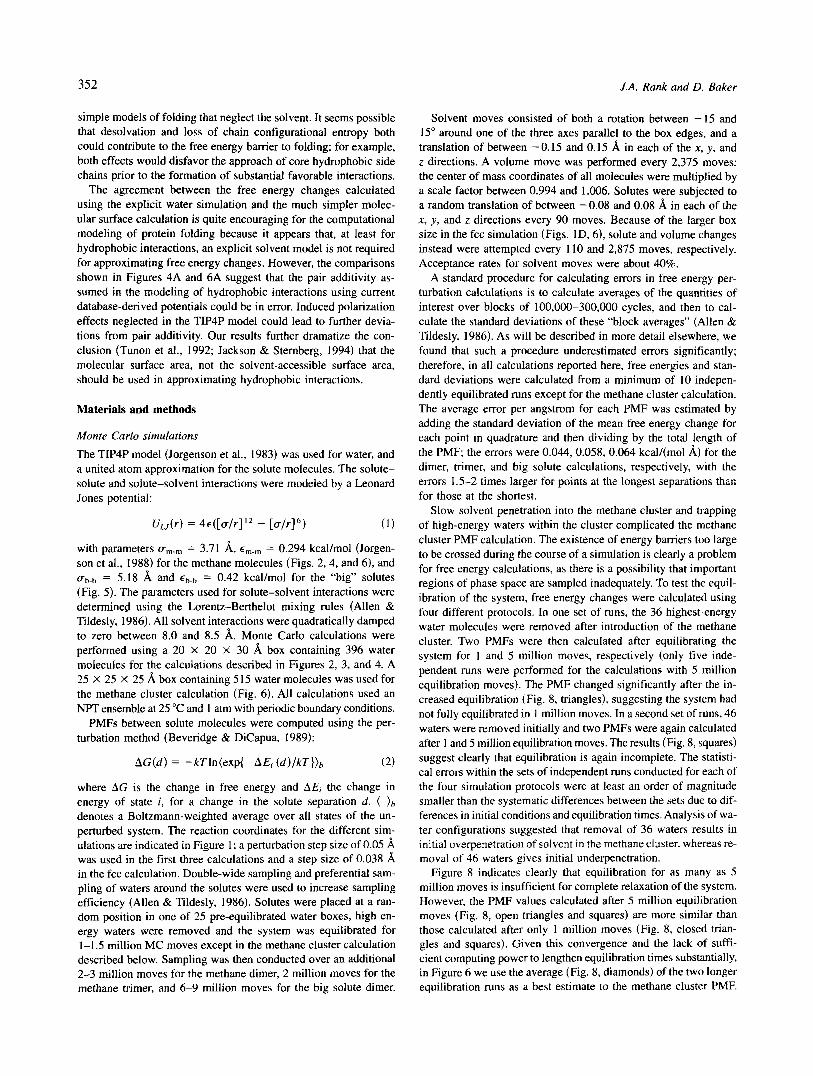
Figure 8 indicates clearly that equilibration for as many as 5 million moves is insufficient for complete relaxation of the system. However, the PMF values calculated after 5 million equilibration moves (Fig. 8, open triangles and squares) are more similar than those calculated after only 1 million moves (Fig. 8, closed trian- gles and squares). Given this convergence and the lack of suffi- cient computing power to lengthen equilibration times substantially, in Figure 6 we use the average (Fig. 8, diamonds) of the two longer equilibration runs as a best estimate to the methane cluster PMF.
Free energy of hydrophobic cluster formation 353
1 I I I ! 1 I ................................ i ................ j. ............................... i ................ j ................ 1 ....
..... \J'................ j ................ j ................ i ................ j ................ j ................ j .... I I I I I I I I
5 6 7 8 9 1 0 1 1 1 2 lattice separation (A)
Fig. 8. Dependence of cluster PMF on initial conditions and equilibration time. Triangles, 36 high-energy waters removed before equilibration; squares, 46 waters removed; closed symbols, 1 million attempted equilibration moves; open symbols, 5 million attempted moves; diamonds, the average of the two 5 million equilibration calculations.
Sudace area calculations
The changes in the molecular surface and the solvent-accessible surface (Richards, 1977) were calculated using simple analytic expressions for the dimerization reactions (see below) and using the MSCON (Connolly, 1983) and NACCESS (Hubbard & Thorn- ton, 1993) programs for the multibody reactions. For comparison to the PMF calculations, surface area changes were converted to free energy changes using scale factors of 0.025 kcal/A2 and 0.1 10 kcal/A2 for the solvent-accessible surface and the molecular sur- face, respectively (Jackson & Sternberg, 1994). Only qualitative agreement between the PMF calculations and the surface area calculations should be expected; our conclusions are independent of the precise values of the scale factors. In all surface calculations, a probe radius of 1.4 A was used to approximate the size of a water molecule.
Analytical expression for the molecular surface area of two spherical solutes
The molecular surface area (13, 14) of two solutes of radius R,. separated by a distance x can be separated into two parts. For
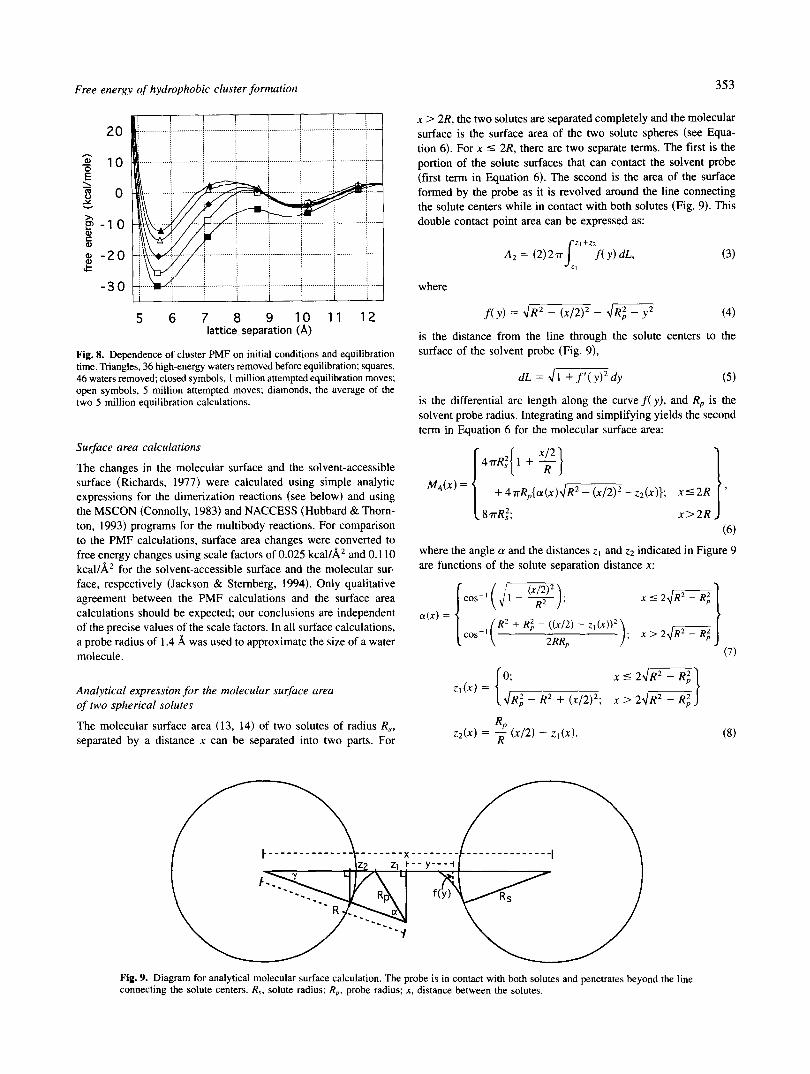
X > 2R, the two solutes are separated completely and the molecular surface is the surface area of the two solute spheres (see Equa- tion 6). For x 5 2R, there are two separate terms. The first is the portion of the solute surfaces that can contact the solvent probe (first term in Equation 6) . The second is the area of the surface formed by the probe as it is revolved around the line connecting the solute centers while in contact with both solutes (Fig. 9). This double contact point area can be expressed as:
Z I + Z 2
A2 = ( 2 1 2 ~ 1 , f ( y ) d L , (3)
where
f ( y ) = d" J W (4)
is the distance from the line through the solute centers to the surface of the solvent probe (Fig. 9),
dL = J l + f ' o 2 d y ( 5 )
is the differential arc length along the curve f ( y ) , and Rp is the solvent probe radius. Integrating and simplifying yields the second term in Equation 6 for the molecular surface area:
47rRi{ 1 + g] + ~ T R ~ { O L ( X ) ~ ~ - - Z ~ ( X ) } ; x 5 2 R
8rrR;; x > 2 R (6)
where the angle a and the distances z I and z2 indicated in Figure 9 are functions of the solute separation distance x:
x 5 2 d F - 3
.(x) =
cos-I RZ + R; - ((x/2) - Z I ( X ) ) ~
(7)
z , ( x ) =
RP Z A X ) = - ( x / 2 ) - Z I ( X ) . R (8)
Fig. 9. Diagram for analytical molecular surface calculation. The probe is in contact with both solutes and penetrates beyond the line connecting the solute centers. R,, solute radius; Rp, probe radius; x, distance between the solutes.
354 J.A. Rank and D. Baker
Acknowledgments
We thank W. Reinhardt and T. Lybrand for helpful advice at the beginning of this work; J. Solomon for assistance with parallel computing implemen- tation and resources through DOE grant #DE-FG03-92ER25 134; D. Alonso for help in surface area calculations; and K. Dill, D. Eisenberg, D. Teller, W. Parson, A. Li, C. Bystroff, W. Reinhardt, and V. Daggett for comments on the manuscript. J.R. was supported by an NIH molecular biophysics predoctoral fellowship. This work was supported by young investigator awards to D.B. from the NSF and the Packard foundation.
References Allen MP, Tildesly DJ. 1986. Computer simulations in liquids. Oxford: Clar-
Ben-Naim A. 1987. Solvation thermodynamics. New York Plenum Press. Beveridge DL, DiCapua FM. 1989. Free energy via molecular simulation. Annu
Brooks CL, Boczko EM. 1995. First principles calculation of the folding free
Daggett V, Levitt M. 1993. Protein unfolding pathways explored through mo-
Daggett V, Levitt M. 1994. Protein folding t) unfolding dynamics. Curr Opin
Dill K. 1987. The stabilities of globular proteins. In: Oxender DL, Fox CF, eds.
Dill K. 1990. Dominant forces in protein folding. Biochemistry 29:7133-7155. Hubbard SJ, Thornton JM. 1993. NACCESS computer program. London: Uni-
Itzhaki LS, Otzen DE, Fersht AR. 1995. The structure of the transition state for versity College, Department of Biochemistry and Molecular Biology.
folding of chymotrypsin inhibitor 2 analysed by protein engineering meth- ods: Evidence for a nucleation-condensation mechanism for protein folding. J Mol Biol 254:260-288.
Jackson RM, Sternberg MJ. 1994. Application of scaled panicle theory to model the hydrophobic effect: Implications for molecular association and protein stability. Protein Eng 7:371-384.
Jones DT, Thornton JM. 1996. Potential energy functions for threading. Curr Opin Struct Biol 6:2 10-2 16.
Jorgenson WL. Buckner JK, Boudon S, Tirado-Rives J. 1988. Efficient com- putation of absolute free energies of binding by computer simulations. Ap- plication to the methane dimer in water. J Chem Phys 893742.
endon Press.
Rev Biophys Biophys Chem 18431-492.
energy of a three-helix bundle protein. Science 269393-396.
Jorgenson WL, Chandrasekhar J, Madura JD, Impey RW, Klein ML. 1983. Comparison of simple potential functions for simulating liquid water. J Chem Phys 79:926-935.
Karplus M, Sali A. 1995. Theoretical studies of protein folding and unfolding. Curr Opin Struct BIOI 558-73.
Kauzmann W. 1959. Some factors in the interpretation of protein denaturation. Adv Protein Chem 14:l-63.
Kiefhaber T, Baldwin RL. 1995. Kinetics of hydrogen bond breakage in the process of unfolding of ribonuclease A measured by pulsed hydrogen ex- change. Proc Natl Acad Sci USA 92:2657-2661.
Li A, Daggett V. 1994. Characterization of the transition state of protein un-
Acad Sei USA 91:10430-10434. folding by use of molecular dynamics: Chymotrypsin inhibitor 2. Proc Natl
Pratt LR, Pohorille A. 1992. Theory of hydrophobicity: Transient cavities in molecular liquids. Proc Natl Acad Sci USA 89:2995-2999.
Reiss H. 1965. Scaled particle methods in the statistical thermodynamics of fluids. Adv Chem Ph.w 9: 1-84.
Richards FM. 1977. Areas, volumes, packing and protein structure. Annu Rev Biophys Bioeng 6: 15 1-1 76.
Serrano L, Matouschek A, Fersht AR. 1992. The folding of an enzyme. 111. Structure of the transition state for unfolding of bamase analysed by a protein engineering procedure. J Mol Biol 224:805-818.
Sippl MJ. 1995. Knowledge-based potentials for proteins. Curr Opin Struct Biol 5:229-235.
Smith DE, Haymet ADJ. 1993. Free energy, entropy, and internal energy of hydrophobic interactions: Computer simulations. J Chem Phys 98:644-54.
Tunon I, Silla E, Pascual-Ahuir JL. 1992. Molecular surface area and the hy- drophobic effect. Protein Eng 5:7 15-7 16.
Vidugiris GJA, Markley JL, Royer CA. 1995. Evidence for a molten globule- like state in protein folding from determination of activation volumes. Bio- chemistry 34:4909-49 I 2.
Waldburger CD, Jonsson T, Sauer RT. 1996. Bamers to protein folding: For- mation of buried polar interactions is a slow step in acquisition of structure. Proc Nafl Acad Sei USA 93:2629-2634.
Wallqvist A. 1991. Molecular dynamics study of a hydrophobic aggregate in an aqueous solution of methane. J Phys Chem 95:8921-8927.
Wolynes PG, Onuchir JN, Thirumalai D. 1995. Navigating the folding routes. Science 267:1619-1620.
Wood RH, Thompson PT. 1990. Differences between pair and bulk hydrophobic interactions. Proc Natl Acad Sci USA 87946-949.
Yi Q. Baker D. 1996. Direct evidence for a two-state protein unfolding transition from hydrogen-deuterium exchange, mass spectrometry, and NMR. Protein Sei 5:1060-1066.