02/05/2012 1 Welcome to A presentation on RAMAGUNDAM A presentation on A DMAIC Project on 'Optimisation of Boiler Exit Flue Gas Temperatures at Unit 7' Gas Temperatures at Unit-7 Venue: 7 th National Quality Conclave RAMAGUNDAM Lostt Singareni, WCL, Sriramsagar RAMAGUNDAM TYPICAL VALUES RAMAGUNDAM
Transcript
02/05/2012
1
Welcome to A presentation on
RAMAGUNDAM
A presentation on
A DMAIC Project on'Optimisation of Boiler Exit Flue
Gas Temperatures at Unit 7'Gas Temperatures at Unit-7
Venue: 7th National Quality Conclave
RAMAGUNDAM
Lostt
Singareni, WCL, Sriramsagar
RAMAGUNDAM
TYPICAL VALUES
RAMAGUNDAM
02/05/2012
2
WINDBOX/SADC WINDBOX/SADC
COALfurnace
MILLS A,B,C,DE,
MILLS F,G,H,J,K
Sec. AirDivisional Panel Super
Heater
Platen Super Heater
Reheater
FW FW
PAH-A SAH-A SAH-B PAH-B
PA to MillsPA to Mills
Drum
LTSH
Economiser
Secondary AirP i i
ESP C ESP C ESP B ESP AESP Inlet Header
ESP Inlet Header
Primary air
Chimney
ID Fan B ID Fan A
Reduce the Reduce the
RAMAGUNDAM
OBJECTIVE OF THE PROJECT
average flue gas average flue gas
temperature at temperature at
Air Preheater Air Preheater
outlet in unitoutlet in unit--77
CONTROLCONTROLSTANDING INSTRUCTIONS
RAMAGUNDAM
ANALYSISANALYSIS
IMPROVEIMPROVE
ANALYSIS OF PAST/DOE DATA
RECOMMENDED SETTINGS
DEFINEDEFINE
MEASUREMEASURE
DEVELOPING BUSINESS CASEWITH POTENTIAL BENEFITS
HISTORICAL/LIVE DATA COLLECTION
RAMAGUNDAM
02/05/2012
3
AVERAGE FGT IN JANAVERAGE FGT IN JAN 20112011 147 8147 8 OO CC
RAMAGUNDAM
AVERAGE FGT IN JANAVERAGE FGT IN JAN--20112011-- 147.8 147.8 OO CC(Unit Overhaul was done in August 2010 )(Unit Overhaul was done in August 2010 )
125125 OO C ( at NCR) /128 C ( at NCR) /128 OO C ( at BMCR)C ( at BMCR)
Note : 21 Note : 21 OO C Reduction of FGT results in 1% improvement in C Reduction of FGT results in 1% improvement in Boiler EfficiencyBoiler Efficiency
LB USL
LB 120Target *
Process Data WithinOverall
Unit-7 Capability Analysis-Jan-11
RAMAGUNDAM
TargetUSL 135Sample Mean 147.759Sample N 2761StDev (Within) 0.631459StDev (O v erall) 9.69413
C p *C PL *C PU -6.74C pk -6.74
Pp *PPL *PPU -0.44Ppk -0.44C pm *
O v erall C apability
Potential (Within) C apability
172.5165.0157.5150.0142.5135.0127.5120.0
PPM < LB 0.00PPM > USL 886997.46PPM Total 886997.46
O bserv ed PerformancePPM < LB *PPM > USL 1000000.00PPM Total 1000000.00
Exp. Within PerformancePPM < LB *PPM > USL 905944.62PPM Total 905944.62
Exp. O v erall Performance
RAMAGUNDAM RAMAGUNDAM
Through Brainstorming the following were Through Brainstorming the following were identifiedidentified
1.1. Coal FlowCoal Flow2.2. Primary Air FlowPrimary Air Flow3.3. Secondary Air FlowSecondary Air Flow4.4. Burner Tilt Position Cornerwise (Give Corner numbers)Burner Tilt Position Cornerwise (Give Corner numbers)
NTPC,RAMAGUNDAMRAMAGUNDAM
( )( )5.5. Each Mill Outlet temp ( which are in service)Each Mill Outlet temp ( which are in service)6.6. Wind Box DPWind Box DP7.7. APH soot blowing timingsAPH soot blowing timings8.8. Air pre Heater air inlet temp (APHAir pre Heater air inlet temp (APH--Wise)Wise)9.9. Air Pre Heater outlet Damper Position (APHAir Pre Heater outlet Damper Position (APH--wise)wise)10.10. Super Heater Spray (tph)Super Heater Spray (tph)11.11. Steam FlowSteam Flow
( h)( h)12.12. ReRe--Heater Spray (tph)Heater Spray (tph)13.13. FAD PositionFAD Position14.14. OFD positionOFD position15.15. Wall blowing Status (timings and no of blowers Operated)Wall blowing Status (timings and no of blowers Operated)16.16. LRSB Operation details (timings, date, number of blowers(groupLRSB Operation details (timings, date, number of blowers(group--wise wise
))))17.17. Mill Combination details (which mill, feeding rate each mill(tph))Mill Combination details (which mill, feeding rate each mill(tph))18.18. Load in MWLoad in MW
RAMAGUNDAM
FGT AT PAPHFGT AT PAPH--A OUTLETA OUTLET
FGT AT PAPHFGT AT PAPH--B OUTLETB OUTLET
FGT AT SAPHFGT AT SAPH--A OUTLETA OUTLET
FGT AT SAPHFGT AT SAPH--B OUTLETB OUTLET
Note: All the above four variables are combined to form a single output variable as Average Flue Gas Temperature at Air Pre-heater Outlet
RAMAGUNDAM
Mill CombinationMill Combination Average Mill Height ( Fire Ball Height)Average Mill Height ( Fire Ball Height) Wear Out of Combustion ComponentsWear Out of Combustion Components Performance of Feed Water HeatersPerformance of Feed Water Heaters
APH I t l C ditiAPH I t l C diti APH Internal ConditionAPH Internal Condition
f Sf S
RAMAGUNDAM
Process Information ServerProcess Information ServerControl Room DASControl Room DASPADOPADO
Note: No MSA was done as the source of data is most Note: No MSA was done as the source of data is most reliable.reliable.
VIF value more than 5 indicates multi-collinearity. This limits the application of Multiple Linear regression for our purpose.
The objective was to identify the The objective was to identify the ‘i d d t F t ’ hi h l i th‘i d d t F t ’ hi h l i th
DATA ANALYSIS
RAMAGUNDAM
‘independent Factors’ which explain the ‘independent Factors’ which explain the variation in the ‘dependent’ variable.variation in the ‘dependent’ variable.
Partial Least Square Regression (PLSR) was Partial Least Square Regression (PLSR) was used to identify those factors whichused to identify those factors whichused to identify those factors which used to identify those factors which explain the variation in FG Exit Tempexplain the variation in FG Exit Temp..
02/05/2012
7
Analysis of Variance for AV. FG TEMP BEF PAH-A(DEG C)
Source DF SS MS F P
RAMAGUNDAM
Source DF SS MS F PRegression 10 72934.4 7293.44 740.73 0.000Residual Error 1197 11786.1 9.85Total 1207 84720.5
Model Selection and Validation for AV. FG TEMP BEF PAH-A(DEG C)
PLS Regression: Av. FG Temp versus Coal Flow, P. Air Flow, S. Air Flow, ...
RAMAGUNDAM
Analysis of Variance for Av. FG Temp Aft APHs
Source DF SS MS F PRegression 8 6300.05 787.506 56.16 0.000Residual Error 39 546.91 14.023Total 47 6846.96
Model Selection and Validation for Av. FG Temp Aft APHs
C t X V i E R SComponents X Variance Error R-Sq1 0.22263 1730.98 0.7471902 0.40773 728.77 0.8935623 0.50477 587.60 0.9141804 0.59605 557.10 0.9186365 0.64461 547.11 0.9200956 0.76266 546.92 0.9201237 0.87466 546.91 0.9201238 1.00000 546.91 0.920123
PLS Coefficient Plot(response is Av. FG Temp Aft APHs)
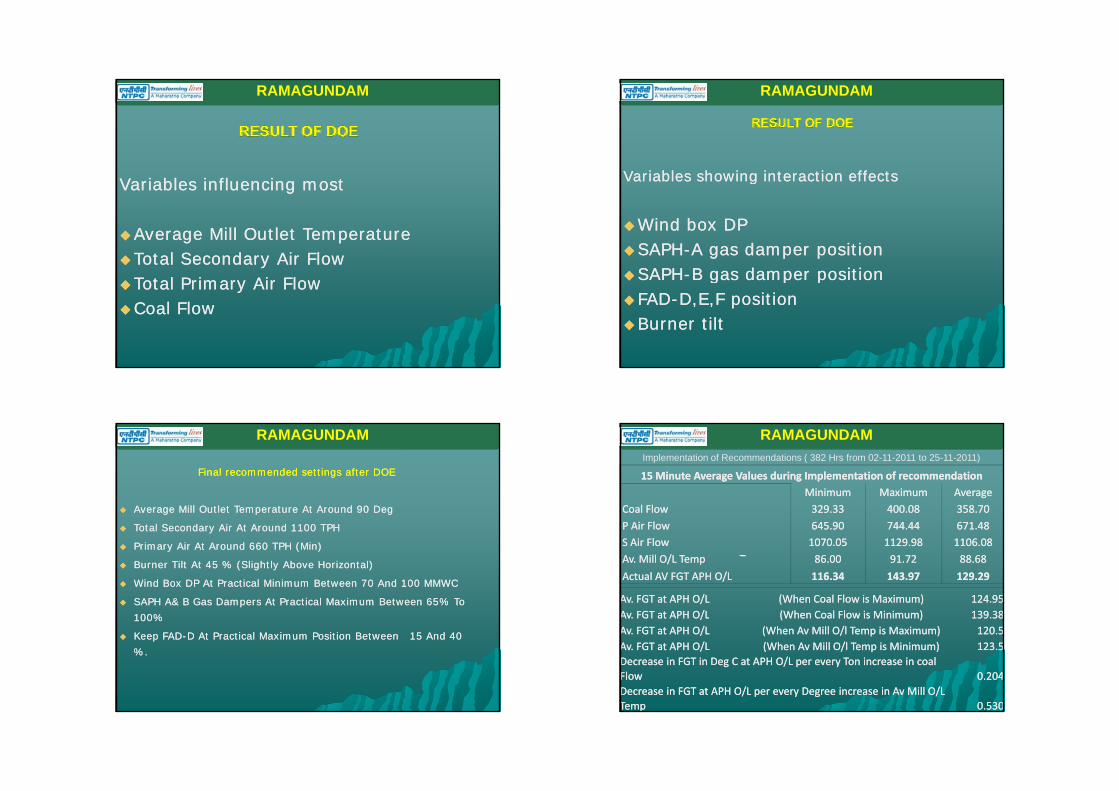
Variables influencing mostVariables influencing most
Average Mill Outlet TemperatureAverage Mill Outlet TemperatureTotal Secondary Air FlowTotal Secondary Air FlowTotal Primary Air FlowTotal Primary Air FlowCoal FlowCoal Flow
Wind box DPWind box DPSAPHSAPH--A gas damper positionA gas damper positionSAPHSAPH B gas damper positionB gas damper positionSAPHSAPH--B gas damper positionB gas damper positionFADFAD--D,E,F positionD,E,F positionBurner tiltBurner tilt
Final recommended settings after DOEFinal recommended settings after DOE
Average Mill Outlet Temperature At Around 90 DegAverage Mill Outlet Temperature At Around 90 Deg
RAMAGUNDAM
Total Secondary Air At Around 1100 TPH Total Secondary Air At Around 1100 TPH
Primary Air At Around 660 TPH (Min)Primary Air At Around 660 TPH (Min)
Burner Tilt At 45 % (Slightly Above Horizontal)Burner Tilt At 45 % (Slightly Above Horizontal)
Wind Box DP At Practical Minimum Between 70 And 100 MMWCWind Box DP At Practical Minimum Between 70 And 100 MMWC
SAPH A& B Gas Dampers At Practical Maximum Between 65% To SAPH A& B Gas Dampers At Practical Maximum Between 65% To 100%100%100%100%
Keep FADKeep FAD--D At Practical Maximum Position Between 15 And 40 D At Practical Maximum Position Between 15 And 40 %.%.
15 Minute Average Values during Implementation of recommendation 15 Minute Average Values during Implementation of recommendation MinimumMinimum MaximumMaximum AverageAverage
Implementation of Recommendations ( 382 Hrs from 02-11-2011 to 25-11-2011)
RAMAGUNDAM
P Air FlowP Air Flow 645.90645.90 744.44744.44 671.48671.48S Air FlowS Air Flow 1070.051070.05 1129.981129.98 1106.081106.08Av. Mill O/L TempAv. Mill O/L Temp 86.0086.00 91.7291.72 88.6888.68Actual AV FGT APH O/LActual AV FGT APH O/L 116.34116.34 143.97143.97 129.29129.29
Av. FGT at APH O/LAv. FGT at APH O/L (When Coal Flow is Maximum)(When Coal Flow is Maximum) 124.95124.95Av FGT at APH O/LAv FGT at APH O/L (When Coal Flow is Minimum)(When Coal Flow is Minimum) 139 38139 38Av. FGT at APH O/LAv. FGT at APH O/L (When Coal Flow is Minimum)(When Coal Flow is Minimum) 139.38139.38Av. FGT at APH O/LAv. FGT at APH O/L (When Av Mill O/l Temp is Maximum)(When Av Mill O/l Temp is Maximum) 120.5120.5Av. FGT at APH O/LAv. FGT at APH O/L (When Av Mill O/l Temp is Minimum)(When Av Mill O/l Temp is Minimum) 123.5123.5Decrease in FGT in Deg C at APH O/L per every Ton increase in coal Decrease in FGT in Deg C at APH O/L per every Ton increase in coal FlowFlow 0.2040.204Decrease in FGT at APH O/L per every Degree increase in Av Mill O/L Decrease in FGT at APH O/L per every Degree increase in Av Mill O/L Temp Temp 0.5300.530
02/05/2012
11
LSL Target USLProcess Data Within
Unit-7 APHs FGT Capability after Implementation-Nov-11(using 95.0% confidence)
RAMAGUNDAM
LSL 120Target 130USL 135Sample Mean 128.742Sample N 1529StDev (Within) 0.466578StDev (O v erall) 6.53012
Process Data
Z.Bench *Z.LSL 18.74Z.USL 13.41C pk 4.47Upper C L 4.60
Z.Bench 0.65Z.LSL 1.34Z USL 0 96
O v erall C apability
Potential (Within) C apability
WithinOverall
145140135130125120115
Upper C L 0.34C pm 0.25
Z.USL 0.96Ppk 0.32
PPM < LSL 102681.49PPM > USL 162851.54PPM Total 265533.03
O bserv ed PerformancePPM < LSL 0.00PPM > USL 0.00PPM Total 0.00
Exp. Within PerformancePPM < LSL 90336.40PPM > USL 168939.85PPM Total 259276.26
Exp. O v erall Performance
BeforeBeforeAfter
RAMAGUNDAM
BeforeBefore
Limitations For Continuous OperationLimitations For Continuous Operation
RAMAGUNDAM
Fire in Mill rejects at 90Deg C Fire in Mill rejects at 90Deg C ––for certain types for certain types of Coals of Coals (Coal with high Sulfur/Iron content)(Coal with high Sulfur/Iron content)
Maintaining Recommended air flow becomes Maintaining Recommended air flow becomes difficult because of Clinkering problems difficult because of Clinkering problems
Burner Tilt is essentially required to Maintain Burner Tilt is essentially required to Maintain rated steam parametersrated steam parameters
RAMAGUNDAM
Trial run carried out with recommended settings and with Trial run carried out with recommended settings and with settings settings awayaway from recommended values for a short duration from recommended values for a short duration of 6 Hours for reconfirming the results of 6 Hours for reconfirming the results
02/05/2012
12
Absolute reduction in Av FGT after APHs= 18 deg CAbsolute reduction in Av FGT after APHs= 18 deg C
Tangible Gains achievedRAMAGUNDAM
Reduction due to Coal Quality variation = 9.5 Deg C Reduction due to Coal Quality variation = 9.5 Deg C
Net FGT reduction achieved = 8.5 Deg C Net FGT reduction achieved = 8.5 Deg C
Computed gain in Heat Rate: 9.7 K.Cal / KWHComputed gain in Heat Rate: 9.7 K.Cal / KWH
RAMAGUNDAM
Sustenance PlansSustenance Plans
11 Standing Instructions to theStanding Instructions to the1.1. Standing Instructions to the Standing Instructions to the operator to maintain the operator to maintain the recommended settings recommended settings
2.2. Sharing of the knowledge with all Sharing of the knowledge with all concernedconcerned
3.3. Monitoring through ORT meetingsMonitoring through ORT meetings
Intangible GainsIntangible Gains
d l S l ld l S l l
RAMAGUNDAM
Learned a Versatile Statistical tool Learned a Versatile Statistical tool which will be very useful in a Power which will be very useful in a Power Plant operationsPlant operations
02/05/2012
13
RAMAGUNDAM
Just by changing operating practices, it is Just by changing operating practices, it is
possible to achieve a substantial possible to achieve a substantial
reduction of 8.5 reduction of 8.5 00 c in FGT at APHS c in FGT at APHS
outlet in unitoutlet in unit 77outlet, in unitoutlet, in unit--77..


![diagram 5.1 [Converted] - Building Control NI · part of the flue serving an open-flued appliance. flue soot door debris collection space chimney appliance flue outlet appliance flue](https://static.documents.pub/doc/80x56/60ea4a68722f9641f22c1939/diagram-51-converted-building-control-ni-part-of-the-flue-serving-an-open-flued.jpg)


