<XX> 75 A dozen facts about transport in Australia 1 The purpose of this Information Sheet is to provide the reader with a quick source of basic facts about the Australian transport system. Beneath each fact there is the essential data (in figures and tables). If you need to know more, the sources are provided at the end of the paper. 1. How big is the transport network? There are 874,500 kms of road in Australia. Seventeen percent is urban, the rest is non-urban. It is one of the world’s most extensive with a per capita length twice as much as New Zealand and Canada. There are 33,300 kms of heavy rail in Australia and 291 kms of light rail. It is the seventh largest system in the world. There are 40 significant airports in Australia. Ten of these are international. There are 37 ports in Australia with an annual throughput of over one billion dollars. The nation’s exports are mainly through bulk ports with Port Headland the fifth largest port in the world measured by tonnage. Imports mostly come through capital city container ports. Melbourne is the largest in Australia and handles more than 2.5 million containers a year. It is 54 in the world’s container ports rankings with Sydney at 66. Figure 1: Total road length by urban and non-urban by road type, 2015 Figure 2: Proportion of total road length by road type, 2015 Source: BITRE (2015), Yearbook 2015: Australian Infrastructure Statistics, Table T 1.6, BITRE, Canberra. Source: BITRE (2015), Yearbook 2015: Australian Infrastructure Statistics, Table T 1.6, BITRE, Canberra. 0 200 400 600 800 Highway Arterial Local Kms ('000) Non-urban Urban Highway (6%) Arterial (21%) Local (73%)
Transcript
<X
X>
75
1
A dozen facts about transport in Australia
1
1
The purpose of this Information Sheet is to provide the reader with a quick source of basic facts about the Australian transport system. Beneath each fact there is the essential data (in figures and tables). If you need
to know more, the sources are provided at the end of the paper.
1. How big is the transport network?
There are 874,500 kms of road in Australia. Seventeen percent is urban, the rest is non-urban. It is one of the
world’s most extensive with a per capita length twice as much as New Zealand and Canada. There are 33,300 kms of heavy rail in Australia and 291 kms of light rail. It is the seventh largest system in the world.
There are 40 significant airports in Australia. Ten of these are international.
There are 37 ports in Australia with an annual throughput of over one billion dollars. The nation’s exports
are mainly through bulk ports with Port Headland the fifth largest port in the world measured by tonnage. Imports mostly come through capital city container ports. Melbourne is the largest in Australia and handles
more than 2.5 million containers a year. It is 54 in the world’s container ports rankings with Sydney at 66.
Figure 1 : Tota l road length by urban and
non-urban by road type, 2015
Figure 2: Proportion of total road length by road type,
2015
S ou r c e : B I TR E ( 2 01 5 ) , Ye a r bo ok 2 01 5 : A u s t r a l i a n
I n f r a s t r u c t u r e S t a t i s t i c s , T a b l e T 1 . 6 , B I TR E , Ca nbe r r a .
S ou r c e : B I T RE ( 20 15 ) , Ye a rb ook 20 15 : A u s t r a l i a n
I n f r a s t r u c t u r e S t a t i s t i c s , T a b l e T 1 . 6 , B I TR E , Ca nbe r r a .
0
200
400
600
800
Highway Arterial Local
Km
s ('
00
0)
Non-urban
Urban
Highway(6%)
Arterial(21%)
Local(73%)
75
2
2
2
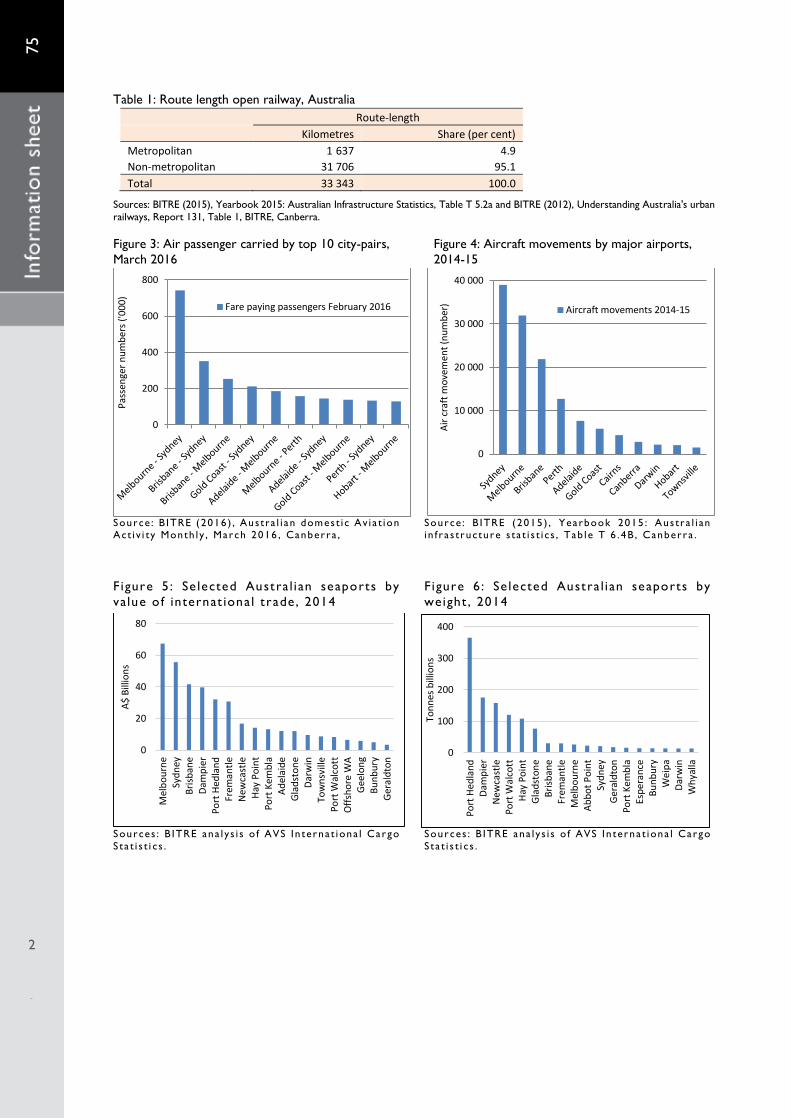
Table 1: Route length open railway, Australia
Route-length
Kilometres Share (per cent)
Metropolitan 1 637 4.9
Non-metropolitan 31 706 95.1
Total 33 343 100.0
Sources: BITRE (2015), Yearbook 2015: Australian Infrastructure Statistics, Table T 5.2a and BITRE (2012), Understanding Australia's urban
railways, Report 131, Table 1, BITRE, Canberra.
Figure 3: Air passenger carried by top 10 city-pairs,
March 2016 Figure 4: Aircraft movements by major airports,
2014-15
Source : B ITRE (2016 ) , Aus tra l i an domes t i c Av i a t ion Act i v i t y Month l y , March 2016 , Canberra ,
Source : B ITRE (2015 ) , Yearbook 2015 : Aus tr a l i an i n f r a s t ructu re s ta t i s t i c s , Tab le T 6 .4B , Canberra .
Figure 5 : Se lected Austra l i an seaports by
value o f internat iona l t rade , 2014
Figure 6 : Se lected Austra l i an seaports by
weight , 2014
Sources : B ITRE ana l ys i s o f AVS In terna t iona l Cargo S ta t i s t i c s .
Sources : B ITRE ana l ys i s o f AVS In terna t iona l Cargo S ta t i s t i c s .
0
200
400
600
800
Pas
sen
ger
nu
mb
ers
('0
00
)
Fare paying passengers February 2016
0
10 000
20 000
30 000
40 000
Air
cra
ft m
ove
men
t (n
um
ber
)
Aircraft movements 2014-15
0
20
40
60
80
Mel
bo
urn
eSy
dn
eyB
risb
ane
Dam
pie
rP
ort
Hed
lan
dFr
eman
tle
New
cast
leH
ay P
oin
tP
ort
Kem
bla
Ad
elai
de
Gla
dst
on
eD
arw
inTo
wn
svill
eP
ort
Wal
cott
Off
sho
re W
AG
eelo
ng
Bu
nb
ury
Ger
ald
ton
A$
Bill
ion
s
0
100
200
300
400
Po
rt H
edla
nd
Dam
pie
rN
ewca
stle
Po
rt W
alco
ttH
ay P
oin
tG
lad
sto
ne
Bri
sban
eFr
eman
tle
Mel
bo
urn
eA
bb
ot
Po
int
Syd
ney
Ger
ald
ton
Po
rt K
emb
laEs
per
ance
Bu
nb
ury
Wei
pa
Dar
win
Wh
yalla
Ton
nes
bill
ion
s
75
3
3
3
2. How far do we travel?
On an average day in 2013-14, Australians travelled more than 1.15 billion kilometres on the passenger
network (all modes). In other words, on an average day in 2013-14 each Australian travelled 49 kilometres.
3. Is this increasing?
Yes. There are two factors that determine the rate of increase: vehicle kilometres travelled (VKT) per capita
and population growth. Throughout most of the twentieth century, both increased rapidly until around 2004 when VKT per capita began to flatten as travel demand became saturated. However, Australia has one of the
highest rates of population growth in the developed world and passenger demand on the road and rail network is increasing by around 1.5 per cent per year.
Figure 7 : Tota l passenger trave l by al l modes,
1970-71 to 2013-14 , Austral i a
Figure 8 : Annual veh icle -k i lometres travel led
by a l l modes , 1970 -71 to 2013-14 , Austral i a
Source : B ITRE (2015 ) , Yearbook 2015 : Aus tr a l i an I n f r a s t ructu re S ta t i s t i c s , Tab le 3 .1 , B ITRE , Canberra .
Source : B ITRE (2015 ) , Yearbook 2015 : Aus tr a l i an I n f r a s t ructu re S ta t i s t i c s , Tab les 3 . 1 and 11 .5a , B ITRE , Canberra .
4. How do we travel?
In 2013-14, 70 per cent of passenger travel is done on the road network in the nation’s 18 million registered
vehicles, while air handled 17 per cent. Rail carried four percent. Fifty five percent of surface travel is done in
capital cities, a figure that has scarcely changed for 40 years.
Figure 9: Proportion of passenger travel by road, rail and air, 2013-14, Australia
S ou r c e : B I T RE ( 2 01 5 ) , Y e a r bo ok 2 01 5 : A u s t r a l i a n I n f r a s t r u c tu r e S t a t i s t i c s , T a b l e T 3 . 1 , B I T RE , Ca n be r r a .
0
125
250
375
500
19
70-7
1
19
73-7
4
19
76-7
7
19
79-8
0
19
82-8
3
19
85-8
6
19
88-8
9
19
91-9
2
19
94-9
5
19
97-9
8
20
00-0
1
20
03-0
4
20
06-0
7
20
09-1
0
20
12-1
3
Bill
ion
s km
s
0
5,000
10,000
15,000
20,000
19
70-7
1
19
73-7
4
19
76-7
7
19
79-8
0
19
82-8
3
19
85-8
6
19
88-8
9
19
91-9
2
19
94-9
5
19
97-9
8
20
00-0
1
20
03-0
4
20
06-0
7
20
09-1
0
20
12-1
3
kms
Road(79 per cent)
Air(17 per cent)
Rail (4 per cent)
75
4
4
4
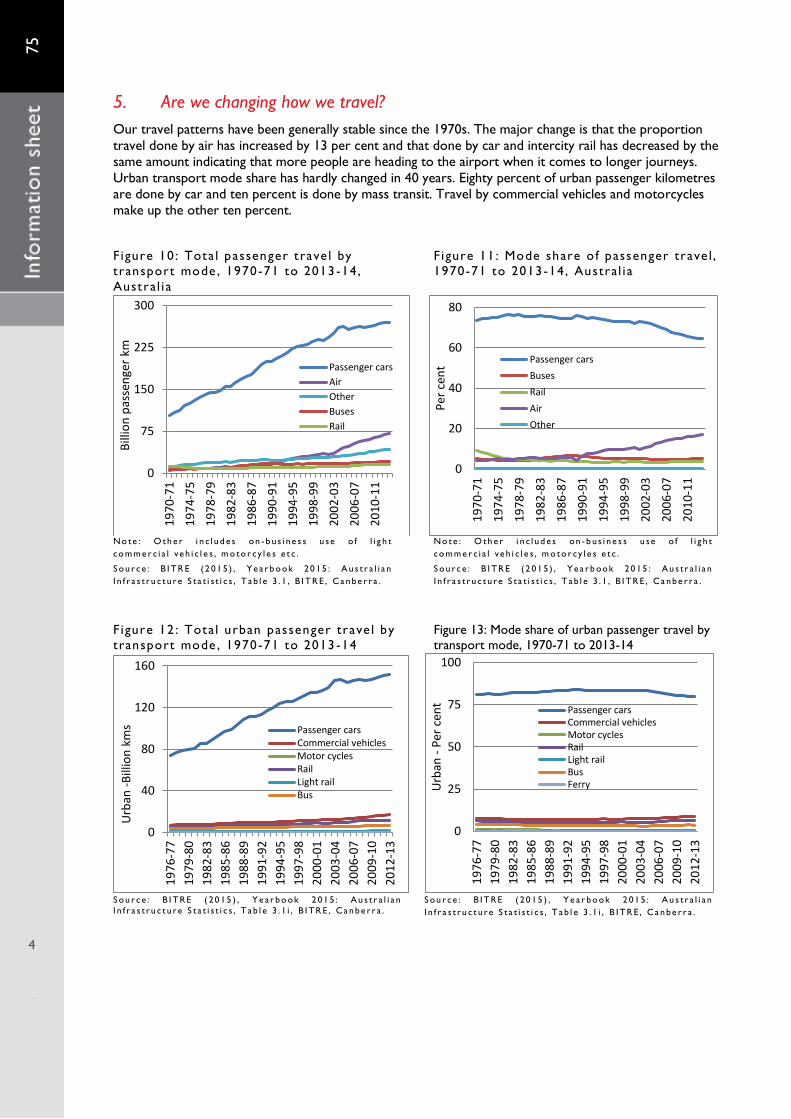
5. Are we changing how we travel?
Our travel patterns have been generally stable since the 1970s. The major change is that the proportion
travel done by air has increased by 13 per cent and that done by car and intercity rail has decreased by the same amount indicating that more people are heading to the airport when it comes to longer journeys.
Urban transport mode share has hardly changed in 40 years. Eighty percent of urban passenger kilometres are done by car and ten percent is done by mass transit. Travel by commercial vehicles and motorcycles make up the other ten percent.
Figure 10 : Tota l passenger t rave l by
transport mode , 1970-71 to 2013 -14,
Austral i a
Figure 11 : Mode share o f passenger trave l ,
1970-71 to 2013-14 , Austral i a
No te : O th e r i n c l ud e s on - b u s i n e s s u se o f l i g h t
co m m e r c i a l v e h i c l e s , m o to r cy l e s e t c .
S ou r c e : B I TR E ( 2 01 5 ) , Ye a rb ook 20 15 : A u s t r a l i a n
I n f r a s t r u c t u r e S t a t i s t i c s , T a b l e 3 . 1 , B I T R E , Ca nbe r r a .
Figure 12 : Tota l urban passenger trave l by
transport mode , 1970-71 to 2013 -14
Figure 13: Mode share of urban passenger travel by
transport mode, 1970-71 to 2013-14
S ou r c e : B I T RE ( 20 15 ) , Ye a r bo ok 2 01 5 : A u s t r a l i a n
I n f r a s t r u c t u r e S t a t i s t i c s , T a b l e 3 . 1 i , B I TR E , Ca nbe r r a .
S ou r c e : B I T RE ( 20 15 ) , Ye a r bo ok 2 01 5 : A u s t r a l i a n
I n f r a s t r u c t u r e S t a t i s t i c s , T a b l e 3 . 1 i , B I TR E , Ca nbe r r a .
0
75
150
225
300
19
70
-71
19
74
-75
19
78
-79
19
82
-83
19
86
-87
19
90
-91
19
94
-95
19
98
-99
20
02
-03
20
06
-07
20
10
-11
Bill
ion
pas
sen
ger
km
Passenger cars
Air
Other
Buses
Rail
0
20
40
60
80
19
70
-71
19
74
-75
19
78
-79
19
82
-83
19
86
-87
19
90
-91
19
94
-95
19
98
-99
20
02
-03
20
06
-07
20
10
-11
Per
cen
t
Passenger cars
Buses
Rail
Air
Other
0
40
80
120
160
19
76
-77
19
79
-80
19
82
-83
19
85
-86
19
88
-89
19
91
-92
19
94
-95
19
97
-98
20
00
-01
20
03
-04
20
06
-07
20
09
-10
20
12
-13
Urb
an -
Bill
ion
km
s Passenger carsCommercial vehiclesMotor cyclesRailLight railBus
Urban passenger transport is influenced by three main forces; spatial efficiency, network access and
peaking loads. Rail is especially efficient in its use of space. A single rail line operating at peak efficiency can move as many people as a ten lane freeway. This means trains are the best mode where space is most
limited such as inner cities and peak hour traffic. Their ability to handle peaking loads such as the morning peak is vital to the functioning of the network. The downside is that access to the rail network is poor compared to cars. To use rail (or bus) without costly mode switching, people have to live within walking
distance of the station and their destination. This is why car travel is the dominant mode for passenger travel in lower density parts of the city and outside peak hours.
Figure 14 : Number of people trave l l ing on
weekdays by pr ivate veh ic les and pub l ic
transport , 2012-13, Melbourne
Figure 15 : Average journey -to-work trave l
t ime, 2012-13 , Melbourne
S ou r c e : Re d r a w n f ro m V i c to r i a n I n t e g r a t e d S u r v e y o f
T r a ve l & A c t i v i t y 2 01 2 - 13 ( h t t p s : / / p ub l i c . t a b l e a u . c om /
p ro f i l e / d e d j t r # ! / v i z ho m e /V I S TA 20 12 - 13 -
T r a ve l b y t i m e o f d a y ) .
S ou r c e : V i c t o r i a n D e pa r tm e n t o f T r a n s po r t ( 2 0 13 ) ,
V i c t o r i a n I n t e g r a t e d S u r ve y o f T r a ve l a nd A c t i v i t y ,
<w w w . d t p l i . v i c . g o v . a u / t r a n s po r t / r e se a r c h - a n d d a t a /
s t a t i s t i c s / v i c t o r i a n - i n t e g r a t e d - s u r ve y - o f - t r a ve l - a n d -
a c t i v i t y#d a t a .
7. What about freight?
On an average day, nearly 5 million tonnes of freight are moved within Australia. Trucks move around 70
per cent (by weight) and dominate the non-bulk task. Rail moves 28 per cent and is stronger in bulk transport. The remaining two percent is mainly coastal shipping with negligible amounts of domestic
freight carried by air. It is important to note that goods moved by rail (and coastal shipping) travel longer distances and thus rail freight has the highest share (by tonne-kilometre or tkm). Since 2002-03, rail
freight share overtook road freight share. In 2013-14, rail freight share was 49 per cent, while road freight share was 33.5 per cent. Freight moved by air is a very small component of total freight moved (around
0.4 billion tkm).
0
125,000
250,000
375,000
500,000
4.0
0am
5.3
0am
7.0
0am
8.3
0am
10
.00
am
11
.30
am
1.0
0p
m
2.3
0p
m
4.0
0p
m
5.3
0p
m
7.0
0p
m
8.3
0p
m
10
.00
pm
11
.30
pm
Per
son
s
Light passenger vehicle
Mass transit
0
20
40
60
80
Pri
vate
veh
icle
Pu
blic
tran
spo
rt
Bic
ycle
Wal
kin
g
Oth
er
All
mo
des
Ave
rage
jou
rney
-to
-wo
rk t
rave
l tim
e (m
inu
tes)
Transport mode
Inner
Middle
Outer
75
6
6
6
Figure 16 : Tota l domest ic fre ight (bu lk and
non-bulk) by transport mode , 1970 -71 to
2013-14, Austra l i a
F igure 17 : Tota l bu lk and non-bu lk domest ic
fre ight , 1970 -71 to 2013 -14, Austra l i a
S ou r c e : B I TR E ( 20 15 ) , Y e a r b ook 2 01 5 : A u s t r a l i a n
I n f r a s t r u c t u r e S t a t i s t i c s 2 01 5 , F i g u r e T 2 . 1 c , B I TR E ,
Ca n be r r a .
S ou r c e : B I TR E ( 2 01 5 ) , Ye a r bo ok 2 01 5 : A u s t r a l i a n
I n f r a s t r u c t u r e S t a t i s t i c s 2 01 5 , T a b l e s T 2 . 1 a a nd T 2 . 1 b ,
B I TR E , Ca nb e r r a .
8. Is freight transport increasing?
Freight transport is increasing at a much faster rate than passenger transport. Road freight, for example,
has doubled in the last 20 years. Much of our freight involves international trade, with container movement through ports growing at more than six per cent a year and bulk freight at ports growing by
nearly 4 per cent per annum.
Figure 18 : Tota l f re ight and passenger
trave l , 1970-71 to 2013-14, Austral i a
F igure 19 : Tota l f re ight and passenger (per
capita) , 1970-71 to 2013-14, Austra l i a
S ou r c e : B I TR E ( 20 15 ) , Y e a r bo ok 20 1 5 : A u s t r a l i a n
I n f r a s t r u c t u r e S t a t i s t i c s , T a b l e s T 2 . 1 c , T 3 . 1 a nd F i g u r e
T2 , B I T RE , Ca nbe r r a .
S ou r c e : B I TR E ( 20 15 ) , Y e a r bo ok 20 1 5 : A u s t r a l i a n
I n f r a s t r u c t u r e S t a t i s t i c s , T a b l e s 1 1 . 5 c , T 2 . 1 c a n d T
3 . 1 , B I T R E , Ca nbe r r a .
0
100
200
300
4001
970
-71
19
73-7
4
19
76-7
7
19
79-8
0
19
82-8
3
19
85-8
6
19
88-8
9
19
91-9
2
19
94-9
5
19
97-9
8
20
00-0
1
20
03-0
4
20
06-0
7
20
09-1
0
20
12-1
3
Go
od
s m
ove
d (
bill
ion
tkm
) Road
Rail
Coastal shipping
Air
0
60
120
180
240
19
90-9
1
19
92-9
3
19
94-9
5
19
96-9
7
19
98-9
9
20
00-0
1
20
02-0
3
20
04-0
5
20
06-0
7
20
08-0
9
20
10-1
1
20
12-1
3
Go
od
s m
ove
d (
bill
ion
to
nn
e km
s) Total
Non-bulk
Bulk
0
200
400
600
800
19
70-7
1
19
73-7
4
19
76-7
7
19
79-8
0
19
82-8
3
19
85-8
6
19
88-8
9
19
91-9
2
19
94-9
5
19
97-9
8
20
00-0
1
20
03-0
4
20
06-0
7
20
09-1
0
20
12-1
3
Pas
sen
ger
(bill
ion
km
s) /
Fre
igh
t (B
illio
n
tkm
)
Total freight (billion tkm)
Total passenger (billion kms)
0
7,500
15,000
22,500
30,000
19
70-7
1
19
73-7
4
19
76-7
7
19
79-8
0
19
82-8
3
19
85-8
6
19
88-8
9
19
91-9
2
19
94-9
5
19
97-9
8
20
00-0
1
20
03-0
4
20
06-0
7
20
09-1
0
20
12-1
3
Pas
sen
ger
kms/
Frei
ght
ton
ne
kms
Freight per capita (tonne kms)
Passenger per capita (kms)
75
7
7
7
Figure 20 : Sh ipp ing cargo loaded ( includ ing
exports ) and cargo d ischarged ( inc luding
imports ) at Austra l i an ports
F igure 21 : Containers exchanged, se lected
Austral i an ports , 1993 -94 to 2013 -14
S ou r c e : B I TR E ( 20 15 ) , Y e a r bo ok 20 1 5 : A u s t r a l i a n
I n f r a s t r u c t u r e S t a t i s t i c s , a b l e 7 . 4 a , T a b l e 7 . 4 b a nd A B S
Cu s to m i z e d d a t a .
S ou r c e : B I TR E ( 20 15 ) , Y e a r bo ok 20 1 5 : A u s t r a l i a n
I n f r a s t r u c t u r e S t a t i s t i c s , T a b l e s T 7 . 7 , B I T RE ,
Ca n be r r a .
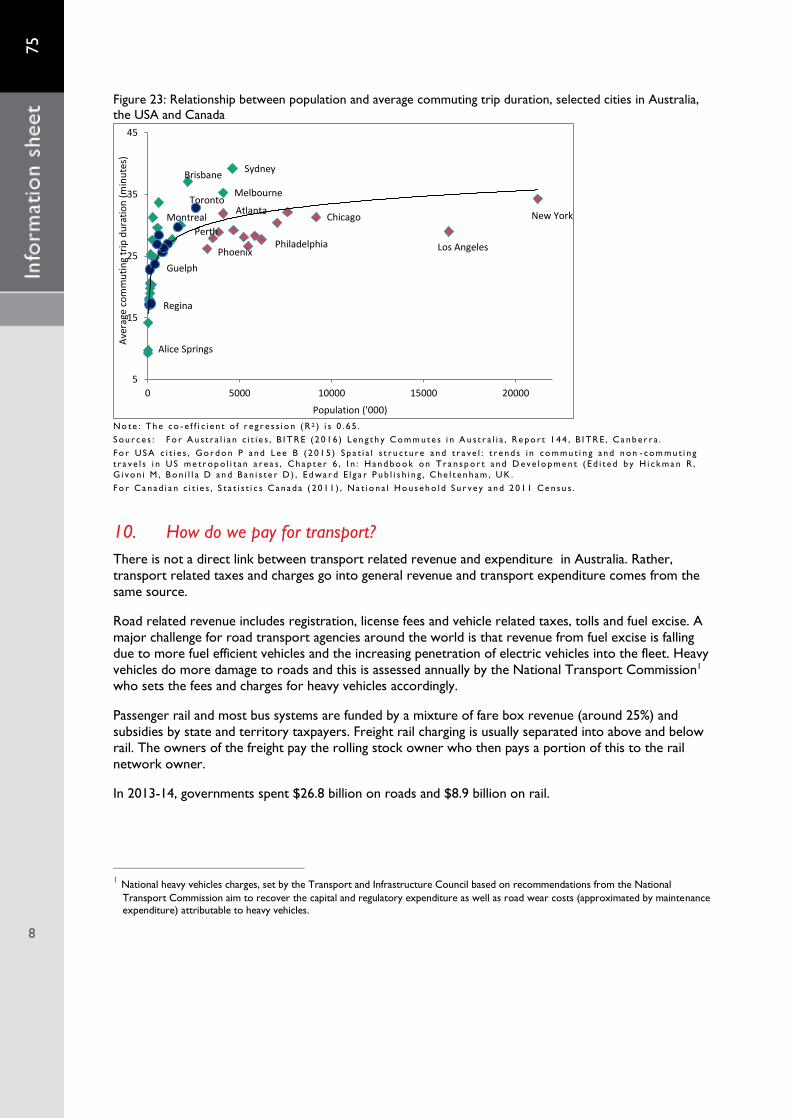
9. Are we commuting longer?
As cities increase in size, commuting times rise until they reach about 35 minute for a one way commute -
the Marchetti’s constant and then stabilize. Australian cities generally have longer average commuting times than US or Canadian cities of similar sizes.
Figure 22: Average duration of journey to work and average total daily travel time, 2012-13, Sydney Greater
Average duration of journey to work Average total daily travel time
75
8
8
8
Figure 23: Relationship between population and average commuting trip duration, selected cities in Australia,
the USA and Canada
No te : The co - e f f i c i e n t o f r e g r e s s i o n ( R 2 ) i s 0 . 6 5 .
S ou r c e s : Fo r A u s t r a l i a n c i t i e s , B I T RE ( 2 0 16 ) Le n g t h y C om m ut e s i n A u s t r a l i a , Re po r t 1 44 , B I TR E , Ca nb e r r a .
Fo r US A c i t i e s , Go rd o n P a nd Le e B ( 2 01 5 ) S p a t i a l s t r u c t u r e a nd t r a ve l : t r e nd s i n co m m u t i n g a nd n on - com m u t i n g
t r a v e l s i n US m e t r op o l i t a n a r e a s , C ha p t e r 6 , I n : Ha nd bo ok on T r a n sp o r t a nd D e v e l o pm e n t ( E d i t e d b y H i ck m a n R ,
G i vo n i M , B o n i l l a D a n d B a n i s t e r D ) , E d w a r d E l g a r P ub l i s h i n g , Che l t e n h a m , U K .
Fo r Ca na d i a n c i t i e s , S t a t i s t i c s C a n a d a ( 20 11 ) , Na t i o n a l Ho u s e h o l d S u r ve y a nd 2 01 1 Ce n s u s .
10. How do we pay for transport?
There is not a direct link between transport related revenue and expenditure in Australia. Rather,
transport related taxes and charges go into general revenue and transport expenditure comes from the
same source.
Road related revenue includes registration, license fees and vehicle related taxes, tolls and fuel excise. A
major challenge for road transport agencies around the world is that revenue from fuel excise is falling due to more fuel efficient vehicles and the increasing penetration of electric vehicles into the fleet. Heavy
vehicles do more damage to roads and this is assessed annually by the National Transport Commission1 who sets the fees and charges for heavy vehicles accordingly.
Passenger rail and most bus systems are funded by a mixture of fare box revenue (around 25%) and
subsidies by state and territory taxpayers. Freight rail charging is usually separated into above and below rail. The owners of the freight pay the rolling stock owner who then pays a portion of this to the rail
network owner.
In 2013-14, governments spent $26.8 billion on roads and $8.9 billion on rail.
1 National heavy vehicles charges, set by the Transport and Infrastructure Council based on recommendations from the National
Transport Commission aim to recover the capital and regulatory expenditure as well as road wear costs (approximated by maintenance expenditure) attributable to heavy vehicles.
5
15
25
35
45
0 5000 10000 15000 20000
Ave
rage
co
mm
uti
ng
trip
du
rati
on
(m
inu
tes)
Population ('000)
New York
Los AngelesPhoenix
Perth
Chicago
Philadelphia
Atlanta
Brisbane
Melbourne
Sydney
Toronto
Montreal
Guelph
Alice Springs
Regina
75
9
9
9
Figure 24: Selected road-related taxes and charges
Figure 25: Road-related expenditure by level of
government
No te : Co n s t a n t 20 13 - 1 4 p r i c e s , a d j u s t e d b y A B S Co n su m e r
P r i c e I n d e x ) .
S ou r c e : B I TR E ( 20 15 ) , Ye a rb oo k : A u s t r a l i a n
I n f r a s t r u c t u r e S t a t i s t i c s , D r a w n f ro m Ta b l e T 1 . 4 , B I TR E ,
Ca n be r r a .
No te : Co n s t a n t 20 13 - 14 p r i c e s , a d j u s t e d b y A B S
Co n s um e r P r i c e I n d e x ) .
S ou r c e : B I TR E ( 20 15 ) , Ye a r bo ok : A u s t r a l i a n
I n f r a s t r u c t u r e S t a t i s t i c s , D r a w n f r om Ta b l e s T 1 . 2 e
a nd T 1 . 4 , B I TR E , C a n be r r a .
11. Is transport becoming more energy efficient and causing less emissions?
Yes. If you drove an average car out of the showroom in 1979 you would have expected its fuel
consumption to be around 10L/100km. Today your car would be nearly 50 per cent more powerful than the 1979 model but could expect a little over 7L/100km. Fuel consumption trends are strongly
downward. Transport is emitting less greenhouse gases per kilometre but total transport demand is rising faster. This means that emissions are rising by around one per cent per year. Since the turn of the
last century, nitrous oxide and methane levels have been falling.
Figure 26: Rated National Average Fuel
Consumption by Australian new passenger
vehicles, by type of vehicle, 1979–2013
Figure 27: Total road transport direct greenhouse
gas (carbon dioxide equivalent) emissions, 1989-90
to 2013-14, Australia
S ou r c e : B I TR E ( 20 15 ) , Ne w p a s s e n g e r ve h i c l e f u e l
co n su m p t i o n t r e nd s , 1 9 79 t o 2 01 3 , I n f o rm a t i on S he e t
66 , R e d r a w n f ro m F i g u r e 2b , B I TR E , Ca nbe r r a .
S ou r c e : B I TR E ( 20 15 ) , Y e a r b ook 2 01 5 : A u s t r a l i a n
I n f r a s t r u c t u r e S t a t i s t i c s , T a b l e T 9 . 5 , B I TR E . C a n be r r a .
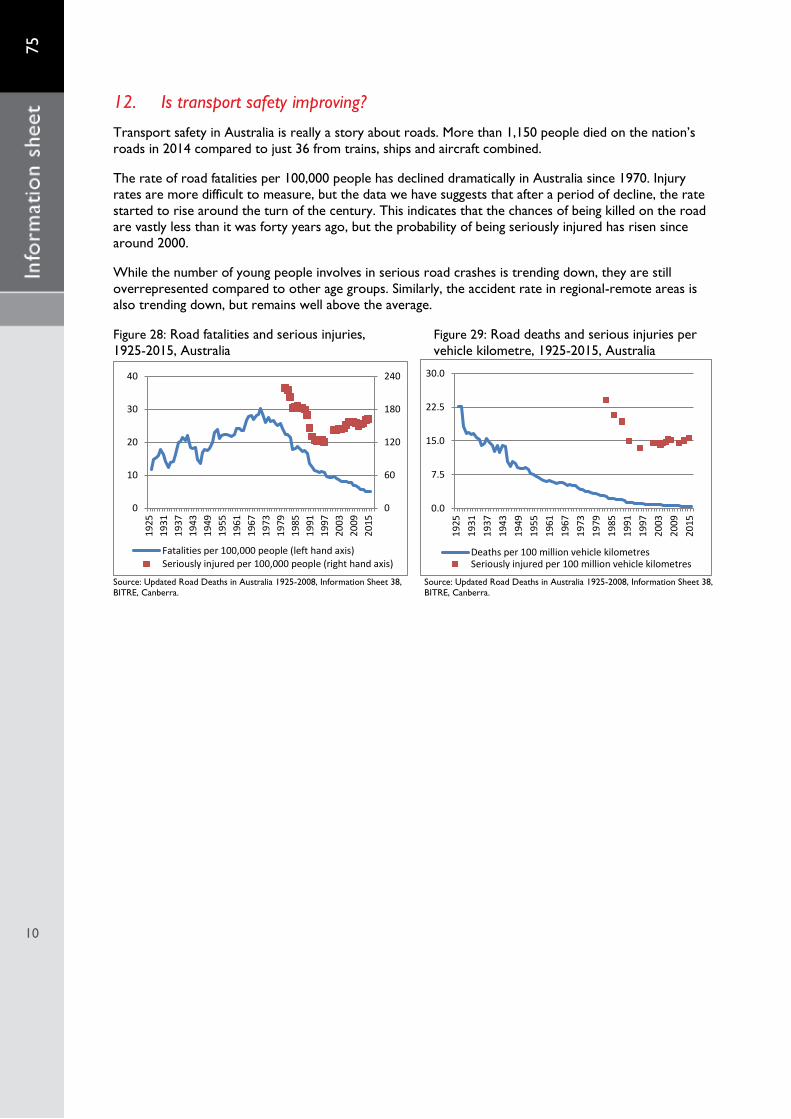
Transport safety in Australia is really a story about roads. More than 1,150 people died on the nation’s
roads in 2014 compared to just 36 from trains, ships and aircraft combined.
The rate of road fatalities per 100,000 people has declined dramatically in Australia since 1970. Injury rates are more difficult to measure, but the data we have suggests that after a period of decline, the rate
started to rise around the turn of the century. This indicates that the chances of being killed on the road are vastly less than it was forty years ago, but the probability of being seriously injured has risen since
around 2000.
While the number of young people involves in serious road crashes is trending down, they are still
overrepresented compared to other age groups. Similarly, the accident rate in regional-remote areas is also trending down, but remains well above the average.
Figure 28: Road fatalities and serious injuries,
1925-2015, Australia
Figure 29: Road deaths and serious injuries per
vehicle kilometre, 1925-2015, Australia
Source: Updated Road Deaths in Australia 1925-2008, Information Sheet 38,
BITRE, Canberra.
Source: Updated Road Deaths in Australia 1925-2008, Information Sheet 38,
BITRE, Canberra.
0
60
120
180
240
0
10
20
30
40
19
25
19
31
19
37
19
43
19
49
19
55
19
61
19
67
19
73
19
79
19
85
19
91
19
97
20
03
20
09
20
15
Fatalities per 100,000 people (left hand axis)Seriously injured per 100,000 people (right hand axis)
0.0
7.5
15.0
22.5
30.0
19
25
19
31
19
37
19
43
19
49
19
55
19
61
19
67
19
73
19
79
19
85
19
91
19
97
20
03
20
09
20
15
Deaths per 100 million vehicle kilometresSeriously injured per 100 million vehicle kilometres
75
11
11
11
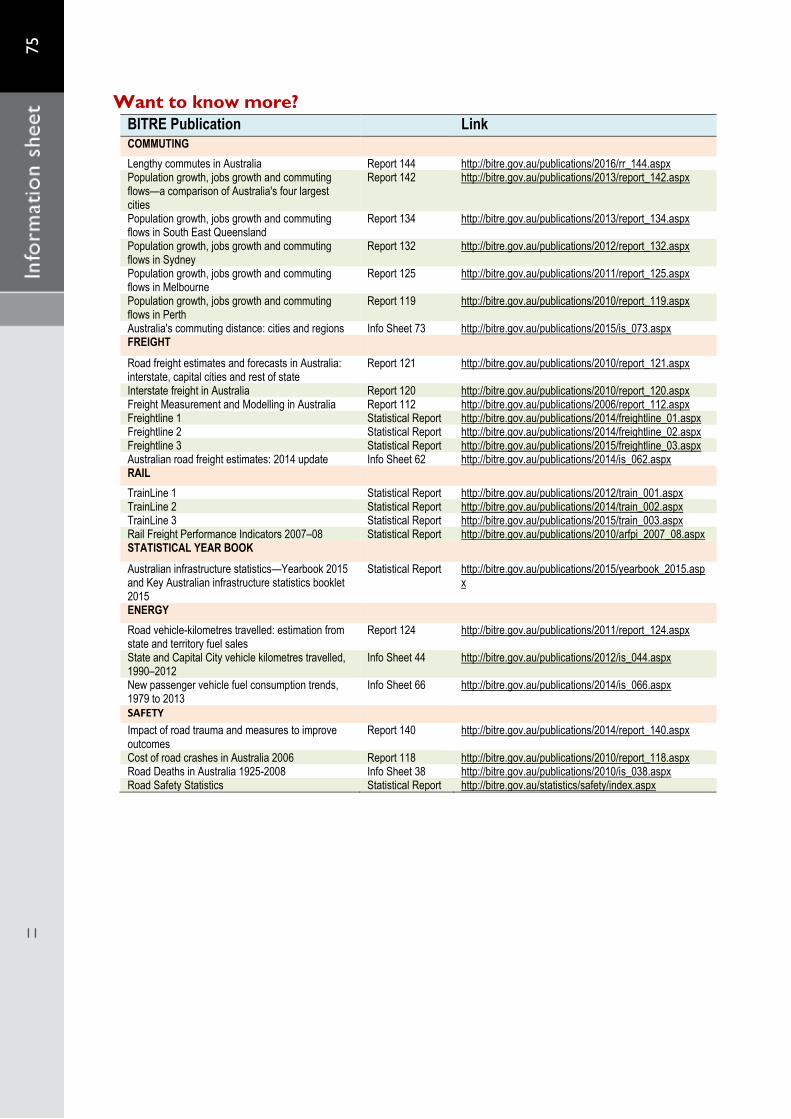
Want to know more? BITRE Publication Link COMMUTING
Lengthy commutes in Australia Report 144 http://bitre.gov.au/publications/2016/rr_144.aspx
Population growth, jobs growth and commuting flows—a comparison of Australia's four largest cities
Cost of road crashes in Australia 2006 Report 118 http://bitre.gov.au/publications/2010/report_118.aspx
Road Deaths in Australia 1925-2008 Info Sheet 38 http://bitre.gov.au/publications/2010/is_038.aspx Road Safety Statistics Statistical Report http://bitre.gov.au/statistics/safety/index.aspx