A Dynamic Oligopoly Game of the US Airline Industry: Estimation and Policy Experiments Victor Aguirregabiria (University of Toronto) Chun-Yu Ho (Georgia Institute of Technology) University of Maryland March 2, 2010 Aguirregabiria-Ho (University of Maryland) Airlines Network Competition March 2, 2010 1 / 29
Transcript
A Dynamic Oligopoly Game of the US Airline Industry:Estimation and Policy Experiments
Victor Aguirregabiria (University of Toronto)Chun-Yu Ho (Georgia Institute of Technology)
University of Maryland
March 2, 2010
Aguirregabiria-Ho (University of Maryland) Airlines Network Competition March 2, 2010 1 / 29
Motivation (1)
This paper presents a dynamic game of airlines�networkcompetition that can be estimated using publicly available data, andthat can be used to study di¤erent aspects of competition in theairline industry.
The model endogenizes airlines�networks, and the dynamics of thesenetworks. Prices and quantities for each airline-route are alsoendogenous in the model.
It extends previous work by Hendricks et al (1995, 1999) on airlinenetworks, and previous literature on structural models of the airlineindustry: Berry (1990 and 1992), Berry, Carnall and Spiller (2006),Ciliberto and Tamer (2009).
Aguirregabiria-Ho (University of Maryland) Airlines Network Competition March 2, 2010 2 / 29
Motivation (2)
We use the model to study empirically the role of strategic entrydeterrence as a factor to explain why many companies in the USairline industry operate using hub-and-spoke networks.
The model incorporates di¤erent hypotheses that have beensuggested in the literature to explain hub-and-spoke networks.
We estimate the model and use counterfactual experiments to obtainthe contribution of di¤erent factors (and in particular of entrydeterrence) to explain hub-and-spoke networks.
Aguirregabiria-Ho (University of Maryland) Airlines Network Competition March 2, 2010 3 / 29
Hub-and-Spoke Networks
What is a hub-and-spoke network?
Since the deregulation of the US airline industry in 1978, most airlineshave adopted network structures that concentrate their operation in afew airports.
Southwest Airlines is an important exception: Point-to-Point network.
Strategic Entry Deterrence: Hendricks, Piccione and Tan (1997).
Aguirregabiria-Ho (University of Maryland) Airlines Network Competition March 2, 2010 4 / 29
Hub-and-Spoke Networks
HUB
A
B
C
E
D
Aguirregabiria-Ho (University of Maryland) Airlines Network Competition March 2, 2010 5 / 29
Southwest Airlines. Route Map in 1980
Aguirregabiria-Ho (University of Maryland) Airlines Network Competition March 2, 2010 6 / 29
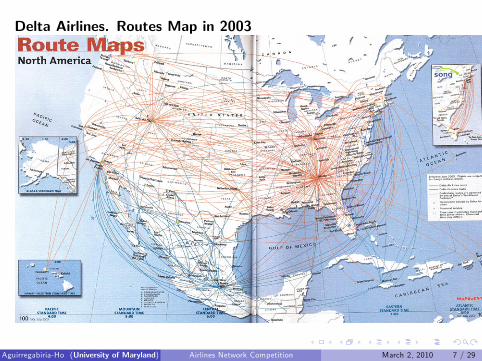
Delta Airlines. Routes Map in 2003
Aguirregabiria-Ho (University of Maryland) Airlines Network Competition March 2, 2010 7 / 29
Data
Airline Origin and Destination Survey (DB1B) collected by the O¢ ceof Airline Information of the BTS.
Period 2004-Q1 to 2004-Q4.
C = 55 largest metropolitan areas. N = 22 airlines.
City Pairs: M = (55 � 54)/2 = 1, 485.
Aguirregabiria-Ho (University of Maryland) Airlines Network Competition March 2, 2010 8 / 29
Airlines: Passengers and Markets2004
Airline (Code) # Passengers # City-Pairs
(in thousands) (maximum = 1,485)
1. Southwest (WN) 25,026 373
2. American (AA)(3) 20,064 233
3. United (UA)(4) 15,851 199
4. Delta (DL)(5) 14,402 198
5. Continental (CO)(6) 10,084 142
6. Northwest (NW)(7) 9,517 183
7. US Airways (US) 7,515 150
8. America West (HP)(8) 6,745 113
9. Alaska (AS) 3,886 32
10. ATA (TZ) 2,608 33
11. JetBlue (B6) 2,458 22
Aguirregabiria-Ho (University of Maryland) Airlines Network Competition March 2, 2010 9 / 29
Airlines, their Hubs, and Hub-Spoke Ratios
Airline (Code) 1st largest hub Hub-Spoke 2nd largest hub Hub-Spoke
Ratio (%) Ratio (%)
One Hub Two Hubs
Southwest Las Vegas (35) 9.3 Phoenix (33) 18.2
American Dallas (52) 22.3 Chicago (46) 42.0
United Chicago (50) 25.1 Denver (41) 45.7
Delta Atlanta (53) 26.7 Cincinnati (42) 48.0
Continental Houston (52) 36.6 New York (45) 68.3
Northwest Minneapolis (47) 25.6 Detroit (43) 49.2
US Airways Charlotte (35) 23.3 Philadelphia (33) 45.3
America West Phoenix (40) 35.4 Las Vegas (28) 60.2
Alaska Seattle (18) 56.2 Portland (10) 87.5
ATA Chicago (16) 48.4 Indianapolis (6) 66.6
JetBlue New York (13) 59.0 Long Beach (4) 77.3
Aguirregabiria-Ho (University of Maryland) Airlines Network Competition March 2, 2010 10 / 29
Cumulative Hub-and-Spoke Ratios
Aguirregabiria-Ho (University of Maryland) Airlines Network Competition March 2, 2010 11 / 29
Distribution of Markets by Number of IncumbentsMarkets with 0 airlines 35.44%
Markets with 1 airline 29.06%
Markets with 2 airlines 17.44%
Markets with 3 airlines 9.84%
Markets with 4 or more airlines 8.22%
Aguirregabiria-Ho (University of Maryland) Airlines Network Competition March 2, 2010 12 / 29
Number of Monopoly Markets by Airline
Southwest 157
Northwest 69
Delta 56
American 28
Continental 24
United 17
Aguirregabiria-Ho (University of Maryland) Airlines Network Competition March 2, 2010 13 / 29
Entry and Exit
All Quarters
Distribution of Markets by Number of New Entrants
Markets with 0 Entrants 84.66%
Markets with 1 Entrant 13.37%
Markets with 2 Entrants 1.69%
Markets with 3 Entrants 0.27%
Distribution of Markets by Number of Exits
Markets with 0 Exits 86.51%
Markets with 1 Exit 11.82%
Markets with 2 Exits 1.35%
Markets with more 3 or 4 Exits 0.32%
Aguirregabiria-Ho (University of Maryland) Airlines Network Competition March 2, 2010 14 / 29
Model
N airlines and C cities, exogenously given.
Given the C cities, there are M � C (C � 1)/2 non-directionalcity-pairs (or markets).
For each city-pair, an airline decides whether to operate (or not)direct �ights.
A route (or path) is a directional round-trip between 2 cities. Aroute may or may not have stops.
A route-airline is a product, and there is a demand for eachroute-airline product.
Airlines choose prices for each route they provide.
Aguirregabiria-Ho (University of Maryland) Airlines Network Competition March 2, 2010 15 / 29
Model
We index city-pairs by m, airlines by i , and time (quarters) by t.
ximt 2 f0, 1g is a binary indicator for the event "airline i operatesnon-stop �ights in city-pair m"
xit � fximt : m = 1, 2, ...,Mg is the network of airline i at period t.
The network xit describes all the routes (products) that the airlineprovides, and whether they are non-stop or stop routes.
Industry network: xt � fxit : i = 1, 2, ...,Ng
Aguirregabiria-Ho (University of Maryland) Airlines Network Competition March 2, 2010 16 / 29
Model
Every period, active airlines in a route compete in prices
Price competition determines variable pro�ts for each airline.
Every period (quarter), each airline decides its network for nextperiod. There is time-to-build.
We represent this decision as ait � faimt : m = 1, 2, ...,Mg.
Aguirregabiria-Ho (University of Maryland) Airlines Network Competition March 2, 2010 17 / 29
Model
The airline�s total pro�t function is:
Πit = ∑r2L(xit )
(pirt � cirt )qirt �M
∑m=1
aimt (FCimt + εimt + (1� ximt ) ECimt )
(pirt � cirt )qirt = Variable pro�t in route r .
FCimt and ECimt are the common knowledge components of �xedcost and entry cost
εimt shock in �xed cost that is private information of this airline andare independently and identically distributed over airlines, markets,and time.
Aguirregabiria-Ho (University of Maryland) Airlines Network Competition March 2, 2010 18 / 29
Model
An important feature of the model is that demand, variable costs,�xed costs, and entry costs depend on the scale of operation (numberof connections) of the airline in the origin and destination airports ofthe city-pair.
This implies that markets are interconnected through these hub-sizee¤ects. Entry-exit in a market has implications of pro�ts in othermarkets.
Aguirregabiria-Ho (University of Maryland) Airlines Network Competition March 2, 2010 19 / 29
Model
Airlines maximize intertemporal pro�ts, are forward-looking, and takeinto account the implications of their entry-exit decisions on futurepro�ts and on the expected future reaction of competitors.
Airlines�strategies depend only on payo¤-relevant state variables, i.e.,Markov perfect equilibrium assumption.
An airline�s payo¤-relevant information at quarter t is fxt , zt , εitg.
Let σ � fσi (xt , zt , εit ) : i = 1, 2, ...,Ng be a set of strategyfunctions, one for each airline.
A MPE is a set of strategy functions such that each airline�s strategymaximizes the value of the airline for each possible state and takingas given other airlines�strategies.
Aguirregabiria-Ho (University of Maryland) Airlines Network Competition March 2, 2010 20 / 29
Dynamic Game: Reducing the dimensionality
Given the number of cities and airlines in our empirical analysis, thenumber of possible industry networks is jX j = 2NM ' 1010,000.
We consider several simplifying assumptions that reduce thedimension of the dynamic game and make its solution and estimationmanageable.
Suppose that each airline has M local managers, one for each marketor city-pair.
A local manager decides whether to operate or not non-stop �ights inhis local-market: i.e., he chooses aimt .
Aguirregabiria-Ho (University of Maryland) Airlines Network Competition March 2, 2010 21 / 29
Dynamic Game: Reducing the dimensionality
Let Rimt be the sum of airline i�s variable pro�ts over all the routesthat include city-pair m as a segment.
ASSUMPTION NET-1: Local managers maximize the expected anddiscounted value of
Based on estimation results in Aguirregabiria and Ho (2009)
Aguirregabiria-Ho (University of Maryland) Airlines Network Competition March 2, 2010 27 / 29
Summary of empirical results
1 Hub-size e¤ects on demand, variable costs and �xed operatingcosts are signi�cant but can explain very little of the propensityto hub-spoke networks.
2 Hub-size e¤ects on Sunk Entry Costs are large. This is the mostimportant factor to explain hub-spoke networks.
3 Strategic factors: hub-spoke network as a strategy to deterentry is the second most important factor for some of the largestcarriers (Northwest and Delta).
4 Sunk Entry Costs are positively with Entry Deterrence. Airlineswith larger entry costs tend to have higher propensity to usehub-and-spoke networks to deter entry of competitors.
Aguirregabiria-Ho (University of Maryland) Airlines Network Competition March 2, 2010 28 / 29
Ongoing Research
Though the estimated provides a very good �t to the Quaterly datafor 2004, it has limitations to explain some important features for theevolution of airline networks for the period 1990-2008.
For instance, some airlines experienced very abrupt changes in theirnetwork structure: e.g., closings of large hubs, almost �instantaneousbirth�of new hubs.
Explaining the transition of some airlines from almost purehub-and-spoke networks to point-to-point networks is also challenging.
Economic interpretation of the negative e¤ect of hub-size on entrycosts: is it due to technological reasons, OR it has to do withcontracts between airports and airlines ???
Aguirregabiria-Ho (University of Maryland) Airlines Network Competition March 2, 2010 29 / 29