40
A Feasibility Study on the Geophysical Response to Nanoparticles in the Subsurface APM 274 R E S E A R C H A N D D E V E L O P M E N T
A Feasibility Study on the Geophysical Response to
Nanoparticles in the Subsurface
APM 274
R E S E A R C H A N D D E V E L O P M E N T

EPA/600/R-10/105
September 2010 www.epa.gov
A Feasibility Study on the
Geophysical Response to Nanoparticles in
the Subsurface
APM 274 D. Dale Werkema Jr.1, Danney Glaser1,
Ryan Joyce2, Dalton Hawkins2, Estella Atekwana2 and Gamal Z. Abdel Aal3
1U.S. Environmental Protection Agency National Exposure Research Laboratory
Environmental Sciences Division Characterization and Monitoring Branch
944 E. Harmon Ave. Las Vegas, NV 89119
2Boone Pickens School of Geology
Oklahoma State University Stillwater, OK 74078
3Geology Department, Faculty of Science
Assiut University Assiut 71516, Egypt
Although this work was reviewed by EPA and approved for publication, it may not necessarily reflect official Agency policy. Mention of trade names and commercial products does not constitute endorsement or recommendation for use.
U.S. Environmental Protection Agency Office of Research and Development
Washington, DC 20460

2
Executive Summary
The research presented herein aims to determine if a spectral induced polarization (SIP) response exists due to nanoparticles in a saturated sand matrix. If a SIP response is realized in such an experimental setting, then it is feasible that SIP may be capable of delineating nanoparticles in the subsurface.
The following five nanoparticles were studied: zinc oxide (nZnO) cerium dioxide (nCeO2), titanium dioxide (nTiO2), zero valent iron (nZVI), and silver (nAg); in two separate experiments. In Experiment 1, the SIP detection threshold concentrations of nano-oxides and nano-metals is presented. The results
,
for various show the nano-
metals, especially nAg, revealed the largest SIP response in the imaginary conductivity component. The nano-oxides showed very little SIP response. Therefore, Experiment 2, investigated the relationship between the SIP breakthrough and the geochemical breakthrough of nAg in flow-through columns. The chemical and SIP break through curves (BTCs ) showed very close qualitative similarity. The BTCs revealed that lower concentrations of nAg were transported more readily than higher concentrations, which also revealed the SIP discrepancy between these concentrations. Overall, the results from these feasibility experiments suggest that SIP methods hold promise in the mapping and monitoring of nano-metals in unconsolidated sand matrices if the concentrations of the nano-metals are near the detectability level. Our results suggest that electronic conductance appears to be the dominant conductivity mechanism for the SIP measurements. Additional experiments are in progress to address various solution chemistries, heterogeneous geologies, and other complications, which inevitably occur at field sites and the sensitivity of other geophysical methods to nanoparticles.

3
1.0 Introduction
1.1 Objectives 1.2 Report Organization
................................................................
................................................................
................................................................
................................................................
......................
4
.......................................................................................................................78
2.0 SIP Measurements of Nanoparticle3.0 Experiment 1: SIP Measurements of Select Anthropogenic Nanoparticles in a Uniform Sand Matrix
.................................................................. 8
3.1 Nanoparticles Tested3.2 Experiment 1 Methods
................................
Sand Mixtures
3.2.1 Experiment 1 Measureme
................................................................
-
..............................................................
................................nt Columns
................................................................
................................................................
...................................
111214
........................................................................... 14
3.2.2 Experiment 1A: SIP Response versus Nanoparticle to Sand Weight Ratio3.2.3 Experiment 1B: SIP Response versus Ionic Strength
3.3 Experiment 1 Results
.... 15
3.3.1 Experiment 1A Results: SIP Response versus NSR3.3.2 Experiment 1B Results: SIP Response versus Ionic Strength
................................................................................................................................
................................
1716
................................................ 17
3.4 Experiment 1 Discussion:3.5 Experiment 1 Conclusions
................................................................
................................................................
.............................................................
.......... 2220
......................................... 25
.................................................................................................................... 2727
4.0 Experiment 2: Sensitivity of SIP to the Mobility of nAg at Three Concentrations
4.1 Experiment 2 Methods 4.2 Experiment 2 Results and Discussion4.3 Experiment 2 Conclusions
5.0 Overall Conclusions................................
................................................................................... 31
6.0 Acknowledgements7.0 References
................................................................
................................................................
................................................................
.........................................................
.........3232
.......................................................... 33
............................................................................................................................................ 34
4
1.0 Introduction
The growth in research, development, and production of nano-scale materials has
been dramatically increased over the past few decades. This growth has resulted in an
estimated 900 nanotechnology enabled products, both consumer and commercial,
utilizing the unique properties of nanomaterials (Maynard, 2006). Nanomaterials are
used in the global marketplace. The behavior of these materials in the environment may
constitute a new class of non-biodegradable pollutants of which environmental scientists
have very little understanding. Nanotechnology is defined by the U.S. Environmental
Protection Agency as:
“…research and technology development at the atomic, molecular, or
macromolecular levels using a length scale of approximately one to one hundred
nanometers in any dimension: the creation and use of structures, devices, and
systems that have novel properties and functions because of their small size: and
the ability to control or manipulate matter on an atomic scale.” (U.S.EPA, 2008)
Such an increase in the use of these materials requires an understanding of their direct or
indirect implications to the environment.
Generally, at the nano-scale quantum mechanical effects predominate and surface
area per mass is increased, resulting in unique physical, chemical, electrical, optical,
mechanical, and magnetic properties which are not observed at scales greater than a
micrometer (U.S.EPA, 2008). These unique properties of nanoparticles broaden the
applications of nanomaterials. Thus, the use of nanotechnology for consumer and
industrial applications, as well as the environmental characterization of unintentionally
released components of this technology, is expected to increase significantly in the future

5
(U.S.EPA, 2008). Anthropogenic sources of nanoparticles are augmented by many
natural systems through weathering and microbial activity. Weathering of natural metal
deposits has been shown to produce nano-scale metal oxides (Zanker et al., 2006), while
increased mining activity can expose additional ore to further weathering, thereby
increasing the amount of “naturally occurring” nanoparticles. The microbial degradation
of uranium deposits has been shown to produce nano-scale uraninite particles, which has
potential applications in the field of bioremediation (Bargar et al., 2008). Alternatively,
there is evidence that titanium dioxide nanoparticles can negatively affect
microorganisms as individual particles and also as aggregates (Battin et al., 2009). As
nanomaterials proliferate in consumer and industrial applications the bioavailability of
potentially harmful nanoparticles increases.
Consequently, the production of significant quantities of nanomaterials and
nanoparticles will inevitably result in the introduction of these materials and their
breakdown products to the environment. The implications for both environmental and
human health are extensive. Currently there are many unanswered questions related to the
release of nanomaterials, their fate, transport, and transformation in the environment, and
their potential toxic effects (Grassian, 2008; Sellers, 2009; Wiesner and Bottero, 2007).
Due to their desirable chemical, physical, electronic, and optical properties, metal
nanoparticles have attracted much attention and demonstrated a wide range of
applications (Kamat, 2002; Oliveira et al., 2005). Among metal nanoparticles, silver
nanoparticles possess many superior properties, such as increased electrical conductivity,
antimicrobial activity, and catalytic effect (Kabashin et al., 2003).
6
Currently, the processes that control the fate and transport of nanoparticles in the
environment are relatively unknown, as are the probable physical and chemical
alterations that they are likely to undergo under varying environmental conditions (El
Badawy et al., 2010; Lecoanet et al., 2004a). Additional research is necessary to fully
understand the release mechanisms, fate and transport, interactions with subsurface
microbial populations, reactivity and transformation in the environment, as well as the
potential toxic effects of nanoparticles (Grassian, 2008; Sellers, 2009; Wiesner and
Bottero, 2007).
Ongoing research continues in an effort to identify, characterize, and monitor
nanoparticles in the subsurface; however, it is limited due to the challenges of sample
collection and detectability in the environment. This problem is compounded by the fact
that the subsurface transport potential of nanoparticles can depend on various parameters,
including particle size, aggregation of particles, solution chemistry, soil composition,
concentration of nanoparticles within a given media, and groundwater flow patterns.
Understanding the fate and transport consequences of nanoparticles, and how they may
impact the environment, is the objective of new research initiatives (Clough, 2009;
U.S.EPA, 2008). As with any other class of contaminant, there is a need for techniques
that can rapidly and non-invasively detect the presence of ecologically harmful
nanoparticles in the subsurface and direct the focus of remediation efforts.
Environmental geophysical methods have been successfully developed to
characterize and monitor various subsurface contaminant and remediation activities
(Atekwana et al., 2004; Atekwana et al., 2006; Briggs et al., 2004; Glaser et al., 2005;
Mansoor and Slater, 2007; Minsley et al., 2004; Rucker and Fink, 2007; Werkema et al.,

7
2003). Fate and transport studies which are augmented through the use of non-invasive
or minimally invasive geophysical methods can monitor and characterize the subsurface
movement and distribution of target compounds either directly or indirectly (Rucker et
al., 2009; Slater and Glaser, 2003; Slater and Lesmes, 2002; Vukenkeng et al., 2009).
Geoelectrical methods encompass a sub-discipline of environmental geophysics,
which has been successful in achieving these monitoring and characterization results.
These methods include a host of induction techniques, such as ground penetrating radar
and electromagnetic induction, as well as direct or alternating current injected into the
subsurface via direct galvanic contact with the earth. All these electrical methods rely on
contrasting electrical properties between the natural subsurface materials and the
material, or target material, of interest. This electrical property contrast can be directly
due to the materials themselves or indirectly observed due to reactions or interactions
between the target material and the natural subsurface materials.
The following types of geoelectrical methods; spectral induced polarization (SIP),
induced polarization (IP), and/or complex conductivity (CC) all measure the bulk
resistivity (or its inverse conductivity) and the electrical signal phase shift of the received
signal within an experimental volume at multiple frequencies. In this report, the SIP
response to various anthropogenic nanoparticles in a well-sorted homogeneous saturated
sand laboratory column is investigated.
1.1 Objectives
The overarching purpose of nanoparticle environmental geophysics research
within the Characterization and Monitoring Branch is to investigate the use of

8
geophysical methods to delineate nanoparticles in the subsurface. A portion of this
objective is attempted with the research in this report, which aims to determine if a SIP
property contrast exists due to nanoparticles in a saturated sand matrix. If a SIP property
contrast exists in such an experimental setting, then it is feasible that SIP may be capable
of delineating nanoparticles in the subsurface.
1.2 Report Organization
The report is organized into two experiments. In the first experiment, labeled
Experiment 1, we report the results of a series of feasibility tests designed to determine
the SIP detection threshold for various concentrations of nano-oxides and nano-metals.
Briefly, the results show the nano-metals revealed the largest SIP response. Therefore,
the second experiment, labeled Experiment 2, reports on the qualitative correlation
between the SIP breakthrough and the geochemical breakthrough of nano-metals in flow-
through columns. The study is intended to show the feasibility of using SIP in nano-
metal fate and transport investigations.
2.0 SIP Measurements of Nanoparticle-Sand Mixtures
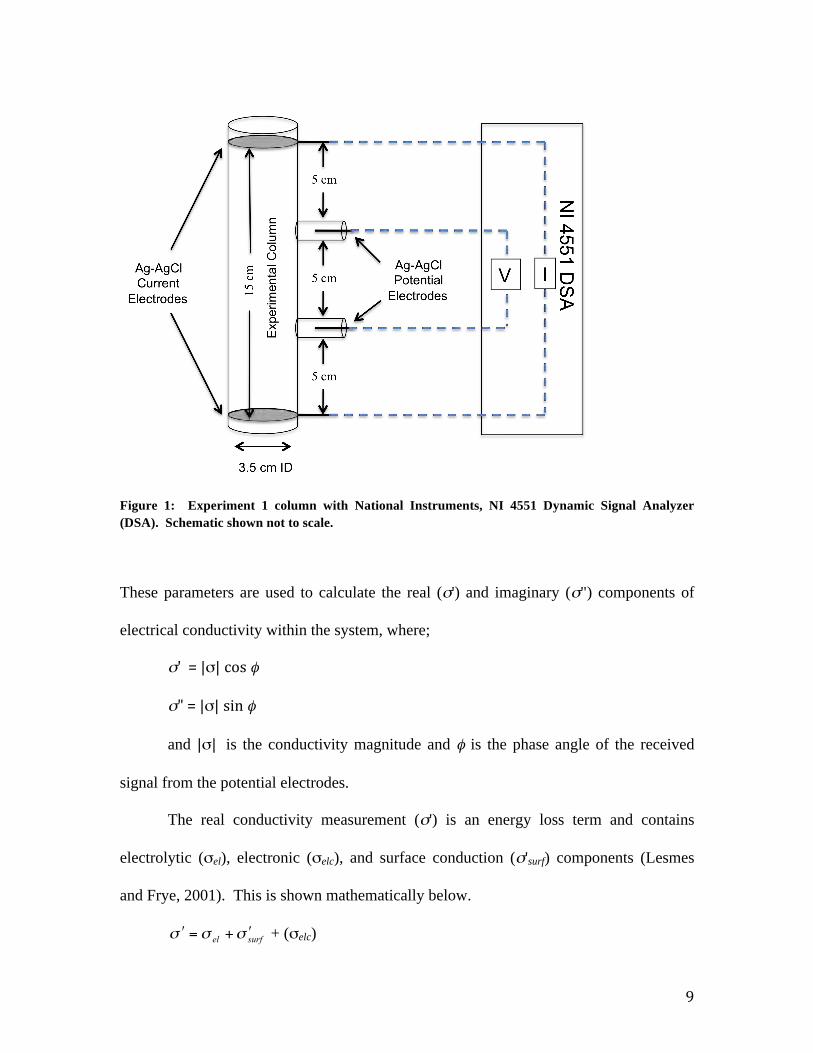
The SIP measurement system records the voltage magnitude and phase shift (φ)
over a desired frequency range (e.g., 1-1,000 Hz) by passing current between two
injection electrodes. The phase shift and resistivity or conductivity magnitudes are
measured between two potential electrodes located equidistant along the length of the
column (Figure 1).
9
namic Signal Figure 1: Experiment 1 column with National Instruments, NI 4551 Dy Analyzer (DSA). Schematic shown not to scale.
These parameters are used to calculate the real (σ') and imaginary (σ") components of
electrical conductivity within the system, where;
σ
σ
'=| | cos
and
"=|
σ
|
φ
σ sinφ
|σ| is the conductivity magnitude and φ is the phase angle of the received
signal from the potential electrodes.
The real conductivity measurement (σ') is an energy loss term and contains
electrolytic (σel), electronic (σelc), and surface conduction (σ'surf) components (Lesmes
and Frye, 2001). This is shown mathematically below.
+ (σelc)
10
The surface, or surficial, conduction term is controlled by variations in surface area,
surface charge density, and ionic mobility. Specifically, the σ'surf results from surface
conduction via the formation of an electrical double layer (EDL) at the grain-fluid
interface (Revil and Glover, 1998). Electronic conduction occurs between interconnected
metallic particles (Wu et al., 2007). In most cases, electrolytic conduction will account
for the real conductivity term while electronic and surficial conduction will account for a
relatively small portion of the measurement (Revil and Glover, 1998). The introduction
of metallic particles in the sand mixtures is expected to result in an increased electronic
conduction component; however, at the nano-scale this is uncertain. Alternatively, the
increased surface area should result in an increased surface conduction component, but
this too is uncertain at the nano-scale.
The imaginary conductivity term (σ") is an energy storage or polarization term
(Knight and Endres, 2005). At low frequencies (<1000 Hz) σ" results primarily from the
polarization of ions in the EDL at the mineral-fluid interface in the absence of metallic
minerals (Lesmes and Frye, 2001). This term is directly related to the σ'surf term in the
real conductivity measurement and is sensitive to changes in surface chemistry, surface
area, charge density, and ionic mobility (Lesmes and Frye, 2001; Slater and Glaser, 2003;
Slater and Lesmes, 2002). Given the direct relationship between imaginary conductivity
and phase shift, the data in this report is presented in terms of phase shift and real
conductivity.
The SIP measurements for the experiments were completed with similar
experimental designs and a National Instruments NI 4551 Dynamic Signal Analyzer at
the Geosciences Department at Oklahoma State University (Figure 1).
11
3.0 Experiment 1: SIP Measurements of Select Anthropogenic Nanoparticles in a Uniform Sand Matrix
While geochemical and hydrologic research on nanomaterials and nanoparticles is
well underway (Bouchard et al., 2009; Gilbert et al., 2009; Lecoanet et al., 2004b;
Lecoanet et al., 2004c; Liu et al., 2010; Sellers et al., 2008; Westerhoff et al., 2008;
Wiesner and Bottero, 2008), geophysical detection research associated with nanoparticles
or nanomaterials characterization in the environment is in its relative infancy. The effects
of biomineralized nano-scale metal sulfides as recorded in low frequency electrical
measurements were addressed by Williams et al (Williams et al., 2005). Significant
phase shifts were observed as a result of metal sulfide precipitation from the microbial
behavior. The research presented in Experiment 1 investigates the sensitivity of spectral
induced polarization measurements (0.1-1000 Hz) to the physicochemical properties of
columns containing some common nanoparticles (metals and the oxide of metals).
Measurements on nanoparticle-sand mixtures as a function of (A) nanoparticle
concentration with constant electrolyte chemistry, and (B) variable electrolyte and EDL
chemistry with a constant nanoparticle concentration were performed similar to the
experimental set up described in section 2 of Slater et al. (2006). Surface area is a
primary controlling factor on the SIP response, therefore, our hypothesis is that the small
size, and consequently, large surface area of the nanoparticles would produce a strong
induced polarization response.
12
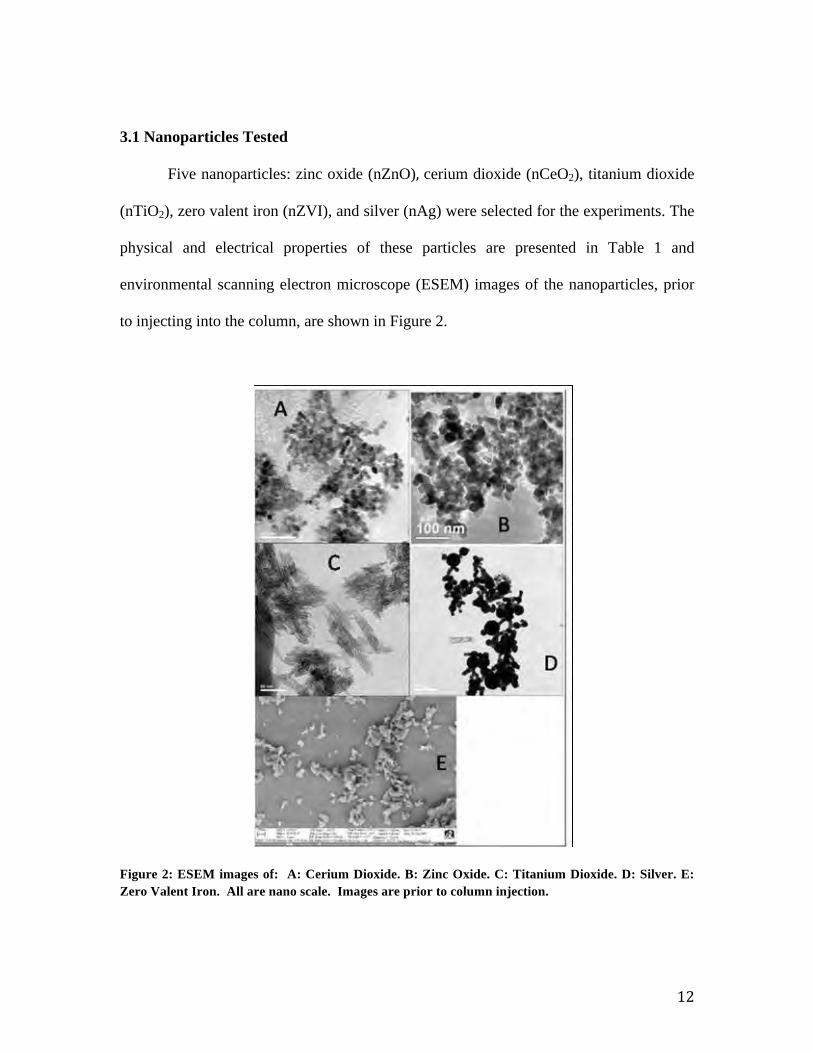
3.1 Nanoparticles Tested
Five nanoparticles: zinc oxide (nZnO) cerium dioxide (nCeO2), titanium dioxide
(nTiO2), zero valent iron (nZVI), and silver (nAg)
,
were selected for the experiments. The
physical and electrical properties of these particles are presented in Table 1 and
environmental scanning electron microscope (ESEM) images of the nanoparticles, prior
to injecting into the column, are shown in Figure 2.
m Dioxide. Figure 2: ESEM images of: A: Cerium Dioxide. B: Zinc Oxide. C: Titaniu D: Silver. E: Zero Valent Iron. All are nano scale. Images are prior to column injection.
13
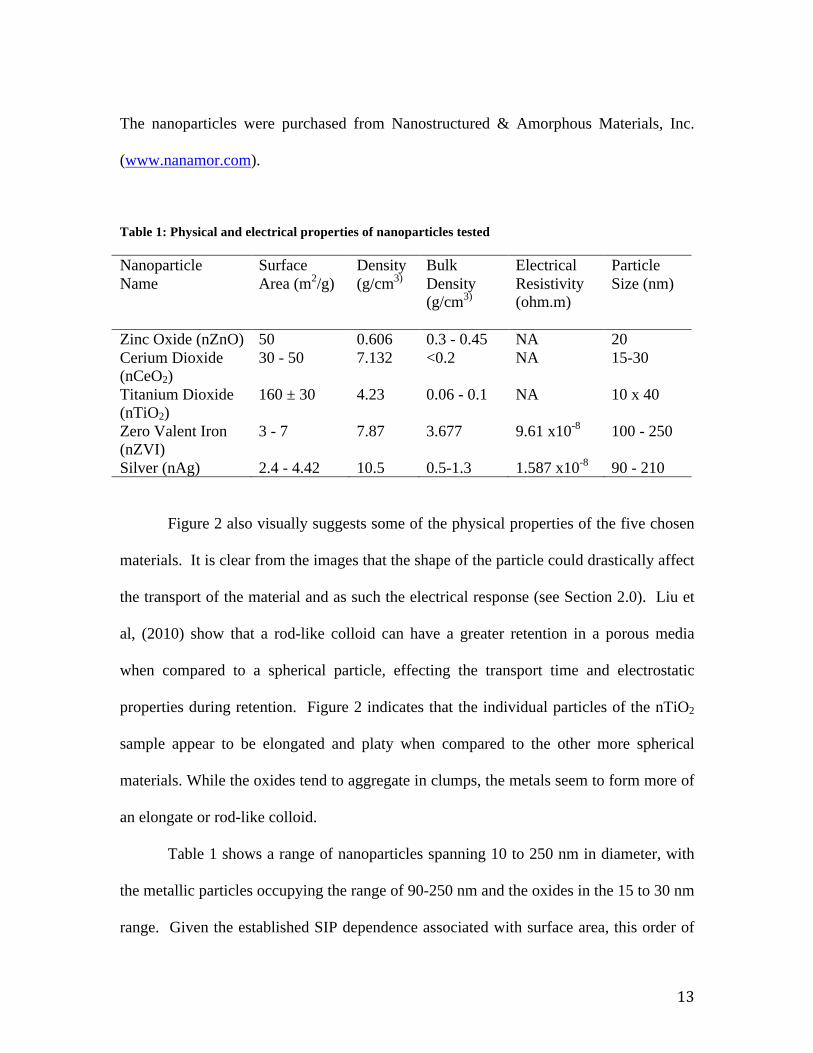
The nanoparticles were purchased from Nanostructured & Amorphous Materials, Inc.
(www.nanamor.com).
Table 1: Physical and electrical properties of nanoparticles tested
Nanoparticle Name
Surface Area (m2/g)
Density (g/cm3)
Bulk Density (g/cm3)
Electrical Resistivity (ohm.m)
Particle Size (nm)
Zinc Oxide (nZnO) 50 0.606 0.3 - 0.45 NA 20 Cerium Dioxide (nCeO2)
30 - 50 7.132 <0.2 NA 15-30
Titanium Dioxide (nTiO2)
160 ± 30 4.23 0.06 - 0.1 NA 10 x 40
Zero Valent Iron (nZVI)
3 - 7 7.87 3.677 9.61 x10⁻⁸ 100 - 250
Silver (nAg) 2.4 - 4.42 10.5 0.5-1.3 1.587 x10⁻⁸ 90 - 210
Figure 2 also visually suggests some of the physical properties of the five chosen
materials. It is clear from the images that the shape of the particle could drastically affect
the transport of the material and as such the electrical response (see Section 2.0). Liu et
al, (2010) show that a rod-like colloid can have a greater retention in a porous media
when compared to a spherical particle, effecting the transport time and electrostatic
properties during retention. Figure 2 indicates that the individual particles of the nTiO2
sample appear to be elongated and platy when compared to the other more spherical
materials. While the oxides tend to aggregate in clumps, the metals seem to form more of
an elongate or rod-like colloid.
Table 1 shows a range of nanoparticles spanning 10 to 250 nm in diameter, with
the metallic particles occupying the range of 90-250 nm and the oxides in the 15 to 30 nm
range. Given the established SIP dependence associated with surface area, this order of
14
magnitude difference was expected to result in a greater response for the oxides (Lesmes
and Frye, 2001; Slater and Glaser, 2003). However, given the electrical resistivities of
the materials, there should be a greater bulk conductivity response associated with the
metallic particles, assuming the metallic conduction supersedes the SIP response to
surface area.
The nanoparticles were chosen for their physical properties and also their
common use in industry. Previous authors have explored the electrical properties of
metallic and oxide nanoparticles (Kamat, 2002; Lok et al., 2007; Sellers et al., 2008);
however, none of the previous work suggests a focus on low frequency geoelectrical
measurements. While not principally focused on nanoparticles, Earle (Earle, 1941)
shows a negligible ionic conductivity within the EDLs of oxides suggesting that the
spectral measurements should not show a strong phase shift. We hypothesis the metallic
particles (nZVI, nAg) should exhibit the highest response to low frequency electrical
measurements. These particles should easily transfer current through surficial and
electronic conduction, due to their metallic nature.
3.2 Experiment 1 Methods
3.2.1 Experiment 1 Measurement Columns
The dimensions of the measurement columns (Figure 1) were 15cm long and
constructed of 3.175cm inner diameter polyvinyl chloride (PVC) pipe. Two coiled silver-
silver chloride (Ag-AgCl) current electrodes were placed at the end of each column
(Slater and Glaser, 2003). Two additional Ag-AgCl potential electrodes were positioned
5cm and 10cm from one end resulting in 5cm equal spacing from each electrode. This
electrode geometry is a modified Wenner array (Figure 1). A separate column (five in

15
total) was constructed for each nanoparticle used in the experiment. To ensure
homogeneous porosity between tests, after packing the columns with sand (U.S. Silica,
Ottawa Standard, 20 - 30 (850 - 520 µm) mesh) they were thoroughly agitated before
being saturated. This agitation eliminates porosity that is a result of grain stacking inside
the column. The porosity of the columns over multiple tests was 40±1%.
3.2.2 Experiment 1A: SIP Response versus Nanoparticle to Sand Weight Ratio
Experiments were conducted to determine the sensitivity of SIP measurements to
the concentration of different nanoparticles in medium grained silica sand. The
nanoparticles to sand weight ratios (NSR) used in the experiment were 0.025 to 4.8
weight percent. A baseline for each column was determined by packing it with sand (no
nanoparticles) and then saturating it with 1025 mS/cm ± 15 mS/cm conductivity tap
water at neutral pH. This baseline or calibration measurement provided a basis for
differencing and allowing comparison between nanoparticles responses. After calibrating
the columns, nanoparticles were mixed into the sand until visually homogeneous at
varying NSRs (0.25-4.8 weight percent). For each NSR, new sand was used and the
column was thoroughly cleaned before reuse. Porosity due to grain stacking was
removed by agitating the columns to improve a homogeneous distribution. The sand and
nanoparticle mixture in the columns were then saturated with tap water by holding the
columns vertically and slowly injecting from the bottom to remove all of the air inside
the system. Only one pore volume of tap water was pumped into the columns to prevent
nanoparticles being flushed out of the system. After saturating, SIP measurements were
immediately collected to prevent the influence of potential redox reactions from
16
occurring inside the columns. The frequency range used in these measurements was 1-
12k Hz with data points acquired at 18 logarithmically spaced intervals.
3.2.3 Experiment 1B: SIP Response versus Ionic Strength
We also conducted experiments to investigate the sensitivity of SIP measurements
to changes in nanoparticle surface chemistry as a result of electrolyte chemistry. The
effects of the electrolyte chemistry on SIP measurements are commonly illustrated by
plotting the electrical parameters (e.g., real conductivity and phase shift) as a function of
fluid conductivity, σ w, or ionic concentration (Slater et al., 2006). Additionally, the
amount of nanoparticles in suspension has been shown to be pH and ionic strength
dependant (El Badawy et al., 2010; Ma and Bouchard, 2009; Zevi et al., 2009). We kept
the particle concentration constant and saturated the columns with salt solutions of
different molarities and ionic strengths. The quantity of nanoparticle used in each
column was dependant on the particle type to prevent pore clogging. The
nanoparticle/sand
n
weight percentages were: 0.8% for nZVI, 2.0% for nAg, 1.6% for
nZnO and TiO2, and 3.2% for nCeO2.
These measurements were performed in clear PVC columns with the same
dimensions as previously described. The salts used in the experiment were sodium
chloride (NaCl), calcium chloride (CaCl2), and aluminum chloride (AlCl3) electrolytes.
Each column was saturated with salt solutions of various molarities (0.0 – 1.0 M). After
saturation, SIP measurements were conducted on the columns using a frequency range of
1-10k Hz with measurement points at 40 logarithmically spaced intervals.

17
A baseline for each column was established by saturating the nanoparticle/sand
mixtures with de-ionized water (DIW). After establishing the baseline reading, each
column was saturated with the salts of different molarities and ionic strengths by
pumping one pore volume from the bottom to remove the entrapped air. The molarities
used for each salt were; 0.25M, 0.5M, 0.75M, and 1.0M. After each test, each column
was thoroughly rinsed, repacked, and saturated with the subsequent salt solution. The
columns were immediately measured to prevent the measurements affected by redox
reactions occurring inside the columns. DIW was used to saturate the columns in the
baseline data set because DIW was the fluid used to make the salt solutions.
3.3 Experiment 1 Results
3.3.1 Experiment 1A Results: SIP Response versus NSR
The dependence of the phase shift on nanoparticle concentration plotted on log
scale from 0.0001 -0.1 NSR at 10 Hz is shown in Figure 3.
Zoom in to -1 tFigure 3: Relative phase shift from column baseline. All date at 10 Hz. o 5 mRads
18
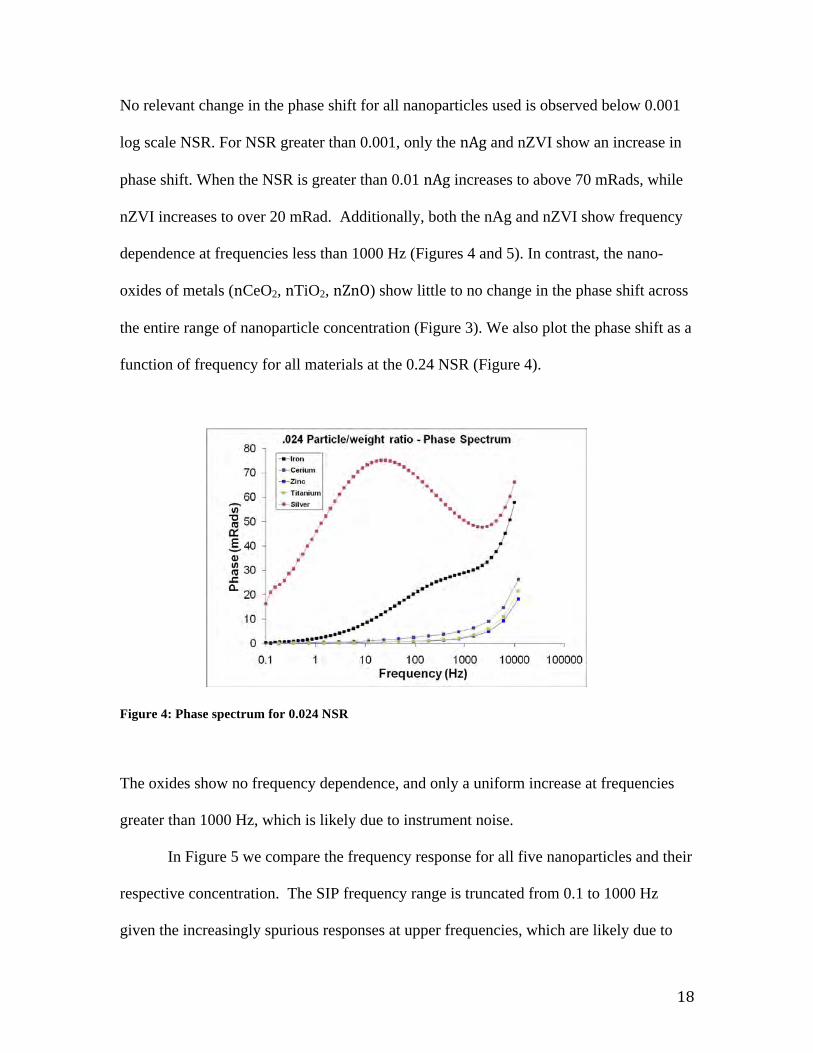
No relevant change in the phase shift for all nanoparticles used is observed below 0.001
log scale NSR. For NSR greater than 0.001, only the nAg and nZVI show an increase in
phase shift. When the NSR is greater than 0.01 nAg increases to above 70 mRads, while
nZVI increases to over 20 mRad. Additionally, both the nAg and nZVI show frequency
dependence at frequencies less than 1000 Hz (Figures 4 and 5). In contrast, the nano-
oxides of metals (nCeO2, nTiO2, nZnO) show little to no change in the phase shift across
the entire range of nanoparticle concentration (Figure 3). We also plot the phase shift as a
function of frequency for all materials at the 0.24 NSR (Figure 4).
Figure 4: Phase spectrum for 0.024 NSR
The oxides show no frequency dependence, and only a uniform increase at frequencies
greater than 1000 Hz, which is likely due to instrument noise.
In Figure 5 we compare the frequency response for all five nanoparticles and their
respective concentration. The SIP frequency range is truncated from 0.1 to 1000 Hz
given the increasingly spurious responses at upper frequencies, which are likely due to
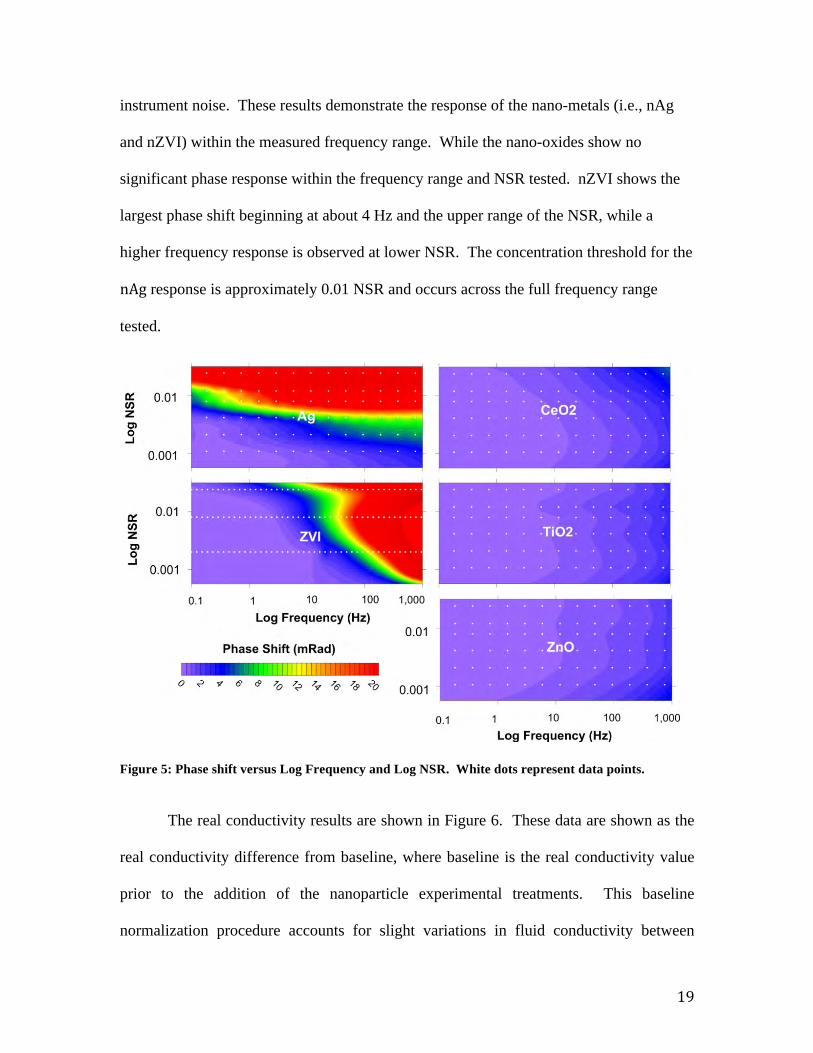
19
instrument noise. These results demonstrate the response of the nano-metals (i.e., nAg
and nZVI) within the measured frequency range. While the nano-oxides show no
significant phase response within the frequency range and NSR tested. nZVI shows the
largest phase shift beginning at about 4 Hz and the upper range of the NSR, while a
higher frequency response is observed at lower NSR. The concentration threshold for the
nAg response is approximately 0.01 NSR and occurs across the full frequency range
tested.
Figure 5:
Phase shift versus Log Frequency and Log NSR. White dots represent data points.
The real conductivity results are shown in Figure 6. These data are shown as the
real conductivity difference from baseline, where baseline is the real conductivity value
prior to the addition of the nanoparticle experimental treatments. This baseline
normalization procedure accounts for slight variations in fluid conductivity between

20
columns. Generally, the data show very small changes. The nZVI data show almost no
change from background with the exception of one outlier. The rest of these data show
slight variations possibly due to porosity changes from the nanoparticles clogging pore
spaces. This phenomenon would result in a reduction in the relative real conductivity
from baseline due to porosity reduction.
Figure 6: Normalized real conductivity at 10 Hz relative to column baseline.
3.3.2 Experiment 1B Results: SIP Response versus Ionic Strength
The results from the experiment on the dependence of the phase shift on NSR as a
function of fluid ionic strength are shown in Figure 7. These data show little to no
significant change with increasing ionic strength and fluid molarity for the nano-oxides.
The nAg data reveal a phase response as a function of frequency, molarity, and ionic
strength. The nZVI data only show a small phase response at low molarities when
saturated with the monovalent salt. When saturated with the di/trivalent salts nZVI
shows no significant deviation from baseline values. The nAg results, in all of the salt

21
solutions used, show a general increase in phase shift with increasing frequency and
molarity.
Figure 7:
The ion
Salt concentration versus phase shift for different valence pore fluid.
ic strength of the fluid also has an effect on the frequency dependant response in
the nAg data. As ionic strength increases, a frequency dependant response occurs at
lower frequencies (750 Hz for CaCl2, 100 Hz for AlCl3). In all of the salt solutions
shown for nAg in Figure 7, the maximum phase shift reached in the 1-1000 Hz frequency
range was 85 mRads in the mono and trivalent salts. The divalent salt has a maximum
phase shift of 75 mRads in the same frequency range.
Figure 8 shows the nAg phase shift with AlCl3 full spectrum response. These data
are shown to demonstrate the frequency spectrum response and the non-linearity between
the frequency and AlCl3 concentration. Notice that the largest phase shift occurs at
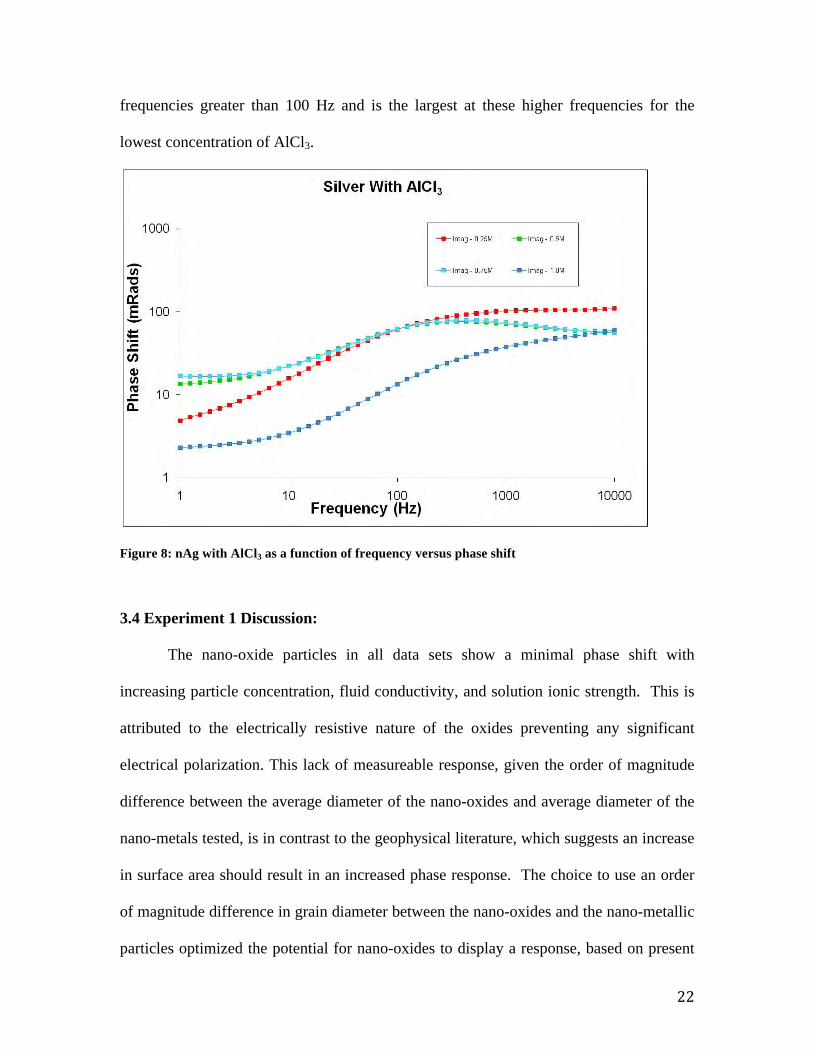
particles
22
frequencies greater than 100 Hz and is the largest at these higher frequencies for the
lowest concentration of AlCl3.
Figure 8:
3.4 Exp
nAg with AlCl3 as a function of frequency versus phase shift
eriment 1 Discussion:
The nano-oxide particles in all data sets show a minimal phase shift with
increasing particle concentration, fluid conductivity, and solution ionic strength. This is
attributed to the electrically resistive nature of the oxides preventing any significant
electrical polarization. This lack of measureable response, given the order of magnitude
difference between the average diameter of the nano-oxides and average diameter of the
nano-metals tested, is in contrast to the geophysical literature, which suggests an increase
in surface area should result in an increased phase response. The choice to use an order
of magnitude difference in grain diameter between the nano-oxides and the nano-metallic
optimized the potential for nano-oxides to display a response, based on present

23
SIP theory. These data show there is no discernable SIP response for nano-oxide
particles. Counter to our expectations, surface area did not play a significant effect on the
SIP response associated with these particles.
The nano-metallic particles show a clear phase response with increasing particle
concentration and surface area. This response is most likely due to the high electrical
conductivity of the metals and perhaps less due to high surface area of the nanoparticles,
when considering the nano-oxide results. The relationship between phase response and
ionic strength or fluid conductivity is not straightforward. When saturated with sodium
chloride (+1 valence) both the nAg and nZVI data sets show an increased phase shift
compared to column baseline values. However, when saturated with solutions of +2 and
+3, only the nAg shows a response. The nZVI data does not significantly deviate from
the column baseline values.
The lack of a strong electrical response with the nano-oxide particles is most
likely due to oxides being electrically resistive (Earle, 1941; Wu et al., 2007). The oxide
coating on the particle surface prevents current from flowing along the particle-fluid
interface, thus minimizing the phase shift and the interfacial component of the real
conductivity. As a result, the current was forced to travel through the pore fluids. Since
the pore fluid conductivity was held relatively constant, there was little to no change in
the measurements. The introduction of the nano-oxide particles did not discernibly alter
the geoelectrical response. This conclusion is supported by the lack of frequency
response as seen in Figure 5.
24
When saturated with solutions of various valence states (Figure 7), the nano-oxide
particles showed little to no change relative to the column baseline values. Again, this is
due to the electrically resistive nature of the oxide particles and the
nAg
fluid conductivity.
The metallic particles nZVI and show a much stronger phase response than
the oxide particles. This increased response is due to electronic conduction through the
particles and around their surfaces. Due to the large surface area associated with these
particles and their inherent metallic properties, the interfacial component of the electrical
measurements is dominant. Figure 3 shows that there is a detection threshold of 0.001
and 0.003 log NSR for nAg and nZVI, respectively. This threshold is most likely due to
the concentration of nanoparticles such that direct particle-to-particle conduction
becomes possible. Figure 5 shows a frequency dependant response for the nZVI data.
This observation is similar to what others have reported with granular zero valent iron
(ZVI) (Slater et al., 2005; Wu et al., 2007; Wu et al., 2009). The frequency at which the
phase shift occurs is related to particle concentration. That is, at low concentrations the
phase maximum occurs at higher frequencies but as concentration increases the
frequency decreases until about 8 or 10 Hz, where no phase shift is observed.
The real conductivity response to the nanoparticles tested revealed no appreciable
difference from baseline. This response suggests no real conductivity mechanisms occur
with the presence of the nanoparticles tested in these experiments. Therefore, detection
of these nanoparticles within the experimental parameters tested will be primarily
possible using the imaginary conductivity response.
The nanoparticle phase shift response as a function of electrolyte valence was
again greatest with nAg. When saturated with various salt solutions the nAg data reveals

25
a different response to increasing salt molarity. Slater et al. (2005) found that as salt
valence increases, the associated phase shift in the ZVI data (not nZVI) decreased. Our
data do not show such a linear relationship for the nZVI data. Figure 7 generally reveals
that as the electrolyte valence increase the phase shift for nZVI remains relatively the
same throughout the frequency range measured. This maybe attributed to the differences
in physical properties of particles at the nano-scale (U.S.EPA, 2008). However, the same
correlation is not as valid concerning our nAg data (Figure 7). The frequency
dependence of the phase shift and solution molarity for the nAg data show variability in
the frequency response, molarity of nAg, and the electrolyte valence. Generally, at
frequencies greater than 100 Hz the higher the electrolyte valence results in a high phase
shift occurring along a broader range of nAg molarity. While the lowest valence
electrolyte resulted in a narrow band of greatest phase response along the mid ranges of
nAg concentration. These results will need further investigation to explain. However,
this does show a target frequency and concentration whereby the phase response of nAg
is detectable.
3.5 Experiment 1 Conclusions
The goal of Experiment 1 was to determine if it is possible to detect nanoparticles
through the use of SIP. The results show that there is no appreciable real conductivity
response observed with any of the nanoparticles tested. This is interpreted to be a result
of the electrolytic conduction being the dominant method of current flow through the
columns because the presence of the nanoparticles affected no real conductivity response.
This real conductivity response would likely be similar at the field scale, barring any

26
geochemical or biogeochemical alterations due to interactions with the nanoparticles.
That is, the particles were not allowed to react inside the columns and change the fluid
chemistry. Thus, there was no change due to oxidation-reduction reaction, so this effect
was, by design, not observed to keep the experiment as controlled as possible. There is
the possibility that reduction in porosity due to increasing particle concentration can
affect the real conductivity of the system due to pore clogging. However, the potential
for this to occur in a natural system is extremely low due to the volume of particles
required to achieve such an effect.
The imaginary conductivity (i.e., phase shift) data show that only the nano-
metallic particles have a significant response. The nano-oxide particles are electrically
resistive, thus preventing current flow. This resistance forces most of the current to flow
through the pore fluid and essentially negates any potential interfacial current flow. The
metallic particles also show frequency dependent polarization effects due to particle size
and electrical conductance (Figures 3, 4, 5, 7, and 8).
It is the opinion of the authors that the physical presence of the nanoparticles used
in this research would not be directly detectable using SIP at realistic concentrations as
may be associated with environmental release. Although, it is conceivable that much
lower concentrations of nanoparticles could be detected if they were allowed to
participate in redox reactions. These reactions would potentially change the fluid
chemistry around the particles enough that field geoelectrical detection would then be a
possibility. Future experiments are planned to test this theory.
27
4.0 Experiment 2: Sensitivity of SIP to the Mobility of nAg at Three Concentrations
In this feasibility study, a flow through experiment was conducted to investigate
the sensitivity of SIP measurements to
nAg
the mobility and transport of three different
concentrations
nAg
(100, 500, 1000 mg/l) of (90-210 nm diameter) in laboratory sand
columns. was chosen due to its SIP detectability determined from Feasibility
Experiment 1.
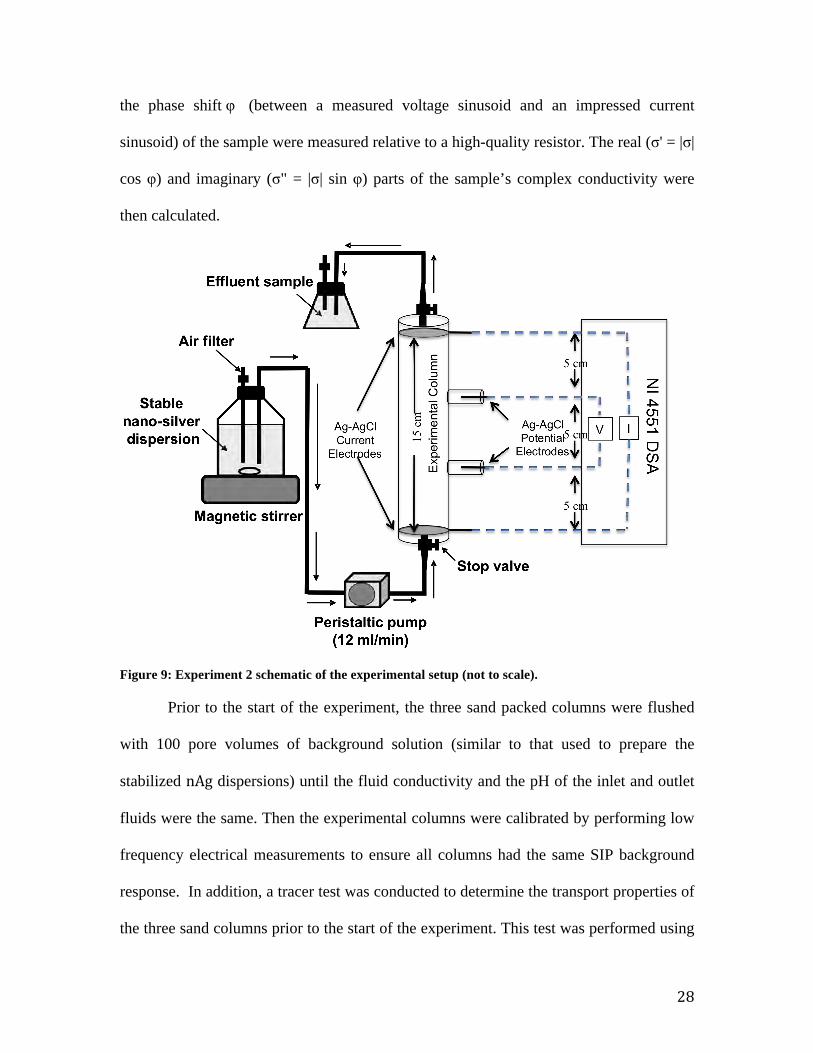
4.1 Experiment 2 Methods Stabilized aqueous suspensions of the different concentrations of nAg particles
were prepared following the procedure of Bihari et al. (Bihari et al., 2008), with fluid
conductivity (0.08 S/m) and pH (7.2) values kept constant. Three identical columns
constructed from polyvinyl chloride (PVC) pipe and dry filled with clean medium
grained quartz sands were prepared and configured into the column flow through
apparatus as shown in Figure 9. Each of the stabilized
homogenized
nAg dispersions were kept
with a magnetic stirrer and a Teflon-coated stir bar.
Current (Ag-AgCl) electrodes were positioned at the influent and effluent ends of
the column, while potential (non-polarizable Ag-AgCl) electrodes were installed
equidistant along the side of the column, in a modified Wenner array (Slater and Glaser,
2003) (see Figure 9) similar to Experiment 1. A two channel dynamic signal analyzer
(DSA) using a National Instruments (NI) 4551 was used to perform the complex
conductivity measurements between 1 to 1000 Hz at 30 equal logarithmic intervals
(Slater and Lesmes, 2002). As detailed in Section 2.0, the conductivity magnitude |σ| and
28
the phase shift φ (between a measured voltage sinusoid and an impressed current
sinusoid) of the sample were measured relative to a high-quality resistor. The real (σ' = |σ|
cos φ) and imaginary (σ" = |σ| sin φ) parts of the sample’s complex conductivity were
then calculated.
Figure 9: Experiment 2 schematic of the experimental setup (not to scale).
Prior to the start of the experiment, the three sand packed columns were flushed
with 100
nAg
pore volumes of background solution (similar to that used to prepare the
stabilized dispersions) until the fluid conductivity and the pH of the inlet and outlet
fluids were the same. Then the experimental columns were calibrated by performing low
frequency electrical measurements to ensure all columns had the same SIP background
response. In addition, a tracer test was conducted to determine the transport properties of
the three sand columns prior to the start of the experiment. This test was performed using

29
phenol red (Fisher Scientific) tracer. Breakthrough curves (BTC) were generated by
measuring the absorbance with a spectrophotometer (Helios Aquamate v7.07 by Thermo
Electron Corporation) at three minute time intervals (A) to the initial absorbance at time
zero (Ao) using a 600 nm wave length. The BTC obtained from the tracer tests conducted
on each column exhibited identical trends and shapes (Figure 10). These results indicate
great similarity in transport properties between the three packed sand columns.
Figure 10: Break through curves (BTCs) from tracer tests using phenol red for the three sand packed
columns (C1, C2, and C3).
A peristaltic pump was used to introduce the stabilized suspensions of nAg into
the sand columns at a flow rate of 12 ml/minute. Effluent samples of the nAg suspensions
and complex conductivity measurements were collected every minute. The concentration
of nAg in the effluent was indirectly determined using a spectrophotometer to measure
optical density and then converted to concentration, where concentration (mg/l) = 1109 ×
optical density. This relationship was
nAg
previously determined from the linear correlation
between different concentrations of suspensions and their measured optical densities.
During the course of the experiment, the concentration of the introdnAg uced to the
30
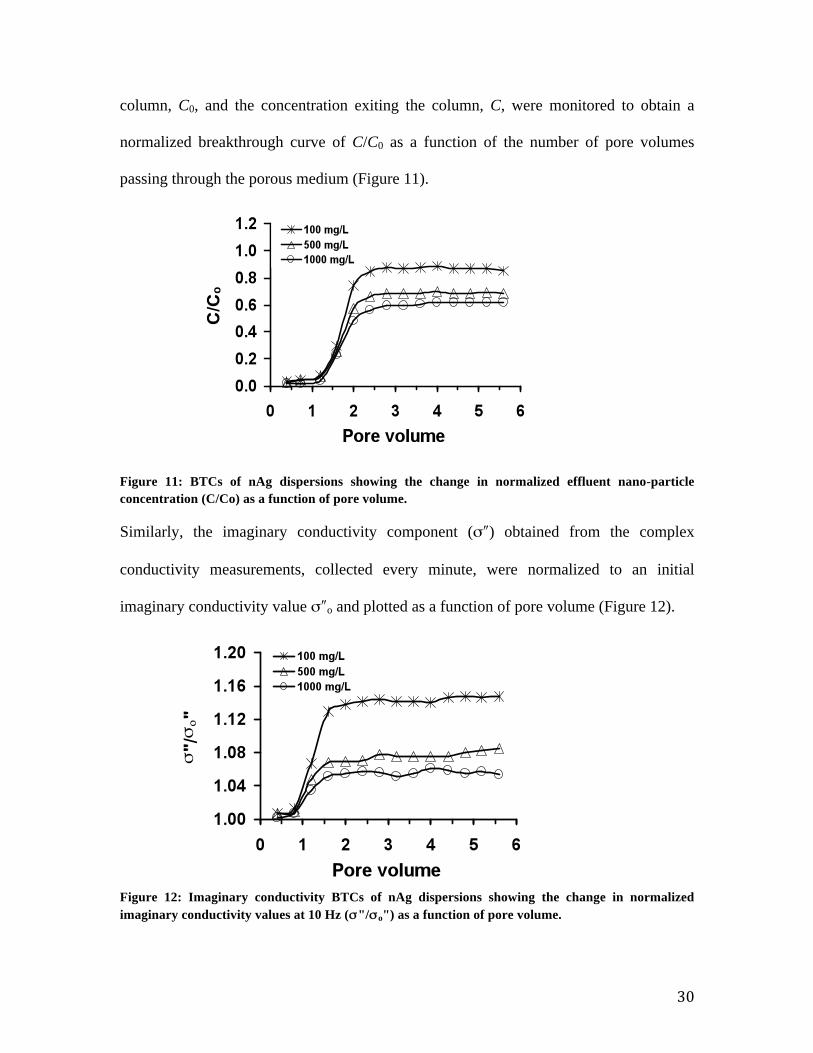
column, C0, and the concentration exiting the column, C, were monitored to obtain a
normalized breakthrough curve of C/C0 as a function of the number of pore volumes
passing through the porous medium (Figure 11).
Figure 11: BTCs of nAg dispersions showing the change in norma
lized effluent nano-particle concentration (C/Co) as a function of pore volume.
Similarly, the imaginary conductivity component (σ″) obtained from the complex
conductivity measurements, collected every minute, were normalized to an initial
imaginary conductivity value σ″o and plotted as a function of pore volume (Figure 12).
Figure 12: Imaginary conductivity BTCs of nAg dispersions showing the change in normalized
imagina
ry conductivity values at 10 Hz (σ"/σo") as a function of pore volume.

31
4.2 Experiment 2 Results and Discussion The BTCs obtained from the three normalized concentrations (100, 500, and 1000
mg/l) of the nAg effluent reached a plateau after two pore volumes (Figure 11). After
two pore volumes,
concentration of
of the susp
nAg
the three BTCs were separated upward towards the lower
concentrations
nAg
suspension (100 mg/l). This indicates that the lower concentration
ension has more mobility compared to the other two higher
(500 and 1000 mg/l). In addition, previous studies have shown that at
higher concentrations and pH values, nano-particles tend to aggregate (Baalousha, 2009;
El Badawy et al., 2010; Gilbert et al., 2009). Therefore, the likely aggregation of the nAg
dispersion at higher concentrations (> 100 mg/l) may result in lowering the mobility of
nAg and the effective surface area. This will result in greater retention as observed in
Figure 11.
Similar observations were obtained from the BTCs of the normalized imaginary
conductivity values (Figure 12). The BTCs reached a plateau after two pore volumes and
exhibit a separation upward towards the lower 100 mg/L concentration of nAg
suspension (Figure 12). Surface conductivity (e.g., imaginary conductivity) is primarily
controlled by the product of the particle surface area, surface charge density, and surface
ionic mobility (Lesmes and Frye, 2001; Slater and Glaser, 2003; Slater and Lesmes,
2002). Nano-particles have a large surface area relative to their mass and the results from
Experiment 1 show that the SIP response from nAg is the greatest. However, the
possible aggregation of nAg at higher concentrations will result in reduction of the
surface area thereby potentially reducing the effective SIP surface area response. This
explains the shift upward in the normalized imaginary conductivity component towards
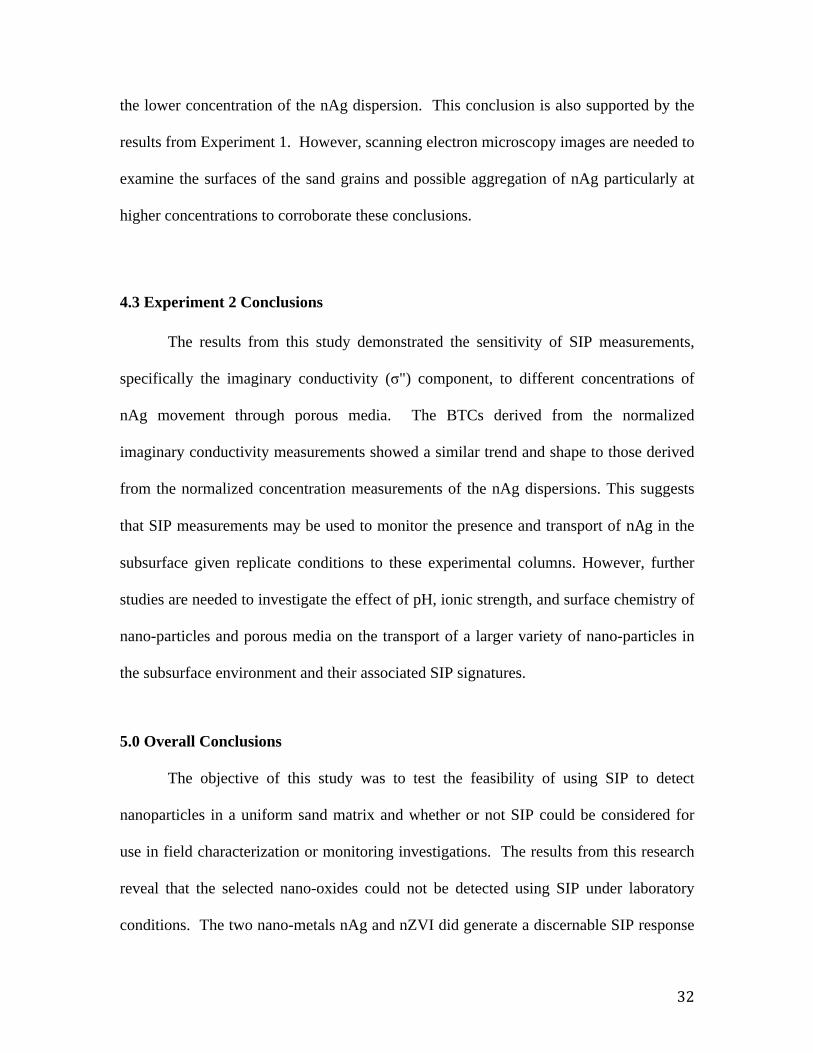
32
the lower concentration of the nAg dispersion. This conclusion is also supported by the
results from Experiment 1. However, scanning electron microscopy images are needed to
examine the surfaces of the sand grains and possible aggregation of nAg particularly at
higher concentrations to corroborate these conclusions.
4.3 Experiment 2 Conclusions
The results from this study demonstrated the sensitivity of SIP measurements,
specifically the imaginary conductivity (σ") component, to different concentrations of
nAg movement through porous media. The BTCs derived from the normalized
imaginary conductivity measurements showed a similar trend and shape to those derived
from the normalized concentration measurements of the nAg dispersions. This suggests
that SIP measurements may be used to monitor the presence and transport of nAg in the
subsurface given replicate conditions to these experimental columns. However, further
studies are needed to investigate the effect of pH, ionic strength, and surface chemistry of
nano-particles and porous media on the transport of a larger variety of nano-particles in
the subsurface environment and their associated SIP signatures.
5.0 Overall Conclusions The objective of this study was to test the feasibility of using SIP to detect
nanoparticles in a uniform sand matrix and whether or not SIP could be considered for
use in field characterization or monitoring investigations. The results from this research
reveal that the selected nano-oxides could not be detected using SIP under laboratory
conditions. The two nano-metals nAg and nZVI did generate a discernable SIP response
33
at log 0.001 and 0.003 NSR for nAg and nZVI, respectively. The observed response is
attributed, in part, to the electrical properties of these metallic nano-particles. However,
since the nano-oxide particles did not produce a measureable SIP response, the same
conclusion cannot be stated for the nano-oxides.
These results subsequently lead to flow-through experiments where the chemical
and SIP BTCs showed very close qualitative similarity. Interestingly, the BTCs revealed
that lower concentrations of nAg were transported more readily than higher
concentrations, which also revealed the SIP discrepancy between these concentrations.
Overall, the results from these feasibility experiments suggest that SIP methods
hold promise in the mapping and monitoring of nano-metals in unconsolidated sand
matrices if the concentrations of the nano-metals are near the detectability level. Our
results suggest that surface area may not be a dominant factor controlling the SIP
response of nanoparticles. Instead, we suggest that electronic conductance appears to be
the conductivity mechanism. Additional experiments are in progress to address various
solution chemistries, heterogeneous geologies, and other complications, which inevitably
occur at field sites. Finally, the sensitivity of other geophysical methods to nanoparticles
should be investigated.
6.0 Acknowledgements
This work was partially funded through the U.S. Environmental Protection
Agency Office of Research and Development student services contracts, EP09D000547
and EP09D000553. Although this work was reviewed by EPA and approved for
presentation, it may not necessarily reflect official Agency policy. Mention of trade
names or commercial products does not constitute endorsement or recommendation by
34
EPA for use. We thank Matt McGuire and John Zimmerman for exceptional laboratory
support. The reviews of Eric Koglin and Steve Gardner greatly improved the editorial
content and scientific clarity of this report.
7.0 References
Atekwana, E. A, Atekwana, E. A., Werkema, D. D., Allen, J. P., Smart, L. A., Duris, J.
W., Cassidy, D. P., Sauck, W. A., and Rossbach, S., Evidence for microbial enhanced electrical conductivity in hydrocarbon-contaminated sediments, Geophysical Research Letters, 31(L2350), 2004.
Atekwana, E. A., D. D. Werkema and E. Atekwana, Biogeophysics: The effects of microbial processes on geophysical properties of the shallow subsurface, in Applied Hydrogeophysics, Springer Verlag, 2006.
Baalousha, M., Aggregation and disaggregation of iron oxide nanoparticles: Influence of particle concentration, pH and natural organic matter, Science of the Total Environment, 407, 2093-2101, 2009.
Bargar, J., Bernier-Latmani, R., Giammar, D., and Tebo, B., Biogenic Uraninite nanoparticles and their importance for Uranium remediation, Elements, 4(6), 407-412, 2008.
Battin, T. J., Kammer, F. V. D., Weilhartner, S., Ottofueling, S., and Hofman, T., Nanostructured TiO2: Transport behavior and effects on aquatic microbial communities under environmental conditions, Environmental Science and Technology, 43, 8098-8104, 2009.
Bihari, P. M., Vippola, S., Schultes, M., Praetner, A. G., Khandoga, C. A., Reichel, C., Coester, T., Tuomi, M., Rehberg, and Krombach, F., Optimized dispersion of nanoparticles for biological in vitro and in vivo studies, Particle and Fibre Toxicology, 2008.
Bouchard, D., X. Ma and C. Isaacson, Colloidal Properties of Aqueous Fullerenes: Isoelectric Points and Aggregation Kinetics of C60 and C60 Derivatives, Environmental Science and Technology, 43(17), 6597-6603, 2009.
Briggs, V., J. A. Sogade, B. J. Minsley, M. Lambert, P. Reppert, D. A. Coles, J. Rossabi, W. Shi and F. D. Morgan, Mapping of TCE and PCE Contaminant Plumes Using a 3-D Induced Polarization Borehole Data, 2004.
35
Clough, S. R., The potential ecological hazard of nanomaterials, in Nanotechnology and the Environment, edited by K. Sellers, pp. 169-192, CRC Press, Boca Raton, 2009.
Earle, M., The electrical conductivity of Titanium Dioxide, Physical Review, 61, 56-62, 1941.
El Badawy, A. M., Luxton, T. P., Silva, R. G., Scheckel, K. G., Suidan, M. T., and Tolaymat, T. M., Impact of environmental conditions (pH, ionic strength, and electrolyte type) on the surface charge and aggregation of silver nanoparticles suspensions, Environmental Science and Technology, 2010.
Gilbert, B., Lu, G., and Kim, C. S., Stable cluster formation in aqueous suspensions of iron oxyhydroxide nanoparticles, Journal of Colloid and Interface Science, 313, 152-159, 2009.
Glaser, D. R., D. F. Rucker, J. B. Fink, M. T. Levitt and C. A. Baldyga, A Comprehensive Geophysical Case Study at a Former Radioactive Waste Disposal Site in the Columbia River Valley, Southeastern Washington, 2005.
Grassian, V. H., Nanoscience and Nanotechnology: Environmental and Health Impacts, John Wiley & Sons, Inc., Hoboken, 2008.
Kabashin, A., Meunier, V. M., Kingston, C. J., and Luong, H. T., Fabrication and characterization of gold nanoparticles by femtosecond laser ablation in an aqueous solution of cyclodextrins, Journal of Physical Chemistry, 1074, 2003.
Kamat, P. V., Photophysical, photochemical and photocatalytic aspects of metal nanoparticles, Journal of Physical Chemistry, 106, 7729-7744, 2002.
Knight, R. and A. L. Endres, Introduction to rock physics for near-surface application in near-surface geophysics, SEG, 2005.
Lecoanet, H. F., Bottero, J., and Wiesner, M. R., Laboratory assessment of the mobility of nanomaterials in porous media, Environmental Science and Technology, 38, 5164-5169, 2004b.
Lecoanet, H. F., Bottero, J., and Wiesner, M. R., Laboratory assessment of the mobility of nanomaterials in porous media, Environmental Science and Technology, 38, 5164-5169, 2004a.
Lecoanet, H. F., J. Y. Bottero and M. R. Wiesner, Laboratory Assessment of the Mobility of Nanomaterials in Porous Media, Environmental Science & Technology, 38(19), 5164-5169, 2004c.
Lesmes, D. P. and Frye, K. M., Influence of pore fluid chemistry on the complex conductivity and induced polarization responses of Berea sandstone, Journal of Geophysical Research, 106(B3), 4079-4090, 2001.

36
Liu, Q., V. Lazouskaya, Q. He and Y. Jin, Effect of Particle Shape on Colloid Retention and Release in Saturated Porous Media, Journal of Environmental Quality, 39(2), 500-508, 2010.
Lok, C., Ho, C., Chen, R., He, Q., Yu, W., Sun, H., Tam, P. K., Chiu, J., and Che, C., Silver nanoparticles: partial oxidation and antibacterial activities, Journal of Biological Inorganic Chemistry, 12, 527-534, 2007.
Ma, X. and D. Bouchard, Formation of aquesous suspensions of fullerenes, Environmental Science and Technology, 43, 330-336, 2009.
Mansoor, N. and L. Slater, Aquatic electrical resistivity imaging of shallow-water wetlands, Geophysics, 72(5), F211-F221, 2007.
Maynard, A. D., Nanotechnology: A Reserach Stragegy for Addressing Risk, Woodrow Wilson International Center for Scholars, Project on Emerging Technologies Report, 2006.
Minsley, B. J., J. A. Sogade, V. Briggs, M. Lambert, P. Reppert, D. A. Coles, J. Rossabi, B. Riha, W. Shi and F. D. Morgan, Three dimensional self-potential inversion for subsurface contaminant detection and mapping at the DOE Savannah River Site, South Carolina, 2004.
Oliveira, M. M., Ugarte, D., Zanchet, D., and Zarbin, J. G., Influence of synthetic parameters on the size, structure, and stability of dodecanethiol- stabilized silver nanoparticles, Journal of Colloid and Interface Science, 292, 429-435, 2005.
Revil, A. and P. W. J. Glover, Nature of surface electrical conductivity in natural sands, sandstones, and clays, Geophysical Research Letters, 25, 691-694, 1998.
Rucker, D. F. and Fink, J. B., Inorganic plume delineation using surface high resolution electrical resistivity at the BC cribs and trenches site, Hanford, Vadose Zone Journal, 6(6), 946-958, 2007.
Rucker, D. F., D. R. Glaser, T. Osborne and W. Maehl, Electrical resistivity characterization of the reclaimed Landusky Gold Mine to delineate acid rock drainage pathways, Mine Water and the Environment, 28, 146-157, 2009.
Sellers, K., Nanoscale Materials Definition and Properties, in Nanotechnology and the Environment, edited by K. Sellers, C. MacKay, L. L. Bergeson, S. R. Clough, M. Hoyt, J. Chen, K. Henry and J. Hamblen, pp. 11-32, CRC Press / Taylor & Francis Group, LLC, Boca Raton, 2009.
Sellers, K., C. MacKay, L. L. Bergeson, S. R. Clough, M. Hoyt, J. Chen, K. Henry and J. Hamblen, Nanotechnology and the Environment, CRC Press, 2008.
37
Slater, L. D., J. Choi and Y. Wu, Electrial properties of iron-sand columns: implications for induced polarization investigation and performance monitoring of iron-wall barriers, Geophysics, 70(4), G87-G94, 2005.
Slater, L. D. and D. R. Glaser, Controls on induced polarization in sandy unconsolidated sediments and application to aquifer characterization, Geophysics, 68, 1547-1558, 2003.
Slater, L. D. and Lesmes, D. P., Electrical-hydraulic relationships observed for unconsolidated sediments, Water Resources Research, 38, 1213, 2002.
Slater, L. D., D. Ntarlagiannis and D. Wishart, On the relationship between induced polarization and surface area in metal-sand and clay-sand mixtures, Geophysics, 71(2), 2006.
U.S.EPA, Sampling and analysis of nanomaterial in the environment: a state-of-the-science review, EPA/600/R-08/098, 2008.
Vukenkeng, C., Atekwana, E. A, Atekwana, E., Sauck, W. A., and Werkema, D. D., Temporal geophysical signatures due to contaminant source reduction, Geophysics, 74(4), P.B113-B123, 2009.
Werkema, D. D., Atekwana, E. A, Endres, A. L., Sauck, W. A., and Cassidy, D. P., Investigating the Geoelectrical Response of Hydrocarbon Contamination Undergoing Biodegradation, Geophysical Research Letters, 30(12), 1647, 2003.
Westerhoff, P., Y. Zhang, J. Crittenden and Y. Chen, Properties of Nanoparticles that Affect Their Removal During Water Treatment, in Nanoscience and Nanotechnology: Environmental and Health Impacts, edited by Vicki H.Grassian, pp. 71-90, John Wiley & Sons, Inc., Hoboken, 2008.
Wiesner, M. R. and J. Bottero, Environmental nanotechnology: applications and impacts of nanomaterials, McGraw Hill, New York, NY, 2008.
Wiesner, M. R. and J. Y. Bottero, Environmental Nanotechnology: Applications and Impacts of Nanomaterials, McGraw Hill, New York, 2007.
Williams, K. G., D. Ntarlagiannis, L. D. Slater, S. S. Hohnalkova, S. S. Hubbard and J. F. Banfield, Geophysical imaging of stimulated microbial biomineralization, Environmental Science and Technology, 39, 7592-7600, 2005.
Wu, Y., L. D. Slater, R. Versteeg and D. LaBrecque, A comparison of the low frequency electrical signatures of iron oxide versus calcite precipitation in granular zero valent iron columns, Journal of Contaminant Hydrology, 95, 154-167, 2007.
Wu, Y., L. D. Slater, R. Versteeg and D. LaBrecque, Calcite precipitation dominates the electrical signatures of zero valuntr iron column under simulated field conditions, Journal of Contaminant Hydrology, 106, 131-143, 2009.

38
Zanker, H., Huttig, G., Arnold, T., and Nitsche, H., Formation of iron-containing colloids by the weathering of phyllite, Acquatic Geochemistry, 12(4), 299-325, 2006.
Zevi, Y., A. Dathe, B. Gao, W. Zhang, B. K. Richards and T. S. Steenhuis, Transport and retention of colloidal particles in partially saturated porous media: Effect on ionic strength, Water Resources Research, 45(12), 2009.

Please make all necessary changes on the below label, detach or copy and return to the address in the upper left hand corner.
If you do not wish to receive these reports CHECK HERE ; detach, or copy this cover, and return to the address in the upper left hand corner.
Office of Research and Development (810Washington, DC 2046
Official Business Penalty for Private Us$300 EPA/600/R-10/105 September 2010 www.epa.gov
1R) 0
e


