BMRloumalof Australian Geology & Geophysics. 2 (J977J 149·154 149 Geophysical response of heavy-mineral sand deposits at Jerusalem Creek, New South Wales D. F. Robson and N. Sampath Introduction BMR has started evaluating how geophysical methods might assist in exploration for deposits of the heavy minerals rutile, zircon, ilmenite, and monazite. Historically, exploration for these heavy minerals has concentrated on the search for high-grade onshore beach• sand deposits, and has employed surface sampling and shallow drilling. However there is a growing awareness that future exploration targets are likely to be low grade and perhaps either deeply buried or located offshore. Explora• tion directed towards these targets will require new explora• tion methods, particularly those which offer remote sensing capabilities. BMR has begun a program of test surveys and laboratory investigations to establish the geophysical response of heavy-mineral deposits. As the first stage of these investiga• tions, airborne and ground geophysical surveys were made over heavy-mineral deposits in the Jerusalem Creek area of NSW during 1975. Jerusalem Creek was chosen for the initial field investigations because of the variety and extent of heavy-mineral deposits in the area. The airborne survey (Fig. 1) was carried out over an area of 200 sq km of coastal plain south of Evans Head, and used magnetic and gamma spectrometer methods. Ground surveys were conducted over the Evans West and GL 10 deposits, using magnetic, radiometric and induced polarization methods. The locations ofthe Evans West and GL 10 deposits are shown in Figure 1. The Evans West deposit is 2 km in length, 3 m thick, 30 m wide, and is covered by 3 m of overburden. The deposit has a fairly sharp grade cut-off at its boundaries, and averages about 10 percent heavy minerals comprising 36 percent zircon, 35 percent rutile, 25 percent magnetics, minor monazite and other minerals. The magnetic fraction is largely ilmenite. The GL 10 deposit has a similar mineral composition but the deposit consists of several parallel leads up to 40 m wide. The average grade ofthe deposit is only 1-5 percent, and the deposit is buried under only 0.5 m of cover. The magnetic, radiometric and induced polarization methods were used because the mineral assemblage of the Jerusalem Creek deposits suggests susceptibility, radioactivity and induced polarization contrasts between ore and the sur• rounding sands. The Evans West and GL 10 deposits were chosen as ground survey sites because extensive mine develupment drilling provided excellent geological control for the interpretation of geophysical results. To establish the physical properties of heavy-mineral ores and to assist interpretation of the geophysical surveys, laboratory measurements of susceptibility, induced polarization and radioactivity were made of ore and sand samples collected from the Evans West deposit. The surveys at Jerusalem Creek were carried out in close co-operation with Associated Minerals Consolidated (AM A), whose assistance in the planning and carrying out of the survey is gratefully acknowledged. Jerusalem Creek airborne survey The main objective of this survey was to seek broad changes in the radioactivity and magnetic intensity of the sand ridges associated with heavy-mineral deposits. o IOkm '--__ -'-___ 1 SURVEY AREA H56/B7-17A Figure 1. Locality map. The survey was flown at an altitude of 100 metres; a traverse spacing of 400 metres and a speed of 180km/hr. The radiometric survey was · made with a differential 4- channel 3700 cm' Hamner Harshaw gamma-ray spectro• meter; and the magnetic survey used a BMR-designed fluxgate magnetometer with a sensitivity of 1 nT. The survey specifications were adequate to locate the broad sources sought, but were not suitable for detecting small isolated sources. Radiometric results Figure 2 shows the results of some total count radiometric traverses, which are superimposed on the geology (Nicholson, 1974) of the Jerusalem Creek area. The heavy• mineral leads are cross hachured. The radiometric results show a few large and some small radiometric anomalies on a low background of less than 3 IoIR per hr. Thorium anomalies with a radioactivity of up to 20lolR per hr were recorded over heavy-mineral stockpiles (area A) , and smaller anomalies were observed over mining sites (area B) and along some sand ridges (area C). The results indicate
Transcript
BMRloumalof Australian Geology & Geophysics. 2 (J977J 149·154 149
Geophysical response of heavy-mineral sand deposits at Jerusalem Creek, New South Wales
D. F. Robson and N. Sampath
Introduction BMR has started evaluating how geophysical methods
might assist in exploration for deposits of the heavy minerals rutile, zircon, ilmenite, and monazite.
Historically, exploration for these heavy minerals has concentrated on the search for high-grade onshore beach•sand deposits, and has employed surface sampling and shallow drilling. However there is a growing awareness that future exploration targets are likely to be low grade and perhaps either deeply buried or located offshore. Explora•tion directed towards these targets will require new explora•tion methods, particularly those which offer remote sensing capabilities.
BMR has begun a program of test surveys and laboratory investigations to establish the geophysical response of heavy-mineral deposits. As the first stage of these investiga•tions, airborne and ground geophysical surveys were made over heavy-mineral deposits in the Jerusalem Creek area of NSW during 1975. Jerusalem Creek was chosen for the initial field investigations because of the variety and extent of heavy-mineral deposits in the area. The airborne survey (Fig. 1) was carried out over an area of 200 sq km of coastal plain south of Evans Head, and used magnetic and gamma spectrometer methods.
Ground surveys were conducted over the Evans West and GL 10 deposits, using magnetic, radiometric and induced polarization methods. The locations ofthe Evans West and GL 10 deposits are shown in Figure 1. The Evans West deposit is 2 km in length, 3 m thick, 30 m wide, and is covered by 3 m of overburden. The deposit has a fairly sharp grade cut-off at its boundaries, and averages about 10 percent heavy minerals comprising 36 percent zircon, 35 percent rutile, 25 percent magnetics, minor monazite and other minerals. The magnetic fraction is largely ilmenite. The GL 10 deposit has a similar mineral composition but the deposit consists of several parallel leads up to 40 m wide. The average grade ofthe deposit is only 1-5 percent, and the deposit is buried under only 0.5 m of cover. The magnetic, radiometric and induced polarization methods were used because the mineral assemblage of the Jerusalem Creek deposits suggests susceptibility, radioactivity and induced polarization contrasts between ore and the sur•rounding sands. The Evans West and GL 10 deposits were chosen as ground survey sites because extensive mine develupment drilling provided excellent geological control for the interpretation of geophysical results.
To establish the physical properties of heavy-mineral ores and to assist interpretation of the geophysical surveys, laboratory measurements of susceptibility, induced polarization and radioactivity were made of ore and sand samples collected from the Evans West deposit. The surveys at Jerusalem Creek were carried out in close co-operation with Associated Minerals Consolidated (AM A), whose assistance in the planning and carrying out of the survey is gratefully acknowledged.
Jerusalem Creek airborne survey The main objective of this survey was to seek broad
changes in the radioactivity and magnetic intensity of the sand ridges associated with heavy-mineral deposits.
o IOkm '--__ -'-___ 1
SURVEY AREA
H56/B7-17A
Figure 1. Locality map.
The survey was flown at an altitude of 100 metres; a traverse spacing of 400 metres and a speed of 180km/hr. The radiometric survey was · made with a differential 4-channel 3700 cm' Hamner Harshaw gamma-ray spectro•meter; and the magnetic survey used a BMR-designed fluxgate magnetometer with a sensitivity of 1 nT. The survey specifications were adequate to locate the broad sources sought, but were not suitable for detecting small isolated sources.
Radiometric results Figure 2 shows the results of some total count radiometric
traverses, which are superimposed on the geology (Nicholson, 1974) of the Jerusalem Creek area. The heavy•mineral leads are cross hachured. The radiometric results show a few large and some small radiometric anomalies on a low background of less than 3 IoIR per hr. Thorium anomalies with a radioactivity of up to 20lolR per hr were recorded over heavy-mineral stockpiles (area A), and smaller anomalies were observed over mining sites (area B) and along some sand ridges (area C). The results indicate
that the heavy-mineral deposits at Jerusalem Creek are radioactive but that the radioactivity is easily masked by overburden.
Magnetic results The results of the airborne magnetic survey show a
positive, magnetic gradient of about 3 to 5 nT per km. The sources of all magnetic features are deep, and there is no
indication of magnetic sources within or at the base of the beach sands.
Ground surveys at Evans West Ground geophysical surveys employing magnetic, radio•
metric and induced polarization methods were made over
the Evans West deposit. Samples were also collected for laboratory measurements_
Figure 3 shows the results of averaging the heavy mineral concentrations in the Evans West area over a depth of 10 metres. The gap in the orebody between 600 Nand 300 N is due to a large sand dune which has prevented drilling ofthe deposit in this area.
Magnetic survey Magnetic surveys employing intensity, gradient and sus•
ceptibility measurements were made. The surveys were designed to detect small anomalies caused by thesuscepti•bility contrast between the ore and the surrounding sands. The Evans West deposit contains about 0.01 percent magnetite and would probably have a susceptibility contrast of around 0.0005 SI units. Depending on the size and geometry of the orebody such a contrast might produce intensity anomalies of up to 5 nT if the deposit were buried no deeper than one or two metres.
The intensity survey was made with a proton-precession magnetometer of 1 nT sensitivity, and involved about fifty traverses across the orebody .. Traverses were up to 300 min length, were from 10 to 50 m apart, and used a station interval of 5 m. The results of the intensity survey show a variation of less than 15 nT over the survey grid, and indi•cated that there were no magnetic trends or anomalies associated with the ore deposit. Because of the low suscepti•bility and the considerable depth of overburden these results are not surprising.
A magnetic gradient survey was made along two traverses using sensors with a 4 m vertical separation and a proton•precession magnetometer of 0.1 nT sensitivity. This survey was designed to enhance the magnetic response of the ore body by measuring the rapid attenuation in intensity with distance from the magnetic body. No anomalies were detected on any of the traverses.
In situ susceptibility measurements on sand and ore were made throughout the survey area with a Bison susceptibility meter. No contrasts in susceptibility were observed.
Radiometric survey The ground radiometric survey was carried out with a
Geometrics DISA 400A, 4-channel gamma-ray spectro•meter. About 30 traverses were made across the orebody, including several traverses where the overburden had been removed. The radiometric data were processed by removing non-geological background, and 'stripping' to separate the contributions to count rates from each ofthe radio-elements thorium, uranium and potassium. The results show that the radioactivity in the area is predominantly caused by thorium; anomalies up to 50 times background occur over exposed mineralization. The results only reflect the ore zone where the overburden was stripped.
Monazite accounts for 0.2 percent of the heavy minerals and is presumably the radioactive source. Although the ore is highly radioactive, 3 metres of overburden completely blankets the response.
Electrical survey The electrical surveys used magnetic induced polariza•
tion (MIP) and electrical induced polarization (EIP). They were designed to detect a possible electrical property contrast between the ore and silica sands. MIP (Seigel, 1974) was used as the main technique because it offered easier resolution of small shallow sources and could over•come the problem of the high contact resistances expected. Few EIP traverses were made over the orebody.
GEOPHYSICAL RESPONSE OF HEAVY-MINERAL SANDS lSI
lOOW
AVERAGE HEAVY-MINERAL CONCENTRATION
>8% _
4-8% ~
2-4% ~
1-2% bS;J
H56/B7-20A
METRES o lOOE
-- 1500N
-- 1300
-- 1100
-- 900
-- 700
-- 500
-- 300
-- lOON
Figure 3. Average heavy mineral concentration Evans West.
MIP. Figure 4 shows stacked profiles of the MIP chargeability. Anomalous values are shaded in black, and non-anomalous zones dotted. Black lines show the outline ofthe ore body as known from auger hole sampling.
Overall there is good correlation of anomalous MIP chargeability with concentrations of heavy minerals. Westerly extensions of four northern lines and easterly extensions of four southern lines show typical background responses.
152 D. F. ROBSON AND N. SAMPATH
100W
-10
mT 0 T
+10
H56/B7-2IA
Figure 4. ChargeabUlty.
METRES o 100E
-1500N
-1300
-1100
-900
-500
-300
-lOON
The anomalous responses average -3 mT/ T and the background level is from 2 to 3 mT/T. The chargeability response indicates that the ore zone is continuous between 600 Nand 300 N, where auger sampling was not possible.
At every chargeability measurement, the nomialized magnetic field strength is also determined. This parameter is similar to a measurement of relative conductance and can be used to detect changes in the resistivity of the ground. At Evans West this parameter was fairly uniform and the results indicate that the heavy-mineral deposits have a
similar resistivity to the un mineralized sands. This deduc•tion was substantiated by subsequent laboratory measure•ments.
There was no information on the nature or location of heavy-mineral concentrations in the shape ofthe MIP decay curve.
EIP. EIP traverses were made across the Evans West deposit using the dipole-dipole array, with a dipole spacing of from 5 ni to 10 m. To,o few traverses were made to allow a satisfactory comparison with the MIP results, but small anomalies were recorded over the heavy-mineral zone which were less well defined than the MIP anomalies.
Physical property measurements Samples of ore, overburden and unmineralized sand
were collected from the Evans West area, and laboratory measurements of susceptibility, resistivity, IP effect and radioactivity were made. The results of the measurements are summarized in Figure S.
Susceptibilities of all samples were low; resistivities showed no apparent contrasts between mineralized and un•mineralized sand. The most significant physical property was the IP effect and the largest effects were associated with the magnetic fraction of the ore which contains 70 percent ilmenite. The ore .was highly radioactive, and spectral analysis shows that thorium daughter-elements were the main source of radioactivity.
PHYSICAL PROPERTY MEASUREMENTS OF BEACH SANOS JERUSALEM CREEK. NSW
RESISTIVITY IP EFFECT RADIOACTIVITY DESCRIPTION SUSCEPTIBILITY
(ohm-m) (mV/v) (}LRfh )
AT 50 ms
DUNE SAND LOW 300-400 <5 2-5
ORE LOW 300-500 10 - 30 40-60
MAGNETIC FRACTION LOW 100-300 80-100 <5
OF THE ORE H56/ B7-22A
Figure 5. Physical property table.
Ground surveys at GL 10 Ground geophysical surveys using magnetic. radiometric
and MIP methods were made along four traverses to the north and four traverses to the south ofthe GL 10 deposit.
Magnetic and radiometric survey As at Evans West the magnetic results show no trends or
anomalies associated with the heavy-mineral leads. The radiometric survey results were also similar to those recorded at Evans West. Where heavy minerals were exposed at the surface a high thorium count rate was detected, but in undisturbed areas a low uniform count rate was recorded.
MIPsurvey Figure 6 shows the results of the MIP survey at GL 10 as
stacked chargeability profiles superimposed on the heavy•mineral concentrations. The outline of the heavy-mineral concentrations has been determined by averaging the heavy•mineral grade over a 3 m interval; boundaries of the heavy•mineral concentrations are defined as O.S percent. Small but
GEOPHYSICAL RESPONSE OF HEAVY-MINERAL SANDS 153
persistent MIP anomalies appear to correlate with the known heavy-mineral leads.
240W
mT T
METRES 120 o 120E
- 6400 S
- 6800
~ -7200 ~
~
-7600
=-:;=v~~""-.. - 8000 S
~ Heavy-mineral concentrations H56/B7-23A
Figure 6. GL 10 chargeability results.
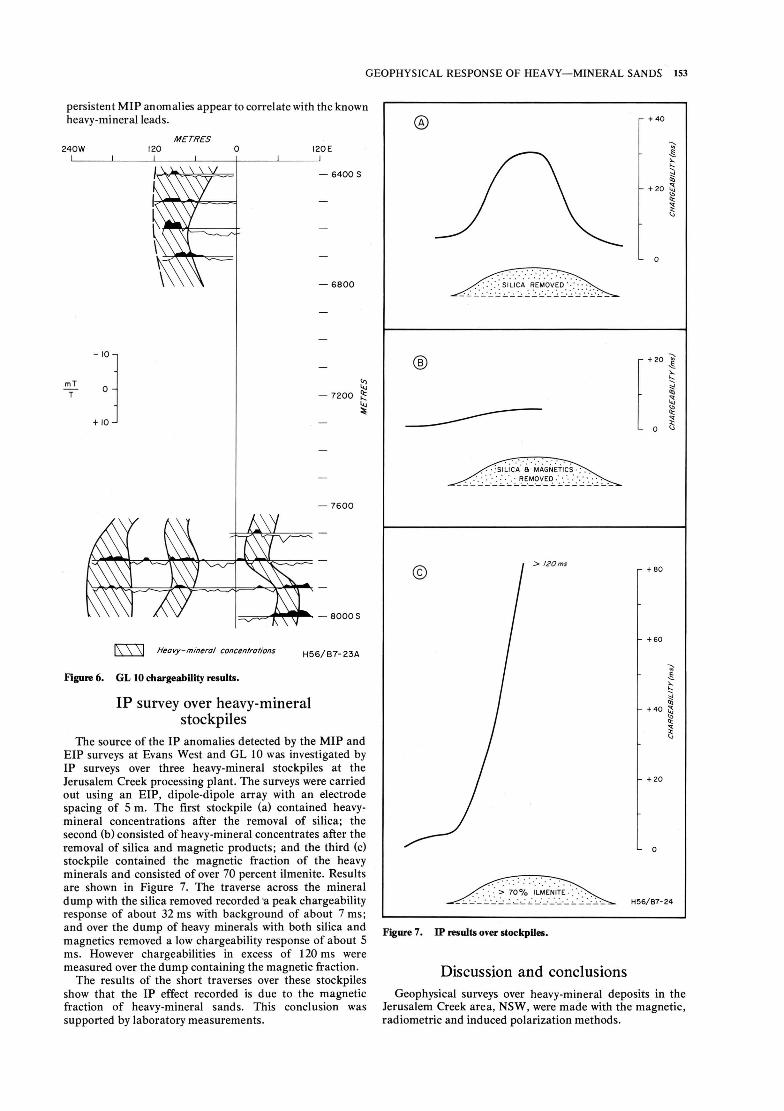
IP survey over heavy-mineral stockpiles
The source of the IP anomalies detected by the MIP and EIP surveys at Evans West and GL 10 was investigated by IP surveys over three heavy-mineral stockpiles at the Jerusalem Creek processing plant. The surveys were carried out using an ElP, dipole-dipole array with an electrode spacing of 5 m. The first stockpile (a) contained heavy•mineral concentrations after the removal of silica; the second (b) consisted of heavy-mineral concentrates after the removal of silica and magnetic products; and the third (c) stockpile contained the magnetic fraction of the heavy minerals and consisted of over 70 percent ilmenite. Results are shown in Figure 7. The traverse across the mineral dump with the silica removed recorded 'a peak chargeability response of about 32 ms with background of about 7 ms; and over the dump of heavy minerals with both silica and magnetics removed a low chargeability response of about 5 ms. However chargeabilities in excess of 120 ms were measured over the dump containing the magnetic fraction .
The results of the short traverses over these stockpiles show that the IP effect recorded is due to the magnetic fraction of heavy-mineral sands. This conclusion was supported by laboratory measurements.
Induced polarization and in particular the MIP method is capable of detecting and outlining both high and low•grade deposits. Laboratory and field measurements shQw that the IP response of the heavy-mineral deposits in the Jerusalem Creek area is due to the ilmenite content of the deposits.
Magnetic surveys did not produce a response which could be directly related to heavy-mineral concentrations. This observation can be explained by the low susceptibility of the ore at Jerusalem Creek.
Measurements made in the laboratory and in mine work•ings show that the heavy-mineral deposits are highly radio•active, but owing to the blanketing effects of overburden no rad·ioactivity anomalies were recorded over in situ deposits.
Induced polarization, in particular magnetic induced polarization, and radiometric methods, may prove to be useful tools for prospecting for heavy-mineral deposits. However further work is hecessary to establish in what environments, and in what operational modes , the methods could be used.
Following the MIP surveys in the Jerusalem Creek area, similar surveys have been made over a variety of heavy•mineral deposits by private companies. AMDEX Mining Ltd have kindly made available the results of MIP test surveys over heavy-mineral deposits at Lanherne Beach, King Island, Tasmania, and the results are shown in Figures 8 and 9.
Figure 8 shows the results of the MIP survey super•imposed on the heavy-mineral concentrations at Lanherne Beach. The average of this deposit is about 1.5 percent; the hachured area outlines a zone of greater than 0.5 percent heavy minerals, averaged over a depth of 5 m. A reasonable correlation exists between MIP chargeability and the heavy•mineral concentrations.
Figure 9 is also from Lanherne Beach anJ shows that although the mineralization in cross-section is patchy and sporadic, the MIP chargeability gives a clear indication of the presence of heavy-mineral sands.
References NICHOLSON , D . A., 1974-Selected onshore heavy mineral
deposits-Jerusalem Creek Area; in THE MINERAL DEPOSITS OF NEW SOUTH WALES (Editors , M ARKHAM, N. L. , & BASDEN , H.,) Geological Survey of New South Wales . Sydney. 615-6 .
SEIGEL, H . 0. , 1974-The m agnetic induced polarization (MIP) Method. Geophysics , 39,321-39.