Page 1
Running Head: Genetic variability in the Eurasian Stone-curlew
A first assessment of the genetic variability in the Eurasian Stone-curlewBurhinus oedicnemus
ALESSIA MORI,1,2 NATALE EMILIO BALDACCINI,1 MARIELLA BARATTI,2 CHIARACACCAMO,1 FRANCESCO DESSÌ-FULGHERI,3 ROSARIO GRASSO,4 SAID NOUIRA,5
RIDHA OUNI,5 ENRICA POLLONARA,1 FELIPE RODRIGUEZ-GODOY,6 MARIA TERESASPENA4 & DIMITRI GIUNCHI1*
1 Dipartimento di Biologia, Università di Pisa, Via A. Volta 6, I-56126, Pisa, Italy2 Istituto per lo Studio degli Ecosistemi – CNR, Via Madonna del Piano 10, I-50019, Sesto
Fiorentino, FI, Italy3 Dipartimento di Biologia Evoluzionistica “Leo Pardi”, Università di Firenze, Via Romana 17, I-
50125, Firenze, Italy4 Dipartimento di Scienze Biologiche, Geologiche ed Ambientali, Università di Catania, Via
Androne 81, I-95124, Catania, Italy5 Higher Institute of Applied Biological Sciences, University of Tunis El Manar, Tunis, Tunisia
6 Servicio de Biodiversidad, Gobierno de Canarias, Edf. Servicios Múltiples II, 4ª planta, E-35071,Las Palmas de Gran Canaria, Spain
The Eurasian Stone-curlew is a species of conservation concern in Europe. We investigate for the
first time the extent of population structure among populations sampled from six geographic areas,
representing four subspecies inhabiting the western part of the species' distribution range. Both
mitochondrial and nuclear markers did not fully support current subspecies boundaries. However,
both markers support significant differentiation of the Canary Island populations from those
sampled from the Mediterranean. Further work is needed to establish the taxonomic status of this
putative distinct Macaronesian taxon. More broadly, further research is required in order to design
and implement an effective conservation plan for this species.
Keywords: avian subspecies, microsatellite, NADH2, shorebirds
The Eurasian Stone-curlew Burhinus oedicnemus is a species of European conservation concern
(SPEC3, BirdLife International 2012). It is considered an intra-Palaearctic migrant, but several
populations are probably facultative migrants or resident (Vaughan & Vaughan-Jennings 2005).
123456789
1011121314151617181920212223
24
25
26
27
28
29
30
31
32
33
34
35
36
Page 2
With the exception of populations in the United Kingdom (Green et al. 1997), wintering ranges and
migration routes are not well understood due to the lack of focal studies and the scarcity of ringed
bird recoveries (Cramp & Simmons 1983). Very little data exists on dispersal (see Vaughan &
Vaughan-Jennings 2005), as detailed information on the ecology and behaviour of this species are
difficult to collect, given its secretive and crepuscular habits (Cramp & Simmons 1983). Hence, the
utilization of molecular markers are an essential tool with which to investigate populations
movements.
Genetic structure among Eurasian Stone-curlew populations has to date not been studied but
this is important in the context of the six recognized subspecies (five, according to Rasmussen &
Anderton 2005) described only on the basis of phenotypic characters (size and plumage coloration)
(Vaughan & Vaughan-Jennings 2005), sometimes from only a few specimens (e.g. for Canary
Islands). Geographic variation is complex and mainly clinal, making the assignment of individuals,
particularly with intermediate characters, to subspecies difficult (Cramp & Simmons 1983). Cramp
and Simmons (1983) suggest that the Canary Islands host two subspecies: B. o. distinctus (generally
brown like the nominate, but with upperparts more heavily streaked and a paler ground-colour)
situated on the western islands of the archipelago (Gran Canaria, Tenerife, La Gomera, El Hierro
and La Palma ), and B. o. insularum (smaller, with more rufescent underparts and less heavily
streaked upperparts than B. o. distinctus) situated on the eastern islands (Lanzarote, Fuerteventura,
Lobos and other small eastern islands), which represent the smallest distinctive breeding
populations of this species (Delany et al. 2009). Northern European populations are attributed to the
nominate B. o. oedicnemus, the largest, darkest and most heavily streaked Palearctic subspecies,
whereas the taxonomic position of the Mediterranean populations are not yet well defined. Birds
from France, Spain and northern Italy are attributed to B. o. oedicnemus, but those from Greece,
some Mediterranean Islands (e.g. Sardinia, Sicily, Balearic Is., Cyprus), the eastern Balkans and
western Turkey tend towards B. o. saharae, the subspecies occurring in the Maghreb area, which is
37
38
39
40
41
42
43
44
45
46
47
48
49
50
51
52
53
54
55
56
57
58
59
60
61
Page 3
paler than the nominate with a sandy-pink background colour (Cramp & Simmons 1983). The
situation is further complicated by the pattern of movement exhibited by some populations
attributed to both B. o. oedicnemus and B. o. saharae, that seem to share their wintering grounds in
Africa (Vaughan & Vaughan-Jennings 2005).
Many species of conservation concern are polytypic and quite often subspecies have varying
conservation status (Haig et al. 2006). Although a correct subspecies designation may entail
important implications for wildlife management, subspecies descriptions often rely on phenotypic
characters with little or no support from molecular data (Zink 2004, Phillimore & Owens 2006,
Haig & D’Elia 2010, Hull et al. 2010).
Here we investigate for the first time the population genetic structure of the Eurasian Stone-
curlew and the degree of differentiation among populations using mitochondrial and nuclear mark-
ers. We sample populations from six geographic areas, located across the western part of the
species' distribution range. We also determine whether our sampled populations can be reliable as-
signed using molecular data to the four subspecies reported for the region.
METHODS
Blood and feather samples of adult Eurasian Stone-curlews were collected from different areas of
the Mediterranean basin and Canary Islands primarily during the breeding season (April – August;
Fig. 1, Table 1). A portion of the mitochondrial NADH2 gene was sequenced from 115 individuals
using standard laboratory procedures (Appendix S1). Thirteen microsatellite markers designed for a
wide range of birds (Küpper et al. 2008; Dawson et al. 2010), were tested on Burhinus (Table S1).
Standard summary statistics were estimated using MEGA 5 (Tamura et al. 2011) and neutrality
tests conducted with DNAsp 4.10 (Rozas et al. 2003). Pairwise ΦST-values and analyses of
molecular variance (AMOVA) were calculated using ARLEQUIN 3.5.1 (Excoffier et al. 2010) and
corrections were made for multiple comparisons (Appendix S1). A medium-joining network was
62
63
64
65
66
67
68
69
70
71
72
73
74
75
76
77
78
79
80
81
82
83
84
85
86
Page 4
constructed using the R-package pegas (Paradis 2010). For the microsatellite analyses, deviations
from Hardy-Weinberg equilibrium (HWE) and linkage disequilibrium (LD) was determined using
GENEPOP 4.0 (Rousset 2008), and corrections were made for multiple comparisons (Appendix
S1). Expected (HE) and observed heterozygosity (HO) as well as the inbreeding coefficient (FIS)
were calculated using GENETIX 4.05 (Belkhir et al. 2004), and values of allelic richness were
determined using FSTAT 2.9.3 (Goudet 2001).
RESULTS
A total of 26 haplotypes were obtained for 653 bp of NADH2 (Table 2). Significant mtDNA
differentiation was detected only for the Canary Island populations relative to the combined
Mediterranean samples (ΦST = 0.46 on average; Table S2). The most common NADH2 haplotype
H1 was shared by 44 samples from SIC, NIT and TUN that encompass the range of both the
subspecies B. o. oedicnemus and B. o. saharae. The second most common haplotype H2 (20
samples) was detected in all the Canary Island samples (ECI, WCI). Tunisian samples were
represented by three different haplotypes (H1, H3, H4) shared with NIT and SIC (Figs. 1 & 2).
Only five of the 13 microsatellite loci tested were polymorphic (Table S1; Appendix S2), these
loci were used for all subsequent analyses. Deviation from Hardy-Weinberg equilibrium (HWE)
was detected for the loci TG01040 (in all populations except GRE) and TG05053 (in NIT, SIC and
TUN). The use of MICROCHECKER (Van Oosterhout et al. 2004) indicated that the lack of HWE
at these loci may be a consequence of the presence of null alleles (see Appendix S1 for details).
Null alleles were revealed in all populations at the locus TG01040, but only for SIC and NIT at
locus TG05053. No evidence of linkage disequilibrium was found among all pairs of loci across all
sampled populations.
All populations, with the exception of ECI and NIT, deviated from the HWE with values of FIS
being significantly positive (Table 2). Pairwise FST(ENA) values corrected for null alleles, were very
87
88
89
90
91
92
93
94
95
96
97
98
99
100
101
102
103
104
105
106
107
108
109
110
111
Page 5
similar to those produced with the original data with differences < 0.0098. This suggests that the
influence of null alleles is likely small and thus, does not influence the biological interpretation of
the results. For this reason, all further analyses were performed using the original genotypic
frequencies. Pairwise FST-values supported the divergence between the Canary Islands (ECI, WCI)
and the other populations (0.12 on average), but significant divergences were also obtained between
TUN and SIC (0.025), and between WCI and ECI (0.054) (Table S2).
The analysis of molecular variance (AMOVA) carried out on mitochondrial and nuclear data
recovered significant genetic structure for both datasets (global ΦST = 0.17 for mtDNA and FST =
0.11 for microsatellites; P < 0.001).
The major partition of variance was consistent with the separation of the Mediterranean from the
Canary Island populations (NIT, SIC, TUN, GRE vs. WCI, ECI; ΦCT = 0.32, P = 0.07 and FCT =
0.11, P = 0.001; Table S3).
DISCUSSION
Our data only partially agree with the current subspecies delimitation across the southwestern part
of the Eurasian Stone-curlew's distribution range. Indeed, mitochondrial analyses do not support
any divergence between eastern and western Canary Island populations nor within the
Mediterranean basin, but the Canary Island populations appear genetically isolated relative to
Mediterranean populations. The microsatellite data only partially supported the mitochondrial
results as these data indicate significant nuclear genetic divergence between SIC and TUN, and
between WCI and ECI, results not recovered in the mtDNA analyses. The different pattern of
variability of mitochondrial and nuclear markers recorded for Canary Island populations makes it
difficult to reach a firm conclusion with respect to the distinction between western and eastern
subspecies.
112
113
114
115
116
117
118
119
120
121
122
123
124
125
126
127
128
129
130
131
132
133
134
135
Page 6
There was a general lack of genetic variability in mtDNA haplotype diversity for Canary Island
populations, a result that is consistent with possible founder events or bottlenecks, and which has
been reported for several avian species in the Macaronesian region (Illera et al. 2012). However,
bottlenecks or any demographic events were not detected by analytical software or neutrality tests
(Tajima' s D and Fu and Li' s D; data not reported) possibly due to our relatively small sample size.
The pattern of genetic diversity and structure observed among the Mediterranean populations is
much more complicated. Both mitochondrial and nuclear markers did not support substantial
distinction between B. o. saharae and B. o. oedicnemus, thus supporting the need for caution
recommended by Cramp and Simmons (1983) when assigning names to geographically or
phenotypically intermediate populations of Eurasian Stone-curlew (e.g. Italy). The microsatellite
data, however, revealed unexpected differences between SIC and TUN, notwithstanding the
proximity of these two geographic areas. While we cannot exclude the possibility of our results
being unduly influenced as a consequence of small sample size, this result would suggest
unexpected patterns of movement within the Mediterranean area, which at the moment are difficult
to explain given our limited knowledge of these populations (Vaughan & Vaughan-Jennings 2005).
The different results obtained using mitochondrial and nuclear markers are frequently reported
for avian species, and could be a consequence of several demographic events, such as sex-biased
dispersal (see Zink & Barrowclough 2008), already documented in other waders (Colwell 2010)
and more generally in birds (Greenwood 1980). Even though we are aware that this discrepancy
could be due to the different in effective population size (Ne) and mutation rates between maternal
and bi-parentally inherited markers (Brito 2007), this aspect deserves further investigation as the
characteristics of the dispersal behaviour of the Eurasian Stone-curlew are at present unknown
(Vaughan & Vaughan-Jennings 2005). In particular, future analyses that take into account the sex of
individuals could be extremely useful in order to clarify the mechanisms shaping the present genetic
136
137
138
139
140
141
142
143
144
145
146
147
148
149
150
151
152
153
154
155
156
157
158
159
Page 7
structure, which could be mainly driven by the most philopatric sex (see e.g. Ortego et al. 2011,
Küpper et al. 2012).
In summary, our preliminary results suggest a complex and partially unexpected genetic
structure that deserves further in-depth molecular analyses. This seems particularly critical in order
to better assess the taxonomic status of the populations of Eurasian Stone-curlew from the Canary
Islands, given that divergence from Mediterranean populations is supported by both mitochondrial
and nuclear loci. We suggest that additional markers and samples are needed in order to fully
support the recognition of a separate Macaronesian species, but it is important to stress the
conservation values of these populations, which our analysis confirm as being the smallest
distinctive breeding populations of the Eurasian Stone-curlew. A better understanding of the pattern
of genetic diversity and structure seems crucial if effective conservation measures are to be
developed and implemented for this species.
We are grateful to all the people who helped us conduct field work; in particular Ángel C. Moreno,
Denise Grassi and to the staff of the Taro River Regional Park (Parma, Italy). Samples were also
provided by the Wildlife Rehabilitation Centres of Gran Canaria and Fuerteventura, by Gianni
Insacco (Regional Rescue Centre of Comiso, Sicily) and by Christos Barboutis (Greek Is.). We
appreciate the improvements in English usage made by Peter Lowther through the Association of
Field Ornithologists' program of editorial assistance. The comment of an anonymous reviewer
greatly improved an earlier draft of the manuscript.
DATA ACCESSIBILITY: GenBank accession numbers for haplotype sequences of NADH2 are
(JX270972–JX270995) and (KJ689457–KJ689458). Individual mitochondrial haplotypes and
microsatellite allelic scores are available in Appendix S2.
160
161
162
163
164
165
166
167
168
169
170
171
172
173
174
175
176
177
178
179
180
181
182
183
184
Page 8
REFERENCES
Belkhir, K., Borsa, P., Chikhi, L., Raufaste, N. & Bonhomme, F. 1996-2004. GENETIX 4.05,
logiciel sous Windows TM pour la génétique des populations. Laboratoire Génome,
Populations, Interactions, CNRS UMR 5000, Université de Montpellier II, Montpellier, France.
BirdLife International 2012. Species factsheet: Burhinus oedicnemus. Downloaded from
http://www.birdlife.org on 21/10/2012.
Brito, P.H. 2007. Contrasting patterns of mitochondrial and microsatellite genetic structure among
Western European populations of tawny owls (Strix aluco). Mol. Ecol. 16: 3423–3437.
Colwell, M.A. 2010. Shorebird ecology, conservation, and management. Berkeley: University of
California Press.
Cramp, S. & Simmons, K. (eds) 1983. The Birds of the Western Palearctic, vol. 3. London:
Oxford University Press.
Dawson, D.A., Horsburgh, G.J., Küpper, C., Stewart, I.R.K., Ball, A.D., Durrant, K.L.,
Hansson, B., Bacon, I., Bird, S., Klein, A., Krupa, A.P., Lee, J., Martin-Galvez, D.,
Simeoni, M., Smitu, G., Spurgin, L.G. & Burke, T. 2010. New methods to identify
conserved microsatellite loci and develop primer sets of high cross-species utility - as
demonstrated for birds. Mol. Ecol. Resour. 10: 475–494.
Delany, S., Scott, D., Dodman, T., Stroud, D. 2009. An Atlas of Wader Populations in Africa and
Western Eurasia. Wageningen: Wetlands International.
Excoffier, L. & Lischer, H.E.L. 2010. Arlequin suite ver 3.5: a new series of programs to perform
population genetics analyses under Linux and Windows. Mol. Ecol. Resour. 10: 564–567.
Green, R.E., Hodson, D.P. & Holness, P.R. 1997. Survival and movements of Stone curlews
Burhinus oedicnemus ringed in England. Ring. Migr. 18: 102–112.
185
186
187
188
189
190
191
192
193
194
195
196
197
198
199
200
201
202
203
204
205
206
207
208
Page 9
Greenwood, P. 1980. Mating systems, philopatry and dispersal in birds and mammals. Anim.
Behav. 28: 1140–1162.
Goudet, J. 2001. FSTAT, a Program to Estimate and Test Gene Diversities and Fixation Indices
Version 2.9.3. Available from http://www2.unil.ch/popgen/softwares/fstat.htm
Haig, S.M., Beever, E.A., Chambers, S.M., Draheim, H.M., Dugger, B.D., Dunham, S., Elliott-
Smith, E., Fontaine, J.B., Kesler1, D.C., Knaus, B.J., Lopes, I.F., Loschl, P., Mullins, T.D.
& Sheffield, L.M. 2006. Taxonomic considerations in listing subspecies under the U.S.
Endangered Species Act. Conserv. Biol. 20: 1584–1594.
Haig, S.M. & D’Elia, J. 2010. Avian subspecies and the U.S. Endangered Species Act. Ornithol.
Monogr. 67: 24–34.
Hull, J.M., Mindell, D.P., Talbot, S.L., Kay, E.H., Hoekstra, H.E. & Ernest, H.B. 2010.
Population structure and plumage polymorphism: The intraspecific evolutionary relationships
of a polymorphic raptor, Buteo jamaicensis harlani. BMC Evol. Biol. 10: 224.
Illera, J.C., Rando, J.C., Richardson, D.S. & Emerson, B.C. 2012. Age, origins and extinctions
of the avifauna of Macaronesia: a synthesis of phylogenetic and fossil information. Quaternary
Sci. Rev. 50: 14–22.
Küpper, C., Burke, T., Székely, T. & Dawson, D.A. 2008. Enhanced cross-species utility of
conserved microsatellite markers in shorebirds. BMC Genomics 9: 502.
Küpper, C., Edwards, S.V., Kosztolányi, A., Alrashidi, M., Burke, T., Herrmann, P., Argüelles-
Tico, A., Amat, J.A., Amezian, M., Rocha, A., Hötker, H., Ivanov, A., Chernicko, J. &
Székely, T. 2012. High gene flow on a continental scale in the polyandrous Kentish Plover
Charadrius alexandrinus. Mol. Ecol. 21: 5864–5879.
Ortego, J., García-Navas, V., Ferrer, E.S. & Sanz, J.J. 2011. Genetic structure reflects natal dis-
persal movements at different spatial scales in the Blue Tit, Cyanistes caeruleus. Anim. Behav.
82: 131–137.
Paradis E. 2010. Pegas: an R package for population genetics with an integrated-modular ap-
209
210
211
212
213
214
215
216
217
218
219
220
221
222
223
224
225
226
227
228
229
230
231
232
233
234
Page 10
proach. Bioinformatics 26: 419–420.
Phillimore, A.B. & Owens, I.P.F. 2006. Are subspecies useful in evolutionary and conservation
biology? Proc. R. Soc. Lond. B 273: 1049–1053.
Rasmussen, P.C. & Anderton, J.C. 2005. Birds of South Asia: the Ripley guide, vol. 2.
Washington D.C. & Barcelona: Smithsonian Institution & Lynx Edicions.
Rousset, F. 2008. Genepop'007: a complete reimplementation of the Genepop software for
Windows and Linux. Mol. Ecol. Resour. 8: 103–106.
Rozas, J., Sánchez-Delbarrio, J.C., Messeguer, X. & Rozas, R. 2003. DnaSP, DNA
polymorphism analyses by the coalescent and other methods. Bioinformatics 19: 2496–2497.
Tamura, K., Peterson, D., Peterson, N., Stecher, G., Nei, M. & Kumar, S. 2011. MEGA5:
molecular evolutionary genetics analysis using maximum likelihood, evolutionary distance,
and maximum parsimony methods. Mol. Biol. Evol. 28: 2731–2739.
Van Oosterhout, C., Hutchinson, W.F., Wills, D.P.M. & Shipley, P. 2004. MICRO-CHECKER:
software for identifying and correcting genotyping errors in microsatellite data. Mol. Ecol.
Notes 4: 535–538.
Vaughan, R. & Vaughan-Jennings, N. 2005. The Stone Curlew Burhinus oedicnemus. Falmouth:
Isabelline books.
Zink, R.M. & Barrowclough, G.F. 2008. Mitochondrial DNA under siege in avian
phylogeography. Mol. Ecol. 17: 2107–2121.
Zink, R.M. 2004. The role of subspecies in obscuring avian biological diversity and misleading
conservation policy. Proc. R. Soc. Lond. B 271: 561–564.
ONLINE SUPPORTING INFORMATION
Additional Supporting Information may be found in the online version of this article:
235
236
237
238
239
240
241
242
243
244
245
246
247
248
249
250
251
252
253
254
255
256
257
258
259
Page 11
Appendix S1. Details of molecular data collection and genetic analyses.
Appendix S2: Mitochondrial haplotypes and microsatellite genotypes for six Eurasian Stone-curlew
populations
Table S1. Details of the 13 microsatellite loci tested in B. oedicnemus.
Table S2. Pairwise comparisons of population FST-values for microsatellite DNA (below the
diagonal) and ΦST values for mtDNA (above the diagonal)
Table S3. Summary of hierarchical AMOVAs for mtDNA and the microsatellite loci under two
alternate population structures.
260
261
262
263
264
265
266
267
268
Page 12
FIGURE CAPTIONS
Figure 1. Map reporting the haplotype (Hap) frequencies recorded in each of the six sampling
areas: NIT - northern Italy; SIC - Sicily; TUN - Tunisia; GRE - Greek Islands; ECI - Eastern Canary
Islands; WCI - Western Canary Islands.
Figure 2. A median-joining network of Eurasian Stone-curlew NADH2 haplotypes. Circle size is
proportional to haplotype frequency. Haplotypes are colour coded by subspecies following Cramp
and Simmons (1983) and Vaughan and Vaughan-Jennings (2005).
269
270
271
272
273
274
275
276
277
Page 14
Figure 2
278279280
Page 15
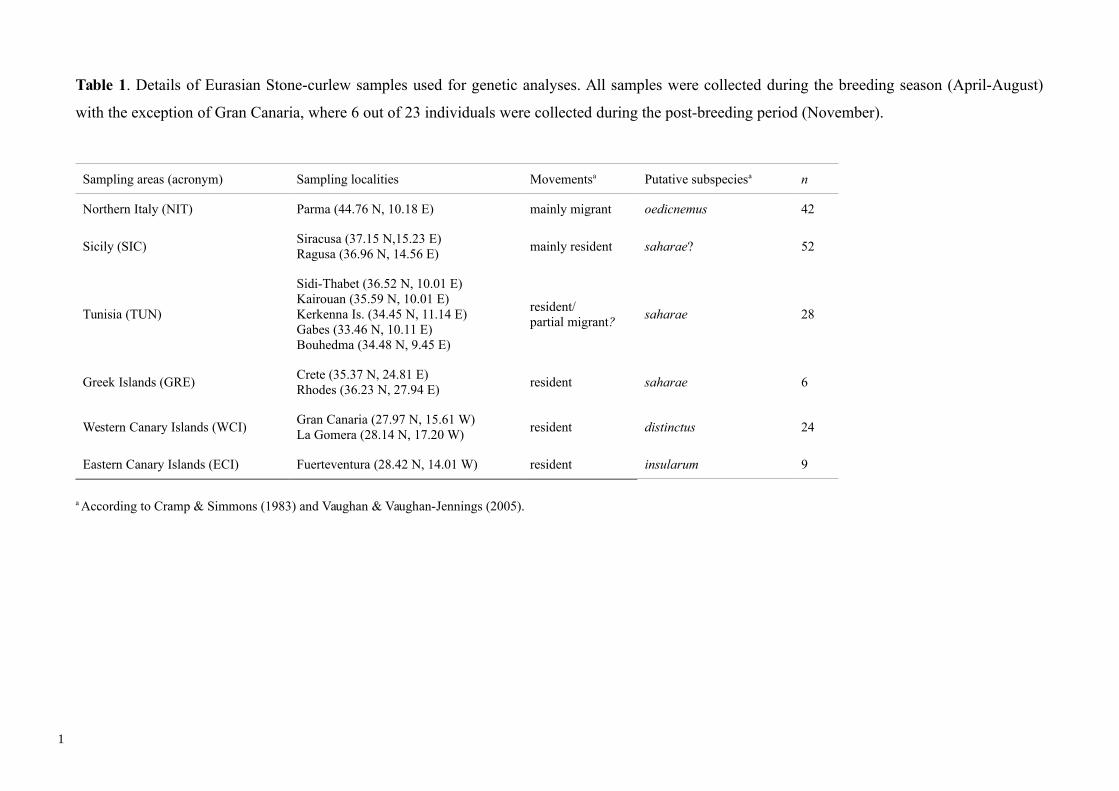
Table 1. Details of Eurasian Stone-curlew samples used for genetic analyses. All samples were collected during the breeding season (April-August)
with the exception of Gran Canaria, where 6 out of 23 individuals were collected during the post-breeding period (November).
Sampling areas (acronym) Sampling localities Movementsa Putative subspeciesa n
Northern Italy (NIT) Parma (44.76 N, 10.18 E) mainly migrant oedicnemus 42
Sicily (SIC)Siracusa (37.15 N,15.23 E)Ragusa (36.96 N, 14.56 E)
mainly resident saharae? 52
Tunisia (TUN)
Sidi-Thabet (36.52 N, 10.01 E)Kairouan (35.59 N, 10.01 E)Kerkenna Is. (34.45 N, 11.14 E)Gabes (33.46 N, 10.11 E)Bouhedma (34.48 N, 9.45 E)
resident/partial migrant?
saharae 28
Greek Islands (GRE)Crete (35.37 N, 24.81 E)Rhodes (36.23 N, 27.94 E)
resident saharae 6
Western Canary Islands (WCI)Gran Canaria (27.97 N, 15.61 W)La Gomera (28.14 N, 17.20 W)
resident distinctus 24
Eastern Canary Islands (ECI) Fuerteventura (28.42 N, 14.01 W) resident insularum 9
a According to Cramp & Simmons (1983) and Vaughan & Vaughan-Jennings (2005).
1
Page 16
Table 2. Estimates of genetic variation for six Eurasian Stone-curlew populations: n, number of samples; NA, average number of alleles; A, allelic
richness; P, number of private alleles; HO, average observed heterozygosity; HE, average expected heterozygosity; FIS, inbreeding coefficient; NH,
number of haplotypes; h, haplotype diversity; π, nucleotide diversity. Significant values (P < 0.05) are indicated in bold.
Microsatellites (five loci)NADH2
Population n NA A* P HO HE FIS n NH h π
NIT 15 4.4 3.177 0 0.587 0.633 0.108 41 11 0.702 0.005
SIC 20 4.4 3.267 0 0.500 0.615 0.212 40 12 0.751 0.006
TUN 25 4.6 3.254 2 0.576 0.635 0.113 9 4 0.750 0.005
GRE 6 3.2 2.777 0 0.367 0.481 0.321 5 5 1.000 0.006
WCI 23 3.6 2.598 1 0.409 0.484 0.177 13 1 0.000 0.000
ECI 9 3.0 2.576 0 0.533 0.535 0.061 7 1 0.000 0.000
*Allelic richness is based on minimum sample size of four diploid individuals and calculated over the five loci analysed for all populations.
2