Proc. NatL Acad. Sci. USA Vol. 78, No. 10, pp. 6329-6333, October 1981 Genetics Estimating genetic divergence and genetic variability with restriction endonucleases (heterozygosity/base substitutions/population genetics/maximum likelihood) WILLIAM R. ENGELS Laboratory of Genetics, University of Wisconsin-Madison, Madison, Wisconsin 53706 Communicated by Harry Harris, June 4, 1981 ABSTRACT Restriction endonucleases cut DNA at specific sites determined by the local nucleotide sequence. By comparing related DNA segments with respect to where such cuts are made, one can estimate the extent of sequence homology between the segments. Empirical methods are presented here for using these data to measure- the proportion of mismatches between two se- quences, the proportion of polymorphic positions in a series of sequences, or the degree of heterozygosity in a population. These methods do not require any assumptions concerning the evolu- tionary or population genetic processes involved. One can also use the data to calculate the precision of each of these estimates. When the positions of the cuts are not determined, these estimates can be made, using only the lengths of the resulting DNA fragments, by means of a maximum likelihood procedure. Several examples demonstrate the usefulness of these methods to study genetic dif- ferences in regions of the genome not amenable to study by other methods. A large part of experimental population genetics in the last two decades has dealt with protein differences within and between populations; see chapter 7 of Wright (1) for a review. More re- cently, the use of restriction endonucleases and accompanying DNA technology has made it possible to study differences at the level of DNA sequences. Several studies (2-5) have dem- onstrated variability in DNA sequences as revealed by variation in the lengths of DNA fragments after digestion by one or more sequence-specific restriction enzymes. A major advantage of this method is that it can be used for any segment of the genome, regardless of whether or not it codes for a soluble protein. It is only necessary to be able to identify the particular fragments of interest by prior purification of a given class of DNA (2, 4, 5) or by hybridization to a labeled homologous probe (3). Any variability at cleavage sites within the DNA thus identified will be detected, provided there are no large deletions or insertions causing observable length differences. There have been several discussions of how such data may be used in genetic mapping (6), or how they may be related to models of evolutionary divergence (7-10) or steady-state pop- ulation genetics (11) in order to estimate the parameters in these models. My purpose in this paper is to present empirical meth- ods for estimating genetic divergence or population variability independent of evolutionary or population genetic models. The precision of these estimates can also be obtained with minimal assumptions concerning population structure. These methods can be applied to cases in which all restriction sites in the sample have been mapped, as well as those in which only the lengths of restriction fragments are available. Data and Definitions. Notation will follow that of Ewens et al. (11) wherever possible. Our sample is assumed to consist of n homologous segments, each approximately L nucleotides long. This sample might have come from n individuals drawn from a population whose variability we wish to measure, or from representatives of n species whose genetic divergence is of in- terest. Alternatively, they might be homologous regions within a single genome such as the At and Gy human globin genes discussed below, which arose by gene duplication and have diverged in evolutionary time. Each segment in the sample is treated with one or a series of restriction endonucleases, and the lengths of the resulting fragments are determined. Assume for the moment that these lengths allow us to determine the exact point at which each enzyme cuts each fragment. (Data in which this final step was not taken, and therefore only identity of fragment lengths can be determined, will be considered be- low for the case of n = 2.) Ifj is the length of the recognition sequence of a given endonuclease-usually 4-6 base pairs-we may define a site as any sequence ofj positions (base pairs). A cleavage site is defined as any site where at least one member of the sample was cleaved. If there are m cleavage sites, then the data consist of the values c1, c2, . .., cm (1 ' ci < n) rep- resenting the numbers of members in the sample cut at each site by one of the enzymes. The total number of cuts at all cleav- age sites will be denoted by c. ESTIMATORS Frequency of polymorphism A site may be considered polymorphic if at least one of its j positions is polymorphic in our sample. If k of the cleavage sites are observed to be polymorphic for the recognition sequence (that is, 1 ' ci s n - 1 for exactly k sites), we might consider k/m as an estimate of the proportion of polymorphic sites in the entire segment. This estimator appears to be the one most often used (2, 3). However, as pointed out by Ewens et al. (11), and by Nei and Li (8) for the case of n = 2, this estimator contains a serious ascertainment bias because it is conditioned on the presence of at least one cut. We may correct this bias by as- suming that the frequency of the recognition sequence among monomorphic sites of whatever type has the same expectation as its frequency in the sample as a whole. That is, the probability that a given site is monomorphic does not depend on its nu- cleotide sequence. This assumption may be written as E(m - k) = (L - j + 1) X P(monomorphic site) P(recognition sequence), [1] in which P( ) indicates probability given a randomly chosen site. Noting that E(c) = n(L - j + 1) P(recognition sequence), we have P(monomorphic site) = nE(-) [2] [3] 6329 The publication costs ofthis article were defrayed in part by page charge payment. This article must therefore be hereby marked "advertise- ment" in accordance with 18 U. S. C. §1734 solely to indicate this fact.
Transcript
Proc. NatL Acad. Sci. USAVol. 78, No. 10, pp. 6329-6333, October 1981Genetics
Estimating genetic divergence and genetic variability withrestriction endonucleases
WILLIAM R. ENGELSLaboratory of Genetics, University of Wisconsin-Madison, Madison, Wisconsin 53706
Communicated by Harry Harris, June 4, 1981
ABSTRACT Restriction endonucleases cut DNA at specificsites determined by the local nucleotide sequence. By comparingrelated DNA segments with respect to where such cuts are made,one can estimate the extent of sequence homology between thesegments. Empirical methods are presented here for using thesedata to measure- the proportion of mismatches between two se-quences, the proportion of polymorphic positions in a series ofsequences, or the degree of heterozygosity in a population. Thesemethods do not require any assumptions concerning the evolu-tionary or population genetic processes involved. One can also usethe data to calculate the precision ofeach ofthese estimates. Whenthe positions of the cuts are not determined, these estimates canbe made, using only the lengths of the resulting DNA fragments,by means of a maximum likelihood procedure. Several examplesdemonstrate the usefulness of these methods to study genetic dif-ferences in regions of the genome not amenable to study by othermethods.
A large part of experimental population genetics in the last twodecades has dealt with protein differences within and betweenpopulations; see chapter 7 of Wright (1) for a review. More re-cently, the use of restriction endonucleases and accompanyingDNA technology has made it possible to study differences atthe level of DNA sequences. Several studies (2-5) have dem-onstrated variability in DNA sequences as revealed by variationin the lengths ofDNA fragments after digestion by one or moresequence-specific restriction enzymes. A major advantage ofthis method is that it can be used for any segment ofthe genome,regardless of whether or not it codes for a soluble protein. Itis only necessary to be able to identify the particular fragmentsof interest by prior purification of a given class of DNA (2, 4,5) or by hybridization to a labeled homologous probe (3). Anyvariability at cleavage sites within the DNA thus identified willbe detected, provided there are no large deletions or insertionscausing observable length differences.
There have been several discussions of how such data maybe used in genetic mapping (6), or how they may be related tomodels of evolutionary divergence (7-10) or steady-state pop-ulation genetics (11) in order to estimate the parameters in thesemodels. My purpose in this paper is to present empirical meth-ods for estimating genetic divergence or population variabilityindependent ofevolutionary or population genetic models. Theprecision of these estimates can also be obtained with minimalassumptions concerning population structure. These methodscan be applied to cases in which all restriction sites in the samplehave been mapped, as well as those in which only the lengthsof restriction fragments are available.Data and Definitions. Notation will follow that of Ewens et
al. (11) wherever possible. Our sample is assumed to consist of
n homologous segments, each approximately L nucleotideslong. This sample might have come from n individuals drawnfrom a population whose variability we wish to measure, or fromrepresentatives of n species whose genetic divergence is of in-terest. Alternatively, they might be homologous regions withina single genome such as the At and Gy human globin genesdiscussed below, which arose by gene duplication and havediverged in evolutionary time. Each segment in the sample istreated with one or a series of restriction endonucleases, andthe lengths of the resulting fragments are determined. Assumefor the moment that these lengths allow us to determine theexact point at which each enzyme cuts each fragment. (Data inwhich this final step was not taken, and therefore only identityof fragment lengths can be determined, will be considered be-low for the case of n = 2.) Ifj is the length of the recognitionsequence ofa given endonuclease-usually 4-6 base pairs-wemay define a site as any sequence ofj positions (base pairs). Acleavage site is defined as any site where at least one memberof the sample was cleaved. If there are m cleavage sites, thenthe data consist of the values c1, c2, . .., cm (1 ' ci < n) rep-resenting the numbers of members in the sample cut at eachsite by one ofthe enzymes. The total number of cuts at all cleav-age sites will be denoted by c.
ESTIMATORSFrequency of polymorphismA site may be considered polymorphic if at least one of its jpositions is polymorphic in our sample. Ifk ofthe cleavage sitesare observed to be polymorphic for the recognition sequence(that is, 1 ' ci s n - 1 for exactly k sites), we might considerk/m as an estimate ofthe proportion ofpolymorphic sites in theentire segment. This estimator appears to be the one most oftenused (2, 3). However, as pointed out by Ewens et al. (11), andby Nei and Li (8) for the case of n = 2, this estimator containsa serious ascertainment bias because it is conditioned on thepresence of at least one cut. We may correct this bias by as-suming that the frequency of the recognition sequence amongmonomorphic sites of whatever type has the same expectationas its frequency in the sample as a whole. That is, the probabilitythat a given site is monomorphic does not depend on its nu-cleotide sequence. This assumption may be written asE(m- k) = (L - j + 1)
X P(monomorphic site) P(recognition sequence), [1]
in which P( ) indicates probability given a randomly chosen site.Noting that
E(c) = n(L - j + 1) P(recognition sequence),
we haveP(monomorphic site) = nE(-)
[2]
[3]
6329
The publication costs ofthis article were defrayed in part by page chargepayment. This article must therefore be hereby marked "advertise-ment" in accordance with 18 U. S. C. §1734 solely to indicate this fact.
Proc. NatL Acad. Sci. USA 78 (1981)
Replacing the expectations by their observed values gives theestimator
P(monomorphic site) = ( k) [41
For a heuristic interpretation of this estimator, note that it isthe proportion of all cuts in the sample that occurred in mono-morphic sites. A special case of Eq. 4 was given by Nei and Li(8), (their [10] corrected by changing "xx" to "nx").To estimate the polymorphism, p, at single positions, one
possibility suggested by previous authors (7, 8) is to use
HeterozygosityIf the n sequences come from a random sample of individualsin the population, we may estimate the heterozygosity in thepopulation. Let vi represent the true frequency in the popu-lation of the recognition sequence at site i. Then by an as-sumption similar to Eq. 1 we write
from the assumption that each position is independent of itsneighbors. When the experiment includes several enzymeswith various lengths of recognition sequences, some weightedaverage of the estimates from Eq. 5 must be used (8). A rea-sonable alternative suggested by Ewens et al. (11) is to asumethat a given site may be polymorphic at no more than one of itsj positions. With this assumption, p may be estimated by P(po-lymorphic site)/j, or
c- n(m- k) [6]ic
P(homozygous site) = E(c)Noting that
7,li2=E I~(Cj- 1)1
[ n(n- 1)]
from p. 69 of ref. 12, and replacing expectations by their ob-served values, leads to the estimator
P(homozygous site) = lcj(c( - 1)C(n -1) [9]
Finally, if we assume as before that a given site may be het-erozygous at no more than one position so that
The interpretation of Eq. 6 is seen by noting that the nu-merator is the total number of cuts at or near polymorphic po-sitions, and the denominator is the total number of positions inthe sample recognized by the endonuclease. This estimator hasthe advantage of being easily extended to several endonu-cleases. The same formula may be used with c, m, and k beingsummed over all enzymes, andj redefined as the average lengthof recognition sequences weighted by the total number of cutsmade by each enzyme. The interpretations of the numeratorand denominator are thus preserved.When A is used to measure genetic divergence between two
genomes, it is an estimate ofthe proportion ofbase mismatches.If the n segments are taken from a larger population, p must beinterpreted as an estimate of the frequency of polymorphismonly in the sample at hand; it does not estimate polymorphismin the population as a whole. However, under the Wright-Fishermodel of random sampling with mutation but no selection, pmay be used in estimating population parameters. Thus, by thearguments of Ewens et al. (11), the quantity P/ln n estimateso = 4Nu at equilibrium, in which N is the diploid populationnumber and u is the mutation rate.
Ewens et al. also showed that, under this model, the expectedvalues of c, m, and k should be related at equilibrium in sucha way that
P= kg~' [7]
and they suggest using this relationship to estimate p and re-lated quantities. However, Eq. 6 might be considered prefer-able because it is free ofassumptions concerning the population.To compare Eq. 6 with approximation 7, note that in the specialcase of n = 2, the variables c, m, and k are constrained by theidentity c = 2m - k irrespective ofour assumptions concerningthe structure of the population. Thus Eq. 6 becomes
Ak
P 2jm- kj' [8]
implying that 7 is a reasonable approximation when k << m,even though Ewens's approximation requires moderately largevalues of n.
H = P(heterozygous site)/j
is the heterozygosity per position, we have the estimatornc - 1)
jc(n -1)
[10]
[11]
This estimator requires no specific population genetic model.Furthermore, Eq. 10 is true under the stated assumption re-gardless of whetherj refers to a single enzyme or to an averageweighted by number of cuts over a heterogeneous series of en-donucleases. This is because j measures the expected numberof positions per recognized site in both cases. Therefore, theestimator 11 may be applied directly when several enzymes areused.When n = 2, heterozygosity and polymorphism have the
same meaning, and we should expect H to be equal to f. Thisequality is readily demonstrated by substituting n = 2, c = 2m- k, and E c2 = 4m - 3k into Eqs. 6 and 11. The last substi-tution comes from setting ci = 1 for k of the cleavage sites andci = 2 for the rest.DNA fragment lengthsIn the above discussions, I assumed that the number of cuts ateach cleavage site had been determined from the resulting frag-ment lengths. This determination is often possible even withoutconstructing the entire restriction map. For example, Brown(5) was able to interpret each of59 distinct fragment length pat-terns as single changes (gains or losses ofa recognition sequence)relative to a "typical" pattern for each enzyme without knowl-edge of the sequential order of the fragments. However, pub-lished data are often given as fragment lengths only (4), and thenumbers of cuts can only be estimated. This situation usuallyarises when comparing two sequences (the case of n = 2), andthat is the only case considered here.
Suppose F is the total number offragments seen in both DNAsegments, and G is the number of pairs offragments with iden-tical lengths, and thus assumed to be homologous in the twosegments. The problem is to estimatemand kfrom the observedF and G. We may reduce this problem to the estimation of kalone by noting the relationship
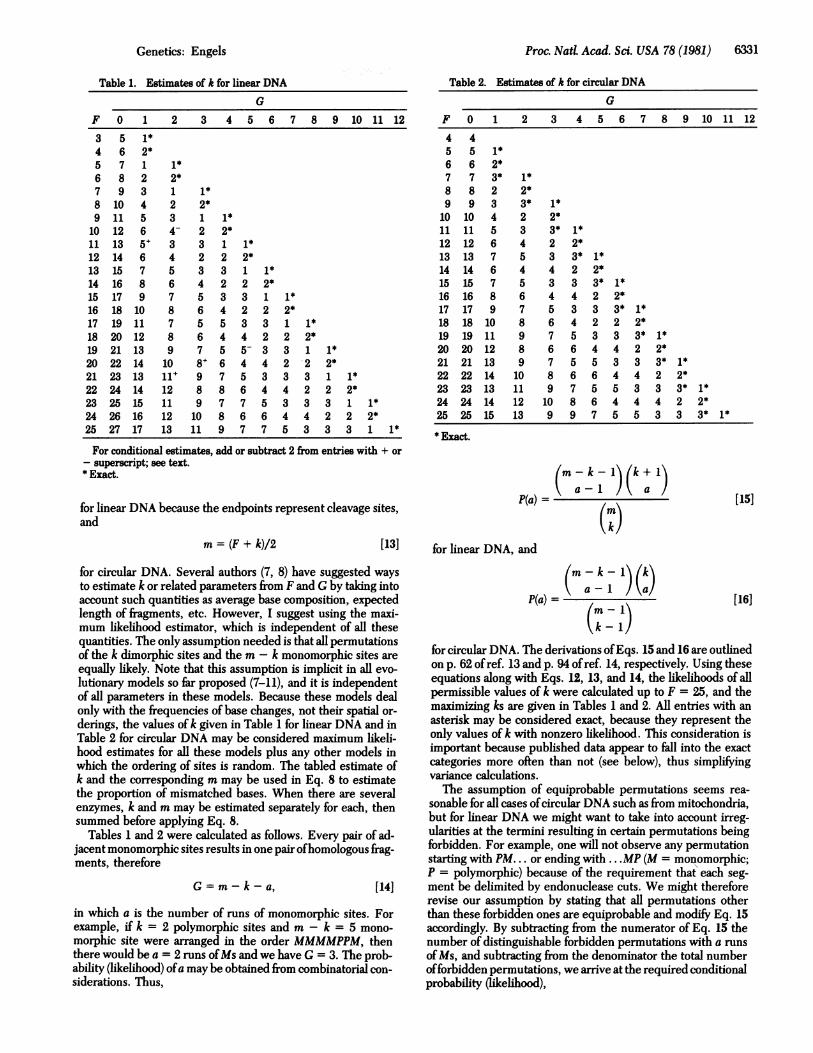
For conditional estimates, add or subtract 2 from entries with + or- superscript; see text.* Exact.
for linear DNA because the endpoints represent cleavage sites,and
m = (F + k)/2 [13]
for circular DNA. Several authors (7, 8) have suggested waysto estimate k or related parameters from F and G by taking intoaccount such quantities as average base composition, expectedlength of fragments, etc. However, I suggest using the maxi-mum likelihood estimator, which is independent of all thesequantities. The only assumption needed is that all permutationsof the k dimorphic sites and the m - k monomorphic sites are
equally likely. Note that this assumption is implicit in all evo-
lutionary models so far proposed (7-11), and it is independentof all parameters in these models. Because these models dealonly with the frequencies of base changes, not their spatial or-
derings, the values of k given in Table 1 for linear DNA and inTable 2 for circular DNA may be considered maximum likeli-hood estimates for all these models plus any other models inwhich the ordering of sites is random. The tabled estimate ofk and the corresponding m may be used in Eq. 8 to estimatethe proportion of mismatched bases. When there are severalenzymes, k and m may be estimated separately for each, thensummed before applying Eq. 8.
Tables 1 and 2 were calculated as follows. Every pair of ad-jacent monomorphic sites results in one pair ofhomologous frag-ments, therefore
G = m-k-a, [14]
in which a is the number of runs of monomorphic sites. Forexample, if k = 2 polymorphic sites and m - k = 5 mono-
morphic site were arranged in the order MMMMPPM, thenthere would be a = 2 runs ofMs and we have G = 3. The prob-ability (likelihood) ofa may be obtained from combinatorial con-
siderations. Thus,
[15]
(m-k-I (k+I1
P(a) =(mv
[16]
for circular DNA. The derivations ofEqs. 15 and 16 are outlinedon p. 62 ofref. 13 and p. 94 ofref. 14, respectively. Using theseequations along with Eqs. 12, 13, and 14, the likelihoods of allpermissible values of k were calculated up to F = 25, and themaximizing ks are given in Tables 1 and 2. All entries with an
asterisk may be considered exact, because they represent theonly values of k with nonzero likelihood. This consideration isimportant because published data appear to fall into the exactcategories more often than not (see below), thus simplifyingvariance calculations.The assumption of equiprobable permutations seems rea-
sonable for all cases ofcircular DNA such as from mitochondria,but for linear DNA we might want to take into account irreg-ularities at the termini resulting in certain permutations beingforbidden. For example, one will not observe any permutationstarting with PM... or ending with ... .MP (M = monomorphic;P = polymorphic) because of the requirement that each seg-ment be delimited by endonuclease cuts. We might thereforerevise our assumption by stating that all permutations otherthan these forbidden ones are equiprobable and modify Eq. 15accordingly. By subtracting from the numerator of Eq. 15 thenumber of distinguishable forbidden permutations with a runsofMs, and subtracting from the denominator the total numberofforbidden permutations, we arrive at the required conditionalprobability (likelihood),
Recomputing Table 1 by using Eq. 17 resulted in only minorchanges. Thus five entries were increased or decreased by 2 asindicated in Table 1 (superscript + or -, respectively). Notealso that the diagonal outcomes in which G = (F - 1)/2 are nolonger possible. Other minor irregularities at the termini suchas the ambiguous sequences MPM... and PPM... might alsobe considered, but they occur even less frequently than the onesconsidered above and are likely to have less effect.
STATISTICAL PROPERTIES OF THE ESTIMATORSThe statistics p and A have no true moments because the ob-servation c = 0 has positive probability, and c appears in thedenominators ofboth expressions. However, for statistical pur-poses in the discussion below, I refer to the conditional distri-butions given c # 0. The variance estimators thus derived maybe used as approximations, provided the observed c is not tooclose to zero. First, note that neither A nor H is unbiased, be-cause they come from the ratio of two expectations. The meansquared error ofthese statistics about their true values is there-fore partly from this bias, and the rest is due to sampling error.The sampling error is probably more important, and its esti-mation is considered in this section. Of course, the meaning ofsampling variance depends on a scheme for creating hypothet-ical repetitions ofthe experiments. In the following calculationsI will consider the true values ofp andH to be parameters ratherthan variables. Thus the resulting variances are statistical sam-pling variances measuring the precision with which we knowthese parameters. They do not measure the variation in thesevalues that would result from a hypothetical repetition of theevolutionary process that generated them.
Genetic Divergence (n = 2). Consider two fixed genomesfor which Eq. 8 was used to estimate the proportion of mis-matched bases. To repeat the experiment with the same twogenomes, one could use a different set of restriction endonu-cleases, or move to a different part of the genome. Either way,the numbers ofmonomorphic and dimorphic cleavage sites canbe expected to approximate two independent Poisson distri-butions. Thus the large-sample variance estimate is
V(Pi a) V(k) + [a(-k]v(m - k).
Differentiating Eq. 8 and using the observed values of k andm - k as estimators of their respective variances yields
A 4km2 - 4k m4P2 -k2m
= 1k(1- k2) [18]
P2/k.
This variance applies when k is determined directly, or whenit comes from one ofthe asterisk-labeled entries ofTables 1 and2.The variance calculated by Nei and Li (8) for this situation
is not a measure of the precision with which we know p for aparticular pair ofgenomes. Instead, it is the variance that wouldresult if"repetition" ofthe experiment meant returning the two
genomes to their common ancestral state and allowing them todiverge again at random. To see the difference between thesetwo variances, note that under Nei and Li's repetition scheme,we expect k and m - k to be negatively correlated because thenumber of common ancestral restriction sites is assumed con-stant. However, with the scheme suggested here, the numberof monomorphic, dimorphic, and noncleavage sites come froma trinomial distribution with index L - j + 1. Because the greatmajority of sites are noncleavage, the covariance betweenmonomorphic and dimorphic cleavage sites will be negligible,and independent Poisson distributions will be approximated.
Genetic Variability. Another way to define repetition of theexperiment applies when one estimates genetic variabilitywithin a population. The experiment is repeated by drawinganother random sample of n homologous segments from thepopulation and treating them with the same set of enzymes.Thus ci will be binomially distributed with parameter iri andindex n. It is necessary to assume linkage equilibrium in thepopulation so that these binomial distributions will be inde-pendent. Ofcourse, this assumption can neverbe precisely truebecause each site overlaps with 2j - 2 of its neighbors. How-ever, for most real data, L >> m so that the probabilty of over-lapping cleavage sites is negligible.The standard large-sample approximation to the variance of
p may be written as12 2
aV m-k)V(M -k) + ki1(c)[~ Ia+ 2[ d(d-k) a Cov(c,m-k), [19]
in which all derivatives are evaluated at the mean values, Tm,c, and k. To determine the variances and covariances, let ai bea random variable that takes the value 1 if ci = n, and 0 oth-erwise. Now, m - k = ia,, and by our assumption of linkageequilibrium,
Similarly,
and
V(m - k) = EV(aj = >i (1 - ei )i i
V(c) = EV(cj = Jnslr.l - lrei i
Cov(c, m - k) = > Cov(ci, ad = > nwi' (1 - rD.i i
Making these substitutions and differentiating in Eq. 6 leadsto
V(P) = E( l(,-(
+ n(mh - k~),il -1rih(m- k_ 2w-i)). [20]
Finally, the maximum likelihood estimate ofV(O) is obtained byreplacing mh, e, k, and 'ri by their respective maximum likeli-hood estimators, m, c, k, and c/n. For computational purposes,note that there are L - j + 1 terms in the summation in ap-proximation 20, but that only k of them, corresponding to thepolymorphic sites, are nonzero.
The situation is somewhat more complicated when severalendonucleases with various lengths of recognition sequencesare involved. In this case, j must be treated as a random variablebecause it is an average value weighted by the numbers of cutswhich are themselves random variables. Therefore approxi-
6332 Genetics: Engels
Genetics: Engels
mation 20 should be expanded to include variance and covari-ance terms involvingj. In practice, however, these terms willbe negligible relative to the rest of the expression, and may besafely dropped. Thus, approximation 20 may still be used withj as the appropriate weighted average treated as a constant.A similar procedure may be applied to the heterozygosity.
Thus the large-sample approximation is( \ 2
acH
Differentiating Eq. 11 and substituting the observed value ofc, leads to the maximum likelihood estimator,
_ _ ~~2
>ci(n - c [2cci - c]2V(H) = j2n(n - 1)2c4 [21]
As in the previous case, the average length of the recognitionsequence may be treated as approximately constant when thereare several different endonucleases.
APPLICATIONS AND DISCUSSIONGenetic Variability. Brown (5) studied human mitochondrial
DNA in 21 individuals with seven tetranucleotide restrictionenzymes. From his tables 2 and 3, we see that there were m= 244 cleavage sites, of which k = 45 were polymorphic. Thetotal number of cuts was c = 4672, and the frequency of poly-morphism may thus be estimated at P = 0.0264 from Eq. 6 withstandard error 0.0015 from approximation 20. Note that a verysimilar estimate of p (0.0231) is obtained from approximation7 by the method ofEwens et at (11). Under the Wright-Fishermodel with neutral mutations, these estimates correspond too = p/ln(21) _0.0087. It should be noted thatfor mitochondrialDNA, 0 must be defined as Nu rather than 4Nu because eachindividual may be considered haploid, and only femalesreproduce.We may also use Brown's data to estimate heterozygosity. Of
course there are no true heterozygotes for mitochondrial DNA,but H is still meaningful as a measure of genetic variability.Thus, using Brown's tables 2 and 3 to obtain all ci values forpolymorphic sites, we have H = 0.0034 with standard error0.0004 from Eqs. 11 and 21. This value is close to Nei and Li's(8) measure of "nucleotide diversity" as calculated by Brown.The latter is an unweighted average of all pairwise estimates ofp, and is expected to be close to H in their model.From comparisons between observations like these and anal-
ogous measurements for nuclear DNA, several authors (2, 8)have noted that mitochondrial DNA tends to be more variable.For example, the value of 0 calculated above for human mito-chondria is approximately 35 times the estimate ofNu by Ewenset aL (11) from Jeffreys's (3) restriction endonuclease study ofhuman chromosomal DNA. The only apparent exception comesfrom the study by Shah and Langley (15), who found that 6 wasapproximately equivalent in Drosophila mitochondrial and nu-clear DNA. These authors took into account the factor of2 fromhaploidy, but they failed to consider the other factor of 2 re-sulting from cytoplasmic inheritance. With this correction, thedata of Shah and Langley become qualitatively consistent withthe other studies.
Estimating k from Fragment Lengths. The maximlm like-lihood method for estimating k may be applied to the data infigure 1 of Avise et al. (4), in which mitochondrial DNA fromgophers produced eight fragment-length patterns when di-gested with the endonuclease HincII. For each of the 24 pairsof patterns, Table 2 provides an estimate of the number of di-
Proc. NatL Acad. Sci. USA 78 (1981) 6333
morphic cleavage sites. For all but 10 ofthese comparisons, thisprocedure yields the exact value ofk. The comparison ofpattern"M" with "O" is one example in which k is not known exactly.Here F = 14, G = 4, and the only allowable values of k are 2with likelihood 0.714, and 4 with likelihood 0.071. Therefore,the estimate is k = 2 as given in Table 2, which corresponds top = 0.036 from Eqs. 8 and 13. The alternative procedure sug-gested by Nei and Li (8) yields for this case k = 2.47 and thusI = 0.044.
Genetic Divergence. Ideal data for demonstrating the useof Eqs. 8 and 18 for estimating genetic divergence were pro-vided by Shen et aL (16), who obtained the entire sequence ofhuman Ay and Gy globin genes and the surrounding areas. Thisregion contains a tandem duplication of approximately 5000bases that have diverged in evolutionary time. As a thoughtexperiment to demonstrate the method, the cleavage sites ofeach of 18 hexanucleotide restriction enzymes were read di-rectly from the sequence. Any two cuts were considered ho-mologous if their separation fell within ±50 nucleotides of thelength of the duplication. The procedure yielded m = 45 andk = 32, and the estimated frequency of mismatches was f) =0.092 from Eq. 8. This estimate agrees well with the true value,0.094, obtained directly from the sequence. The standard errorfrom Eq. 18 was 0.016.
These data also illustrate an important defect inherent in theuse of these techniques, which deal only with base substitu-tions. By comparing the Ay and GY sequences, it was clear thatmuch ofthe divergence was due to small insertions or deletionsin addition to base substitutions (16). In extreme cases, suchchanges can result in sufficient alterations of fragment lengthsthat some homologous sites will appear to be nonhomologous.This situation would result in p and H being overestimates.However, despite this defect, the use of restriction endonu-cleases along with the empirical estimation procedures pre-sented here might prove to be a useful method for studyinggenetic differences in regions of the genome not accessible inother ways.
I thank W. J. Ewens for providing the initial motivation for this work.Comments and suggestions came from W. J. Ewens, C. Denniston, andJ. F. Crow, and unpublished work was made available by W. J. Ewens,M. Nei, and F. Tajima. This is paper number 2495 from the Laboratoryof Genetics, University of Wisconsin. It was supported by Grant GM27867 from the National Institutes of Health.
1.
2.
3.4.
5.6.
7.8.
9.10.11.
12.
13.
14.
15.
16.
Wright, S. (1978) Evolution and the Genetics of Populations(Univ. Chicago Press, Chicago), Vol. 4.Brown, W. M. & Wilson, A. C. (1979) Proc. NatL Acad. Sci. USA76, 1967-1971.Jeffreys, A. J. (1979) Cell 18, 1-10.Avise, J. C., Giblin-Davidson, C., Laerm, J., Patton, J. C. &Lansman, R. A. (1979) Proc. Natl Acad. Sci. USA 76, 6694-6698.Brown, W. M. (1980) Proc. Natl Acad. Sci. USA 77, 3605-3609.Botstein, D., White, R. L., Skolnick, M. & Davis, R. W. (1980)Am. J. Hum. Genet. 32, 314-331.Upholt, W. B. (1977) Nucleic Acids Res. 4, 1257-1265.Nei, M. & Li, W.-H. (1979) Proc. Natl Acad. Sci. USA 76,5269-5273.Kaplan, N. & Langley, C. H. (1979)J. Mol EvoL 13, 295-304.Nei, M. & Tajima, F. (1981) Genetics 97, 145-163.Ewens, W. J., Spielman, R. S. & Harris, H. (1981) Proc. NatlAcad. Sci. USA 78, 3748-3750.Kendall, M. G. & Stuart, A. (1977) The Advanced Theory of Sta-tistics (Macmillan, New York), 45th Ed., Vol. 1.Feller, W. (1968) An Introduction to Probability Theory and ItsApplications (Wiley, New York), 3rd Ed., Vol. 1.David, F. N. & Barton, D. E. (1963) Combinatorial Chance(Griffin, London).Shah, D. M. & Langley, C. H. (1979) Nature (London) 381,696-699.Shen, S., Slightom, J. L. & Smithies, 0. (1981) Cell, in press.