22
A first estimate of LCD by gender (Uruguay) Marisa Bucheli Cecilia González dECON, FCS, Udelar
| Date post: | 14-Dec-2015 |
| Category: |
Documents |
| Upload: | jordy-paynter |
| View: | 213 times |
| Download: | 0 times |

A first estimate of LCD by gender (Uruguay)
Marisa BucheliCecilia González
dECON, FCS, Udelar

• In Uruguay we are doing NTA by SES
• We have estimations of labor income, consumption, LCD and public transfers
• We have preliminary estimations of RA and private transfers
• We recently began to think of doing estimations by gender
• We have not worked on unpaid activities

NTA by SES groups
• To my best knowledge, in the Latin American team we used (at least at the beginning) different procedures for estimation
• In our case, we have estimations basead on two differente procedures (the one we used at the beginning and the proposed late by CELADE)
• But we have not compared the sensitivity of the results to the procedures

First procedure
• We estimate the profiles (mean and smooth mean) as usual but for each SES group separately
• Note that all members of the hh belong to the same group so the only challenge is define groups with a “good” size in all ages
• We estimate the aggregated value (AV) of each group (g) and age (a), where P is the population and XS is the smooth microdata value:
• The Total AV is the sum of the Total AV of groups

First procedure
• In order to calculate the formula, we need to know the population of each age-group
• We estimate it using its proportion in the survey
• Note: in the definition of the classification, we took into account (¿?) the size of the age-group population in the survey

Second procedure
• We estimate the total AV of each group using the weight of the group in the microdata
• We estimate the total AV of the age-group using the weight of the age-group in the microdata (X is the mean value in the microdata):
• We estimate the mean value as AV of the age-group / Population in the age-group
• In the analysis of the data we work with five-year-age group

Up to now…
• We have a complete NTA estimation (though a preliminary version particularly of private transfers and RA) following the first procedure (using the “educational level of the hh adults” as the proxy of SES)
• Many challenges: 1) ¿inter-hh transfers?; 2) public RA; ….
• We have estimations of labor income, consumption and public transfers following the second procedure (using the “educational level of the hh head 2” as the proxy of SES)

NTA by gender
• Our first idea was to follow the first procedure to estimate NTA by gender
• Two differences:
• In the gender classification we know the population of each age-group. We used it
• In the SES classification, all the members of a hh belong to the same group. In the classification by sex, it is possible that members of the same hh belong to a different group
• This issue is not important in the estimation of accounts for which we have individual information in the surveys: labor income, some components of private consumption, public inflows and some public outflows

0,E+00
5,E+04
1,E+05
2,E+05
2,E+05
3,E+05
3,E+05
4,E+05
0 3 6 9 121518212427303336394245485154576063666972757881848790
Labor income (smooth mean)
women
men
0,E+00
1,E+06
2,E+06
3,E+06
4,E+06
5,E+06
6,E+06
7,E+06
0 3 6 9 121518212427303336394245485154576063666972757881848790
Labor income (aggregate value)
women
men

0,E+00
5,E+03
1,E+04
2,E+04
2,E+04
3,E+04
3,E+04
4,E+04
0 3 6 9 121518212427303336394245485154576063666972757881848790
Public consumption (smooth mean)
women
men
0,E+00
1,E+05
2,E+05
3,E+05
4,E+05
5,E+05
6,E+05
7,E+05
8,E+05
9,E+05
1,E+06
0 3 6 9 121518212427303336394245485154576063666972757881848790
Public consumption (aggregate value)
women
men

0
2.000
4.000
6.000
8.000
10.000
12.000
1 5 9 13 17 21 25 29 33 37 41 45 49 53 57 61 65 69 73 77 81 85 89
Public health (smooth mean)
women
men
0,E+00
5,E+03
1,E+04
2,E+04
2,E+04
3,E+04
0 2 4 6 8 10 12 14 16 18 20 22 24 26 28 30 32 34
Public education (smooth mean)
women
men
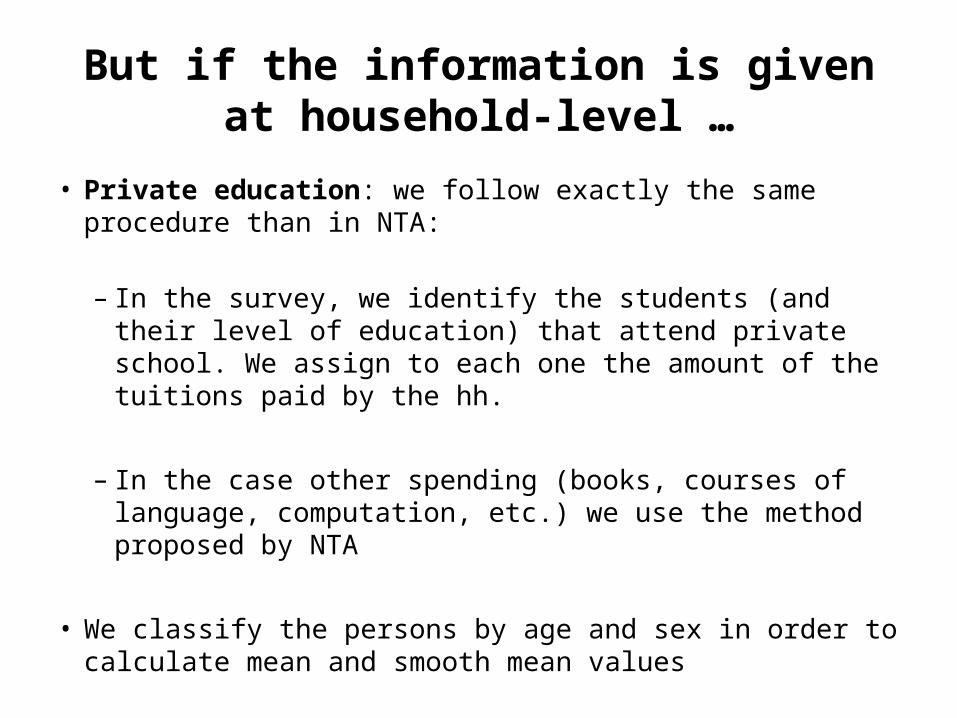
But if the information is given at household-level …
• Private education: we follow exactly the same procedure than in NTA:
– In the survey, we identify the students (and their level of education) that attend private school. We assign to each one the amount of the tuitions paid by the hh.
– In the case other spending (books, courses of language, computation, etc.) we use the method proposed by NTA
• We classify the persons by age and sex in order to calculate mean and smooth mean values

0
5.000
10.000
15.000
20.000
25.000
1 3 5 7 9 11 13 15 17 19 21 23 25 27 29 31 33 35
Private education (smooth mean)
women
men
0
5.000
10.000
15.000
20.000
25.000
30.000
35.000
40.000
1 3 5 7 9 11 13 15 17 19 21 23 25 27 29 31 33 35
Education (smooth mean)
women
men
The difference is due to spending not related to attendance (apparently, to “enseñanza no curricular” -language, computation, special teachers, etc.-)
¿Is it the method? ¿Should we take into account the sex-composition of the hh when we have to assign spending informed at hh level?

But if the information is given at household-level …
• This is the case of most of the private consumption and indirect taxes

But if the information is given at household-level …
• Private health: we follow exactly the same procedure than in NTA:
– In the survey, we identify the persons who were ill. We assign to each one the amount of the spending related to be ill.
– In the case other spending we use the method proposed by NTA
• We classify the persons by age and sex in order to calculate mean and smooth mean values

0
5.000
10.000
15.000
20.000
25.000
30.000
1 5 9 13 17 21 25 29 33 37 41 45 49 53 57 61 65 69 73 77 81 85 89
Private health (smooth mean)
women
men
0
5.000
10.000
15.000
20.000
25.000
30.000
35.000
40.000
1 5 9 13 17 21 25 29 33 37 41 45 49 53 57 61 65 69 73 77 81 85 89
Health (smooth mean)
women
men
We do not know which components explain the increasing gap
We should explore if it is due to a component assigned to an individual through an indirect method (not an ill-related component)

But if the information is given at household-level …
• Rest of private consumption: we follow exactly the same procedure than in NTA:
– We used an equivalence scale to calculate the rest of private consumption per hh member
– We assigned to each individual of the hh the same amount
• We classify the persons by age and sex in order to calculate mean and smooth mean values

0100002000030000400005000060000700008000090000
100000
1 5 9 13 17 21 25 29 33 37 41 45 49 53 57 61 65 69 73 77 81 85 89
Rest of private consumption (smooth mean)
women
men
0
20.000
40.000
60.000
80.000
100.000
120.000
1 5 9 13 17 21 25 29 33 37 41 45 49 53 57 61 65 69 73 77 81 85 89
Private consumption (smooth mean)
women
men

0,E+00
2,E+04
4,E+04
6,E+04
8,E+04
1,E+05
1,E+05
1,E+05
0 3 6 9 121518212427303336394245485154576063666972757881848790
Consumption (smooth mean)
women
men
0,E+00
5,E+05
1,E+06
2,E+06
2,E+06
3,E+06
3,E+06
0 3 6 9 121518212427303336394245485154576063666972757881848790
Consumption (aggregate value)
women
men

-3,E+05
-2,E+05
-2,E+05
-1,E+05
-5,E+04
0,E+00
5,E+04
1,E+05
2,E+05
0 3 6 9 121518212427303336394245485154576063666972757881848790
LCD (smooth)
women
men
-5,E+06
-4,E+06
-3,E+06
-2,E+06
-1,E+06
0,E+00
1,E+06
2,E+06
3,E+06
4,E+06
0 3 6 9 121518212427303336394245485154576063666972757881848790
LCD (aggregate value)
women
men

Some questions
• We would like to know more about the gender difference in the private health and private education.
• Are they sensitive to the method of allocation of spending informed at household level?
• If there is a gender difference in private / health education, should we use the traditional method of imputation of the rest of private consumption?
• Another challenge: private transfers
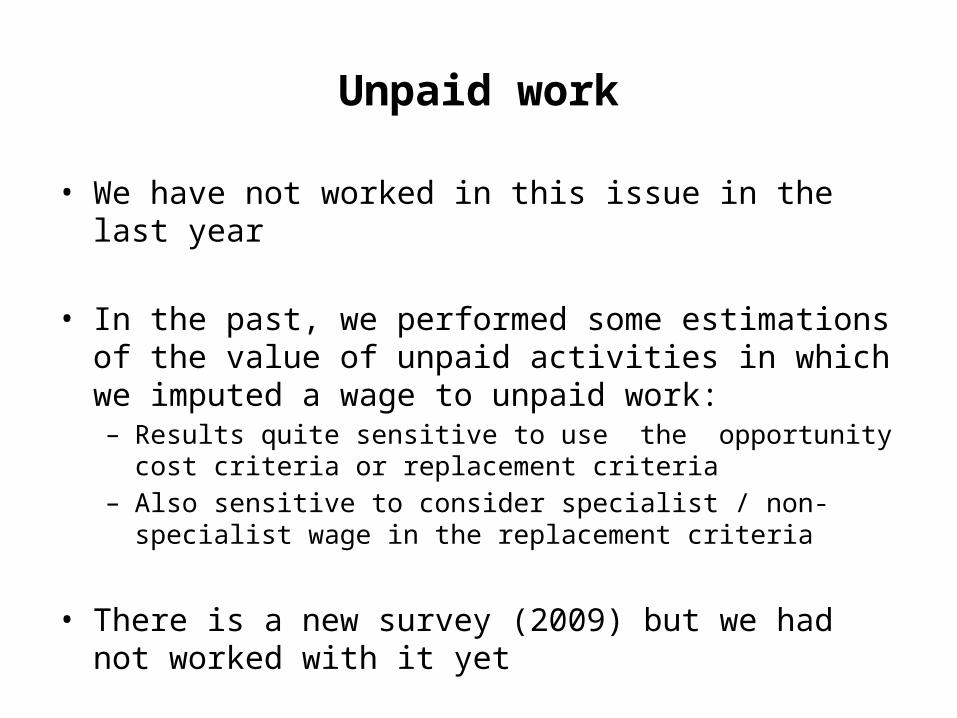
Unpaid work
• We have not worked in this issue in the last year
• In the past, we performed some estimations of the value of unpaid activities in which we imputed a wage to unpaid work: – Results quite sensitive to use the opportunity cost criteria or
replacement criteria– Also sensitive to consider specialist / non-specialist wage in the
replacement criteria
• There is a new survey (2009) but we had not worked with it yet


