This PDF is a selection from an out-of-print volume from the National Bureau of Economic Research Volume Title: Population and Economic Change in Developing Countries Volume Author/Editor: Richard A. Easterlin, ed. Volume Publisher: University of Chicago Press Volume ISBN: 0-226-18027-1 Volume URL: http://www.nber.org/books/east80-1 Publication Date: 1980 Chapter Title: A Historical Perspective on Economic Aspects of the Population Explosion: The Case of Preindustrial England Chapter Author: Ronald Lee Chapter URL: http://www.nber.org/chapters/c9671 Chapter pages in book: (p. 517 - 566)
Transcript
This PDF is a selection from an out-of-print volume from the National Bureauof Economic Research
Volume Title: Population and Economic Change in Developing Countries
Volume Author/Editor: Richard A. Easterlin, ed.
Volume Publisher: University of Chicago Press
Volume ISBN: 0-226-18027-1
Volume URL: http://www.nber.org/books/east80-1
Publication Date: 1980
Chapter Title: A Historical Perspective on Economic Aspects of the PopulationExplosion: The Case of Preindustrial England
Chapter Author: Ronald Lee
Chapter URL: http://www.nber.org/chapters/c9671
Chapter pages in book: (p. 517 - 566)
9 A Historical Perspectiveon Economic Aspectsof the PopulationExplosion: The Case ofPreindustrial EnglandRonald Demos Lee
9.1 Introduction
The preindustrial context offers particular advantages for the study ofpopulation change and its consequences. Over the course of centuriesthe effects of population pressure on resources have a chance to emergeand to dominate the more transitory influences. And other sources oflong-run economic change, such as technology, capital accumulation,education, and institutional reorganization, were formerly weaker orabsent. Thus history may provide us with an actual ceteris paribus situation where statistical attempts to control for extraneous influences oncontemporary development have failed. Of course there is always therisk that changing circumstances may have rendered the lessons of history obsolete, but one has to start someplace; the drunk looks for hisdime under the lamppost, though he lost it down the street.
There have been many studies of the effects of population growth oneconomic development, but only a few of these studies are empirical.
Ronald Demos Lee is associated with the Department of Economics and thePopulation Studies Center, the University of Michigan.
This research was funded by NICHD grant HD 08586-03. I am very gratefulto Professor E. A. Wrigley and Professor R. Schofield of the Cambridge Groupfor the History of Population and Social Structure for making the aggregate parishdata set available to me. Philip Mirowski provided valuable research assistance atall stages of this project, and I also profited from his knowledge of English historyand his creative insights. Professors Gavin Wright, Gary Saxonhouse, C. K. Harley, and Albert Fishlow made helpful comments on earlier drafts. I am particularlyindebted to Professor Marc Nerlove for his detailed comments and his solutionsto some of the analytic problems.
517
518 Ronald Demos Lee
Theoretical studies, and the many simulation studies in the tradition ofthe classic work by Coale and Hoover (1958), can be queried on theirpremises (see Simon 1976). Cost-benefit studies of marginal lives, pioneered by Enke (1960), are empirical only in appearance; their resultscan actually be derived a priori for virtually any country, regardless ofits economic situation, as Ohlin (1969) has shown in an ingeniousarticle. l Cross-national studies, seeking correlations of population growthrates and growth rates of per capita income (see, e.g., Kuznets 1967;Chesnai and Sauvy 1973; Easterlin 1972) have invariably found nosignificant association. 2 Leff's (1969) well-known article on savingsrates and dependency rates has been so heavily criticized as to leave theresults in serious doubt. So although most economists and almost alldemographers believe high population growth rates are a problem, thereis a surprising shortage of empirical evidence. A study of the consequences of population change in a historical context may help demonstrate the importance of the variable in at least the simplest case.
Historical studies may also aid our understanding of the causes ofpopulation change. It is sometimes suggested that until a couple ofcenturies ago the size of human populations in relation to resources waseffectively regulated by socioeconomic institutions, but that in recenttimes these mechanisms have broken down under the influences of mortality decline, urbanization, technical change, and modernization in general. However, there is little understanding of how such mechanismsfunctioned in the past, how effective they were, and how they reactedto various kinds of external shocks. An examination of these historicalmechanisms should help us understand to what extent modern and historical experience differ qualitatively, and should provide some perspective on current high rates of population growth.
This paper has three major parts. The first discusses the consequencesof population change in preindustrial England, concentrating on wages,rents, and the ratio of industrial to agricultural prices. A simple twosector model is developed to organize the analysis. The second partdiscusses the cause of population change, focusing on the nature of thesocial mechanisms that controlled it and their reaction to variations inmortality and productivity. In the third part, a simple model of economic-demographic equilibrium is developed, in which steady shifts inlabor demand are the main determinant of sustained population growth,while the equilibrium living standards maintained during expansion result from the interplay of largely exogenous mortality and institutionallyregulated fertility. These three parts are followed by a brief summaryand conclusion. Appendixes describe the data sources and the formaldevelopment of the dual-sector model.
519 Perspective on Economic Aspects of the Population Explosion
9.2 Effects of Population Change
9.2.1 Overview
For those who care for the overmastering pattern, the elements areevidently there for a heroically simplified version of English historybefore the nineteenth century in which the long-term movements inprices, in income distribution, in investment, in real wages, and inmigration are dominated by changes in the growth of population.[Habakkuk 1965, p. 148]
This "heroically simplified version" of English history, which givesthe central role to population change, appears to be accepted by a majority of economic historians. And since there was a rough synchronismof changes in population, wages, rents, and industrial and agriculturalprices across Western Europe, many economic historians extend thesame argument to the Continent as well.3 The assertion is that whenpopulation grew, the additional labor that was applied to a relativelyfixed amount of land brought diminishing returns, leading to falling realwages and rising real rents. Since industry's main input was labor, industrial prices closely followed the real wage. Thus a large populationcaused low prices for industrial goods relative to agricultural ones. Since,however, total agricultural incomes rose with population, so did thedemand for industrial goods; thus industrial output-and with it urbanization-increased when population grew. This extension of the marketencouraged specialization and trade.
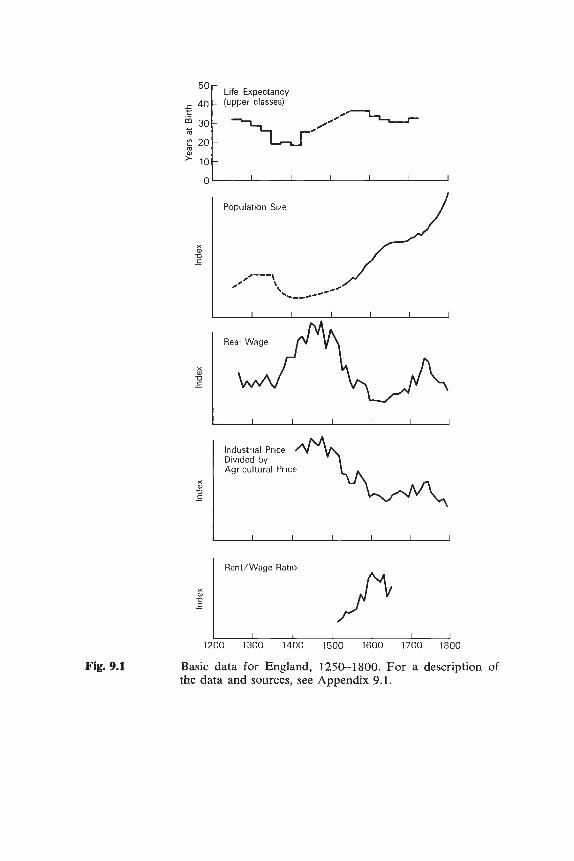
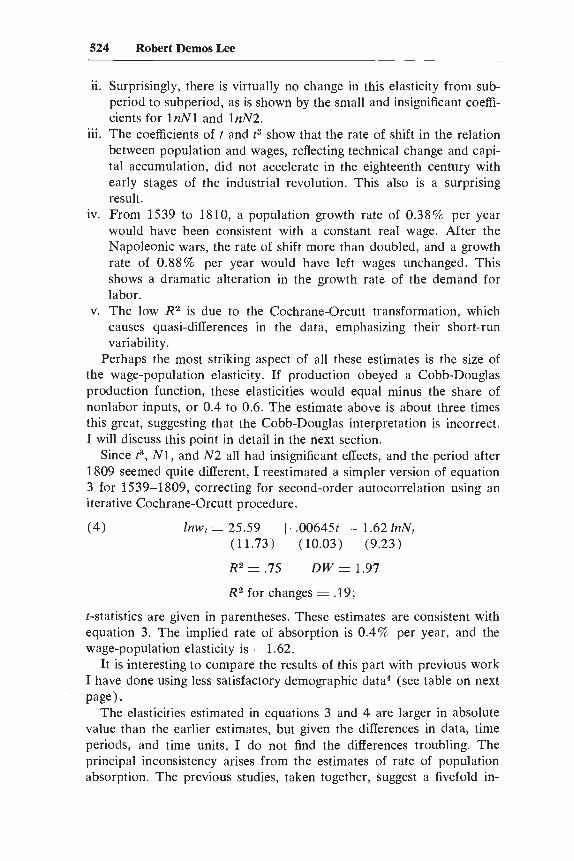
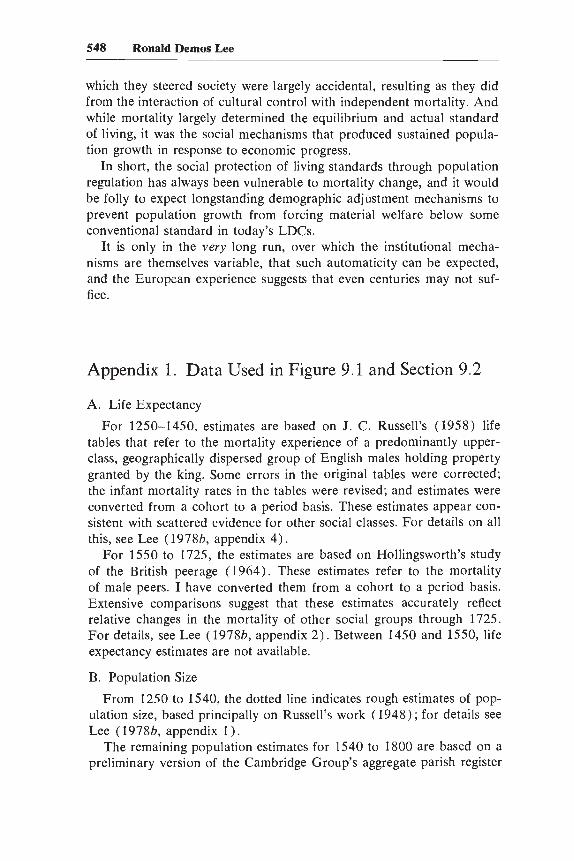
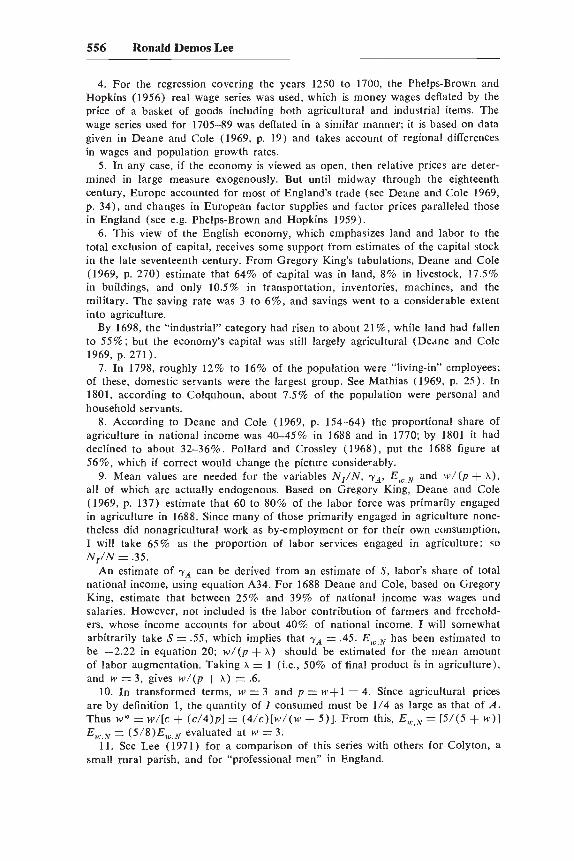
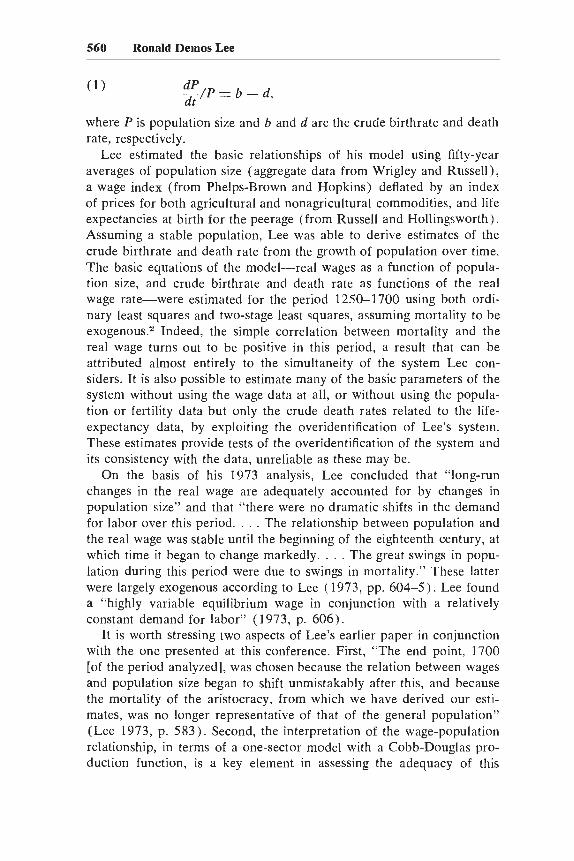
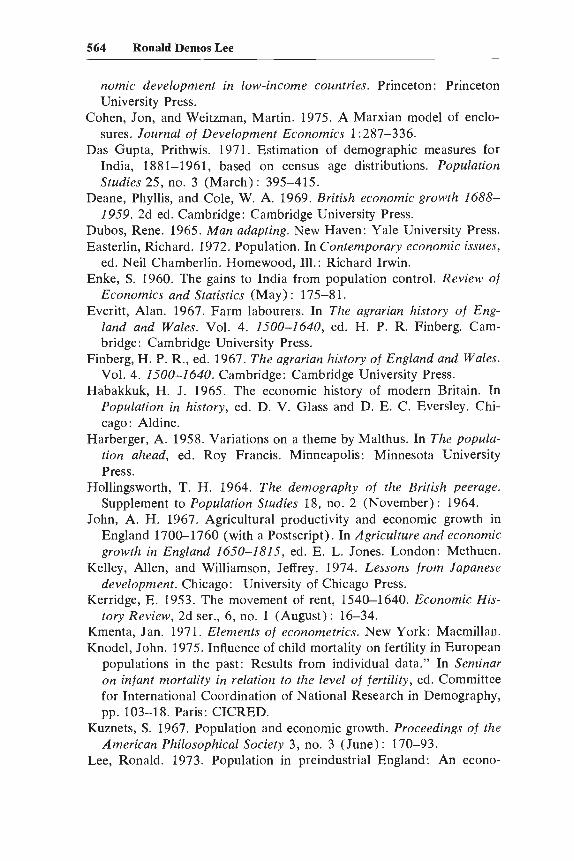
Figure 9.1 shows the basic data series for England over the period1250 to 1800. This analysis will focus on the latter part, from 1540 to1800, for which better data are available; however, the earlier data helpput this later period into perspective and strengthen the findings by suggesting their wider applicability. The data plotted in figure 9.1 are described in Appendix 9.1; however, the population series merits specialmention. It is based on data from 404 parishes, collected and aggregatedby the Cambridge Group for the History of Population and Social Structure. Although the population estimates used here are still preliminary,they are far superior to the demographic data previously available.
The series in figure 9.1 shows that the population-induced changesin the preindustrial economy were not trivial; rather, they were of fundamental importance to the people of the time. For example, the segment of society dependent primarily on wage income was comfortablyoff at the end of the fifteenth century; after a century of populationgrowth their wages had fallen by 60% and their situation was desperate.Landlords were enriched over this period; industry grew rapidly; andindustrial prices plummeted in relation to agricultural prices.
Life Expectancy(upper classes)
--,.... - .../~~......
50
.c 40tiii 30:;;V> 20
~ 10
O'---~---'--_.L-_---I._--'-----'
Population Size
x
'""0E
x'""0E
Industrial PriceDivided byAgricultural Price
x'""0E
Rent/Wage Ratio
x
'""0E
1200 1300 1400 1500 1600 1700 1800
Fig. 9.1 Basic data for England, 1250-1800. For a description ofthe data and sources, see Appendix 9.1.
521 Perspective on Economic Aspects of the Population Explosion
9.2.2 Population and Wages
Before developing and estimating the dual-sector model, I will examine the relation between population and wages in a simpler context.This will allow me to use annual data and to develop results comparableto my earlier work.
The wage is of interest because it reflects the marginal product oflabor throughout the economy. It is also of interest because it representsthe chief source of income for a large and growing segment of the population, rising from about 30% in rural areas in the sixteenth century toabout 50% in 1700, and perhaps 75% in 1800 (Everitt 1967, pp. 39799). While the wages of labor varied by skill and location, the variouswage rates seem to have maintained rather fixed ratios one to the other(see Finberg 1967, p. 599, and Phelps-Brown and Hopkins 1955), sothat a single wage can be used to represent changes over time in theexperience of most workers.
Under competitive conditions, the real wage is determined by theintersection of the schedules relating labor supply and demand to thereal wage. The labor demand schedule corresponds to the relation between the amount of labor utilized in the economy and its marginalproductivity. This will depend on available land, capital, and technology,among other things, and in England during this period it is reasonableto expect changes in these to have increased the demand for labor in acumulative manner. If the demand schedule shifts outward at a constantrate p, while maintaining its shape, then its position over time will beindexed by ePt•
Now consider labor supply. In the short run, the labor services provided by the population might depend positively or negatively on thereal wage, but there is no possibility of identifying such an effect empirically with these data. Over the longer run, the supply of labor variesroughly in proportion to population size, although the age-sex distribution of the population should also be taken into account.
The combined effects of the shifting supply and demand schedules onthe short-run equilibrium wage may be expressed as:
(1)
or, in log form, as:
(2) In Wt = p. + pt - 7JlnNt + fot.
If the the short-run labor supply schedule is inelastic to the wage, then7J measures the elasticity of the labor-demand schedule. The rate of shiftof labor demand is p; p. is a scale parameter; and fot reflects the influenceof climate and other omitted variables. The rate at which population
522 Robert Demos Lee
can grow without altering the wage, or the rate of population "absorption," is plY].
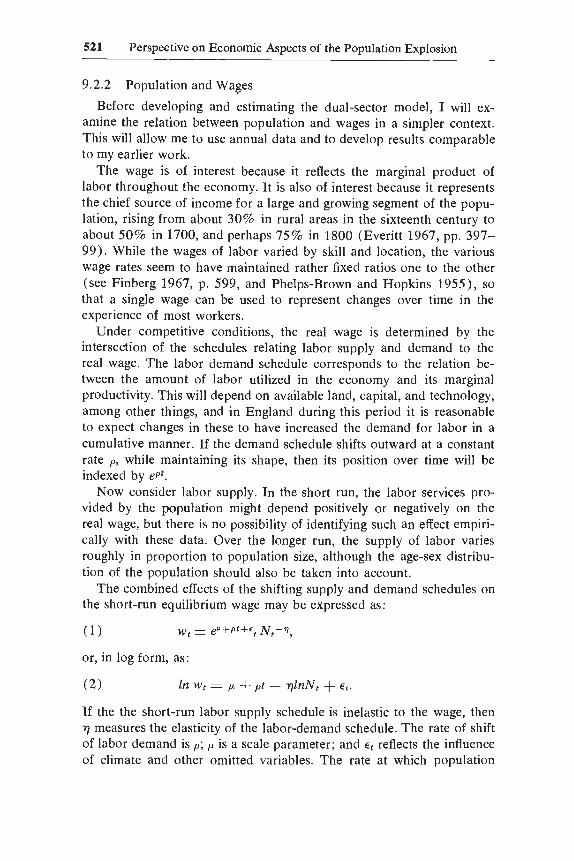
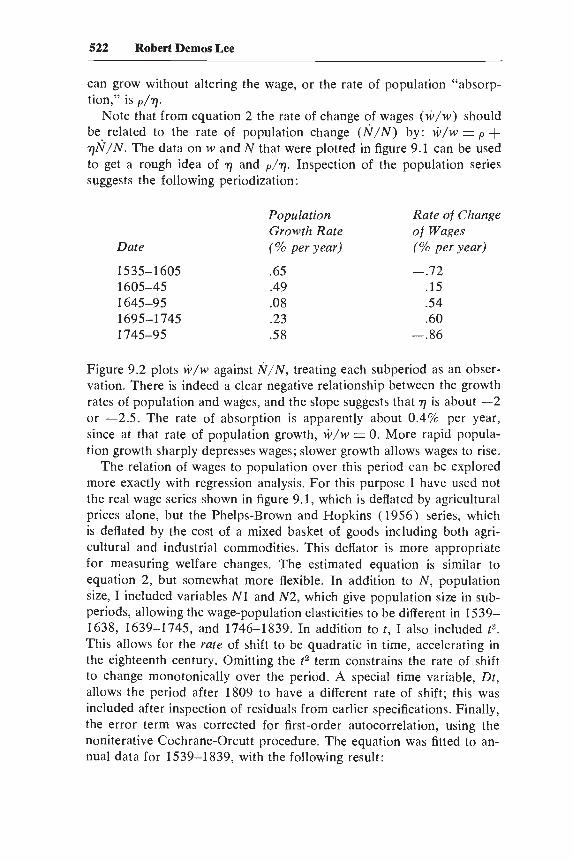
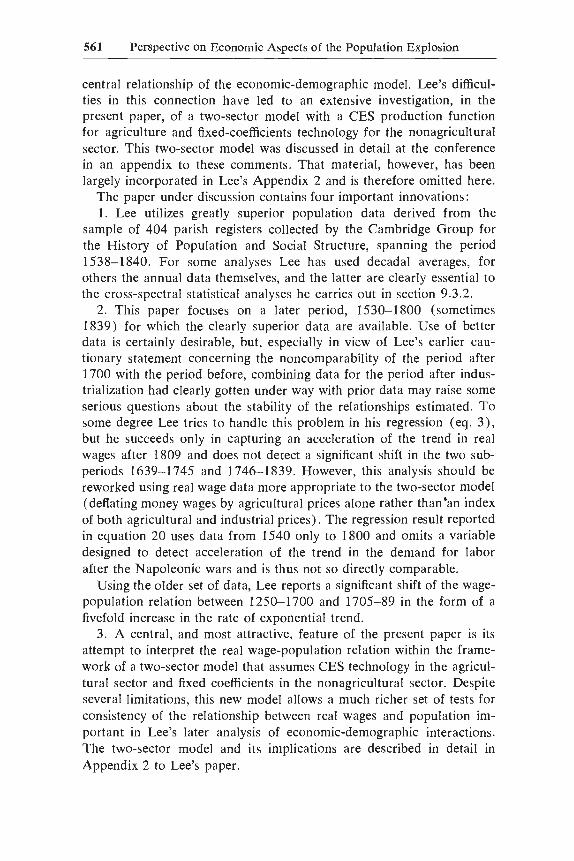
Note that from equation 2 the rate of change of wages (wlw) shouldbe related to the rate of population change (IVIN) by: wlw = p +'YJNI N. The data on wand N that were plotted in figure 9.1 can be usedto get a rough idea of 'YJ and pl'YJ' Inspection of the population seriessuggests the following periodization:
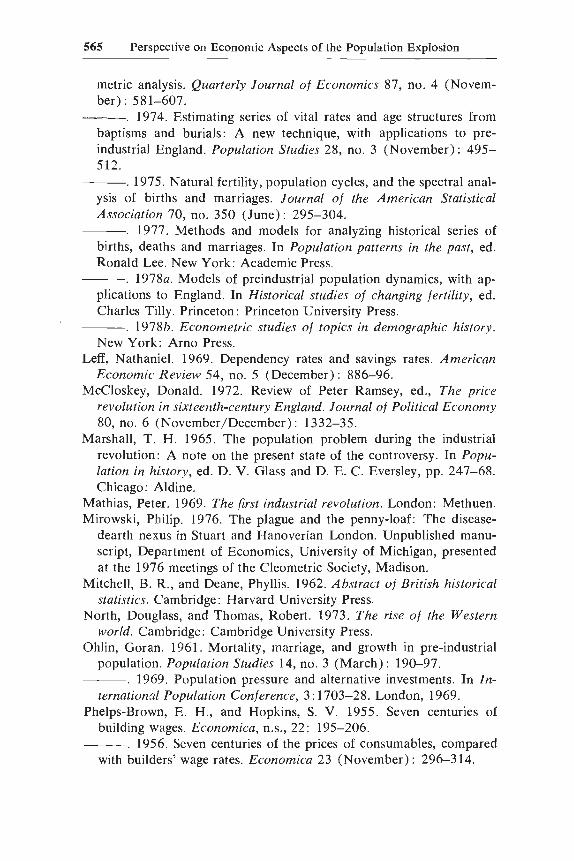
Figure 9.2 plots wlw against N/N, treating each subperiod as an observation. There is indeed a clear negative relationship between the growthrates of population and wages, and the slope suggests that 'YJ is about -2or -2.5. The rate of absorption is apparently about 0.4% per year,since at that rate of population growth, w/w = O. More rapid population growth sharply depresses wages; slower growth allows wages to rise.
The relation of wages to population over this period can be exploredmore exactly with regression analysis. For this purpose I have used notthe real wage series shown in figure 9.1, which is deflated by agriculturalprices alone, but the Phelps-Brown and Hopkins (1956) series, whichis deflated by the cost of a mixed basket of goods including both agricultural and industrial commodities. This deflator is more appropriatefor measuring welfare changes. The estimated equation is similar toequation 2, but somewhat more flexible. In addition to N, populationsize, I included variables Nl and N2, which give population size in subperiods, allowing the wage-population elasticities to be different in 15391638, 1639-1745, and 1746-1839. In addition to t, I also included t3 .
This allows for the rate of shift to be quadratic in time, accelerating inthe eighteenth century. Omitting the t2 term constrains the rate of shiftto change monotonically over the period. A special time variable, Dt,allows the period after 1809 to have a different rate of shift; this wasincluded after inspection of residuals from earlier specifications. Finally,the error term was corrected for first-order autocorrelation, using thenoniterative Cochrane-Orcutt procedure. The equation was fitted to annual data for 1539-1839, with the following result:
523 Perspective on Economic Aspects of the Population Explosion
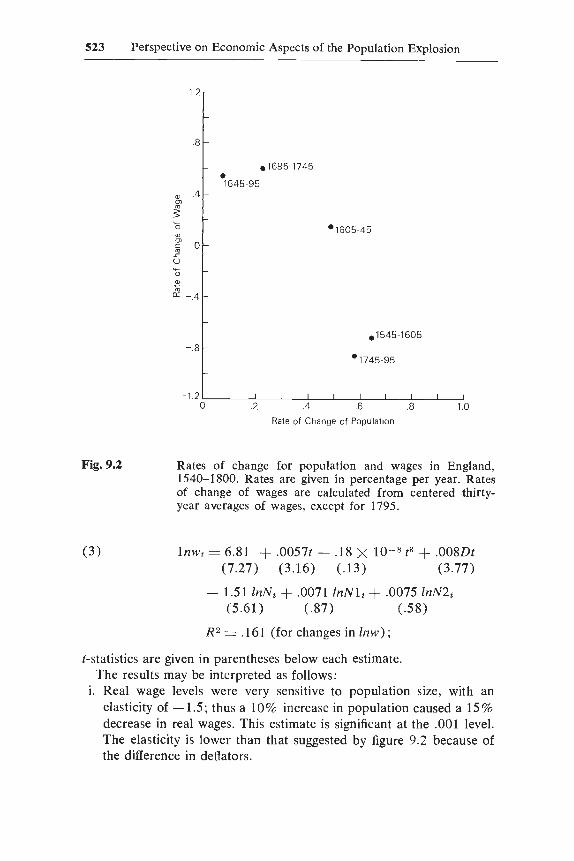
Rates of change for population and wages in England,1540-1800. Rates are given in percentage per year. Ratesof change of wages are calculated from centered thirtyyear averages of wages, except for 1795.
1nWt = 6.81 + .0057t - .18 X 10-8 t3 + .008Dt(7.27) (3.16) (.13) (3.77)
t-statistics are given in parentheses below each estimate.The results may be interpreted as follows:
i. Real wage levels were very sensitive to population size, with anelasticity of -1.5; thus a 10% increase in population caused a 15 %decrease in real wages. This estimate is significant at the .001 level.The elasticity is lower than that suggested by figure 9.2 because ofthe difference in deflators.
524 Robert Demos Lee
ii. Surprisingly, there is virtually no change in this elasticity from subperiod to subperiod, as is shown by the small and insignificant coefficients for 1nN1 and 1nN2.
lll. The coefficients of ( and (3 show that the rate of shift in the relationbetween population and wages, reflecting technical change and capital accumulation, did not accelerate in the eighteenth century withearly stages of the industrial revolution. This also is a surprisingresult.
IV. From 1539 to 1810, a population growth rate of 0.38% per yearwould have been consistent with a constant real wage. After theNapoleonic wars, the rate of shift more than doubled, and a growthrate of 0.88% per year would have left wages unchanged. Thisshows a dramatic alteration in the growth rate of the demand forlabor.
v. The low R2 is due to the Cochrane-Orcutt transformation, whichcauses quasi-differences in the data, emphasizing their short-runvariability.
Perhaps the most striking aspect of all these estimates is the size ofthe wage-population elasticity. If production obeyed a Cobb-Douglasproduction function, these elasticities would equal minus the share ofnonlabor inputs, or 0.4 to 0.6. The estimate above is about three timesthis great, suggesting that the Cobb-Douglas interpretation is incorrect.I will discuss this point in detail in the next section.
Since (3, N1, and N2 all had insignificant effects, and the period after1809 seemed quite different, I reestimated a simpler version of equation3 for 1539-1809, correcting for second-order autocorrelation using aniterative Cochrane-Orcutt procedure.
(4) lnWt = 25.59 + .00645( - 1.62lnN t
(11.73) (10.03) (9.23)
R2 = .75 DW = 1.97
R2 for changes = .19;
(-statistics are given in parentheses. These estimates are consistent withequation 3. The implied rate of absorption is 0.4% per year, and thewage-population elasticity is -1.62.
It is interesting to compare the results of this part with previous workI have done using less satisfactory demographic data4 (see table on nextpage).
The elasticities estimated in equations 3 and 4 are larger in absolutevalue than the earlier estimates, but given the differences in data, timeperiods, and time units, I do not find the differences troubling. Theprincipal inconsistency arises from the estimates of rate of populationabsorption. The previous studies, taken together, suggest a fivefold in-
525 Perspective on Economic Aspects of the Population Explosion
AnnualPeriod Time Wage-Population Rate of
Source Covered Units Elasticity ('YJ) Absorption
Lee 1973 1250-1700 50 years -1.10 .00089(7.05)
Lee 1977 1705-89 5 years -1.29 .0046(3.69)
Equation 4 1539-1809 1 year -1.62 .0040(9.23 )
crease in this rate between 1250-1700 and 1705-89. This increaseseems a plausible reflection of the agricultural and industrial revolutions.However the estimate in equation 3 shows no sign of an acceleratingrate of shift. I have no explanation for this inconsistency, although theestimated dual-sector model will show that this constant rate of absorption masks important differences in rates of shift between sectors.
9.2.3 A Dual-Sector Model
The effects of population growth on the economy can be understoodin richer detail if we distinguish between the agricultural and nonagricultural sectors. In this section I will develop a simple model of a dualsector economy; in a subsequent section I will test it empirically. In themodel, agricultural production exhibits sharply diminishing returns tolabor, owing to the relatively fixed supply of land. Industrial production,which uses labor and agricultural output in fixed proportions, encountersno such bottleneck. The demand for industrial and agricultural outputis such as to leave their shares in national income constant, when valuedat current prices.
Throughout I will assume that the English economy was closed. Infact, exports made up about 5% or 6% of national income in 1688,rising to 14% by 1800 (see Deane and Cole 1969, p. 309). Some justification for the closure assumption is given by Kelley and Williamsonin the context of Meiji Japan (1974, chap. 12).5
Capital and capitalists are ignored completely by the model, exceptthat land-augmenting investment and technical progress at a constantrate are allowed in agriculture.« This is a model of a preindustrial economy; the industrial sector is largely passive and is not intended to provide insights into the beginnings of the industrial revolution. Details ofthe development of the model are given in Appendix 9.2; here I willdiscuss only the assumptions and the main results.
Industrial Production
The nonagricultural sector, which I will for convenience call "industrial," provides such diverse items as domestic service, buildings, textiles,
526 Ronald Demos Lee
lace, household goods, iron products, and so on.7 Production in thissector directly requires only trivial amounts of land. The main inputsare labor and agricultural output, such as skins, wool, and grain. Iassume that these inputs are combined in fixed proportions.
By appropriate choice of units of measure for agricultural output, A,and labor, N, the fixed input coefficients can be made to equal unity.Thus,
(5)
where I is "industrial" output, N I is labor employed in the industrialsector, and Al is agricultural output used in the industrial sector. If noinputs are wasted, then:
(6)
I will further assume that there are no profits in this sector, so thatthe price of industrial output, PI, just equals the cost of inputs, WI + P.{,where WI is the industrial-sector wage and p.{ is the price of agriculturaloutput. A comparison of the wages of builders' helpers (Phelps-Brownand Hopkins 1955) and agricultural laborers employed in nonseasonalwork without remuneration in kind (Finberg 1967) shows that thesewere equal in southern England from 1450 to 1650. I will thereforeassume that WI = WA and drop the subscript. Thus:
(7)
or, taking A as the numeraire, as I will throughout,
(8) p = w + 1,
where p = PAIPl and w = WIPA •
From equation 8 it is easy to determine the effect of population changeon the terms of trade between industry and agriculture. Let YI = wipbe labor costs as a proportion of total costs in industry. Then, if N = N.{+ NI is the total labor force (by assumption, fully employed), and Edenotes "elasticity,"
(9) Ep,N = yIEw.N'
Changes in technology and formation of industrial capital can best bedescribed as labor-saving rather than material-saving. This was particularly true for textile manufacture but probably was false for the ironindustry, which became important only at the very end of the period.Labor-augmenting change at the constant rate p has the effect of reducing labor requirements by a factor of e- pt . Thus, for example, equation8 can be rewritten:
(10) p = e-ptw + 1.
527 Perspective on Economic Aspects of the Population Explosion
The Demand for Industrial Output
The amount of industrial output demanded by a household typicallydepends on its income, with an elasticity greater than 1, and on therelative price of industrial goods, with an elasticity less than O. Theseeffects can be incorporated at the household level by a linear expenditure system, which has the advantage of being aggregable. Although itwould be desirable to incorporate such a demand specification, in thepresent model I assume that the shares of agriculture and industry innational income, valued at current prices, are fixed. This is equivalentto assuming income elasticities of unity for both kinds of goods, andprice elasticities of minus one. The assumption is not so implausible asit may first appear, since the incomes of landlords and laborers typicallymoved in opposite directions. Historical data suggest a major decline inagriculture's share at the end of the eighteenth century but have beeninterpreted in conflicting ways concerning earlier changes.8
Final product in agriculture is total product less the portion used inthe industrial sector: A - I. The value of total output is: A - I + pI= A + I (p - 1). The assumption of constant shares can convenientlybe written:
(11) pI = A(A -l),
since this yields a share of final product in agriculture of 1/(1 + A), aconstant.
This does not mean, of course, that in real terms the ratio of nonagricultural to agricultural consumption was constant; quite the contrary.Growing population would confront diminishing returns in agriculture,depressing wages and industrial prices, as indicated by equation 9. Theassumption of a constant share of industry in national income wouldtherefore require an increasing share of industry in real output, whenpopulation grew. And indeed this is historically accurate (see Deaneand Cole 1969, p. 162).
The ratio of industrial to agricultural output, both intermediate andfinal, 1/A, turns out to be:
(12) I/A = ,\j(w + 1 + A).
This clearly increases as w falls; therefore, when population grows, industrial output increases more, proportionately, than does agriculturaloutput. For a detailed discussion, see Appendix 2F.
Agricultural Production
Unlike industry, agricultural production is constrained by a relativelyinvariant supply of potentially arable land. However, conditions of agri-
528 Ronald Demos Lee
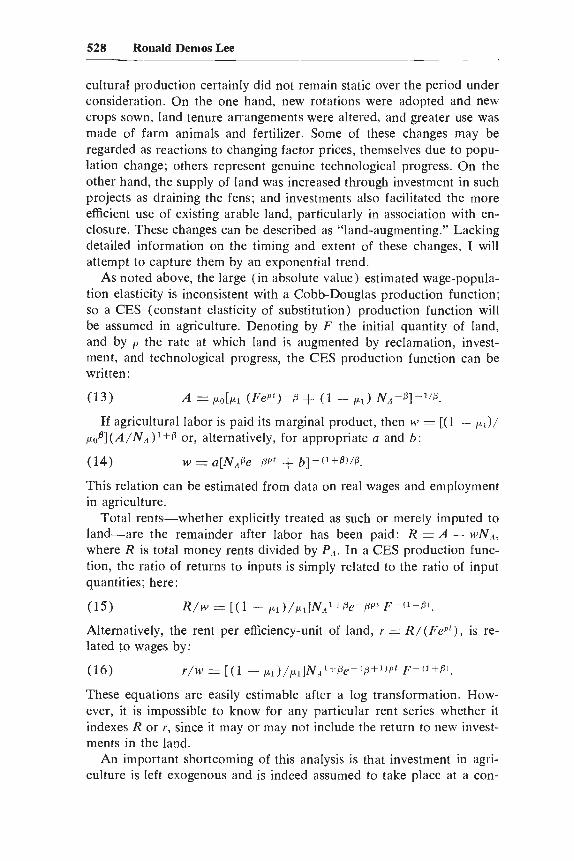
cultural production certainly did not remain static over the period underconsideration. On the one hand, new rotations were adopted and newcrops sown, land tenure arrangements were altered, and greater use wasmade of farm animals and fertilizer. Some of these changes may beregarded as reactions to changing factor prices, themselves due to population change; others represent genuine technological progress. On theother hand, the supply of land was increased through investment in suchprojects as draining the fens; and investments also facilitated the moreefficient use of existing arable land, particularly in association with enclosure. These changes can be described as "land-augmenting." Lackingdetailed information on the timing and extent of these changes, I willattempt to capture them by an exponential trend.
As noted above, the large (in absolute value) estimated wage-population elasticity is inconsistent with a Cobb-Douglas production function;so aCES (constant elasticity of substitution) production function willbe assumed in agriculture. Denoting by F the initial quantity of land,and by p the rate at which land is augmented by reclamation, investment, and technological progress, the CES production function can bewritten:
(13)
If agricultural labor is paid its marginal product, then w = [(1 - 01)/0o/l](A/NA)lH or, alternatively, for appropriate a and b:
(14) w = a[NA13e-{1pt + b]-(l+/l)/I3.
This relation can be estimated from data on real wages and employmentin agriculture.
Total rents-whether explicitly treated as such or merely imputed toland-are the remainder after labor has been paid: R = A - wNA ,
where R is total money rents divided by PA • In a CES production function, the ratio of returns to inputs is simply related to the ratio of inputquantities; here:
(15)
Alternatively, the rent per efficiency-unit of land, r = R/ (FePt ), is related to wages by:
(16)
These equations are easily estimable after a log transformation. However, it is impossible to know for any particular rent series whether itindexes R or r, since it mayor may not include the return to new investments in the land.
An important shortcoming of this analysis is that investment in agriculture is left exogenous and is indeed assumed to take place at a con-
529 Perspective on Economic Aspects of the Population Explosion
stant rate. But it is clear that agricultural investment and also perhapstechnical change was more rapid when rents and agricultural prices wererelatively high, and these themselves depended on population. It mightbe possible to get at these issues empiricaIIy through analysis of bills ofenclosure. By ignoring these effects, I have surely overstated the longrun negative effects of population growth in England. However, regressions that do not include a shift term do not suffer from this bias, andthey confirm the negative effects of population, although with a lowerelasticity (see Lee 1973, p. 588).
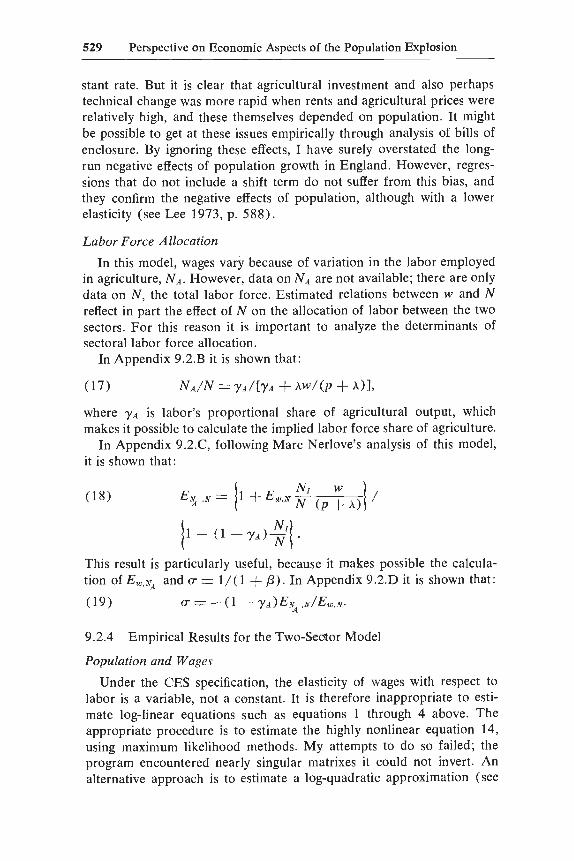
Labor Force Allocation
In this model, wages vary because of variation in the labor employedin agriculture, N A. However, data on NA are not available; there are onlydata on N, the total labor force. Estimated relations between wand Nreflect in part the effect of N on the allocation of labor between the twosectors. For this reason it is important to analyze the determinants ofsectoral labor force aIIocation.
In Appendix 9.2.B it is shown that:
(17)
where /,A is labor's proportional share of agricultural output, whichmakes it possible to calculate the implied labor force share of agriculture.
In Appendix 9.2.C, foIIowing Marc Nerlove's analysis of this model,it is shown that:
(18) E~ .N = ~1 + Ew .N ZI (p: A)~ /
~1 - (1 - /'A) ~Il.
This result is particularly useful, because it makes possible the calculation of EW 'N.4 and (T = 1/(1 + f3). In Appendix 9.2.D it is shown that:
(19) (T = -(1 - /'A)ENA .N/Ew .N.
9.2.4 Empirical Results for the Two-Sector Model
Population and Wages
Under the CES specification, the elasticity of wages with respect tolabor is a variable, not a constant. It is therefore inappropriate to estimate log-linear equations such as equations 1 through 4 above. Theappropriate procedure is to estimate the highly nonlinear equation 14,using maximum likelihood methods. My attempts to do so failed; theprogram encountered nearly singular matrixes it could not invert. Analternative approach is to estimate a log-quadratic approximation (see
530 Ronald Demos Lee
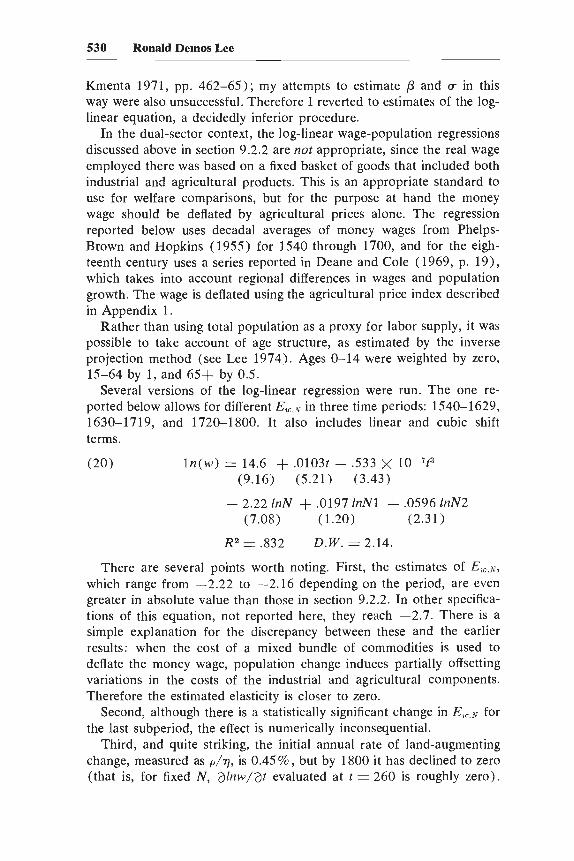
Kmenta 1971, pp. 462-65); my attempts to estimate f3 and (J in thisway were also unsuccessful. Therefore I reverted to estimates of the loglinear equation, a decidedly inferior procedure.
In the dual-sector context, the log-linear wage-population regressionsdiscussed above in section 9.2.2 are not appropriate, since the real wageemployed there was based on a fixed basket of goods that included bothindustrial and agricultural products. This is an appropriate standard touse for welfare comparisons, but for the purpose at hand the moneywage should be deflated by agricultural prices alone. The regressionreported below uses decadal averages of money wages from PhelpsBrown and Hopkins (1955) for 1540 through 1700, and for the eighteenth century uses a series reported in Deane and Cole (1969, p. 19),which takes into account regional differences in wages and populationgrowth. The wage is deflated using the agricultural price index describedin Appendix 1.
Rather than using total population as a proxy for labor supply, it waspossible to take account of age structure, as estimated by the inverseprojection method (see Lee 1974). Ages 0-14 were weighted by zero,15-64 by 1, and 65+ by 0.5.
Several versions of the log-linear regression were run. The one reported below allows for different EW •N in three time periods: 1540-1629,1630-1719, and 1720-1800. It also includes linear and cubic shiftterms.
(20) 1n(w) = 14.6 + .0103t - .533 X 1O- 7t3
(9.16) (5.21) (3.43)
- 2.22 inN + .0197 inN1 + .0596inN2(7.08) (1.20) (2.31)
R2 = .832 D.W. = 2.14.
There are several points worth noting. First, the estimates of Ew.N ,
which range from -2.22 to -2.16 depending on the period, are evengreater in absolute value than those in section 9.2.2. In other specifications of this equation, not reported here, they reach -2.7. There is asimple explanation for the discrepancy between these and the earlierresults: when the cost of a mixed bundle of commodities is used todeflate the money wage, population change induces partially offsettingvariations in the costs of the industrial and agricultural components.Therefore the estimated elasticity is closer to zero.
Second, although there is a statistically significant change in Ew .N forthe last subperiod, the effect is numerically inconsequential.
Third, and quite striking, the initial annual rate of land-augmentingchange, measured as p/YJ, is 0.45 %, but by 1800 it has declined to zero(that is, for fixed N, olnw/ot evaluated at t = 260 is roughly zero).
(21)
531 Perspective on Economic Aspects of the Population Explosion
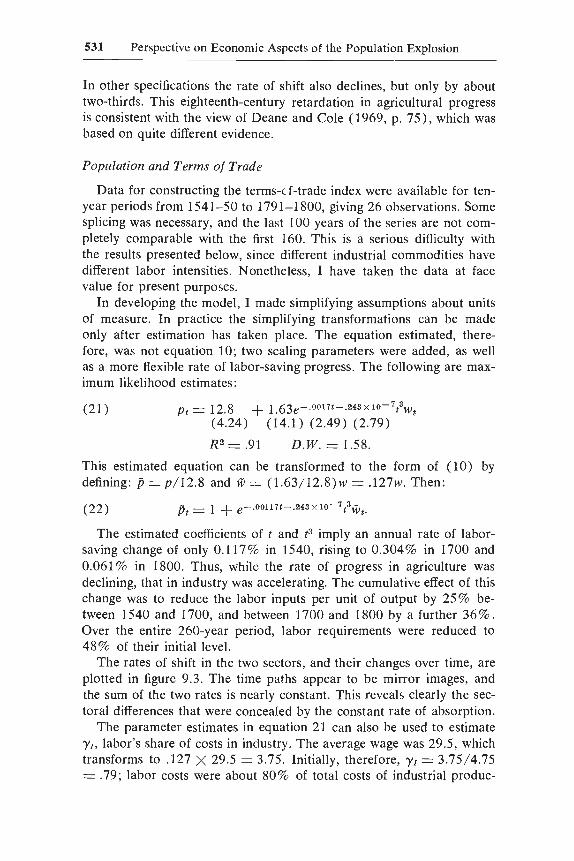
In other specifications the rate of shift also declines, but only by abouttwo-thirds. This eighteenth-century retardation in agricultural progressis consistent with the view of Deane and Cole (1969, p. 75), which wasbased on quite different evidence.
Population and Terms of Trade
Data for constructing the terms-d-trade index were available for tenyear periods from 1541-50 to 1791-1800, giving 26 observations. Somesplicing was necessary, and the last 100 years of the series are not completely comparable with the first 160. This is a serious difficulty withthe results presented below, since different industrial commodities havedifferent labor intensities. Nonetheless, I have taken the data at facevalue for present purposes.
In developing the model, I made simplifying assumptions about unitsof measure. In practice the simplifying transformations can be madeonly after estimation has taken place. The equation estimated, therefore, was not equation 10; two scaling parameters were added, as wellas a more flexible rate of labor-saving progress. The following are maximum likelihood estimates:
This estimated equation can be transformed to the form of (10) bydefining: p = p/12.8 and w= (1.63/12.8)w = .127w. Then:
(22)
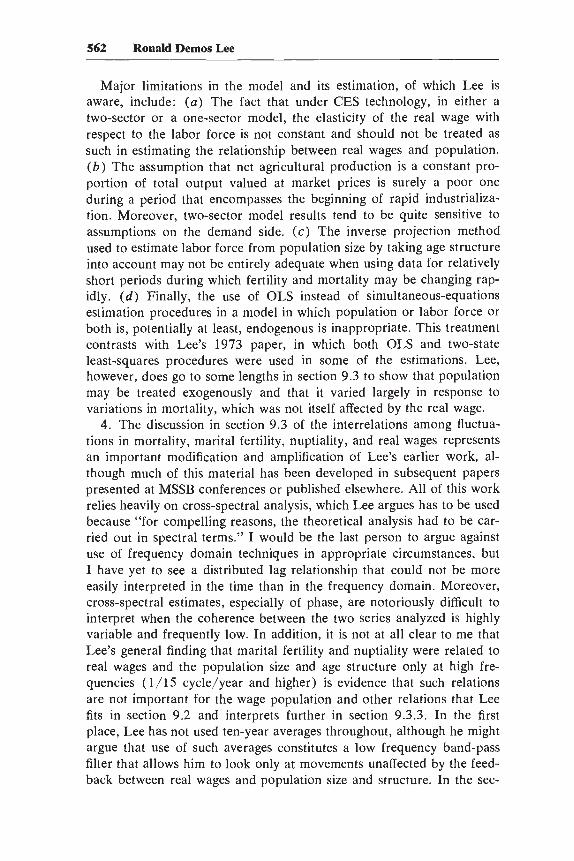
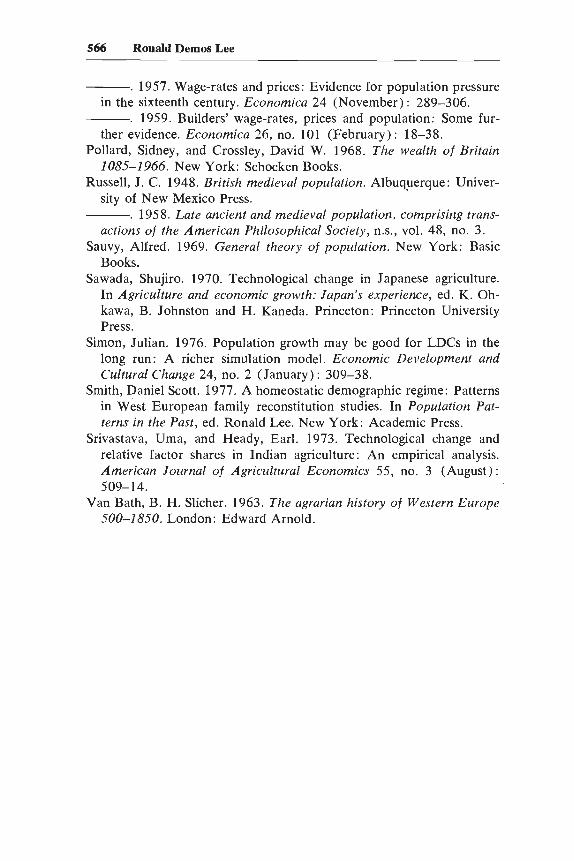
The estimated coefficients of t and t3 imply an annual rate of laborsaving change of only 0.117% in 1540, rising to 0.304% in 1700 and0.061 % in 1800. Thus, while the rate of progress in agriculture wasdeclining, that in industry was accelerating. The cumulative effect of thischange was to reduce the labor inputs per unit of output by 25% between 1540 and 1700, and between 1700 and 1800 by a further 36%.Over the entire 260-year period, labor requirements were reduced to48% of their initial level.
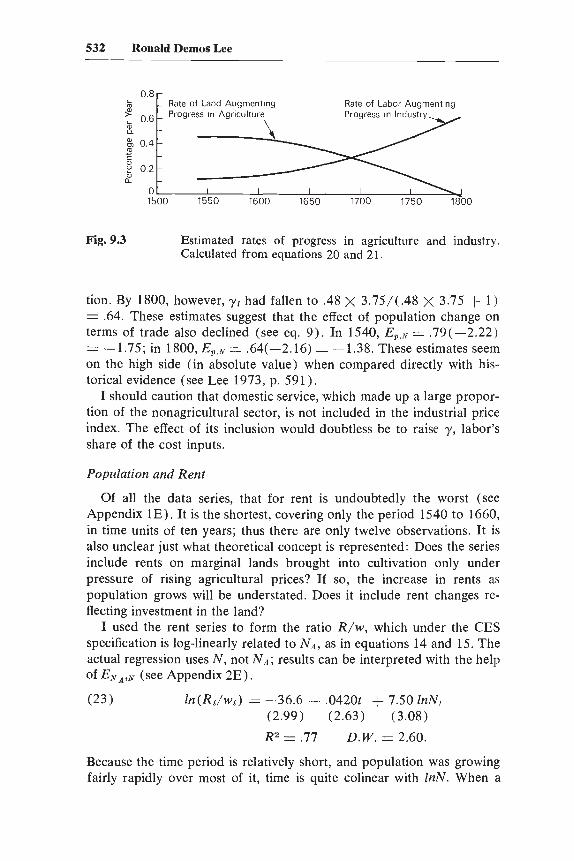
The rates of shift in the two sectors, and their changes over time, areplotted in figure 9.3. The time paths appear to be mirror images, andthe sum of the two rates is nearly constant. This reveals clearly the sectoral differences that were concealed by the constant rate of absorption.
The parameter estimates in equation 21 can also be used to estimateYh labor's share of costs in industry. The average wage was 29.5, whichtransforms to .127 X 29.5 = 3.75. Initially, therefore, Y1 = 3.75/4.75= .79; labor costs were about 80% of total costs of industrial produc-
Fig. 9.3 Estimated rates of progress in agriculture and industry.Calculated from equations 20 and 21.
tion. By 1800, however, "II had fallen to .48 X 3.75/(.48 X 3.75 + 1)= .64. These estimates suggest that the effect of population change onterms of trade also declined (see eq. 9). In 1540, Ep,N = .79(-2.22)= -1.75; in 1800, Ep,N = .64(-2.16) = -1.38. These estimates seemon the high side (in absolute value) when compared directly with historical evidence (see Lee 1973, p. 591).
I should caution that domestic service, which made up a large proportion of the nonagricultural sector, is not included in the industrial priceindex. The effect of its inclusion would doubtless be to raise "I, labor'sshare of the cost inputs.
Population and Rent
Of all the data series, that for rent is undoubtedly the worst (seeAppendix 1E). It is the shortest, covering only the period 1540 to 1660,in time units of ten years; thus there are only twelve observations. It isalso unclear just what theoretical concept is represented: Does the seriesinclude rents on marginal lands brought into cultivation only underpressure of rising agricultural prices? If so, the increase in rents aspopulation grows will be understated. Does it include rent changes reflecting investment in the land?
I used the rent series to form the ratio R/w, which under the CESspecification is log-linearly related to N A , as in equations 14 and IS. Theactual regression uses N, not N A; results can be interpreted with the helpof EN A,N (see Appendix 2E) .
Because the time period is relatively short, and population was growingfairly rapidly over most of it, time is quite colinear with InN. When a
533 Perspective on Economic Aspects of the Population Explosion
quadratic or cubic time-shift term is included, population's coefficientbecomes small and insignificant.
The implied annual rate of land augmenting change is roughly .042/7.50 = 0.56%, compared with an estimate of 0.44% for this periodfrom equation 20.
From equation 20 or equation 23, we can derive an estimate of theelasticity of substitution in agriculture. First, however, E~ ,N must be
evaluated using equation A20 in Appendix 2. This requires estimatesof N1/N, YA, Ew,N, and w/(p + "\). Reasonable mean values of thesevariables are NriN = .35, YA = .45, Ew .N = -2.22, and w/(p +,.\)= .6.9 These imply ENA ,N = .66, so that as population rises, the propor-
tion of the labor force agriculture declines quite markedly. Using equations A22 and A27, the implied estimates of (J can be derived. Theseare 0.16 from equation 20 or 0.09 from equation 23. The first figure issurely more accurate, since it is based on the full 260 years, while thesecond is based on only 120 years.
Is an estimated elasticity of substitution as low as 0.16 at all plausible? I am not sufficiently familiar with the agricultural techniques usedto be able to form a judgment. Most modern studies of agriculturalproduction report values in the neighborhood of unity, although lowvalues, near 0.2, have been estimated for Meiji Japan (Sawada 1970)and India (Srivastava and Heady 1973).
The reader may have noted that all the estimates of population'seffects were made using single-equation methods. However, if populationgrowth rates are themselves dependent on economic welfare, then thesystem is simultaneously determined, and single equation methods willyield biased parameter estimates. In previous work (1973, 1978a, b) Ihave dealt with this problem at length. It turns out that simultaneity biasis not very important when estimating effects of population change; it is,however, a serious problem when examining the causes of populationchange. So the results reported in this part should not have been seriously biased by the use of single-equation methods.
Miscellaneous Effects at Population Growth
I have already discussed the effects of population growth, relative toaugmented land, on wages, rents, and the terms of trade. Population alsoaffected the composition of output. In Appendix 2, expressions for theeffect of population on I and on 1/A are derived (see eq. A29, A30).Evaluating these expressions gives E1/A,N = 1.33 and E 1.N = 1.65. Thusa 10% increase in population would increase 1/A by 13 % and increaseI by 16.5%.
Labor-saving progress in industry has a similar effect on the composition of output. Evaluating expression A42 yields E1•a = -.85; thus al-
534 Ronald Demos Lee
most all the labor released by progress in industry is used to boostoutput in industry.
The effects of technical change and population growth taken togethergo a long way toward explaining the rapid industrial growth of the lateeighteenth century. Using expression A28 for 1/A and evaluating it in1731-40 and in 1791-1800, I find that over this sixty-year period,industrial output in real terms should have increased by 60% more thandid agricultural output. This compares with a figure of 90% derivedfrom Deane and Cole (1969, p. 78). Thus the combination of rapidpopulation growth, rapid improvement in industrial technology, andslowing change in agricultural technology accounts for much of theincreased importance of industry.
Population growth also had an important effect on the factor distribution of income. For farmers working their own land, these effects wouldhave been relatively unimportant; but for landlords and laborers theeffects were very large. Evaluating expression A37, I find Es.x = -1.4,where S is labor's share of total output. Thus a 10% increase in population would reduce S from perhaps 55% to 47%.
Finally, I should stress that the estimated value of EII'.,Y = -2.22greatly overstates the effect of population change on material welfare,because the wage is expressed in terms of the agricultural commodity.Consider instead a wage deflator based on a 50-50 mix (in terms ofmean value) of agricultural and industrial commodities. This is essentially the real wage concept measured by Phelps-Brown and Hopkins(1956), and used in section 9.2.2 above. Call this real wage w*. Then,given actual mean values for wand p, it can be shown that E,c'.,Y .(5/8)Ew •N . _1.4.10 This agrees very well with the estimates of section9.2.2 above (-1.5 and -1.6).
9.3 Causes of Population Change
9.3.1 A Test of Two Simple Theories
The broad issues were already sketched in the Introduction: Is population an endogenous element in the socioeconomic system, regulatedby norms and institutions so as to establish and protect a culturallydefined standard of living? Or is population an independent force thatdetermines levels of living, and to which the society and economy mustadjust as best they can? The former view has been held by many classical and neoclassical economists from Malthus to Harberger (1958, pp.109-10), and by many biologists and ecologists as well (e.g., Dubos1965, pp. 286-87). The latter view is generally held by historians,demographers, and some economists.
535 Perspective on Economic Aspects of the Population Explosion
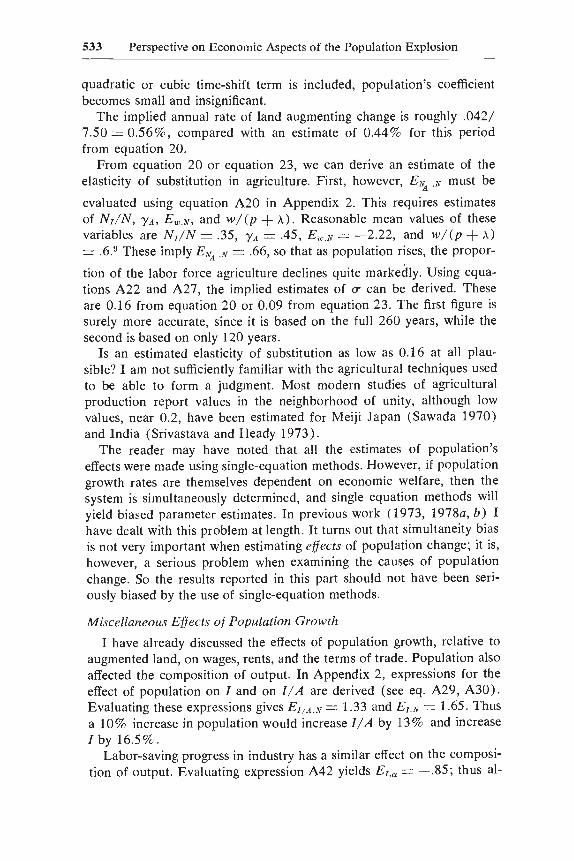
In its simplest form the classical theory-which makes populationendogenous-posits a functional relation between the population growthrate and the level of wages. There will be some wage corresponding tozero population growth; this equilibrium wage is the conventional livingstandard or natural price of labor. In figure 9.4 I have plotted population growth rates against the wage level for twenty-five-year periods,1550 to 1799, using the data introduced above. It is clear that there isno strong relation between the two; the scatter provides no support forthe classical theory as applied to this period. In fact, similar results holdfor the entire period 1250 to 1789 (see Lee 1973, 1978a).
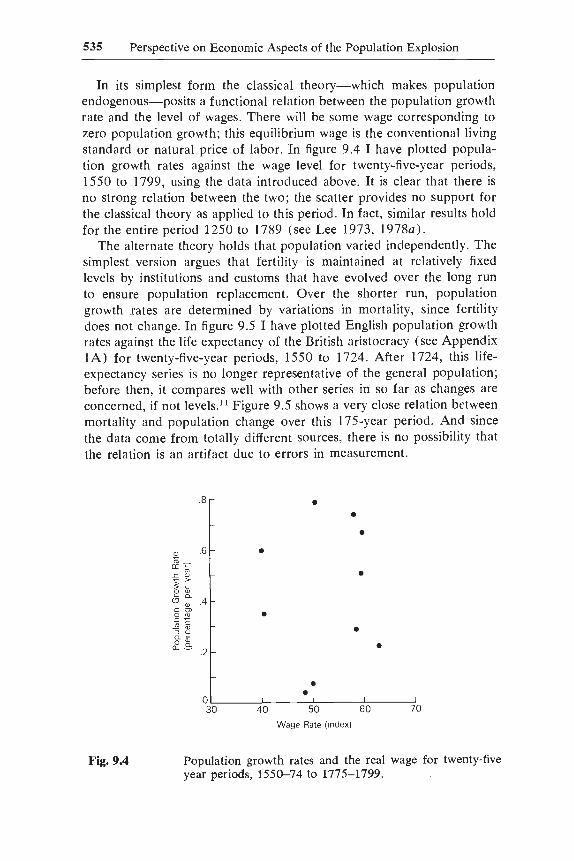
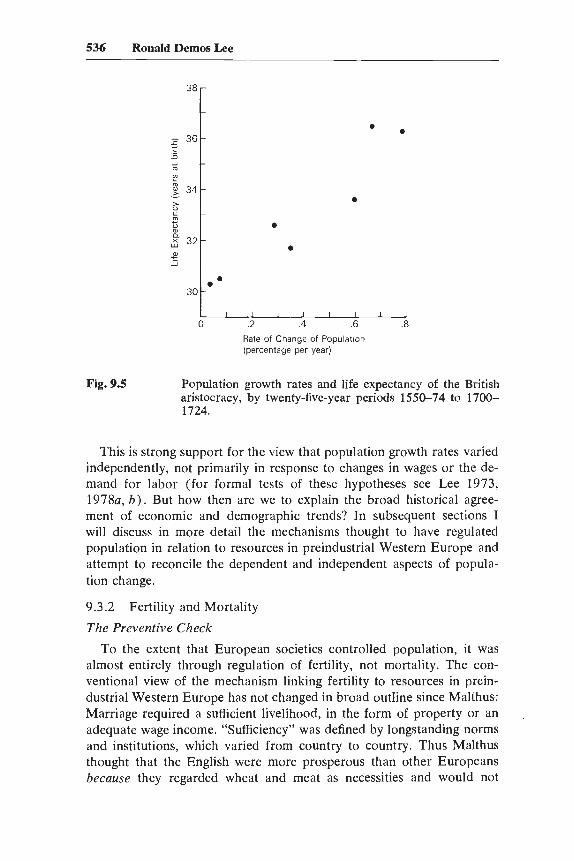
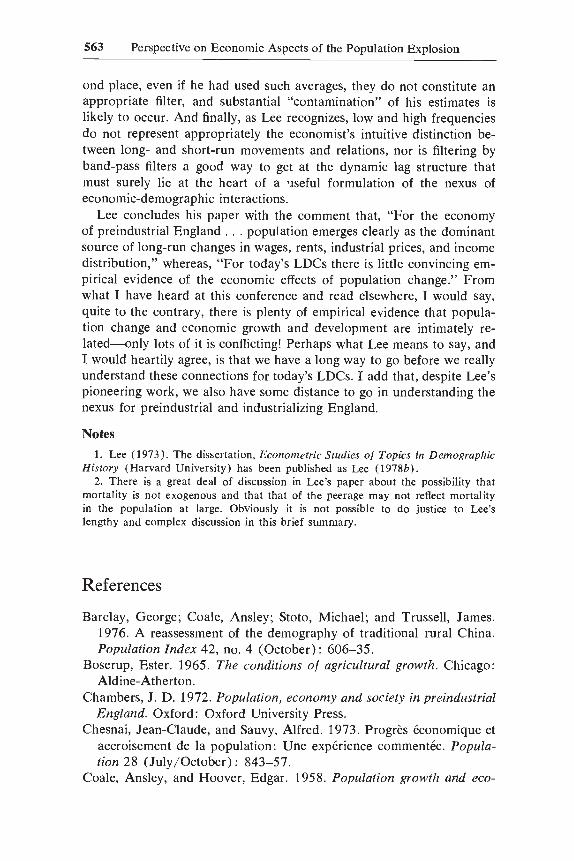
The alternate theory holds that population varied independently. Thesimplest version argues that fertility is maintained at relatively fixedlevels by institutions and customs that have evolved over the long runto ensure population replacement. Over the shorter run, populationgrowth rates are determined by variations in mortality, since fertilitydoes not change. In figure 9.5 I have plotted English population growthrates against the life expectancy of the British aristocracy (see AppendixlA) for twenty-five-year periods, 1550 to 1724. After 1724, this lifeexpectancy series is no longer representative of the general population;before then, it compares well with other series in so far as changes areconcerned, if not levels.u Figure 9.5 shows a very close relation betweenmortality and population change over this 175-year period. And sincethe data come from totally different sources, there is no possibility thatthe relation is an artifact due to errors in measurement.
.8 •••
••
••
•
••40 50 60 70
Wage Rate (Index)
Fig. 9.4 Population growth rates and the real wage for twenty-fiveyear periods, 1550-74 to 1775-1799.
536 Ronald Demos Lee
38
:2 36t:1510V>
~ 342::>-
"c:'"1:3'"~ 32
2.:;
30••
••
•
• •
o 2 .4 .6 .8
Fig. 9.5
Rate of Change of Population(percentage per year)
Population growth rates and life expectancy of the Britisharistocracy, by twenty-fIve-year periods 1550-74 to 17001724.
This is strong support for the view that population growth rates variedindependently, not primarily in response to changes in wages or the demand for labor (for formal tests of these hypotheses see Lee 1973,1978a, b). But how then are we to explain the broad historical agreement of economic and demographic trends? In subsequent sections Iwill discuss in more detail the mechanisms thought to have regulatedpopulation in relation to resources in preindustrial Western Europe andattempt to reconcile the dependent and independent aspects of population change.
9.3.2 Fertility and Mortality
The Preventive Check
To the extent that European societies controlled population, it wasalmost entirely through regulation of fertility, not mortality. The conventional view of the mechanism linking fertility to resources in preindustrial Western Europe has not changed in broad outline since Malthus:Marriage required a sufficient livelihood, in the form of property or anadequate wage income. "Sufficiency" was defined by longstanding normsand institutions, which varied from country to country. Thus Malthusthought that the English were more prosperous than other Europeansbecause they regarded wheat and meat as necessities and would not
537 Perspective on Economic Aspects of the Population Explosion
marry without income enough to provide them for their families. Europeans in general were regarded as more prosperous than other peoplesbecause they required more comfortable circumstances before they werewilling to marry. Once married, couples were believed to bear childrenat a "natural" rate, while making no efforts to control family size. Sucha system would relate aggregate fertility rates to per capita income orwealth, and to wage rates.
Whereas historical demographers have confirmed the general outlineof the natural fertility theory, a number of studies have shown that inthe eighteenth and nineteenth centuries, at least, marital fertility as wellas nuptiality responded positively to the harvest cycle. There is also somemixed evidence that on balance suggests that wealthier couples may notonly have married earlier, but also have had higher fertility within marriage (see Smith 1977).
The Cambridge Group's aggregate parish register data set makes itpossible to analyze the effect on vital rates of short-run variations in thereal wage. It provides series of the annual numbers of baptisms, burials,and marriages in 404 parishes from 1539 to 1839. In theoretical workdescribed elsewhere (Lee 1975, 1978a) I have shown that short-runfluctuations in such series can be interpreted as fluctuations in maritalfertility, mortality, and nuptiality. This enables us to draw demographicinferences from changes in the numbers of events without botheringabout the size and structure of the population at risk. I have also shown(Lee 1978a) that short-run fluctuations can be used to study the causesof population change without contamination by the simultaneity in thesystem.
I have used cross-spectral analysis to estimate these relations, in partbecause for compelling reasons the theoretical analysis mentioned abovehad to be carried out in spectral terms.12 However, given the theoreticalresults, the empirical work could have been carried out by regressionanalysis after suitable "filtering" of the series.
Spectral analysis examines the variances and covariances of sets ofseries by frequency or periodicity. Any detrended series may be examined in this way; there is no presumption that there are cycles in thedata. It is convenient, although not entirely accurate, to think of frequency here as distinguishing, say, between long-run (low-frequency)and short-run (high-frequency) components of variation in the series.My previous work has established that for wavelengths of less thanfifteen years or so, the population size and age structure, and the duration structure of marriages, have only negligible effects on births, deaths,and marriages. For my purposes, therefore, I will refer to these as "shortrun."
I will use three basic cross-spectral concepts in this paper. The firstis "coherence squared," denoted C'2(A), which is analogous to R2 in
538 Ronald Demos Lee
regression analysis but is specific to wavelength '\. The second is phaseshift, cj> ('\), which measures the lag of one series behind the other inradians at each wavelength. The third is "gain squared," G2(,\), whichis analogous to the square of a regression coefficient, again specific towavelength.
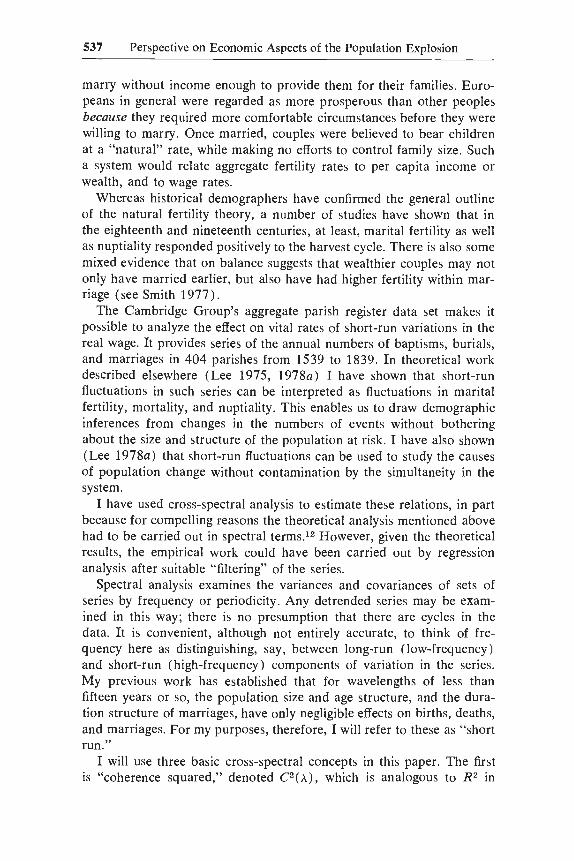
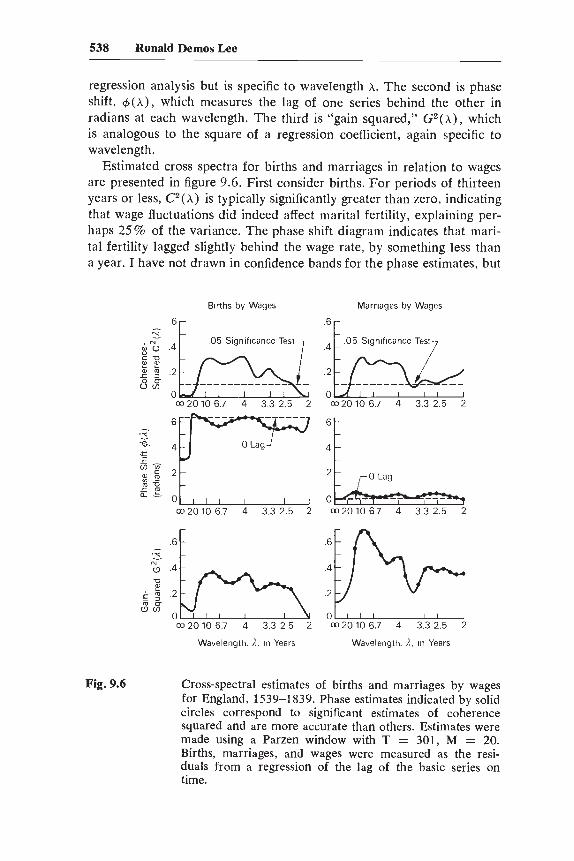
Estimated cross spectra for births and marriages in relation to wagesare presented in figure 9.6. First consider births. For periods of thirteenyears or less, C2 (,\) is typically significantly greater than zero, indicatingthat wage fluctuations did indeed affect marital fertility, explaining perhaps 25 % of the variance. The phase shift diagram indicates that marital fertility lagged slightly behind the wage rate, by something less thana year. I have not drawn in confidence bands for the phase estimates, but
Fig. 9.6 Cross-spectral estimates of births and marriages by wagesfor England, 1539-1839. Phase estimates indicated by solidcircles correspond to significant estimates of coherencesquared and are more accurate than others. Estimates weremade using a Parzen window with T = 301, M = 20.Births, marriages, and wages were measured as the residuals from a regression of the lag of the basic series ontime.
539 Perspective on Economic Aspects of the Population Explosion
they are very narrow, typically about ±0.3 radians. The estimates of02(A) can here be interpreted as elasticities,13 suggesting a value of 0.3.I also estimated separate cross spectra for each of the periods 15391638, 1639-1745, and 1746-1839 and found virtually identical resultswithin each subperiod. This establishes the existence of a procyclicalresponse of marital fertility to wages as far back as the sixteenth century,with no noticeable change in the timing or sensitivity of the relationship.
The estimated cross spectrum for marriages and wages shows a coherence-squared very similar to that for fertility. The phase diagramshows that nuptiality responded to wages with no lag at all, in contrastto fertility. The gain-squared estimates show that the elasticity for nuptiality was on the order of 0.5, or nearly twice as high as that of fertility.Generally, the association was closer and more sensitive for fluctuationsof about ten years' periodicity than it was for very short-run fluctuations.To summarize, these results show that as far back as the sixteenth century, both marital fertility and nuptiality were strongly influenced byshort-run variations in the real wage, which explained 20% to 30% oftheir short-run variance. Without making any judgment on whether theassociation of marital fertility with wage variations was due to voluntarylimitation of fertility, these results provide some support for the existenceof an aggregate relation between general fertility and wages.14
The Positive Check
While the role of exogenous mortality decline in the current LDCs'rapid population growth is widely acknowledged, it is less well knownthat large exogenous changes in mortality occurred in the past, leadingto major population swings in Europe from the thirteenth through theeighteenth centuries. And I refer not to catastrophic mortality associatedwith periodic harvest failure or epidemic, but rather to long-run changespersisting for decades or centuries. The causes of these shifts are obscure; they may have been climatic, or the by-product of independentepidemiological and ecological changes, or the result of voyages of exploration. But that these changes occurred is clear; their magnitude issuggested by the life expectancy series for upper-class Englishmenshown in figure 9.1. Other confirming evidence is found both for England and for the Continent in reconstitution studies based on parishregisters, in data from religious orders and the professions, and in theanalysis of wills and death taxes. The exogeneity of the changes is clearfrom their temporal relation to changes in wages and population size,and from their disregard for class distinctions (see Chambers 1972; Lee1973, 1978a and 1978b).
I do not mean to suggest that mortality was completely independentof income; but the importance of this endogenous component has beengreatly exaggerated. The extent to which mortality was associated with
540 Ronald Demos Lee
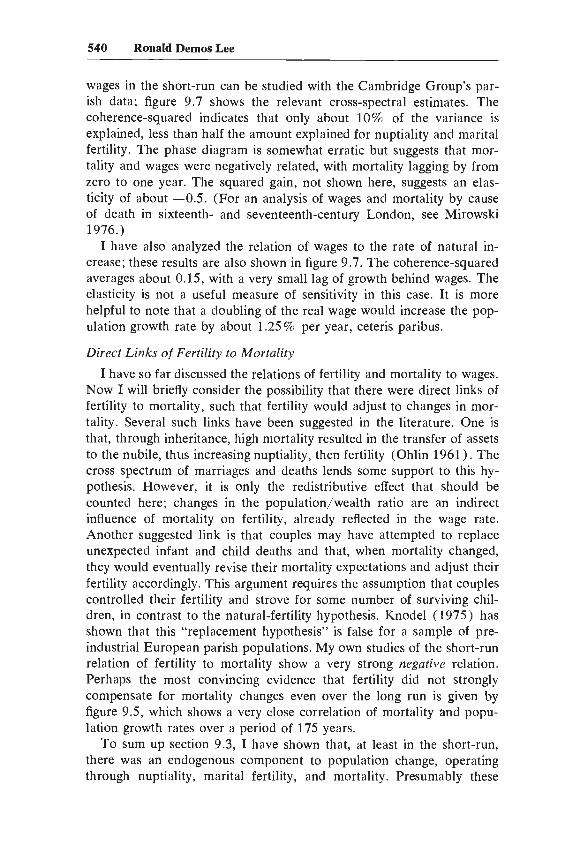
wages in the short-run can be studied with the Cambridge Group's parish data; figure 9.7 shows the relevant cross-spectral estimates. Thecoherence-squared indicates that only about 10% of the variance isexplained, less than half the amount explained for nuptiality and maritalfertility. The phase diagram is somewhat erratic but suggests that mortality and wages were negatively related, with mortality lagging by fromzero to one year. The squared gain, not shown here, suggests an elasticity of about -0.5. (For an analysis of wages and mortality by causeof death in sixteenth- and seventeenth-century London, see Mirowski1976.)
I have also analyzed the relation of wages to the rate of natural increase; these results are also shown in figure 9.7. The coherence-squaredaverages about 0.15, with a very small lag of growth behind wages. Theelasticity is not a useful measure of sensitivity in this case. It is morehelpful to note that a doubling of the real wage would increase the population growth rate by about 1.25% per year, ceteris paribus.
Direct Links of Fertility to Mortality
I have so far discussed the relations of fertility and mortality to wages.Now I will briefly consider the possibility that there were direct links offertility to mortality, such that fertility would adjust to changes in mortality. Several such links have been suggested in the literature. One isthat, through inheritance, high mortality resulted in the transfer of assetsto the nubile, thus increasing nuptiality, then fertility (Ohlin 1961). Thecross spectrum of marriages and deaths lends some support to this hypothesis. However, it is only the redistributive effect that should becounted here; changes in the population/wealth ratio are an indirectinfluence of mortality on fertility, already reflected in the wage rate.Another suggested link is that couples may have attempted to replaceunexpected infant and child deaths and that, when mortality changed,they would eventually revise their mortality expectations and adjust theirfertility accordingly. This argument requires the assumption that couplescontrolled their fertility and strove for some number of surviving children, in contrast to the natural-fertility hypothesis. Knodel (1975) hasshown that this "replacement hypothesis" is false for a sample of preindustrial European parish populations. My own studies of the short-runrelation of fertility to mortality show a very strong negative relation.Perhaps the most convincing evidence that fertility did not stronglycompensate for mortality changes even over the long run is given byfigure 9.5, which shows a very close correlation of mortality and population growth rates over a period of 175 years.
To sum up section 9.3, I have shown that, at least in the short-run,there was an endogenous component to population change, operatingthrough nuptiality, marital fertility, and mortality. Presumably these
541 Perspective on Economic Aspects of the Population Explosion
Fig. 9.7 Cross-spectral estimates of deaths and rate of natural increase in relation to real wages for England, 1539-1839.Phase estimates indicated by solid circles correspond to significant estimates of coherence-squared and are more accurate than the others. Estimates were made using aParzen window with T = 301, M = 20. Deaths and wageswere measured as residuals from the regression of the logof the basic series on time. Natural increase was useduntransformed.
short-run relations also held over the long run, although these dataprovide no evidence on this point. Even in the short run, however, wagesaccount for only about 15 % of the variance in growth rates, so thatmost of the variation is exogenous. Furthermore, inspection of long-runlife-expectancy series, as in figures 9.1 and 9.4, suggests that long-runvariation in population growth rates was also dominated by exogenousvariation.
Under these circumstances, over the very long run, the average wagelevel will be an important determinant of average population growthrates. But even over the course of centuries, fluctuations of growth ratesabout that average level may be largely exogenous.
9.4 A Model of Economic-Demographic Equilibrium
At this point it will be helpful to introduce a simple equilibratingmodel relating fertility, mortality, wages, and population. Rent andterms of trade could also be added, but they play an essentially passiverole and would only clutter the diagram.
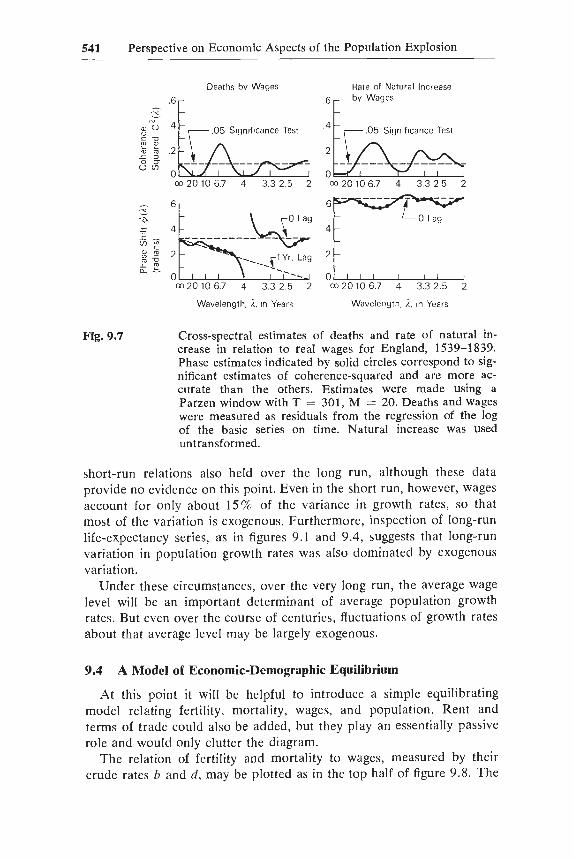
The relation of fertility and mortality to wages, measured by theircrude rates band d, may be plotted as in the top half of figure 9.8. The
542 Ronald Demos Lee
Wage (w)
----d(w)
~:!lUicQ<0:; N·a.0ll.
b(w)
w(N)
Fig. 9.8
Wage (w)
Economic-demographic equilibrium.
level and curvature of the birthrate curve are determined primarily bynorms and institutions, although at very low wages biological considerations may become important. Some societies might have horizontalfertility curves, if neither nuptiality nor marital fertility depended onmaterial well-being. Societies with institutional arrangements conduciveto high fertility, such as the extended family system, would have higherbirthrate curves than those with less pronatalist institutions, such as thenuclear family. The death-rate curve is primarily biologically determined, although such additional factors as income distribution, centralized famine precautions, and in some cases infanticide and geronticideare also important.
The population growth rate, equal to b - d, is given by the differencebetween the two schedules; where they intersect, the growth rate is zeroand the population is stationary. The corresponding wage, w*, is variously known as the "long-run equilibrium wage," the "natural wage,"the "conventional standard of living," or "subsistence."
The lower half of the diagram shows the relation between the wagerate and the size of the population; it corresponds to the demand forlabor, which I assume is fixed. Corresponding to the equilibrium wageis an equilibrium size of population, N*. There will also be equilibriumlevels of rent and terms of trade, which are not shown. Evidently the
543 Perspective on Economic Aspects of the Population Explosion
equilibrium is stable; when population size is below N* its growth ratewill be positive, and conversely.
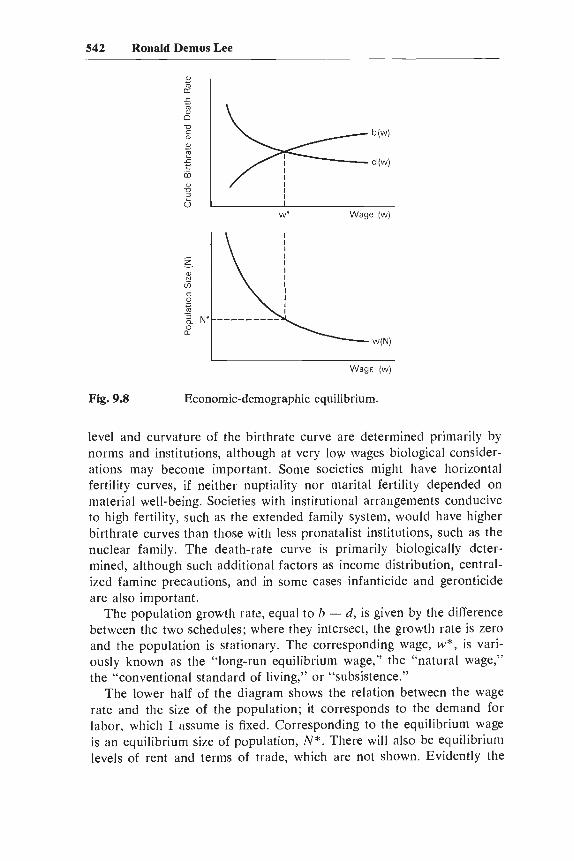
Now consider the effect of a once-for-all shift in the demand for labor;this situation is shown in figure 9.9. When w(N) shifts out to WI (N),the wage will initially rise, inducing population growth until populationattains its new equilibrium at the old wage level. Thus, over the longrun, population responds passively to economic advance, while a roughlyconstant level of material well-being is maintained; this is the "iron lawof wages."
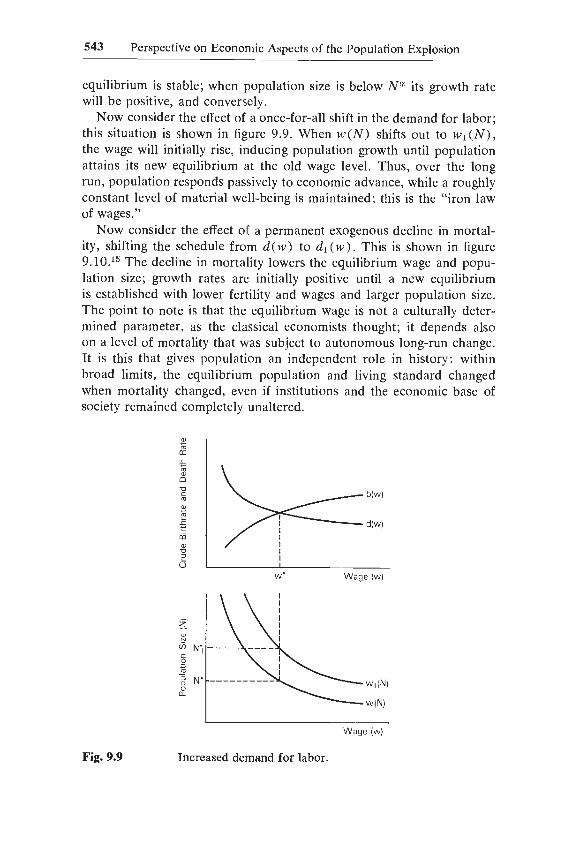
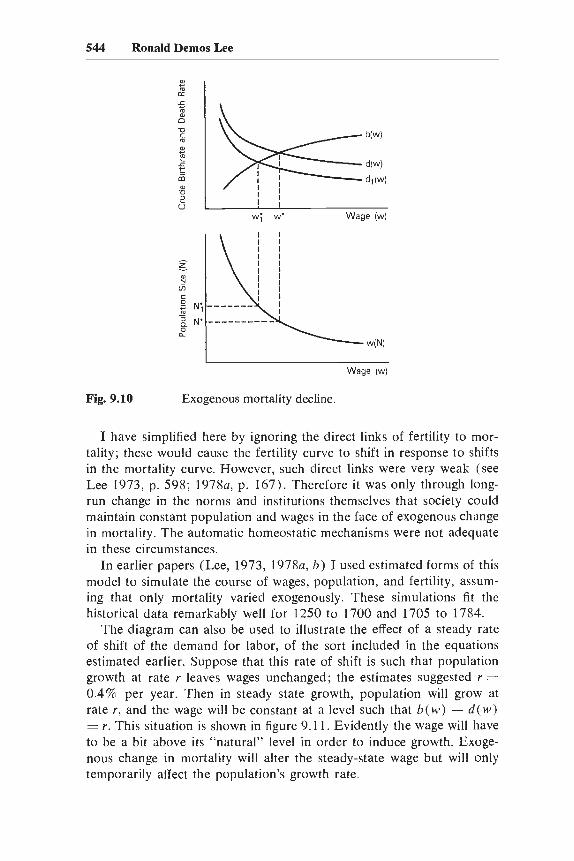
Now consider the effect of a permanent exogenous decline in mortality, shifting the schedule from d (w) to d1 (w). This is shown in figure9.10.15 The decline in mortality lowers the equilibrium wage and population size; growth rates are initially positive until a new equilibriumis established with lower fertility and wages and larger population size.The point to note is that the equilibrium wage is not a culturally determined parameter, as the classical economists thought; it depends alsoon a level of mortality that was subject to autonomous long-run change.It is this that gives population an independent role in history: withinbroad limits, the equilibrium population and living standard changedwhen mortality changed, even if institutions and the economic base ofsociety remained completely unaltered.
<l>;;;a:.<::;;;<l>
0u
b(w)c
'"<l>
~d(w)'E
to<l>
U::l
Uw· Wage (w)
wl(N)
w(N)
Fig. 9.9 Increased demand for labor.
Wage (w)
544 Ronald Demos Lee
b(w)
----d(w)
----d,(w)
Wage (w)
w(N)
IIII
~ i~ I
Cf) I
6 I~ Ni -------~ N' ----------aa..
Wage (w)
Fig. 9.10 Exogenous mortality decline.
I have simplified here by ignoring the direct links of fertility to mortality; these would cause the fertility curve to shift in response to shiftsin the mortality curve. However, such direct links were ver¥ weak (seeLee 1973, p. 598; 1978a, p. 167). Therefore it was only through longrun change in the norms and institutions themselves that society couldmaintain constant population and wages in the face of exogenous changein mortality. The automatic homeostatic mechanisms were not adequatein these circumstances.
In earlier papers (Lee, 1973, 1978a, b) I used estimated forms of thismodel to simulate the course of wages, population, and fertility, assuming that only mortality varied exogenously. These simulations fit thehistorical data remarkably well for 1250 to 1700 and 1705 to 1784.
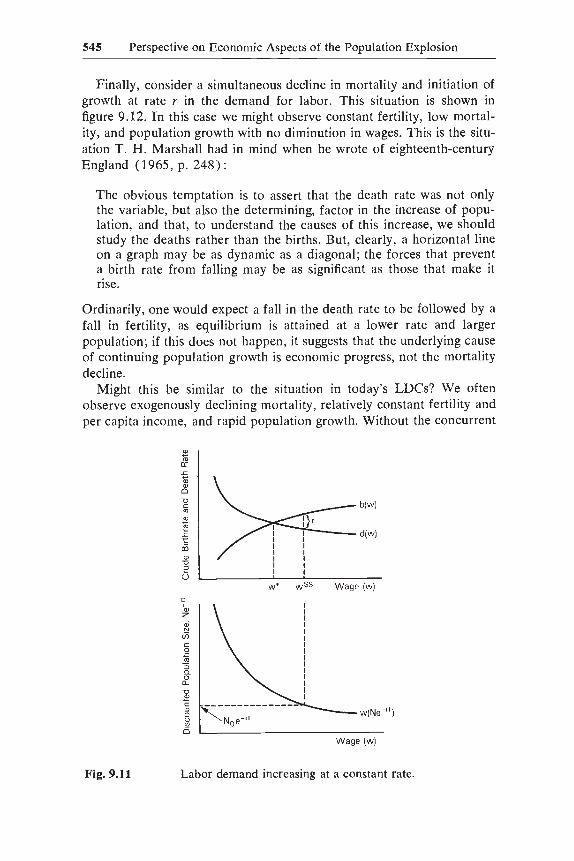
The diagram can also be used to illustrate the effect of a steady rateof shift of the demand for labor, of the sort included in the equationsestimated earlier. Suppose that this rate of shift is such that populationgrowth at rate r leaves wages unchanged; the estimates suggested r =0.4% per year. Then in steady state growth, population will grow atrate r, and the wage will be constant at a level such that b (w) - d (w)= r. This situation is shown in figure 9.11. Evidently the wage will haveto be a bit above its "natural" level in order to induce growth. Exogenous change in mortality will alter the steady-state wage but will onlytemporarily affect the population's growth rate.
d(w)
b(w)
545 Perspective on Economic Aspects of the Population Explosion
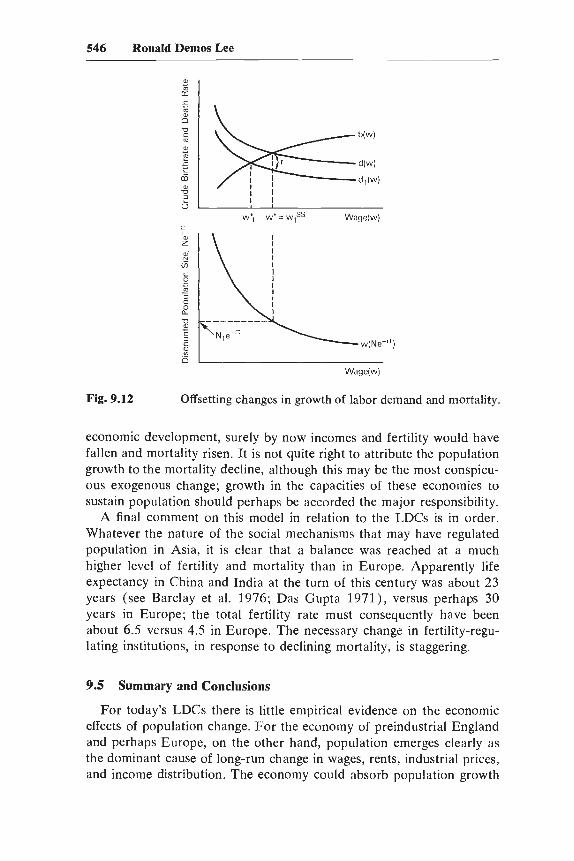
Finally, consider a simultaneous decline in mortality and initiation ofgrowth at rate r in the demand for labor. This situation is shown infigure 9.12. In this case we might observe constant fertility, low mortality, and population growth with no diminution in wages. This is the situation T. H. Marshall had in mind when he wrote of eighteenth-centuryEngland (1965, p. 248) :
The obvious temptation is to assert that the death rate was not onlythe variable, but also the determining, factor in the increase of population, and that, to understand the causes of this increase, we shouldstudy the deaths rather than the births. But, clearly, a horizontal lineon a graph may be as dynamic as a diagonal; the forces that preventa birth rate from falling may be as significant as those that make itrise.
Ordinarily, one would expect a fall in the death rate to be followed by afall in fertility, as equilibrium is attained at a lower rate and largerpopulation; if this does not happen, it suggests that the underlying causeof continuing population growth is economic progress, not the mortalitydecline.
Might this be similar to the situation in today's LDCs? We oftenobserve exogenously declining mortality, relatively constant fertility andper capita income, and rapid population growth. Without the concurrent
'"10a:
t;:Q)z~
Vico1i5"30.oc-
alc::>ouV>
6Wage (w)
Fig. 9.11 Labor demand increasing at a constant rate.
546 Ronald Demos Lee
b(w)
~---d(w)
~----dl(W)
Wage(w),.Q)
Za)N
ViCo
';::;m:;coc..
alc::>ou
'"(5
Wage(w)
Fig. 9.12 Offsetting changes in growth of labor demand and mortality.
economic development, surely by now incomes and fertility would havefallen and mortality risen. It is not quite right to attribute the populationgrowth to the mortality decline, although this may be the most conspicuous exogenous change; growth in the capacities of these economies tosustain population should perhaps be accorded the major responsibility.
A final comment on this model in relation to the LDCs is in order.Whatever the nature of the social mechanisms that may have regulatedpopulation in Asia, it is clear that a balance was reached at a muchhigher level of fertility and mortality than in Europe. Apparently lifeexpectancy in China and India at the turn of this century was about 23years (see Barclay et ai. 1976; Das Gupta 1971), versus perhaps 30years in Europe; the total fertility rate must consequently have beenabout 6.5 versus 4.5 in Europe. The necessary change in fertility-regulating institutions, in response to declining mortality, is staggering.
9.5 Summary and Conclusions
For today's LDCs there is little empirical evidence on the economiceffects of population change. For the economy of preindustrial Englandand perhaps Europe, on the other hand, population emerges clearly asthe dominant cause of long-run change in wages, rents, industrial prices,and income distribution. The economy could absorb population growth
547 Perspective on Economic Aspects of the Population Explosion
at about 0.4% per year with little effect; deviations of population sizeabove or below this trend line, however, had dramatic consequences.And perhaps more striking than the existence of these effects is the extreme sensitivity of the economy's reaction: reckoning in terms of agricultural goods, a 10% increase in population depressed wages by 22%;raised rents by 19%; lowered industrial prices relative to agriculturalprices by 17%; raised the ratio of industrial to agricultural productionby 13%; and lowered labor's share of national income by 14%. Thissensitivity of response poses the principal puzzle to emerge from thisresearch. My attempt to account for these large (in absolute value)elasticities by means of a very low elasticity of substitution of labor forland is not altogether convincing without corroborating evidence.
In this study I looked for negative consequences of population growth,and I found them. However, I made no effort to analyze such positiveeffects as the stimulation of agricultural investment or of technicalchange, the role of rising domestic demand for basic industrial commodities, or industrial wage rates held down by population growth andsharply diminishing returns in agriculture.16 Nor can these possible positive effects be brushed aside as merely partially offsetting reactions todominant adverse effects; if they in any way brought on the industrialrevolution, then their net effect was overwhelmingly positive. But surelythe links of today's LDCs with the world economy greatly reduce theadvantages of scale, home demand, and home-produced technology.Perhaps after all it is the centuries before the industrial revolution thatare most relevant for the LDCs, when population growth did have strongand predictable effects, beneficial for some social classes and damagingfor others. In any event, a more balanced treatment of these issueswould require a second paper.
Now let me turn to the causes of population change. There is a notionthat social mechanisms cause population to grow and decline in responseto changes in productive capacity, in such a way as to keep incomesclose to a culturally defined standard of well-being. And some whoreject this model as descriptive of the present still believe it is appropriate for the past. In fact it is a poor description of both. In preindustrial Europe, as far back as records will take us, population swings werelargely autonomous, not a response to economic variation. Their activedeterminant was mortality, which then as now experienced large exogenous variation. Our current experience is not unique in this respect, and,indeed, though the present decline in mortality has been much greaterand more sudden than those of the past, its effects on welfare have sofar been much less.
On the other hand, it would be a mistake to ignore the institutionalmechanisms of population control that existed in preindustrial times.The point is not that they were absent, but that the equilibriums to
548 Ronald Demos Lee
which they steered society were largely accidental, resulting as they didfrom the interaction of cultural control with independent mortality. Andwhile mortality largely determined the equilibrium and actual standardof living, it was the social mechanisms that produced sustained population growth in response to economic progress.
In short, the social protection of living standards through populationregulation has always been vulnerable to mortality change, and it wouldbe folly to expect longstanding demographic adjustment mechanisms toprevent population growth from forcing material welfare below someconventional standard in today's LDCs.
It is only in the very long run, over which the institutional mechanisms are themselves variable, that such automaticity can be expected,and the European experience suggests that even centuries may not suffice.
Appendix 1. Data Used in Figure 9.1 and Section 9.2
A. Life Expectancy
For 1250-1450, estimates are based on J. C. Russell's (1958) lifetables that refer to the mortality experience of a predominantly upperclass, geographically dispersed group of English males holding propertygranted by the king. Some errors in the original tables were corrected;the infant mortality rates in the tables were revised; and estimates wereconverted from a cohort to a period basis. These estimates appear consistent with scattered evidence for other social classes. For details on allthis, see Lee (1978b, appendix 4).
For 1550 to 1725, the estimates are based on Hollingsworth's studyof the British peerage (1964). These estimates refer to the mortalityof male peers. I have converted them from a cohort to a period basis.Extensive comparisons suggest that these estimates accurately reflectrelative changes in the mortality of other social groups through 1725.For details, see Lee (1978b, appendix 2). Between 1450 and 1550, lifeexpectancy estimates are not available.
B. Population Size
From 1250 to 1540, the dotted line indicates rough estimates of population size, based principally on Russell's work (1948); for details seeLee (1978b, appendix 1).
The remaining population estimates for 1540 to 1800 are based on apreliminary version of the Cambridge Group's aggregate parish register
549 Perspective on Economic Aspects of the Population Explosion
series. These series, generously made available to me by E. A. Wrigleyand Roger Schofield, give the annual number of baptisms and burialsfor a nonrandom sample of 404 English parishes, covering about 6 or7% of the total population. Various adjustments were made to correctfor gaps, underregistration, and the entry and departure of parishes toand from the sample. Using a variety of methods, population size for thesample was estimated to be roughly 230,000 at the beginning of theperiod. Annual population estimates were formed by cumulating the difference between adjusted baptisms and burials, resulting in a populationsize of 1,055,000 for 1840. This implies a 4.6-fold increase over thethree centuries, agreeing well with estimates from other sources. Estimates for the sample were inflated to the national scale using a ratiocalculated for the end of the period when national population data areavailable. These estimates are preliminary. Figure 9.1 shows populationsize at five-year intervals, for 1540, 1545, ... , 1800.
C. Real Wage (w)
The numerator (W) of the real wage series is taken from PhelpsBrown and Hopkins (1955), with some interpolation, for 1261 through1700. It is the wage for building craftsmen. Thereafter, it is taken fromDeane and Cole (1969, p. 19) and represents a population-weightedaverage of regions. A splicing ratio was derived from the overlap. Thefigure for 1790-99 was again taken from Phelps-Brown and Hppkins(1955). \, 1
For 1261-1400, the deflator of the real wage series is the PHelgsBrown and Hopkins (1956) cost of a composite basket of consumablesincluding both agricultural and industrial commodities.
For 1401 to 1800, the deflator is an agricultural price index (PA ). Itis taken from Phelps-Brown and Hopkins (1957), through 1700. From1701 to 1760 it is based on the Phelps-Brown and Hopkins grain indexas reported in A. H. John (1967, p. 191), using the overlap 1671-1700to derive a splicing ratio. For 1761-1800, a wheat price index fromDeane and Cole (1969, p. 91), is used, with splicing ratio based on1641-70.
D. Terms of Trade (PFlPA )
The denominator, PA , is exactly as described above in section C. Thenumerator, PI, is taken from Phelps-Brown and Hopkins (1957) through1700; thereafter the series is based on the average of the SchumpeterGilboy producers' goods index and consumers' goods other-than-cerealsindex, as reported in Deane and Cole (1969, p. 91). Because this average gives animal products a weight of 1/11, I assumed animal productswere similar to wheat and subtracted 1/1 1 of the wheat price series from
550 Ronald Demos Lee
it. The splicing ratio was calculated from the Gilboy-Schumpeter indexfor 1680-1710, as reported in Mitchell and Deane (1962, p. 468). Theprice ratio, P, was calculated as p = 100(PIiPA ).
E. RentlWage Ratio (Rlw)
The nominal rent index (RPA ) is taken from Kerridge (1953) and isan average of the two series for the Herbert estates (with weight 114each) and the Seymour estate (with weight 1/2). The ratio Rlw is calculated as RPAIW times 100.
Appendix 2. Formal Development of the Two-SectorModel
This appendix sets out the assumptions of the model explicitly and develops a number of results that are used in the main body of the paper.The development presented here owes much to Marc Nerlove, particularly the material in section C. In what follows, agricultural output isthe numeraire.
A. Assumptions
(AI) A = !'-O(IL1F-(3 + (1 - ILl )N.{ -Il) -l/ll.
Agricultural production follows a constant return to scale, constantelasticity of substitution production function, with inputs of labor andland-plus-other factors.
(A2)
Nonagricultural production follows a fixed-coefficients productionfunction with inputs of labor and agricultural output; units of measure for labor and agricultural output are chosen so that the production coefficients are unity.
(A3) WI = W.l = W.
Wages are equal in the two sectors.
(A4) w = (jAlaN..l.
The wage in agriculture is competitively determined.
(AS)
The price of industrial output equals its cost of production.
(A6)
551 Perspective on Economic Aspects of the Population Explosion
There is full employment (or employment of a constant proportionof the working-age population).
(A7) pI = '\(A -I) or, equivalently, (A -1)/(A -I+pl) = 1/(1 +'\).
The demand for nonagricultural output is such that net agriculturaloutput is a constant proportion of total net output, valued at currentprices.
B. Derivation of the Sectoral Allocation of Labor
Let YA be labor's proportional share of agricultural product; by (A4)this equals EA,NA X NA can be expressed as:
(A8)
From equation A2 it follows that I = NI, and combining this withequation A7 and solving for N] yields:
(A9) N] = AA/(p + '\).From equations A8, A9, and A6 it follows that:
(AIO) NA/N = YA/[YA + ,\w/(p + ,\)],which gives agricultural employment as a proportion of the total laborforce.
C. The Effect of Population Growth on the SectoralAllocation of Labor
The goal here is to derive an explicit expression for the elasticity ofN A with respect to N, From equations A6 and A9 it follows that:
(All) NA=N-AA/(p+,\).
(AI2)
(A13)
Differentiating with respect to N gives:
oNA _ 1 _ oNAIoA/oNA _ Aow/oNA1oN - ,\ oN p+,\ (p+,\)2 \.
Solving equation A 12 for oNA/oN yields:
oNA = 1/ 11 + ,\oA/oNA _ AAow/oNA 1.oN p + ,\ (p + ,\)2 \
From equation A9:
(A14) A!(p +,\) = NI!A.
Substituting in equation A 13 yields:
(A1S)
(A17)
552 Ronald Demos Lee
oNA = II 11 + N/oAloNA _ N/owloN,1 ) .oN A p + It \
Multiplying by N INA on both sides yields:
(A16) E = II ~ N A NAN/oAloNA _ NAN/owloNA)NA ,N ( N + AN N(p + It) \
This can be rewritten:
\ N] N] w)EN.4 .N = II { 1 - (1 - 1'.1) N - N Ew,NA (p + It) \
Equation A17 relates two unknown and unobservable elasticities, E~A .N
and Ew,NA
• Fortunately these same two elasticities are also related by the.identity:
(A18)
(A20)
where Ew,N is directly estimable. Substituting from equation A 18 intoequation A17 yields:
(A19) l N[ EIt',N N] w lEN N=11 1-(1-1'.1)------- .A' N E NA ,NN P + It
Solving for ENA ,N yields:
\ N/ w iENA ,N = ( 1 + Ew,N N (p + It) \ I
II - (l - 1'.1) ~ I·This last equation permits estimation of ENA ,N from estimable quantities.
And it is also true, of course, that:
(A2l)
D. Estimation of EW,NA
and the Elasticity of Substitution in Agriculture
Once we have derived the effect of population change on the sectoralallocation of labor, ENA .N, it is simple to find E lV ' NA and (T = I/O + (3).
In fact, Ew,N.1 can be calculated directly from equations A20 and A 18.
Since the elasticity of substitution equals - (1 - 1'.1) / E" ..,A. ' it is also
true that:
(A22)
Substituting from equation A20, this gives:
553
(A23)
or
(A24)
Perspective on Economic Aspects of the Population Explosion
E. Rent and Population
From equations Al and A4 it follows that:
(A25)
This could be estimated in log-linear form, except that N A is not directlyobserved. However if E Rlw.N is estimated, then ERlw,NA = 1 + f3 = I/O'
can be calculated as:
(A26)
or
(A27)
F. The Effect of Population on the Ratio of Industrial toAgricultural Output in Real Terms
Solving equation A7 for I, and dividing by A, gives:
(A28) I/A = AI(>.. + p).
Calculation of the elasticity of 1/A with respect to N yields:
(A29) ElIA,N = -WEw,N/(P + >..).
Inspection shows that this is a positive number; population growth increases industrial output more, proportionately, than agricultural output.In fact, since I = Nj, and N[ = N - N.t, the elasticity of I with respectto N is easily shown to be:
(A30)
Thus, to a first approximation, industrial output increases in proportionto population; more accurately, it increases more than proportionatelywhen EN{ ,N is less than one.
554 Ronald Demos Lee
G. Population and Terms of Trade
Since p = 1 + w, it is easily shown that:
(A31 )
where 'Y1 is w / (1 + w), the share of labor in the cost of industrial production.
H. Population and Income Distribution
In the model, all income accrues either to labor or to "land" (whichincludes all agricultural nonlabor inputs). Labor's share of output inproportionate terms, denoted S, is therefore:
(A32) S = wN/(wN + R) = 1/[1 + R/(wN)].
Dividing numerator and denominator of R/ (wN) by A gives (I - 'YA) /('YAN/NA), so equation A32 can be rewritten:
(A33)
so that labor's share in all output is greater than it share in agriculturaloutput.
Equation A33 can also be used to calculate 'YA, which is unobserved,from Sand N A/N, for which estimates exist. Solving for 'YA yields:
(A34) 'YA = (SNA/N)/O - SNIiN).
The elasticity of labor's proportionate share with respect to population size can be calculated from equation A32 as follows:
(A35) oS NoNS--([()(R/w)/oN](l/N) + [o(l/N)/oN](R/w)}N .
[1 + R/(wN)]2{1/[1 + R/(wN)']}
This simplifies to:
(A36) ES•N = -{o(R/w)/oN - R/(wN)}
/[1 + R/ (wN)],
which further simplifies to:
(A37) ES,N = (1 - ER/w,N) (I - S),
which is easily evaluated.
1. Nonagricultural Technical Change, Wages, and Labor ForceAllocation
Suppose equation A2 is altered to: I = min (NIia,A 1), so that al= N1 and p = aw + 1. Then equation All becomes:
(A39)
555 Perspective on Economic Aspects of the Population Explosion
(A38) N A = N - aM/Caw + 1 + '\).This can be differentiated to find the effect of a change in a on laborforce allocation, for constant N.
oNA -,\ oA oNAoa (p+,\)2 {(A + oNA OW a)(p+,\)
(w+ OW oNA ) A}a oNA oa a .
After solving for oN.doa and simplifying:
(A40)
(A4l)
1 + '\aw _ ,\a2A ow/oNA '
p + ,\ (p + ,\)2
Further simplifying, and expressing as an elasticity, this gives:
EN.4 .C< = -1/{pNA/NI - [aw/(l + ,\)]EW •NA )
It is also easily shown that ENI.c< = -(NA /NI )EN.4 .c< so that:
(A42)
And, finally, the effect of changes in a On ware easily assessed, since:
(A43)
Notes
I. He has shown that in a stable population with growth rate r, whose economyhas a rate of disembodied technological progress s, and in which savings are lessthan or equal to profits, the internal rate of return to a marginal birth, viewed asan investment, is less than or equal to r + s. If r is 0.02 and s is 0.01, then discounting over a life cycle at a rate above 3% yields a negative present value of abirth.
2. This may in part reflect their methodology. In a single-sector neoclassicalgrowth model, rates of population growth have no effect on steady-state growthrates. Weak negative effects arise in transitional disequilibriums, and strong effectsoccur in nonneoclassical economies with surplus labor. It might be worth redoingthe analysis while distinguishing among these three categories.
3. See, for example, Van Bath (1963); North and Thomas (1973); and PhelpsBrown and Hopkins (1959). Properly put, the argument is that population changeaccounted for changes in relative prices over the period; some historians, however,go too far and suggest that population growth caused the general 'price inflationof the sixteenth century. For a perceptive review see McCloskey (1972). In arecent paper, Cohen and Weitzman (1975) have suggested that the process ofenclosure might also explain these changes; however, they have drastically underestimated the strength of the demographic data.
556 Ronald Demos Lee
4. For the regression covering the years 1250 to 1700, the Phelps-Brown andHopkins (1956) real wage series was used, which is money wages deflated by theprice of a basket of goods including both agricultural and industrial items. Thewage series used for 1705-89 was deflated in a similar manner; it is based on datagiven in Deane and Cole (1969, p. 19) and takes account of regional differencesin wages and population growth rates.
5. In any case, if the economy is viewed as open, then relative prices are determined in large measure exogenously. But until midway through the eighteenthcentury, Europe accounted for most of England's trade (see Deane and Cole 1969,p. 34), and changes in European factor supplies and factor prices paralleled thosein England (see e.g. Phelps-Brown and Hopkins 1959).
6. This view of the English economy, which emphasizes land and labor to thetotal exclusion of capital, receives some support from estimates of the capital stockin the late seventeenth century. From Gregory King's tabulations, Deane and Cole(1969, p. 270) estimate that 64% of capital was in land, 8% in livestock, 17.5%in buildings, and only 10.5% in transportation, inventories, machines, and themilitary. The saving rate was 3 to 6%, and savings went to a considerable extentinto agriculture.
By 1698, the "industrial" category had risen to about 21%, while land had fallento 55%; but the economy's capital was still largely agricultural (Deane and Cole1969, p. 271).
7. In 1798, roughly 12% to 16% of the population were "living-in" employees;of these, domestic servants were the largest group. See Mathias (1969, p. 25). In1801, according to Colquhoun, about 7.5% of the population were personal andhousehold servants.
8. According to Deane and Cole (1969, p. 154-64) the proportional share ofagriculture in national income was 40-45% in 1688 and in 1770; by 1801 it haddeclined to about 32-36%. Pollard and Crossley (1968), put the 1688 figure at56%, which if correct would change the picture considerably.
9. Mean values are needed for the variables N/N, I'A' Ew,N and w/(p + )1,),all of which are actually endogenous. Based on Gregory King, Deane and Cole(1969, p. 137) estimate that 60 to 80% of the labor force was primarily engagedin agriculture in 1688. Since many of those primarily engaged in agriculture nonetheless did nonagricultural work as by-employment or for their own consumption,I will take 65% as the proportion of labor services engaged in agriculture: soN[IN = .35.
An estimate of I'A can be derived from an estimate of S, labor's share of totalnational income, using equation A34. For 1688 Deane and Cole, based on GregoryKing, estimate that between 25% and 39% of national income was wages andsalaries. However, not included is the labor contribution of farmers and freeholders, whose income accounts for about 40% of national income. I will somewhatarbitrarily take S =.55, which implies that I'A =.45. Ew .N has been estimated tobe -2.22 in equation 20; w/(p +)1,) should be estimated for the mean amountof labor augmentation. Taking )I, = I (i.e., 50% of final product is in agriculture),and w =3, gives w/(p + )1,) = .6.
10. In transformed terms, w =3 and p =w+ I =4. Since agricultural pricesare by definition I, the quantity of J consumed must be 114 as large as that of A.Thus w* =wl[e + (eI4)p] = (4Ie)[w/(w + 5)]. From this, EK,N = [5/(5 + w)]Eu;.N = (5/8)Ew ,N evaluated at w = 3.
I I. See Lee (1971) for a comparison of this series with others for Colyton, asmall rural parish, and for "professional men" in England.
557 Perspective on Economic Aspects of the Population Explosion
12. The theoretical cross spectrum is ideally suited to analyze the interactionsof two series that are related to one another approximately linearly with knownsets of lagged coefficients. as is the case with demographic series.
13. The variables are measured as residuals from the regression of the log ofthe basic series on time.
14. Many dozens of previous studies of populations, in many social contexts andtime periods, have demonstrated this sort of procyclical response, including situations in which the cross-sectional and secular relationship of fertility to incomeappears to be negative. Therefore this cross-spectral evidence is weak support atbest for the existence of a long-run positive aggregate relation of fertility andincome.
15. For diagrammatic simplicity. I have assumed that fertility is completelyindependent of mortality. so that hew) remains unchanged. The results are notqualitatively different so long as compensation is less than perfect.
16. These positive effects of population growth have been stressed by Boserup(1965) and others and have been modeled and simulated in a recent article bySimon (1976).
Comment Nathan Keyfitz
Is population growth the cause or the result of economic change? Ronald Lee tackles nothing smaller than this central problem of demography.The answer he provides is limited in space and time, but his analysis isnonetheless a tour de force combining economic time series, parishrecords, and simple models.
Everyone wants to endogenize population in his economic model, butthere are doubts whether the real world is made in a way that permitsthis. Adam Smith seemed to do it: for him the production of peopleresponded to the demand, just like the supply of shoes. For Malthus thenumber of people the landscape could support was limited just like thenumber of animals that could be sustained on a given food supply.Though they did not use the expression, Smith and Malthus in their different ways both saw a negative feedback by which the family receivedsignals either from the larger society or from the environment, and sofamily behavior could never be destabilizing.
Neither view is wholly inapplicable-places and times can be foundto illustrate both. So can places and times be found in which they do notapply. The Kung Bushmen, with densities of about one person per twosquare miles, do not seem to produce people up to either the economicor the biological limit. They avoid any sense of population pressure,keeping their numbers below the physiological maximum-by whatmeans and under what motivation no one seems to know.
Nathan Keyfitz is professor of sociology at Harvard University.
558 Ronald Demos Lee
Thus population in some places goes up either with capital (Smith)or with land (Malthus); among the Kung and elsewhere it stays wellbelow the limits set by either. To make matters more difficult, the dominant tendency in most industrial societies has been for the birthrate togo down with the increase of income, a social mobility effect that overcomes the Smith and Malthus effects. The would-be endogenizer doesnot even know whether to insert in his model a positive, zero, or negativerelation of population to income, let alone how strong to make thatrelation.
Lee's empirical finding that in preindustrial Europe income does notaffect population accords with the theoretical ambiguity. However, inthe other direction there does appear to be clear causation both theoretically and empirically. The result that when population rose by 10%,as it could easily do in a period of low mortality, wages went down by15 %, is surprising and important. The two-sector model is simple andconvincing. My only wish is that he could reassure us more about thequality of the wage and other data to which it was fitted.
What is implicit in Lee's paper, as in other work, is two systems: thesmall system of the family and the large system of the population,whether it be parish, county, nation, or world. Each of the two systemshas its own laws and variables, and the two sets of variables mesh differently in different circumstances. This paper tells us something importantabout both the small and the large systems as well as about the relationbetween them in preindustrial England.
It considers Smith's device for linking the two through the birthrate:with more capital and hence more jobs, young people will be able tomarry earlier and so will have children sooner. Lee shows that the number of children within marriage did vary with jobs, a feature Smith didnot recognize. But this and marriage seem to have been less importantthan the exogenously caused fluctuations in the death rates whose actionis the main feature of the paper.
Lee mentions at the beginning of his paper the belief that in moderntimes the old regulatory mechanisms have broken down under the influences of mortality decline, urbanization, technical change, and modernization in general. He speaks of the finite world of preindustrial Englandwith limits not yet rendered flexible by technology, and of how ancientregulatory mechanisms fail to operate in the twentieth century. But thenat the end of the paper he transfers his major result from preindustrialEngland to the present LDCs. I am more convinced by his initial reservation than by his later transfer. For various reasons it seems unlikelythat the currently developing countries will duplicate Europe's earlyexperience.
The most conspicuous difference is in the rapid urbanization of theLDCs. In past centuries when remnants of feudal class respect were
559 Perspective on Economic Aspects of the Population Explosion
still controlling, communication was slow, and most of the populationworked on the land, fluctuations of income were accepted even whenthey brought part of the population below the starvation line. In the1970s, with huge migration to the cities-Cairo, Calcutta, Mexico Cityeach have as many people as the whole of England and ten times asmany as London-surplus population has a social and political visibility that daily reminds the elite of the importance of birth control. Eachday's newspapers tell us about a turnaround or accentuation of birthcontrol policy in one or another country, conspicuously in certain countries where urbanization is most rapid.
But this does not say anything about the smaller system-it refersonly to the policy of the larger society. Does the turnaround that isoccurring in elite views tell us what will happen within the smallersystem of the family? How can the elite control the family-buildingpractices of their masses? Certainly they cannot do so directly or immediately. By the 1990s we should have a clear idea of the manner anddegree in which currently visible economic and political forces of thelarger society will penetrate the family. Sooner or later they will; it isthe timing that is important. How much will the current fall in mortalityand rapid population growth affect wages in the LDCs? One has troubleseeing how such a question can be answered by analysis of the forcesoperating in preindustrial England.
But this doubt about generalizing to the late twentieth century in noway lessens my admiration of Lee's historical work. His choice of modelsis judicious, and the method will be exemplary for others who use timeseries and parish registers to answer real questions.
Comment Marc Nerlove
In 1973 Lee published a paper entitled "Population in PreindustrialEngland: An Econometric Analysis," based on his 1971 dissertation.1
In that paper Lee presented a model relating crude birthrates and deathrates, population size, and the real wage rate that is the same in allessentials as that underlying figures 9.7, 9.8, 9.9 and 9.10 in the presentpaper. In the model of economic demographic equilibrium, real wagesand population sizes are inversely related, whereas fertility, as measuredby the crude birthrate, is positively related and mortality, as measuredby the crude death rate, is' negatively related to real wages. Populationsize is simply connected with the crude birthrate and death rate by theidentity
Marc Nerlove is associated with Northwestern University.
560 Ronald Demos Lee
(1) dPd/P=b-d,
where P is population size and band d are the crude birthrate and deathrate, respectively.
Lee estimated the basic relationships of his model using fifty-yearaverages of population size (aggregate data from Wrigley and Russell),a wage index (from Phelps-Brown and Hopkins) deflated by an indexof prices for both agricultural and nonagricultural commodities, and lifeexpectancies at birth for the peerage (from Russell and Hollingsworth).Assuming a stable population, Lee was able to derive estimates of thecrude birthrate and death rate from the growth of population over time.The basic equations of the model-real wages as a function of population size, and crude birthrate and death rate as functions of the realwage rate-were estimated for the period 1250-1700 using both ordinary least squares and two-stage least squares, assuming mortality to beexogenous.2 Indeed, the simple correlation between mortality and thereal wage turns out to be positive in this period, a result that can beattributed almost entirely to the simultaneity of the system Lee considers. It is also possible to estimate many of the basic parameters of thesystem without using the wage data at all, or without using the population or fertility data but only the crude death rates related to the lifeexpectancy data, by exploiting the overidentification of Lee's system.These estimates provide tests of the overidentification of the system andits consistency with the data, unreliable as these may be.
On the basis of his 1973 analysis, Lee concluded that "long-runchanges in the real wage are adequately accounted for by changes inpopulation size" and that "there were no dramatic shifts in the demandfor labor over this period.... The relationship between population andthe real wage was stable until the beginning of the eighteenth century, atwhich time it began to change markedly.... The great swings in population during this period were due to swings in mortality." These latterwere largely exogenous according to Lee (1973, pp. 604-5). Lee founda "highly variable equilibrium wage in conjunction with a relativelyconstant demand for labor" (1973, p. 606).
It is worth stressing two aspects of Lee's earlier paper in conjunctionwith the one presented at this conference. First, "The end point, 1700[of the period analyzed], was chosen because the relation between wagesand population size began to shift unmistakably after this, and becausethe mortality of the aristocracy, from which we have derived our estimates, was no longer representative of that of the general population"(Lee 1973, p. 583). Second, the interpretation of the wage-populationrelationship, in terms of a one-sector model with a Cobb-Douglas production function, is a key element in assessing the adequacy of this
561 Perspective on Economic Aspects of the Population Explosion
central relationship of the economic-demographic model. Lee's difficulties in this connection have led to an extensive investigation, in thepresent paper, of a two-sector model with a CES production functionfor agriculture and fixed-coefficients technology for the nonagriculturalsector. This two-sector model was discussed in detail at the conferencein an appendix to these comments. That material, however, has beenlargely incorporated in Lee's Appendix 2 and is therefore omitted here.
The paper under discussion contains four important innovations:1. Lee utilizes greatly superior population data derived from the
sample of 404 parish registers collected by the Cambridge Group forthe History of Population and Social Structure, spanning the period1538-1840. For some analyses Lee has used decadal averages, forothers the annual data themselves, and the latter are clearly essential tothe cross-spectral statistical analyses he carries out in section 9.3.2.
2. This paper focuses on a later period, 1530-1800 (sometimes1839) for which the clearly superior data are available. Use of betterdata is certainly desirable, but, especially in view of Lee's earlier cautionary statement concerning the noncomparability of the period after1700 with the period before, combining data for the period after industrialization had clearly gotten under way with prior data may raise someserious questions about the stability of the relationships estimated. Tosome degree Lee tries to handle this problem in his regression (eq. 3),but he succeeds only in capturing an acceleration of the trend in realwages after 1809 and does not detect a significant shift in the two subperiods 1639-1745 and 1746-1839. However, this analysis should bereworked using real wage data more appropriate to the two-sector model(deflating money wages by agricultural prices alone rather than "an indexof both agricultural and industrial prices). The regression result reportedin equation 20 uses data from 1540 only to 1800 and omits a variabledesigned to detect acceleration of the trend in the demand for laborafter the Napoleonic wars and is thus not so directly comparable.
Using the older set of data, Lee reports a significant shift of the wagepopulation relation between 1250-1700 and 1705-89 in the form of afivefold increase in the rate of exponential trend.
3. A central, and most attractive, feature of the present paper is itsattempt to interpret the real wage-population relation within the framework of a two-sector model that assumes CES technology in the agricultural sector and fixed coefficients in the nonagricultural sector. Despiteseveral limitations, this new model allows a much richer set of tests forconsistency of the relationship between real wages and population important in Lee's later analysis of economic-demographic interactions.The two-sector model and its implications are described in detail inAppendix 2 to Lee's paper.
562 Ronald Demos Lee
Major limitations in the model and its estimation, of which Lee isaware, include: (a) The fact that under CES technology, in either atwo-sector or a one-sector model, the elasticity of the real wage withrespect to the labor force is not constant and should not be treated assuch in estimating the relationship between real wages and population.(b) The assumption that net agricultural production is a constant proportion of total output valued at market prices is surely a poor oneduring a period that encompasses the beginning of rapid industrialization. Moreover, two-sector model results tend to be quite sensitive toassumptions on the demand side. (c) The inverse projection methodused to estimate labor force from population size by taking age structureinto account may not be entirely adequate when using data for relativelyshort periods during which fertility and mortality may be changing rapidly. (d) Finally, the use of OLS instead of simultaneous-equationsestimation procedures in a model in which population or labor force orboth is, potentially at least, endogenous is inappropriate. This treatmentcontrasts with Lee's 1973 paper, in which both OLS and two-stateleast-squares procedures were used in some of the estimations. Lee,however, does go to some lengths in section 9.3 to show that populationmay be treated exogenously and that it varied largely in response tovariations in mortality, which was not itself affected by the real wage.
4. The discussion in section 9.3 of the interrelations among fluctuations in mortality, marital fertility, nuptiality, and real wages representsan important modification and amplification of Lee's earlier work, although much of this material has been developed in subsequent paperspresented at MSSB conferences or published elsewhere. All of this workrelies heavily on cross-spectral analysis, which Lee argues has to be usedbecause "for compelling reasons, the theoretical analysis had to be carried out in spectral terms." I would be the last person to argue againstuse of frequency domain techniques in appropriate circumstances, butI have yet to see a distributed lag relationship that could not be moreeasily interpreted in the time than in the frequency domain. Moreover,cross-spectral estimates, especially of phase, are notoriously difficult tointerpret when the coherence between the two series analyzed is highlyvariable and frequently low. In addition, it is not at all clear to me thatLee's general finding that marital fertility and nuptiality were related toreal wages and the population size and age structure only at high frequencies (1/15 cycle/year and higher) is evidence that such relationsare not important for the wage population and other relations that Leefits in section 9.2 and interprets further in section 9.3.3. In the firstplace, Lee has not used ten-year averages throughout, although he mightargue that use of such averages constitutes a low frequency band-passfilter that allows him to look only at movements unaffected by the feedback between real wages and population size and structure. In the sec-
563 Perspective on Economic Aspects of the Population Explosion
ond place, even if he had used such averages, they do not constitute anappropriate filter, and substantial "contamination" of his estimates islikely to occur. And finally, as Lee recognizes, low and high frequenciesdo not represent appropriately the economist's intuitive distinction between long- and short-run movements and relations, nor is filtering byband-pass filters a good way to get at the dynamic lag structure thatmust surely lie at the heart of a 'lseful formulation of the nexus ofeconomic-demographic interactions.
Lee concludes his paper with the comment that, "For the economyof preindustrial England ... population emerges clearly as the dominantsource of long-run changes in wages, rents, industrial prices, and incomedistribution," whereas, "For today's LDCs there is little convincing empirical evidence of the economic effects of population change." Fromwhat I have heard at this conference and read elsewhere, I would say,quite to the contrary, there is plenty of empirical evidence that population change and economic growth and development are intimately related-only lots of it is conflicting! Perhaps what Lee means to say, andI would heartily agree, is that we have a long way to go before we reallyunderstand these connections for today's LDCs. I add that, despite Lee'spioneering work, we also have some distance to go in understanding thenexus for preindustrial and industrializing England.
Notes
1. Lee (1973). The dissertation, Econometric Studies of Topics in DemographicHistory (Harvard University) has been published as Lee (1978b).
2. There is a sreat deal of discussion in Lee's paper about the possibility thatmortality is not exogenous and that that of the peerage may not reflect mortalityin the population at large. Obviously it is not possible to do justice to Lee'slengthy and complex discussion in this brief summary.
References
Barclay, George; Coale, Ansley; Stoto, Michael; and Trussell, James.1976. A reassessment of the demography of traditional rural China.Population Index 42, no. 4 (October): 606-35.
Boserup, Ester. 1965. The conditions of agricultural growth. Chicago:Aldine-Atherton.
Chambers, J. D. 1972. Population, economy and society in preindustrialEngland. Oxford: Oxford University Press.
Chesnai, Jean-Claude, and Sauvy, Alfred. 1973. Progres economique etaccroisement de la population: Une experience commentee. Population 28 (July/October): 843-57.
Coale, Ansley, and Hoover, Edgar. 1958. Population growth and eco-
564 Ronald Demos Lee
nomic development in low-income countries. Princeton: PrincetonUniversity Press.
Cohen, Jon, and Weitzman, Martin. 1975. A Marxian model of enclosures. Journal of Development Economics 1:287-336.
Das Gupta, Prithwis. 1971. Estimation of demographic measures forIndia, 1881':"1961, based on census age distributions. PopulationStudies 25, no. 3 (March): 395-415.
Deane, Phyllis, and Cole, W. A. 1969. British economic growth 16881959. 2d ed. Cambridge: Cambridge University Press.
Dubos, Rene. 1965. Man adapting. New Haven: Yale University Press.Easterlin, Richard. 1972. Population. In Contemporary economic issues,
ed. Neil Chamberlin. Homewood, Ill.: Richard Irwin.Enke, S. 1960. The gains to India from population control. Review of
Economics and Statistics (May): 175-81.Everitt, Alan. 1967. Farm labourers. In The agrarian history of Eng
land and Wales. Vol. 4. 1500-1640, ed. H. P. R. Finberg. Cambridge: Cambridge University Press.
Finberg, H. P. R., ed. 1967. The agrarian history of England and Wales.Vol. 4. 1500-1640. Cambridge: Cambridge University Press.
Habakkuk, H. J. 1965. The economic history of modern Britain. InPopulation in history, ed. D. V. Glass and D. E. C. Eversley. Chicago: Aldine.
Harberger, A. 1958. Variations on a theme by Malthus. In The population ahead, ed. Roy Francis. Minneapolis: Minnesota UniversityPress.
Hollingsworth, T. H. 1964. The demography of the British peerage.Supplement to Population Studies 18, no. 2 (November): 1964.
John, A. H. 1967. Agricultural productivity and economic growth inEngland 1700-1760 (with a Postscript). In Agriculture and economicgrowth in England 1650-1815, ed. E. L. Jones. London: Methuen.
Kelley, Allen, and Williamson, Jeffrey. 1974. Lessons from Japanesedevelopment. Chicago: University of Chicago Press.
Kerridge, E. 1953. The movement of rent, 1540-1640. Economic History Review, 2d ser., 6, no. 1 (August): 16-34.
Kmenta, Jan. 1971. Elements of econometrics. New York: Macmillan.Knodel, John. 1975. Influence of child mortality on fertility in European
populations in the past: Results from individual data." In Seminaron infant mortality in relation to the level of fertility, ed. Committeefor International Coordination of National Research in Demography,pp. 103-18. Paris: CICRED.
Kuznets, S. 1967. Population and economic growth. Proceedings of theAmerican Philosophical Society 3, no. 3 (June): 170-93.
Lee, Ronald. 1973. Population in preindustrial England: An econo-
565 Perspective on Economic Aspects of the Population Explosion
---. 1974. Estimating series of vital rates and age structures frombaptisms and burials: A new technique, with applications to preindustrial England. Population Studies 28, no. 3 (November): 495512.
---. 1975. Natural fertility, population cycles, and the spectral analysis of births and marriages. Journal of the American StatisticalAssociation 70, no. 350 (June): 295-304.
---. 1977. Methods and models for analyzing historical series ofbirths, deaths and marriages. In Population patterns in the past, ed.Ronald Lee. New York: Academic Press.
---. 1978a. Models of preindustrial population dynamics, with applications to England. In Historical studies of changing fertility, ed.Charles Tilly. Princeton: Princeton University Press.
---. 1978b. Econometric studies of topics in demographic history.New York: Arno Press.
McCloskey, Donald. 1972. Review of Peter Ramsey, ed., The pricerevolution in sixteenth-century England. Journal of Political Economy80, no. 6 (November/December): 1332-35.
Marshall, T. H. 1965. The population problem during the industrialrevolution: A note on the present state of the controversy. In Population in history, ed. D. V. Glass and D. E. C. Eversley, pp. 247-68.Chicago: Aldine.
Mathias, Peter. 1969. The first industrial revolution. London: Methuen.Mirowski, Philip. 1976. The plague and the penny-loaf: The disease
dearth nexus in Stuart and Hanoverian London. Unpublished manuscript, Department of Economics, University of Michigan, presentedat the 1976 meetings of the Cleometric Society, Madison.
Mitchell, B. R., and Deane, Phyllis. 1962. A bstract of British historicalstatistics. Cambridge: Harvard University Press.
North, Douglass, and Thomas, Robert. 1973. The rise of the Westernworld. Cambridge: Cambridge University Press.
Ohlin, Goran. 1961. Mortality, marriage, and growth in pre-industrialpopulation. Population Studies 14, no. 3 (March): 190-97.
---. 1969. Population pressure and alternative investments. In International Population Conference, 3: 1703-28. London, 1969.
Phelps-Brown, E. H., and Hopkins, S. V. 1955. Seven centuries ofbuilding wages. Economica, n.s., 22: 195-206.
---. 1956. Seven centuries of the prices of consumables, comparedwith builders' wage rates. Economica 23 (November): 296-314.
566 Ronald Demos Lee
---. 1957. Wage-rates and prices: Evidence for population pressurein the sixteenth century. Economica 24 (November): 289-306.
---. 1959. Builders' wage-rates, prices and population: Some further evidence. Economica 26, no. 101 (February): 18-38.
Pollard, Sidney, and Crossley, David W. 1968. The wealth of Britain1085-1966. New York: Schocken Books.
Russell, J. C. 1948. British medieval population. Albuq.,uerque: University of New Mexico Press.
---. 1958. Late ancient and medieval population, comprising transactions of the American Philosophical Society, n.s., vol. 48, no. 3.
Sauvy, Alfred. 1969. General theory of population. New York: BasicBooks.
Sawada, Shujiro. 1970. Technological change in Japanese agriculture.In Agriculture and economic growth: Japan's experience, ed. K. Ohkawa, B. Johnston and H. Kaneda. Princeton: Princeton UniversityPress.
Simon, Julian. 1976. Population growth may be good for LDCs in thelong run: A richer simulation model. Economic Development andCultural Change 24, no. 2 (January): 309-38.
Smith, Daniel Scott. 1977. A homeostatic demographic regime: Patternsin West European family reconstitution studies. In Population Patterns in the Past, ed. Ronald Lee. New York: Academic Press.
Srivastava, Uma, and Heady, Earl. 1973. Technological change andrelative factor shares in Indian agriculture: An empirical analysis.American Journal of Agricultural Economics 55, no. 3 (August):509-14.
Van Bath, B. H. Slicher. 1963. The agrarian history of Western Europe500-1850. London: Edward Arnold.