INTRODUCTION Asphalt shingle materials and attach- ment methods have changed significantly since the development of the first asphalt shingle product in 1893. This paper pre- sents an historical overview of asphalt shin- gle roof systems and the advancements in design, composition, and research that have improved shingles’ resistance to wind loading. This document is organized chronologically into four time periods. Performance issues are addressed through- out, with emphasis on the behavior of in- service systems during windstorms. This document provides the relevant background for ongoing research led by the University of Florida regarding the wind resistance of aged shingle systems. THE EARLY YEARS (1893-1950) The first steep-slope asphalt roofing sys- tem was introduced in 1893. Known as asphalt-prepared roofing, it consisted of a thin, reinforcing cotton rag felt impregnated with asphalt (Abraham, 1920). Installation was similar to today’s asphalt roll roofing. In 1897, top-surface mineral granules were added to improve the durability of the prod- uct (Cullen, 1992). It was later discovered that the mineral granules served an impor- tant function in absorbing the ultraviolet (UV) light from the sun. UV oxidizes the top surface of asphalt coating and leads to accelerated degradation of the asphalt coat- ing (Berdahl et al., 2008). Asphalt shingles were introduced in the beginning of the 20th century. Shingles 4 • I NTERFACE were manufactured by cutting asphalt- prepared roofing into smaller sections in order to create a discontinuous roof cover- ing resembling wood shakes or slate. Similar to today’s three-tab style, single-tab shingles (typically 9 in. by 16 in.) and mul- titab shingles (typically 10 in. by 32¹⁄₈ in.) were produced. The individual tab shingles had exposed leading edges that were often designed with interlocking mechanisms to hold the shingles down during windstorms. The multitab styles had unrestrained lead- ing edges, allowing the shingle tab to lift in the wind (Abraham, 1920; Cash, 1995). By the late 1920s, the cotton-reinforcing felts were replaced with substitute materi- als due to a price increase in cotton rags. In 1926, the Asphalt Shingle and Research Institute and the National Bureau of Standards (NBS; now the National Institute of Standards and Technology) jointly inves- tigated the effects of weathering on the newer substitute felts. Results of the three- year weathering study showed no adverse aging effects on the shingles containing the substitute materials (cf. Cullen, 1993). The use of asphalt shingles increased as a result of World War II construction demands, prompting another change of reinforcing felt to a less expensive wood-based organic material. Greenfeld (1969) would later show that the new “organic”-reinforced asphalt shingles performed as well as their prede- cessors. Blake (1925) developed one of the earli- est known shingle-attachment schedules for a four-tab strip shingle that called for five ¾-in.-long galvanized clout nails to be placed ½ in. above each cutout. As shown in Figures 1 and 2, the specified fasteners are similar to earlier prepared asphalt roll- roofing products. Single-tab and multitab shingles were installed on the roof in a stair-step pattern that mimics today’s stan- dards (Abraham, 1920). By 1941, three-tab strip shingles came onto the market with fastening requirements of four 11- or 12- gauge galvanized nails per shingle. Snoke (1941) notes that three-tab shingles with six nails would be more resistant in high wind- prone areas, a statement that is echoed in today’s shingle specifications. The 1947 standard for shingle attachment called for six galvanized roofing nails with a minimum 3/8-in.-diameter head 1 in. from the shin- gle edge and 1.5 in. on either side of each tab cutout’s centerline (Strahan, 1947). The most likely premature shingle failure during this era was due to wind, signaling that attachment requirements were inadequate. During moderate wind, continued flexing of the unrestrained exposed shingle tabs weakened the nailed connection, increasing the vulnerability of the shingle to blow-off in strong wind gusts (Cullen, 1992). DEVELOPMENT OF THE FIRST TEST STANDARDS FOR WIND RESISTANCE (1950-1980) The 1950s saw the introduction of two- tab sealing methods in order to improve performance under wind loading (Cullen, 1960). The first method consisted of a ther- mally activated “self-seal” adhesive strip that was applied on the asphalt shingle dur- M AY /J UNE 2012
Transcript
INTRODUCTION Asphalt shingle materials and attach
ment methods have changed significantly since the development of the first asphalt shingle product in 1893. This paper presents an historical overview of asphalt shingle roof systems and the advancements in design, composition, and research that have improved shingles’ resistance to wind loading. This document is organized chronologically into four time periods. Performance issues are addressed throughout, with emphasis on the behavior of in-service systems during windstorms. This document provides the relevant background for ongoing research led by the University of Florida regarding the wind resistance of aged shingle systems.
THE EARLY YEARS (1893-1950) The first steep-slope asphalt roofing sys
tem was introduced in 1893. Known as asphalt-prepared roofing, it consisted of a thin, reinforcing cotton rag felt impregnated with asphalt (Abraham, 1920). Installation was similar to today’s asphalt roll roofing. In 1897, top-surface mineral granules were added to improve the durability of the product (Cullen, 1992). It was later discovered that the mineral granules served an important function in absorbing the ultraviolet (UV) light from the sun. UV oxidizes the top surface of asphalt coating and leads to accelerated degradation of the asphalt coating (Berdahl et al., 2008).
Asphalt shingles were introduced in the beginning of the 20th century. Shingles
4 • I N T E R F A C E
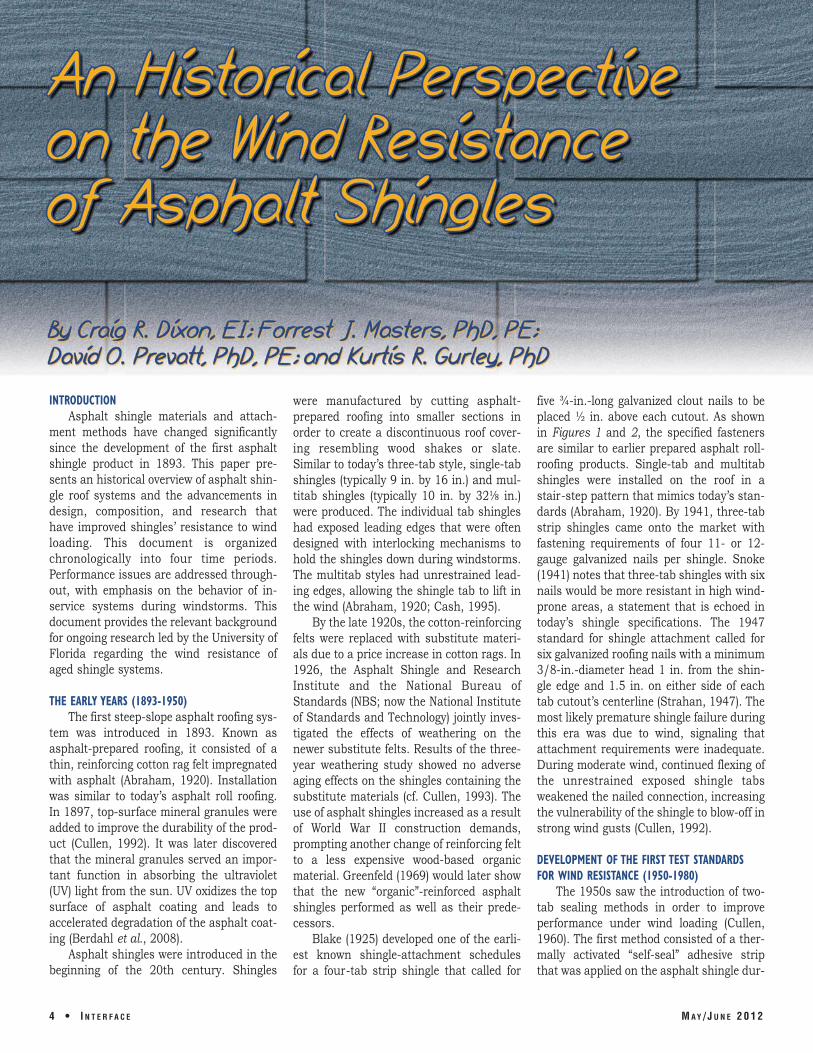
were manufactured by cutting asphalt-prepared roofing into smaller sections in order to create a discontinuous roof covering resembling wood shakes or slate. Similar to today’s three-tab style, single-tab shingles (typically 9 in. by 16 in.) and multitab shingles (typically 10 in. by 32¹⁄₈ in.) were produced. The individual tab shingles had exposed leading edges that were often designed with interlocking mechanisms to hold the shingles down during windstorms. The multitab styles had unrestrained leading edges, allowing the shingle tab to lift in the wind (Abraham, 1920; Cash, 1995).
By the late 1920s, the cotton-reinforcing felts were replaced with substitute materials due to a price increase in cotton rags. In 1926, the Asphalt Shingle and Research Institute and the National Bureau of Standards (NBS; now the National Institute of Standards and Technology) jointly investigated the effects of weathering on the newer substitute felts. Results of the three-year weathering study showed no adverse aging effects on the shingles containing the substitute materials (cf. Cullen, 1993). The use of asphalt shingles increased as a result of World War II construction demands, prompting another change of reinforcing felt to a less expensive wood-based organic material. Greenfeld (1969) would later show that the new “organic”-reinforced asphalt shingles performed as well as their predecessors.
Blake (1925) developed one of the earliest known shingle-attachment schedules for a four-tab strip shingle that called for
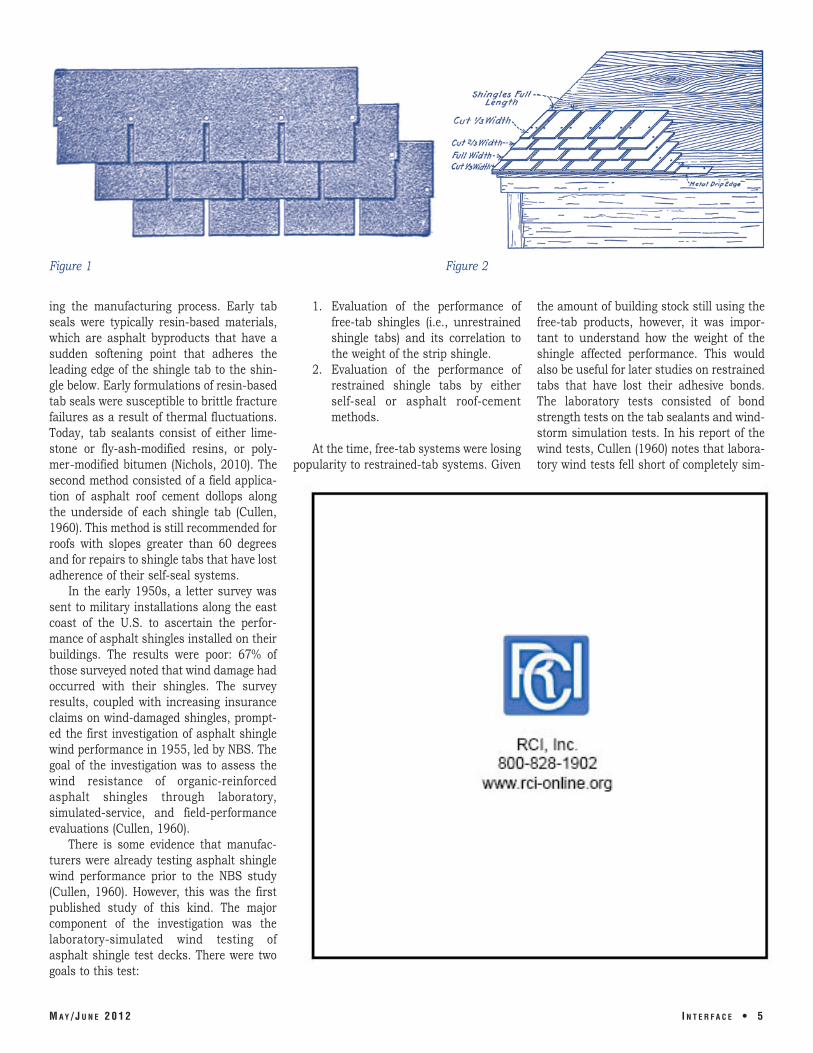
five ¾-in.-long galvanized clout nails to be placed ½ in. above each cutout. As shown in Figures 1 and 2, the specified fasteners are similar to earlier prepared asphalt roll-roofing products. Single-tab and multitab shingles were installed on the roof in a stair-step pattern that mimics today’s standards (Abraham, 1920). By 1941, three-tab strip shingles came onto the market with fastening requirements of four 11- or 12gauge galvanized nails per shingle. Snoke (1941) notes that three-tab shingles with six nails would be more resistant in high wind-prone areas, a statement that is echoed in today’s shingle specifications. The 1947 standard for shingle attachment called for six galvanized roofing nails with a minimum 3/8-in.-diameter head 1 in. from the shingle edge and 1.5 in. on either side of each tab cutout’s centerline (Strahan, 1947). The most likely premature shingle failure during this era was due to wind, signaling that attachment requirements were inadequate. During moderate wind, continued flexing of the unrestrained exposed shingle tabs weakened the nailed connection, increasing the vulnerability of the shingle to blow-off in strong wind gusts (Cullen, 1992).
DEVELOPMENT OF THE FIRST TEST STANDARDS FOR WIND RESISTANCE (1950-1980)
The 1950s saw the introduction of two-tab sealing methods in order to improve performance under wind loading (Cullen, 1960). The first method consisted of a thermally activated “self-seal” adhesive strip that was applied on the asphalt shingle dur-
M A Y / J U N E 2 0 1 2
Figure 1
ing the manufacturing process. Early tab seals were typically resin-based materials, which are asphalt byproducts that have a sudden softening point that adheres the leading edge of the shingle tab to the shingle below. Early formulations of resin-based tab seals were susceptible to brittle fracture failures as a result of thermal fluctuations. Today, tab sealants consist of either limestone or fly-ash-modified resins, or polymer-modified bitumen (Nichols, 2010). The second method consisted of a field application of asphalt roof cement dollops along the underside of each shingle tab (Cullen, 1960). This method is still recommended for roofs with slopes greater than 60 degrees and for repairs to shingle tabs that have lost adherence of their self-seal systems.
In the early 1950s, a letter survey was sent to military installations along the east coast of the U.S. to ascertain the performance of asphalt shingles installed on their buildings. The results were poor: 67% of those surveyed noted that wind damage had occurred with their shingles. The survey results, coupled with increasing insurance claims on wind-damaged shingles, prompted the first investigation of asphalt shingle wind performance in 1955, led by NBS. The goal of the investigation was to assess the wind resistance of organic- reinforced asphalt shingles through laboratory, simulated-service, and field-performance evaluations (Cullen, 1960).
There is some evidence that manufacturers were already testing asphalt shingle wind performance prior to the NBS study (Cullen, 1960). However, this was the first published study of this kind. The major component of the investigation was the laboratory-simulated wind testing of asphalt shingle test decks. There were two goals to this test:
Figure 2
1. Evaluation of the performance of free-tab shingles (i.e., unrestrained shingle tabs) and its correlation to the weight of the strip shingle.
2. Evaluation of the performance of restrained shingle tabs by either self-seal or asphalt roof-cement methods.
At the time, free-tab systems were losing popularity to restrained-tab systems. Given
the amount of building stock still using the free-tab products, however, it was important to understand how the weight of the shingle affected performance. This would also be useful for later studies on restrained tabs that have lost their adhesive bonds. The laboratory tests consisted of bond strength tests on the tab sealants and windstorm simulation tests. In his report of the wind tests, Cullen (1960) notes that laboratory wind tests fell short of completely sim-
M A Y / J U N E 2 0 1 2 I N T E R F A C E • 5
ulating in-service wind behavior, but that these tests may serve as a useful tool when combined with other methods. The simulation was conducted by using an open-jet configuration. No mention of the flow characteristics of the jet (i.e., magnitude of turbulence) is provided in Cullen’s report. A 4by 3-ft. test deck with a slope of 2 in. on 12 in. was placed in front of the jet.
The free-tab test decks—nine in total— were subjected to a mean wind speed of 30 mph for an unknown amount of time, with the rise of the leading edge measured to describe performance. Good-performing free-tab shingles were defined as having smaller lifts during wind testing. Not surprisingly, heavier shingles performed the best, and a near-linear relationship between performance and weight was identified for a given uniform shingle thickness.
The goal of the wind investigation was to assess the sealing characteristics of several manufacturers’ self-sealing three-tab organic-reinforced shingles. Therefore, the test decks containing self-sealing shingles— twelve in total—were subjected to three different curing temperatures (120ºF, 140ºF, and 160ºF) for 16 hours each. The test consisted of four step-and-hold mean wind velocities of 30, 40, 50, and 60 mph. The time held at the first three wind velocities was not reported. The time for the 60-mph test was two hours. Failure during these tests was defined as failure of the adhesion on one shingle tab. The tests revealed that
nine of the 12 shingle deck specimens could withstand 60 mph for two hours when they were conditioned at 140ºF for two hours. The remaining three required a 160ºF cure.
Bond strength tests correlated well with the wind tests’ findings. Twelve asphalt shingle products were subjected to the same variation in cure temperature for five and 16 hours and then tested for uplift resistance of their tab seals (Cullen, 1993). From these two tests, it was reported that a cure temperature of 140ºF and time of 16 hours were adequate to evaluate the wind performance of self-sealing shingle systems. To validate the findings of the laboratory tests, Cullen investigated the performance of self-sealing shingle systems in the natural environment. Twenty-two test decks were exposed for a period of one year in Washington, DC, starting in the spring. The tab seals were periodically inspected for adherence, and results showed that all decks had full adhesion within 50 days. When the tab seal bonds were broken the following December, all shingles had resealed by the following spring.
At the time of the Cullen (1960) report, no standard wind performance tests existed for asphalt shingles, but as a result of this investigation, the Underwriters Lab oratory’s (UL) 997, Wind Resist ance of Prepared Roof Covering Ma te rials (1995), was developed. The test is similar to Cullen’s 1960 work in both test setup and conditioning. When first drafted in 1960, 60 mph was near the limit
of fan controllability; therefore, the test decks were subjected to a maximum of 60 mph despite the
Figure 3
likelihood of higher in-service wind speeds. The American Society for Testing and Materials’ (ASTM) D3161, Standard Test Method for Wind-Resistance of Asphalt Shingles (2005), was first published in 1972 with an identical test procedure. These standards are based on data from shingles that were developed and manufactured using 1950s technology.
Following up on Cullen’s experiments, UL conducted a study of self-seal organic-reinforced asphalt shingle response to higher wind speeds and wind speed fluctuations (Benjamin and Bono, 1967). This research was conducted using a larger fan system capable of wind speeds up to 100 mph. Additional tests were conducted on shingles that passed the UL 997 60-mph wind test. All of the 225 shingle test decks passed a 15-minute, 75-mph mean wind-speed test, and 95% of the test decks passed a 5minute, 100-mph mean wind-speed test. To replicate the fluctuating component of the wind speed, the speed was varied between 30 mph and 100 mph. Each wind speed was held for 60 seconds for some decks and 30 seconds for others before a series of “practically instantaneous” (from Benjamin and Bono, 1967) wind-speed changes cycling from 30 mph to 100 mph for a total of 20 oscillations were applied. All test decks passed the wind fluctuation tests. While results of higher wind-speed research showed good asphalt shingle wind performance in simulated hurricane-strength wind speeds, concerns surrounding the validity of the ASTM D3161/UL 997 test methods soon followed.
With the advent of the asphalt shingle self-seal tab system and its improved wind resistance, the weight of the asphalt shingle
6 • I N T E R F A C E M A Y / J U N E 2 0 1 2
was no longer the main source of wind resistance. This allowed the use of lighter-weight and cheaper-shingle mats (Cash, 1995). In 1960, glass fiber strand-based mats were introduced as a replacement for the organic material-based mat (Cullen, 1992). The drawback to the fiberglass mat is an increase in flexibility of the shingle; that is, if a self-seal were to fail, the shingle would be more likely to lift in the wind compared to a heavier and stiffer organic- reinforced shingle. Beyond their lighter weight and lower manufacturing costs, the new “fiberglass” shingles contain a chemical saturant that gave the fiberglass-reinforced shingles a Class A fire rating. Organic-reinforced asphalt shingles typically have a lower-class (Class C) rating due to the combustibility of the organic material. The growth of the fiberglass-reinforced asphalt shingle market can be partly attributed to the increase in condominium and commercial construction that required Class A fire ratings. By 1982, production of fiberglass-reinforced asphalt shingles overtook organic-reinforced asphalt shingle production—a trend that has continued (Cash, 1995).
DEVELOPMENT OF THE ASPHALT SHINGLE WIND UPLIFT MODEL (1980-1997)
The goal of the UL 997 test was to provide a predictive method for in-service asphalt shingle wind performance. However, during in-house product testing in the early 1980s using the UL 997 wind test standard, Owens-Corning Fiberglas™ observed no appreciable shingle performance differences between products that should have produced significantly different results. Following this, Drs. Jon Peterka and Jack Cermak of Colorado State University (CSU) were contracted by Owens-Corning to reevaluate UL 997 and develop a more refined test method that would more accurately simulate in-service wind loading conditions. This work (Peterka and Cermak, 1983) led to today’s asphalt shingle wind uplift model.
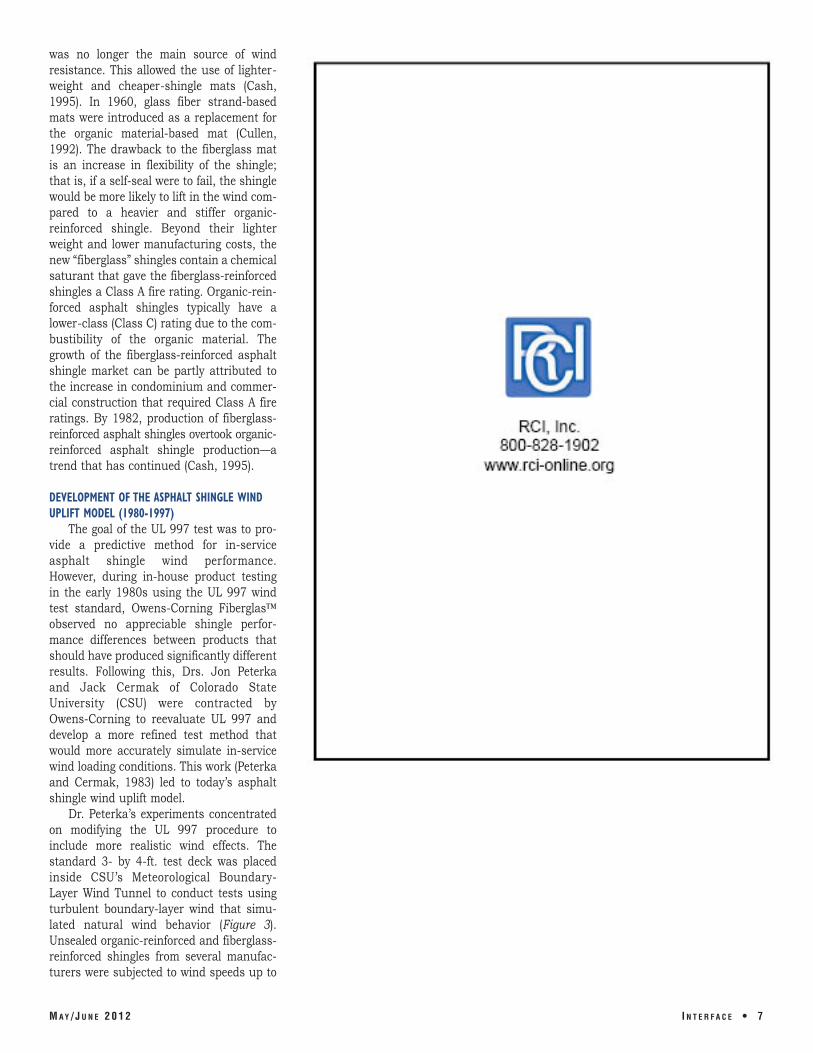
Dr. Peterka’s experiments concentrated on modifying the UL 997 procedure to include more realistic wind effects. The standard 3- by 4-ft. test deck was placed inside CSU’s Meteorological Boundary-Layer Wind Tunnel to conduct tests using turbulent boundary-layer wind that simulated natural wind behavior (Figure 3). Unsealed organic-reinforced and fiberglass-reinforced shingles from several manufacturers were subjected to wind speeds up to
M A Y / J U N E 2 0 1 2 I N T E R F A C E • 7
pressure of the building, producing wind uplift pressure distributions and magnitudes found in building standards such as ASCE-7 for impermeable systems. A permeable roofing
Figure 4
80 mph. To evaluate the effects of temperature on shingle performance, the shingles were tested at two temperatures: 75ºF and 35ºF. At the time, it was thought that lower temperatures would increase the brittleness of the shingles, thereby exacerbating shingles pulling out over the fasteners during wind events. The goal of the test was to observe how the shingles behave during this new test method and to discern if performance differences could be extrapolated. It was observed that organic-reinforced shingles sustained less damage than fiberglass-reinforced shingles, likely due to a higher shingle mass, resulting in a greater resistance to uplift. Greater shingle damage was observed in tests on the colder (35ºF) shingles. The overall outcome from the testing was that performance of the shingles in the new test correlated to the predicted quality of the shingle.
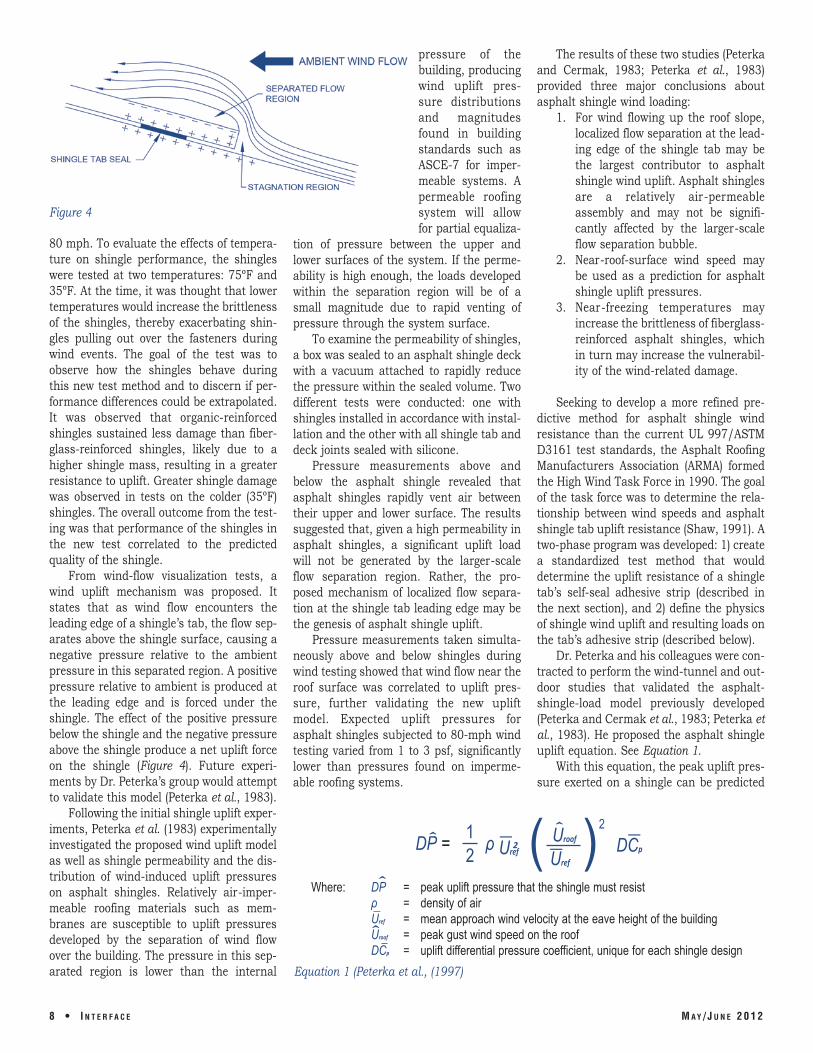
From wind-flow visualization tests, a wind uplift mechanism was proposed. It states that as wind flow encounters the leading edge of a shingle’s tab, the flow separates above the shingle surface, causing a negative pressure relative to the ambient pressure in this separated region. A positive pressure relative to ambient is produced at the leading edge and is forced under the shingle. The effect of the positive pressure below the shingle and the negative pressure above the shingle produce a net uplift force on the shingle (Figure 4). Future experiments by Dr. Peterka’s group would attempt to validate this model (Peterka et al., 1983).
Following the initial shingle uplift experiments, Peterka et al. (1983) experimentally investigated the proposed wind uplift model as well as shingle permeability and the distribution of wind-induced uplift pressures on asphalt shingles. Relatively air-impermeable roofing materials such as membranes are susceptible to uplift pressures developed by the separation of wind flow over the building. The pressure in this separated region is lower than the internal
8 • I N T E R F A C E
system will allow for partial equaliza
tion of pressure between the upper and lower surfaces of the system. If the permeability is high enough, the loads developed within the separation region will be of a small magnitude due to rapid venting of pressure through the system surface.
To examine the permeability of shingles, a box was sealed to an asphalt shingle deck with a vacuum attached to rapidly reduce the pressure within the sealed volume. Two different tests were conducted: one with shingles installed in accordance with installation and the other with all shingle tab and deck joints sealed with silicone.
Pressure measurements above and below the asphalt shingle revealed that asphalt shingles rapidly vent air between their upper and lower surface. The results suggested that, given a high permeability in asphalt shingles, a significant uplift load will not be generated by the larger-scale flow separation region. Rather, the proposed mechanism of localized flow separation at the shingle tab leading edge may be the genesis of asphalt shingle uplift.
Pressure measurements taken simultaneously above and below shingles during wind testing showed that wind flow near the roof surface was correlated to uplift pressure, further validating the new uplift model. Expected uplift pressures for asphalt shingles subjected to 80-mph wind testing varied from 1 to 3 psf, significantly lower than pressures found on impermeable roofing systems.
ˆ 1DP = ρ 2 Uref
2
Where: DP =
The results of these two studies (Peterka and Cermak, 1983; Peterka et al., 1983) provided three major conclusions about asphalt shingle wind loading:
1. For wind flowing up the roof slope, localized flow separation at the leading edge of the shingle tab may be the largest contributor to asphalt shingle wind uplift. Asphalt shingles are a relatively air-permeable assembly and may not be significantly affected by the larger-scale flow separation bubble.
2. Near-roof-surface wind speed may be used as a prediction for asphalt shingle uplift pressures.
3. Near-freezing temperatures may increase the brittleness of fiberglass-reinforced asphalt shingles, which in turn may increase the vulnerability of the wind-related damage.
Seeking to develop a more refined predictive method for asphalt shingle wind resistance than the current UL 997/ASTM D3161 test standards, the Asphalt Roofing Manufacturers Association (ARMA) formed the High Wind Task Force in 1990. The goal of the task force was to determine the relationship between wind speeds and asphalt shingle tab uplift resistance (Shaw, 1991). A two-phase program was developed: 1) create a standardized test method that would determine the uplift resistance of a shingle tab’s self-seal adhesive strip (described in the next section), and 2) define the physics of shingle wind uplift and resulting loads on the tab’s adhesive strip (described below).
Dr. Peterka and his colleagues were contracted to perform the wind-tunnel and outdoor studies that validated the asphaltshingle-load model previously developed (Peterka and Cermak et al., 1983; Peterka et al., 1983). He proposed the asphalt shingle uplift equation. See Equation 1.
With this equation, the peak uplift pressure exerted on a shingle can be predicted
Uroof DCp( )2
Uref
peak uplift pressure that the shingle must resist
ρ = density of air
U ref = mean approach wind velocity at the eave height of the building
Uroof = peak gust wind speed on the roof
DCp = uplift differential pressure coefficient, unique for each shingle design
Equation 1 (Peterka et al., (1997)
M A Y / J U N E 2 0 1 2
Figure 5A
Figure 5B
by knowing the approach flow characteristics, the near-roof-surface wind flow characteristics, and the uplift pressure coefficient that will be unique to each shingle design. Building standards such as ASCE 7 represent uplift loads as pressure coefficients, a dimensionless number that defines the relative pressure for a given flow field independent of the flow velocity. For asphalt shingles, a differential pressure coefficient is used to describe the net uplift pressure on asphalt shingles. The wind experiments conducted in the early 1990s by Peterka et al. (1997) investigated parameters of the components in this uplift equation by three methods:
1. Magnitude and distribution of near-roof-surface wind flow on model-scale residential buildings in a boundary-layer wind tunnel.
2. Correlation between near-surface roof flow and uplift pressures generated on a full-scale asphalt shingle test deck in a boundary-layer wind tunnel.
3. Evaluation of uplift pressures and near-roof-surface wind flow generated on a full-scale residential building located outdoors and subjected to natural wind.
For component one, three 1:25-scale T-shape model buildings were constructed (Figure 5A) with roof slopes of 2:12, 5:12, and 9:12. Also tested was a 1:25-scale model gable-roofed building that matched a full-scale building constructed for validation of the model-scale data (Figure 5B). Each building was placed inside the boundary-layer wind tunnel at CSU and subjected to a wind flow corresponding to open country
M A Y / J U N E 2 0 1 2
exposure (i.e., ASCE 7, Exposure C). Because the flow near the roof surface was of greatest interest for asphalt shingle wind loading, flow measurements were taken over each building’s roof surfaces at a height of 0.04 in. (1 in. at full scale) above the roof surface. The ratio between the peak observed near-roof-surface wind speed and the mean wind speed of the upwind air flow is needed for Equation 1. An upper-bound ratio of 2.5 was observed in the scaled model wind-tunnel tests. The highest observed near-roof-surface wind speeds for all four buildings were located near the intersection of the roof ridge and gable end (Cochran et al., 1999).
The design of the leading edge of the asphalt shingle plays an important role in the aerodynamics of asphalt shingle uplift. These design factors may include the location of the self-seal adhesive, the installed pattern (or distribution) of the self-seal adhesive (i.e., a discontinuous pattern may allow airflow behind the seal, increasing the pressure on the underside and thereby increasing the net uplift on the shingle), and the profile of the leading edge of the shingle tab (i.e., thick butt, sharp edge, etc.). The second component of the Peterka et al. (1997) investigation utilized the same
Table 1 – Wind-tunnel-measured DCp three-tab shingle with cutouts (Peterka et al., 1997).
I N T E R F A C E •
elevated 4- by 3-ft. asphalt shingle test deck developed during the 1983 experiments (Peterka and Cermak, 1983). The deck was subjected to a boundary layer flow in the CSU wind tunnel with two different turbulence intensity levels of 4% and 17%. The CSU wind tunnel was unable to replicate full-scale turbulence intensities found in natural wind; therefore, it was necessary to determine the effect of the magnitude of turbulence intensity on the developed shingle uplift pressure coefficients.
The shingle tab located in the middle of each deck was instrumented with pressure taps above and below the shingle surface, and wind flow measurements were obtained 1 in. above the instrumented shingle using either a hot-film anemometer or a pitotstatic probe. Mean pressure coefficients captured during this test showed that the uplift force is higher in front of the tab sealant compared to behind (up-slope of) the tab sealant (Table 1). This likely occurs for three reasons: 1) a separated flow region is generated above the leading edge of the shingle with reattachment occurring a few inches upwind, 2) the tab seal reduces/prevents the positive pressure behind the tab sealant (depending on the sealant design), and 3) tab cutouts assist in
SHINGLE PART SHINGLE THICKNESS
SINGLE, ~0.11 IN. DOUBLE, ~0.22 IN.
Seal strip to front edge -0.4 -0.8
Top of cutout to seal strip -0.1 -0.1
Top of cutout to front edge for unsealed shingle -0.4 -0.8
9
pressure equalization behind the seal strip. Therefore, the location of the tab sealant will play a large role in the loading mechanism generated on the tab adhesive.
Differences also exist in pressure coefficients between the three-tab and double-thickness shingles (Table 1). To investigate the role of near-surface wind flow on uplift pressures, the middle shingle tab from a test deck was replaced with a thin, rectangular piece of brass that would mimic a shingle tab—both in dimension and location on the deck—with a seal located where one would be on an asphalt shingle. Fifty-four pressure taps were installed on the brass shingle (half on the top surface, half on the bottom surface), as this would allow for larger area averages to be determined. The deck was placed on the floor, oriented such that the generated wind flow would travel up the 4:12 sloped test deck with a smooth, curved transition between the wind-tunnel floor and the test deck. As with the previous pressure measurements, near-surface roof flow at 1 in. above the brass shingle was captured. From these data, it was observed that asphalt shingle uplift pressures correlate with near-roof-surface flow in flow fluctuations up to 12 Hz for a wind flow of 22.5 mph.
The final component of the Peterka et al. (1997) investigation was the validation of wind tunnel test data using a full-scale, gable-roofed building constructed outside in a windy location near Fort Collins, CO. The house consisted of a 23- by 34.5-ft. one-story building with a 5:12 gable roof. Three-tab fiberglass-reinforced asphalt shingles were installed on the roof with pressure taps installed above and below the shingles at several locations on the roof. To capture simultaneous velocity and pressure data, unidirectional velocity sensors were installed above the tapped shingles and ori
1 0 • I N T E R F A C E
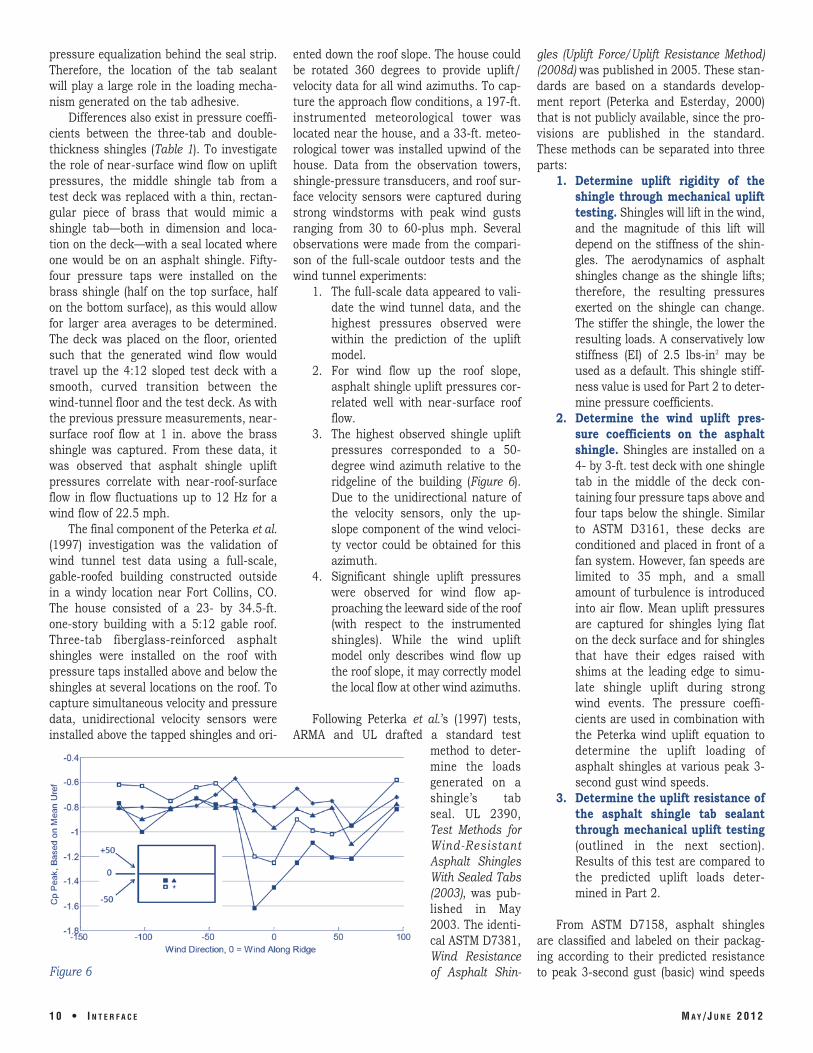
ented down the roof slope. The house could be rotated 360 degrees to provide uplift/ velocity data for all wind azimuths. To capture the approach flow conditions, a 197-ft. instrumented meteorological tower was located near the house, and a 33-ft. meteorological tower was installed upwind of the house. Data from the observation towers, shingle-pressure transducers, and roof surface velocity sensors were captured during strong windstorms with peak wind gusts ranging from 30 to 60-plus mph. Several observations were made from the comparison of the full-scale outdoor tests and the wind tunnel experiments:
1. The full-scale data appeared to validate the wind tunnel data, and the highest pressures observed were within the prediction of the uplift model.
2. For wind flow up the roof slope, asphalt shingle uplift pressures correlated well with near-surface roof flow.
3. The highest observed shingle uplift pressures corresponded to a 50degree wind azimuth relative to the ridgeline of the building (Figure 6). Due to the unidirectional nature of the velocity sensors, only the up slope component of the wind velocity vector could be obtained for this azimuth.
4. Significant shingle uplift pressures were observed for wind flow ap proaching the leeward side of the roof (with respect to the instrumented shingles). While the wind uplift model only describes wind flow up the roof slope, it may correctly model the local flow at other wind azimuths.
Following Peterka et al.’s (1997) tests, ARMA and UL drafted a standard test
method to determine the loads generated on a shingle’s tab seal. UL 2390, Test Methods for Wind-Resistant Asphalt Shingles With Sealed Tabs (2003), was published in May 2003. The identical ASTM D7381, Wind Resistance of Asphalt Shin
gles (Uplift Force/Uplift Resistance Method) (2008d) was published in 2005. These standards are based on a standards development report (Peterka and Esterday, 2000) that is not publicly available, since the provisions are published in the standard. These methods can be separated into three parts:
1. Determine uplift rigidity of the shingle through mechanical uplift testing. Shingles will lift in the wind, and the magnitude of this lift will depend on the stiffness of the shingles. The aerodynamics of asphalt shingles change as the shingle lifts; therefore, the resulting pressures exerted on the shingle can change. The stiffer the shingle, the lower the resulting loads. A conservatively low stiffness (EI) of 2.5 lbs-in2 may be used as a default. This shingle stiffness value is used for Part 2 to determine pressure coefficients.
2. Determine the wind uplift pressure coefficients on the asphalt shingle. Shingles are installed on a 4- by 3-ft. test deck with one shingle tab in the middle of the deck containing four pressure taps above and four taps below the shingle. Similar to ASTM D3161, these decks are conditioned and placed in front of a fan system. However, fan speeds are limited to 35 mph, and a small amount of turbulence is introduced into air flow. Mean uplift pressures are captured for shingles lying flat on the deck surface and for shingles that have their edges raised with shims at the leading edge to simulate shingle uplift during strong wind events. The pressure coefficients are used in combination with the Peterka wind uplift equation to determine the uplift loading of asphalt shingles at various peak 3second gust wind speeds.
3. Determine the uplift resistance of the asphalt shingle tab sealant through mechanical uplift testing (outlined in the next section). Results of this test are compared to the predicted uplift loads determined in Part 2.
From ASTM D7158, asphalt shingles are classified and labeled on their packaging according to their predicted resistance to peak 3-second gust (basic) wind speeds
M A Y / J U N E 2 0 1 2
Figure 6
at 33 ft. in Exposure C (open country), following ASCE 7-05. Adjustment factors are required for various environmental/ building factors such as buildings higher than 60 ft. and if the user is using the ASCE 7-10 design standard. The shingle classification is thus:
• Class D – Passed at basic wind speeds up to and including 90 mph
• Class G – Passed at basic wind speeds up to and including 120 mph
• Class H – Passed at basic wind speeds up to and including 150 mph
Most United States residential building codes refer to ASCE 7-05 as their wind load standard; therefore, this classification system provides a direct comparison between shingle requirements and shingle performance. A 2011 survey of asphalt shingle products offered by seven major manufacturers shows that 91% of their shingle products have been wind-tested by ASTM D7158, and all of those tested were classified with Class H ratings (Inspections, 2011). The same survey noted that all products listed have a Class F (110 mph) ASTM D3161 classification as well.
ASTM D6381, STANDARD TEST METHOD FOR MEASUREMENT OF ASPHALT SHINGLE TAB MECHANICAL UPLIFT RESISTANCE
Prior to the initiation of the Peterka wind load studies, the ARMA task force began development of a test method that would determine the uplift resistance of a shingle’s tab sealant (Shaw, 1991). From the initial Peterka et al. report (1983), it was evident that the greatest uplift loads would occur nearest the leading edge of the shingle. At the time, shingles were typically produced with ¾- to 1-in. distances between the leading edge of the tab sealant and the leading edge of the shingle tab (Hahn et al., 2004). The resultant wind loading on this cantilever span would produce a peel-type uplift force on the tab sealant. The mechanical uplift test was developed to simulate this loading condition. The test specimen consisted of a 3.5-in.-wide by 7-in.-long asphalt shingle lower piece with a 3.5-in.-wide by 4-in.-long upper tab piece. The tab was installed over the lower piece’s sealant such that the in-service tab bond is replicated.
Prior to uplift testing, the bond between the lower and upper shingles was conditioned at 140ºF for 16 hours, the same as the ASTM D3161/UL 997 conditioning procedure. Mechanical uplift testing consisted
M A Y / J U N E 2 0 1 2
of the specimen attachment to a clamp assembly along the 3.5-in. edges. The uplift load was generated from a clamp affixed along the leading edge of the shingle specimen. This clamp was connected to a universal testing machine, which provided a constant velocity uplift of 5 in./min. and simultaneous measurement of uplift load on the shingle tab. Seven testing labs were utilized for round-robin testing of this draft standard to confirm repeatability of test methods and results (Shaw, 1991). After confirmation, the standard was published in 1999 and designated as ASTM D6381, Standard Test Method for Measurement of Asphalt Shingle Mechanical Uplift Resist ance.
As described below, recent modifications to the mechanical uplift test have been made in response to changes in the tab sealant design and market trends. Many shingles now have tabs seals located closer to the shingle tab’s leading edge. A decrease in distance between the tab sealant and the leading edge will reduce the total uplift loading generated ahead of the sealant. Therefore, this loading mechanism can change from a peel-type to a direct tension-type loading (Hahn et al., 2004). The way an adhesive is loaded (i.e., peeling, direct tension, etc.) is known to have a significant effect on its strength (Shiao et al., 2004). Results of asphalt shingle tab sealant mechanical uplift resistance tests comparing peel, direct tension, and combined showed that direct tension produced over double the resistance of the D6381 peel-type resistance (Shiao et al., 2004). The combined test consisted of an attachment that mimicked the Peterka wind load model, with forces being generated on shingle specimens ahead and behind the tab sealant. The sealant strength for this loading fell between the low peel strength and high direct-tension strength, suggesting that the actual loading of a tab seal is a combination of peel and direct tension. As a result, the 2008 edition of the ASTM D6381 test requires direct-tension testing be conducted along with the original peel test. Depending upon the magnitude of the pressure coefficients obtained from ASTM D7158/UL 2390 testing, the results of each test may be used separately or in combination to determine total uplift resistance of a shingle’s tab seal (Hahn et al., 2004).
Questions remain on the applicability of this test method in predicting in-service shingle wind resistance. Foremost among
them is the loading protocol, which specifies a constant displacement velocity of 5 in./min. Near-roof-surface wind flow is turbulent in nature; therefore, the uplift loading from wind will also contain fluctuations (Peterka et al., 1997). Shiao et al. (2004) have shown that an increase in loading rate correlates to a higher shingle-tab-seal resistance (i.e., the current ASTM D6381 loading rate produces conservative resistance results). However, shingles are potentially subjected to thousands of wind gusts throughout their lifetimes, and the long-term performance of shingle tab seal to these fluctuations (i.e., fatigue resistance) has not been quantified. Thus, with the current ASTM D6381, it is difficult to predict how the tab’s seal will respond to gusts later in the shingle’s service life. See Table 2.
IN-SERVICE WIND PERFORMANCE OF ASPHALT SHINGLES
Laboratory wind testing of asphalt shingles provides a relatively simple method for predicting in-service wind performance. However, these methods cannot completely replicate the conditions that shingles are subjected to once they are installed. A key component in understanding shingle wind resistance is observations that are made following shingle damage caused by wind events. Since 1989, damage assessments made by organizations and federal agencies such as FEMA and RICOWI have provided “ground truth” on asphalt shingle performance. The observations made in these reports provide an opportunity to evaluate deficiencies in products, design, and installation. An overview of selected damage report observations is provided below.
Hurricane Hugo made landfall on the east coast of South Carolina in 1989 as a Category 4 hurricane on the Saffir-Simpson scale. Damage observations of asphalt shingle roofing by Smith and McDonald (1990) noted highly variable wind uplift performance of shingles, with some houses sustaining no damage, while others nearby sustained complete shingle loss. The damage was primarily attributed to weak tab seals. Improperly located fasteners were also often observed at damaged roofs. Failure of the roof covering did not just impact the covering itself. Rather, in financial terms, the resulting interior losses caused by roofing failure were often greater than loss from the roof covering. Smith concluded that standardized wind testing of roof coverings, including ASTM D3161 for
I N T E R F A C E • 1 1
TEST METHOD
DESIGNATION
YEAR FIRST
PUBLISHED
TEST METHOD OVERVIEW
UL 997 1960 Asphalt shingles are installed on a 3- by 4-ft. test deck,
cured for 16 hours at 140°F, and then subjected to two hours
of 60-mph winds. Failure is defined as a shingle tab that either
loses its tab adhesion or whose mechanical interlock fails.
ASTM D3161 1972 Essentially identical to UL 997 with the exception of the
maximum allowable wind speed. D3161 has three classification
designations: 1) Class A – passed 60 mph, 2) Class D –
passed 90 mph, 3) Class F – passed 110 mph. Note: These
wind speeds do not directly correlate to ASCE 7 wind speeds.
ASTM D6381 1999 Method to determine a shingle tab sealant’s uplift resistance.
Shingle specimens are subjected to a constant-rate peel and
direct tension testing of the sealant.
UL 2390 2003 Based on the Peterka wind-load model, this test method
determines a shingle’s wind uplift pressure coefficients. The
pressure coefficients can be used to predict the loads that
will be exerted on a shingle at various ASCE 7 wind speeds.
ASTM D7158 2005 Identical to UL 2390 in test procedure. References ASTM
D6381 to determine the uplift resistance of the shingle’s tab
sealant. Comparison between D7158 predicted uplift force
and D6381 measure resistance gives three wind speed
classifications: 1) Class D – up to 90 mph resistance,
2) Class G – up to 120 mph resistance, 3) Class H – up to
150 mph resistance. Note: These wind speeds correlate to
winds defined by ASCE 7-05 for noncritical facilities less than
60 ft. tall in Exposure C.
Table 2 – Summary of standardized test methods to evaluate asphalt shingle wind performance.
asphalt shingles, appeared deficient in predicting wind performance. This observation would be repeated after Hurricane Andrew made landfall in South Florida in 1992, also causing damage to asphalt roofing systems on houses (Smith, 1995).
Improperly located shingle fasteners have often been observed at damaged shingles (FEMA, 2005a; Smith, 1995; Smith and McDonald, 1990). However, the extent to which the installation affects the wind resistance of the shingle has not yet been quantified. Pull-through of the shingle over the fasteners is often attributed to improper fastener placement. Smith and Millen (1999) note that it is “unrealistic to expect fasteners to be located exactly in the specified locations.” Furthermore, wind tunnel tests on unsealed asphalt shingles with misplaced fasteners showed a decrease in wind performance, but no definitive conclusions could be made regarding variations in placement (Smith and Millen, 1999).
A common observation throughout post-storm reports is the failure of roof details such as hip, ridge, eave, and rake shingle
conditions (FEMA, 2005a; FEMA, 2005b; FEMA, 2006; FEMA, 2009; IBHS, 2009). These failures appear to be independent of the age of the roof and more closely tied to the design and installation of these edge conditions. Bonding of the hip and ridge caps appears to be an ongoing issue, and starter courses along the eave are often improperly installed. The implications of failures to these areas of the roof range from a minor exposure of the hip and ridge deck joints to a more widespread failure propagating from eave and rake-edge failures. While damage reports continue to be a valuable source of information, more work is necessary to understand the role of installation variability in asphalt shingle wind performance.
Throughout the 2000s, hurricanes impacted the Southeast and U.S. Gulf Coast, causing extensive shingle damage. Shingle performance was variable (RICOWI, 2006). An Insurance Institute of Business & Home Safety (IIBHS, 2009) study of shingle damage in Hurricane Ike showed variable performance amongst products with the same ASTM D7158 Class H (150-mph) rat
ing. Wind speeds at the investigated site were 110 mph (peak 3-second gust at 33 ft., Exposure C), below design level. Based on their findings, IIBHS “suggests that there remain significant differences between roof cover products with the same nominal design.”
Liu et al. (2010) conducted an asphalt shingle damage survey in Texas after hurricanes Ike and Gustav in 2008 and found that homes with newer (less than five years old) shingle installations performed significantly better than older shingle roofs (greater than five years old), although it was not certain if age or changes to the building code around 2002 were the cause. This performance gap was also noted by RICOWI (2006) after Hurricane Charley struck Florida in 2004 and by Gurley and Masters (2011) in a post-2004 hurricane season building performance survey. All three studies postulated that while product improvement could be attributed to the better performance of newer roofs, the effects of aging could not be discounted. Exper i ments by Terrenzio et al. (1997) and Shiao et al. (2003) have noted that the greatest cause of asphalt shingle aging is thermal loading. Over time, the asphalt within the shingle becomes oxidized, causing embrittlement of the shingle. Currently, no studies have quantified the effects of aging on asphalt shingle wind performance. Con sid ering that a shingle’s tab adhesive is based upon an asphaltic formulation, what effects would this potential oxidation reaction have on the tab seal’s adhesive strength? The current ASTM D7158/D6381 and UL 2390 standard test methods only provide information on the performance of new, laboratory-prepared asphalt shingles, making estimation of the long-term performance of the tab adhesive difficult.
LOOKING FORWARD During the last century, asphalt shin
gles have evolved partially in response to developments in the understanding of asphalt shingle wind resistance. Despite the advancements made through research and damage observations, questions still remain with regard to asphalt shingle performance. Topics include the following:
1. Effects of aging on asphalt shingle wind resistance.
2. Effects of long-term wind gusts on the fatigue resistance of asphalt shingle tab self-seals.
3. Quantification of installation errors
1 2 • I N T E R F A C E M A Y / J U N E 2 0 1 2
and their impact on asphalt shingle wind resistance.
4. In-service performance of asphalt shingle tab self-seals.
5. Comparative shingle performance evaluation between ASTM D7158/UL 2390 tests and full-scale simulation of hurricane wind loads.
6. The mechanics of near-roof-surface wind flow.
Beginning in July 2010, the University of Florida commenced a research program to address the research topics outlined above. This three-year program will build upon the previous asphalt shingle wind research with the goal of improving the wind performance of shingles throughout their life cycle. Outcomes of this research will be presented in a future article.
ACKNOWLEDGEMENTS This paper was written though the sup
port of the Southeast Region Research Initiative (SERRI), which is managed by Oak Ridge National Laboratory for the U.S. Department of Homeland Securit; and the Florida Building Commission. Any opinions, findings, conclusions, or recommendations expressed in this paper are those of the authors and do not necessarily reflect the views of the sponsors, partners, or contributors.
REFERENCES H. Abraham, Asphalts and Allied
Substances, D. Van Nostrand Company, 1920.
ASTM D3161 (2005), Standard Test Method for Wind Resistance of Asphalt Shingles (Fan-Induced Method). ASTM International, West Conshohocken, PA.
ASTM D7158 (2008d), Standard Test Method for Wind Resistance of Asphalt Shingles (Uplift Force/Uplift Resistance Method). ASTM International, West Conshohocken, PA.
I.A. Benjamin and J.A. Bono, “Wind-Resistance Tests of Roof Shingles and Roof Assemblies,” ASTM Special Technical Publication 409, 1969.
P. Berdahl, H. Akbari, R. Levinson, and W.A. Miller, “Weathering of Roofing Materials - An Overview,” Construc tion and Building Materials, pp. 423433, 2008.
E.G. Blake, Roof Coverings: Their Manufacture and Application, Van
Nostrand Co., 1925. FEMA (2005b), “Hurricane Charley in C. Cash, “Asphalt Roofing Shingles,” Florida,” FEMA 488, Federal Emer
11th Conference on Roofing Technol - gency Management Agency. ogy, Gaithersburg, MD, 1995. FEMA (2006), “Summary Report on
L. Cochran, J.A. Peterka, and R. Building Performance: Hurricane Derickson, “Roof Surface Wind Ka trina,” FEMA 548, Federal Emer Speed Distributions on Low-Rise gency Management Agency. Buildings,” Architectural Science FEMA (2009), “Hurricane Ike in Texas Review, 1999. and Louisiana,” FEMA P-757, Fed er
W. Cullen, “Wind Resistance of Asphalt al Emergency Management Agency. Shingle Roofing,” Fall Conferences of S.H. Greenfeld, “Performance of Roofing the Building Research Institute, Felts Made With Asplund Fibers,” National Academy of Sciences, Na tional Bureau of Standards, Washington, DC, pp. 33-42, 1960. 1969.
W. Cullen, “Research and Performance K.R. Gurley and F.J. Masters, “Post-Experience of Asphalt Shingles,” 2004 Hurricane Field Survey of Res 10th Conference on Roofing Technol - idential Building Performance,” ogy, Gaithersburg, MD, pp. 6-12, ASCE Natural Hazards Review, No 1993. vember 2011.
W. Cullen, “The Evolution of Asphalt L.T. Hahn, D.J. Roodvoets, and K.D. Shingles: Survival of the Fittest?” Rhodes, “New Shingle Wind Re sist Professional Roofing, National Roof - ance Test Standards.” Interface, ing Contractors Association, pp. R4- RCI, Inc., August 2004. R8, 1992. Inspections, Texas, “Asphalt Shingle
FEMA (2005a), “Summary Report on Products That Conform to the 2008 Building Performance: 2004 Hur - International Residential Code (IRC) ricane Season,” FEMA 490, Federal and 2006 International Building Emergency Management Agency. Code (IBC), as Modified With Texas
Craig R. Dixon, EI
Craig R. Dixon, EI, received his undergraduate degree in civil engineering in the fall of 2008 from the University of Florida, and in the fall of 2009 he joined Dr. David O. Prevatt’s wind engineering research group at the University of Florida as a research assistant. During his undergraduate work, Dixon spent six summers interning for Gale Associates in Orlando, FL, performing roof observation and roof assessment studies. Dixon’s work as a research assistant includes investigations on the wind resistance of wood roof sheathing, standing-seam metal roofing, and asphalt shingles.
Dr. Forrest J. Masters, PhD, PE
Dr. Forrest J. Masters, PhD, PE, is an assistant professor of civil and coastal engineering at the University of Florida. His research program focuses on improving the resistance of residential and commercial buildings to extreme winds and rain. Experiments are conducted in the laboratory with full-scale simulators and in hurricanes to characterize the behavior of surface wind and wind-driven rain. He has received support from more than 20 grants from state, federal, and private sources, including the NSF Faculty Early Career Development (CAREER) Program. Dr. Masters is a reviewer for five journals and a member of ASCE, RICOWI, and ASTM.
Author biographies continued on page 14
M A Y / J U N E 2 0 1 2 I N T E R F A C E • 1 3
Dr. David O. Prevatt, PE
After earning his PhD from Clemson University in 1998, Dr. David O. Prevatt, PE, worked with the Boston-based ENR500 consulting engineering firm Simpson Gumpertz & Heger, Inc. in building envelope system design and remediation. He joined the faculty of Clemson University in 2004 as an assistant professor and directed the Wind Load Test Facility, conducting wind tunnel tests on low-rise building models and investigating of post-hurricane damage to residential buildings. In May 2007, Dr. Prevatt joined the University of Florida’s Department of Civil and Coastal Engineering, where his research focuses on the mitigation of extreme wind damage to low-rise construction. Dr. Prevatt recently led the damage assessment teams that documented damages caused by the 2011 Tuscaloosa, AL, and Joplin, MO, tornadoes. He was recently awarded an NSF Career research grant to develop more tornado-resilient homes and communities. Dr. Prevatt is a professional engineer (registered in Massachusetts and in Trinidad and Tobago). He is a member of ASCE, the American Association for Wind Engineering, and the UK Wind Engineering Society.
Dr. Kurtis R. Gurley
Dr. Kurtis R. Gurley is an associate professor at the University of Florida. His primary areas of research are wind effects on residential structures and stochastic modeling of extreme winds and structural resistance. Dr. Gurley has largely focused on in-field measurement and modeling of ground-level hurricane winds and wind loads on occupied coastal residential structures. This field data is coupled with post-storm residential damage assessments, laboratory evaluations of component capacities, and wind tunnel studies to model the vul
nerability of residential structures to hurricane wind damage. The research output from Dr. Gurley and his colleagues contributes to a variety of hazard preparation and response initiatives. Dr. Gurley is an associate editor for ASCE Journal of Structural Engineering, a member of the Board of Directors for the Applied Technology Council, and a member of the Technical Advisory Committee for the Federal Alliance for Safe Homes.
1 4 • I N T E R F A C E M A Y / J U N E 2 0 1 2
Issues, McDonough, GA, 2006. D.E. Shaw, “ARMA’s New Approach for
Evaluation of Asphalt Shingle Wind Resistance,” 1991 International Sym posium on Roofing Technology, Na tional Roofing Contractors Asso ci a tion, 1991.
M.L. Shiao, D.A. Nester, and L.A. Ter renzio, “On the Kinetics of Thermal Loads for Accelerated Aging,” ASTM Roofing Research and Standards Development, 2003.
M.L. Shiao, R.A. Snyder, R.D. Livsey, and H.M. Kalkanoglu, “Measuring Uplift Resistance of Asphalt Shingles,” ASTM Special Technical Publication, pp. 3-18, 2004.
T.L. Smith, “Improving Wind Performance of Asphalt Shingles: Lessons Learned From Hurricane Andrew.” 11th Conference on Roofing Tech nology, National Roofing Contrac tors Association, Gaithersburg, MD, pp. 39-48, 1995.
T.L. Smith and J. McDonald, “Roof Wind Damage Mitigation: Lessons From Hugo,” National Roofing Contractors Association, Professional Roofing, 1990.
T.L. Smith and M. Millen, “Influence of Nail Locations on Wind Resistance of Unsealed Asphalt Shingles,” North American Conference on Roofing Technology, 1999.
H.R. Snoke, “Asphalt-Prepared Roll Roof ings and Shingles,” National Bureau of Standards, 1941.
Strahan, J.L., Asphalt Roofing and Accessories: A Discussion Covering the Manufacture, Selection, and Appli cation of Asphalt Roofing Products, Asphalt Roofing Industry Bureau, 1947.
L.A. Terrenzio, J.W. Harrison, D.A. Nester and M.L. Shiao, “Natural vs. Artificial Aging: Use of Diffusion The ory to Model Asphalt and Fiberglass-Reinforced Shingle Performance,” Fourth International Sym po sium on Roofing Technology, NRCA, 1997.
UL 997 (1995), Wind Resistance for Pre pared Roof Covering Materials, Un der writers Laboratories.
UL 2390 (2003), Test Methods for Wind-Resistant Asphalt Shingles With Sealed Tabs, Underwriters Lab or a tories.
Revisions,” Texas Department of Insurance Windstorm Inspections, 2011.
IIBHS (2009). “Hurricane Ike: Nature’s Forces vs. Structural Strength,” Insurance Institute for Business & Home Safety.
Z. Liu, H. Pogorzelski, F.M. Masters, S. Tezak, and T.A. Reinhold, “Surviving Nature’s Fury: Performance of As phalt Shingle Roofs in the Real World,” Interface, RCI, Inc., Novem ber 2010.
T. Nichols, “A Stronger Bond,” Pro fessional Roofing, National Roofing Contractors Association, 2010.
J.A. Peterka and J.E. Cermak, “Wind-Tunnel Study of Wind Resistance of Roofing Shingles,” Colorado State University, Fort Collins, Colorado,
1983. J.A. Peterka, J.E. Cermak, L.S. Coch
ran, B.C. Cochran, N. Hosoya, R.G. Derickson, J. Jones, B. Metz, “Wind Uplift Model for Asphalt Shingles,” Journal of Architectural Engineering, pp. 147-155, 1997.
J.A. Peterka, J.E. Cermak, and N. Ho soya, “Wind-Tunnel Study of Wind Pressures on Roofing Shingles,” Colorado State University, Fort Collins, CO, 1983.
J.A. Peterka and W.S. Esterday, “De vel op ment of a Shingle Uplift Coefficient Test Standard,” Cermak Peterka Petersen, Inc., 2000. (Not publicly available.)
RICOWI, “Hurricanes Charley and Ivan Investigation Report,” Roofing In dus try Committee on Weather