Page 1
A MALDI, TGA, TG/MS, and DEA study of the irradiation
effects on PMMA
S.R. Tatro, G.R. Baker, K. Bisht, J.P. Harmon*
Department of Chemistry, University of South Florida, 4202 East Fowler Avenue, Tampa, FL 33620-5250, USA
Received 23 May 2002; received in revised form 30 September 2002; accepted 2 October 2002
Abstract
Poly(methyl methacrylate) (PMMA) (Mw ¼ 6.4 £ 103, PD ¼ 1.06) was irradiated under vacuum. The constant dose rate was
1.66 £ 104 rad/min at doses between 10 and 100 Mrad using a cobalt-60 source. The samples were then analyzed by matrix assisted laser
desorption/ionization (MALDI), hyphenated thermogravimetric/mass spectrometry (TG/MS), and dielectric analysis (DEA), all novel
methods for the analysis of polymers damaged by radiation. Gel permeation chromatography (GPC), nuclear magnetic resonance (NMR),
and differential scanning calorimetry (DSC) were also used for analysis. This study evidenced main chain scission, the removal of ester side
groups, and the production of monomer as a result of ionizing radiation.
q 2002 Elsevier Science Ltd. All rights reserved.
Keywords: Matrix assisted laser desorption/ionization; Poly(methyl methacrylate); Radiation
1. Introduction
This study focuses on the irradiation of highly syndio-
tactic poly(methyl methacrylate) (PMMA), and uses several
novel methods to study radiation damage. By choosing a
polymer that has been studied extensively [1–13], the
results from the current study using novel techniques can be
viewed in correlation with results of previously published
findings.
It has been documented that when PMMA is exposed to
both g and ultraviolet radiation, main chain scission is the
dominant occurrence in both air and vacuum [2,5]. As a
result of the scission of the main chain, the molecular weight
decreases, which, in turn, causes a decrease in the glass
transition temperature [5]. Products include monomer,
hydrogen gas, carbon dioxide, carbon monoxide, methane,
and propane. The ratios of hydrogen, carbon dioxide, carbon
monoxide, and methane to one another are roughly
equivalent to the ratios of the elements contained in an
ester side group [2].
A relatively new technique, matrix assisted laser
desorption/ionization (MALDI), was developed in the late
1980s. The use of this technique allowed polymer molecules
to be ionized and desorbed without fragmenting the
molecules [14,15]. Its use for the analysis of synthetic
polymers has been recently reviewed by McEwen and
Peacock [16]. MALDI provides the weight average
molecular weight (Mw), the number average molecular
weight (Mn), and the polydispersity (PD). The classic
definitions of these terms are as follows [17,18]
Mw ¼
PNxM2
xPNxMx
ð1Þ
and
Mn ¼
PNxMxP
Nx
ð2Þ
where Mw is the weight average molecular weight, Mn is the
number average molecular weight, Nx is the total number of
molecules of length x, and Mx is the molecular weight of a
molecule corresponding to a degree of polymerization x.
The ratio of molecular weights is used to represent the
breadth of the molecular weight distribution
PD ¼Mw
Mn
ð3Þ
where PD is the polydispersity.
As research continued, studies demonstrated MALDI to
be an optimum technique for polymers with a narrow
molecular weight distribution while problems arise with
0032-3861/03/$ - see front matter q 2002 Elsevier Science Ltd. All rights reserved.
PII: S0 03 2 -3 86 1 (0 2) 00 7 27 -9
Polymer 44 (2003) 167–176
www.elsevier.com/locate/polymer
* Corresponding author. Tel.: þ1-813-974-3397; fax: þ1-813-974-1733.
E-mail address: [email protected] (J.P. Harmon).
Page 2
polydisperse polymers [19–25]. As a result of these
findings, it must be concluded MALDI is a choice method
for analyzing polymer standards [25], including standards
used for the generation of Mark–Houwink–Sakurada
parameters [26], and the PMMA standards used in this
study. Previously, MALDI has been used to characterize
biopolymers [16,27–29], synthetic polymers [19,30–32],
and dendrimers [33,34], and to study the thermal degra-
dation of PMMA [35]; however, no previous work has been
done in which MALDI was used to study radiation damage
of a polymer sample.
Another method of data collection, thermogravimetric
analysis (TGA), involves the decomposition of a sample in
order to characterize thermal stability [36]. TGA provides
mass/temperature curves corresponding to mass changes as
the polymer degrades [37] and has proven to be a very
useful technique; however, information regarding the
classification of the molecules responsible for the reduction
in mass cannot be obtained through this system alone. In
order to classify the compounds evolving from the
decomposing polymer, thus greatly improving the system,
some type of evolved gas analysis (EGA) can be used
[37–42]. By coupling these two systems, both qualitative
and quantitative information can be collected [37–39,
43–46]. There have been several TGA/EGA systems
described in the literature. Some of these hyphenated
systems include: TGA coupled with gas chromatography
(GC), mass spectrometry (MS), or infrared spectroscopy
(FTIR). Research has shown MS to be the most powerful
and widely used [37,47,48]. The online coupling of these
two procedures provides several advantages, which include
speed and reduced sample handling [44]. Thermogravi-
metric analysis/mass spectrometry (TG/MS) has been
available from several manufacturers since 1987 [37]. Past
polymer studies (quantitative analysis, kinetics, analysis of
evolved gases during synthesis, processing, and recycling,
product development, reactivity and curing, structural
characterization and chemical analysis, and thermal stability
and degradation) have been previously reviewed [44].
Dielectric analysis (DEA) provides information about
relaxations in polymers [49]. It has been previously
documented that PMMA has three transitions. These
transitions are labeled a, b, and g, with decreasing
temperature, and the a transition corresponds to the Tg [5,
50,51]. The b transition is associated with the rotation of the
–COOCH3 side group and can be observed through DEA of
PMMA at low temperatures and low frequencies. At higher
temperatures and frequencies, the b transition merges with
the a transition resulting in an ab transition corresponding
to cooperative main chain slippage and side group rotation
[52–55]. The g transition is associated with rotation of the
methyl groups attached directly to the main chain and can be
observed in mechanical experiments. It cannot, however, be
seen in dielectric experiments as the rotation of the methyl
groups does not cause a change in the dipole moment of the
polymer [56].
In DEA a sinusoidal voltage is applied to the sample
causing polarization. By measuring the resulting current, the
permittivity (10) and the loss factor (100), which represent the
amount of alignment of the dipoles and the energy required
to align dipoles, respectively, can be determined. From this
information, the tangent of the phase angle shift (tan d can
be calculated by Eq. (4) [57]
tan d ¼100
10ð4Þ
The peak maximums in a tan d vs. temperature plot can then
be used to determine the a and b transition temperatures for
several frequencies.
This is the first study combining the use of these
techniques to study radiolysis of PMMA. These data were
combined with data collected through gel permeation
chromatography (GPC), nuclear magnetic resonance
(NMR), and differential scanning calorimetry (DSC) to
gain a more complete picture of what is occurring during the
irradiation of PMMA.
2. Experimental
2.1. Materials
The PMMA standard was purchased from Polymer
Source (Dorval, Canada). The PMMA standard was
determined by Polymer Source to have a number average
molecular weight of 6.4 £ 103, a weight average molecular
weight of 6.8 £ 103, and a PD of 1.06 through size exclusion
chromatography. The end groups of the PMMA, as
determined by Polymer Source, consist of an isobutyl
group and 2–3 a-methyl styrenes at the initiator end with a
hydrogen at the terminal end. The tacticity, also determined
by Polymer Source, is greater than 79% syndiotactic. The
MALDI matrix, 3-b-indoleacrylic acid (IAA), and Cyto-
chrome C calibration standard were purchased from Sigma
(St. Louis, MO). Potassium chloride was purchased from
J.T. Baker Chemical Corporation (Philipsburg, NJ). The
solvents used were HPLC grade tetrahydrofuran (THF)
purchased from Fisher Scientific (Pittsburgh, PA), and ethyl
alcohol and chloroform-d (CDCl3), purchased from Aldrich
(Milwaukee, WI). The polymer standard was heated
(100 8C) under a vacuum oven for several days to remove
any residual solvent acquired during purification. All other
materials were used without further purification.
2.2. Irradiation
The polymer samples were heated above the glass
transition temperature to assist in oxygen removal and
sealed under vacuum at a final pressure of 1024 Torr. All
samples (excluding the control) were irradiated at room
temperature by gamma radiation from a 60Co source. The
constant dose rate was 1.66 £ 104 rad/min at doses between
S.R. Tatro et al. / Polymer 44 (2003) 167–176168
Page 3
10 and 100 Mrad. After irradiation, samples were heated
above the glass transition temperature (Tg) before vacuum
was broken to annihilate free radicals.
2.3. MALDI sample preparation
The PMMA samples (1 mg) were dissolved in THF
(1 ml). The matrix solution was prepared by dissolving IAA
(20 mg) in THF (1 ml). In addition, a saturated solution of
potassium chloride in ethanol was prepared. Polymer,
matrix, and salt solutions were then mixed in a
10:40:4 ml, respectively. The samples (1–2 ml) were then
spotted on the target and allowed to dry in the air. Once dry,
the target was spotted again in the same fashion.
2.4. MALDI mass spectrometry
A Bruker REFLEX II MALDI-TOF instrument was used
to obtain the mass spectrum data. The MALDI system
includes the Scout source, High Mass detectorw, delayed
extraction, and XMASS data processing software [58]. A
standard N2 laser with a wavelength of 355 nm and a pulse
width of 3 ns was used as the radiation source. The
instrument was operated in the positive ion reflectron
mode, and Cytochrome C was used as a calibration
standard. The acceleration voltage and detector voltage
were 25 and 1.5 kV, respectively. Each spectra is the sum of
,100 laser shots.
2.5. Gel permeation chromatography
Each sample was dissolved in THF and run on a
Shimadzu LC-10AD Liquid Chromatograph with a flow rate
of 1 ml/min. The GPC was equipped with both a RID-10A
Refractive Index detector and a SPD-10AV UV–Vis
detector with a wavelength of 254 nm, both of which are
manufactured by Shimadzu.
2.6. Dielectric analysis
Dielectric data was collected using a TA Instruments
2970 DEA. The control and irradiated samples were heated
(110 8C) under vacuum for several days after irradiation.
This was done to remove any volatile compounds that could
cause bubbling of the sample during analysis. The analysis
was conducted under nitrogen purge from a temperature of
2150 to 200 8C at a ramp rate of 5 8C/min. Single surface
sensors were used as the samples were in powder form. A
maximum force of 250 N was applied to the samples that
reached a range of thickness from 0.3 to 1.4 mm. The loss
factor (100) and tan d were recorded at frequencies ranging
from 1021 to 3.0 £ 108 Hz.
2.7. Differential scanning calorimetry
A TA Instruments 2920 DSC was used to determine the
glass transition temperatures of the PMMA. Samples from 7
to 10 mg were scanned under a nitrogen purge at a ramp rate
of 10 8C/min. Glass transition temperatures were deter-
mined on the second scan to assure identical thermal
histories.
2.8. Thermogravimetric analysis/mass spectrometry
In order to conduct the TGA, 5–10 mg samples of
PMMA were scanned using a TA Instruments HiRes TGA
2950. The data was obtained under a dry nitrogen purge
using a Hi Res method and ramping at 20 8C/min from 50 to
475 8C. The TGA was coupled with a Pfeiffer Vacuum
Thermostar GSD300T Mass Spectrometer.
2.9. Nuclear magnetic resonance
1H NMR spectra were recorded using a Varian UNITY
Plus 750 MHz NMR. 1H NMR chemical shifts are reported
downfield from 0.00 ppm using TMS as an internal
standard. The concentrations were approximately 4% w/v
in CDCl3.
3. Results and discussion
3.1. MALDI
The changes in number average molecular weight (Mn),
weight average molecular weight (Mw), PD, and the modal
(Mp), most prevalent molecular weight, were all examined
through the use of the MALDI for various radiation doses.
As shown in Table 1 and as expected, there was a significant
decrease in the Mn and Mw values as the total dose increases.
The PD value increased noticeably with the increased dose
indicating a larger distribution of chain lengths caused by
main chain scission. While it is known that problems occur
in samples with high polydispersities, these results are
substantiated by the GPC data to be discussed in the
following section. Fig. 1 is the MALDI spectra for each of
the different doses. As the dose was increased, there was
also an increase in the shorter chain length peaks. The most
probable peak (Mp) value does not change at any dose
suggesting the probability of chain scission being indepen-
dent of chain length (refer to Table 1). In addition, the
removal of the ester side group is noted by an increase in the
Table 1
MALDI data for irradiated and non-irradiated PMMA
Sample Mn Mw PD Mp
Control 7584 8009 1.06 7447
10 Mrad 6967 8097 1.16 7348
20 Mrad 5192 7165 1.38 7447
50 Mrad 4627 6735 1.46 7447
100 Mrad 3908 5589 1.53 7347
S.R. Tatro et al. / Polymer 44 (2003) 167–176 169
Page 4
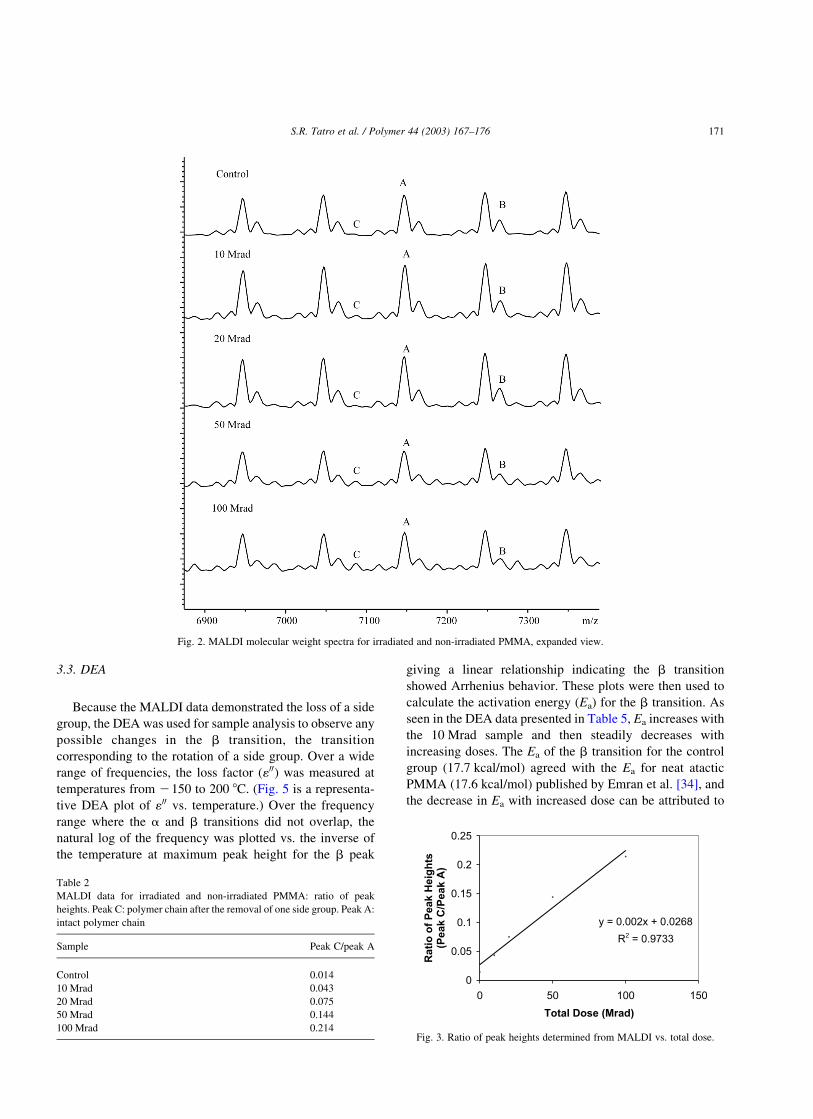
peak corresponding to the loss of one side chain, which can
be seen in Fig. 2. Peak A represents the intact polymer with
two a-methyl styrene groups in the end group, and peak B
corresponds to the intact polymer with three a-methyl
styrene groups in the end group. Both are associated with a
potassium ion. The mass to charge ratio (m/z ) correspond-
ing to peak C is 60 m/z less than the large peak of the intact
polymer chain to the right (peak A), a value that is
equivalent to the mass of one side group plus a hydrogen
atom. This is consistent with a mechanism published by
Guillet [59]. Table 2 provides the ratio of peak heights for
peaks A and C (Fig. 2). Fig. 3 is a plot of the ratio of peak
height vs. total dose. As seen in the plot, the ratio of peak
heights is linearly related to the total dose.
Through the use of the MALDI, evidence for main chain
scission was seen by the decrease in molecular weight and
the increase in PD. The removal of one side group has also
been clearly shown, suggesting the possibility of the
polymer degradation beginning with the loss of the side
group.
3.2. GPC
GPC was used to determine the changes in Mn, Mw, PD,
and Mp. The GPC data in Table 3, data collected from the
refractive index (RI) detector, and in Table 4, data collected
from the ultraviolet (UV) detector, support the MALDI data
by showing a decrease in the molecular weight and an
increase in PD. The GPC data are, however, slightly lower
than the MALDI data, and there is a slight decrease in Mp
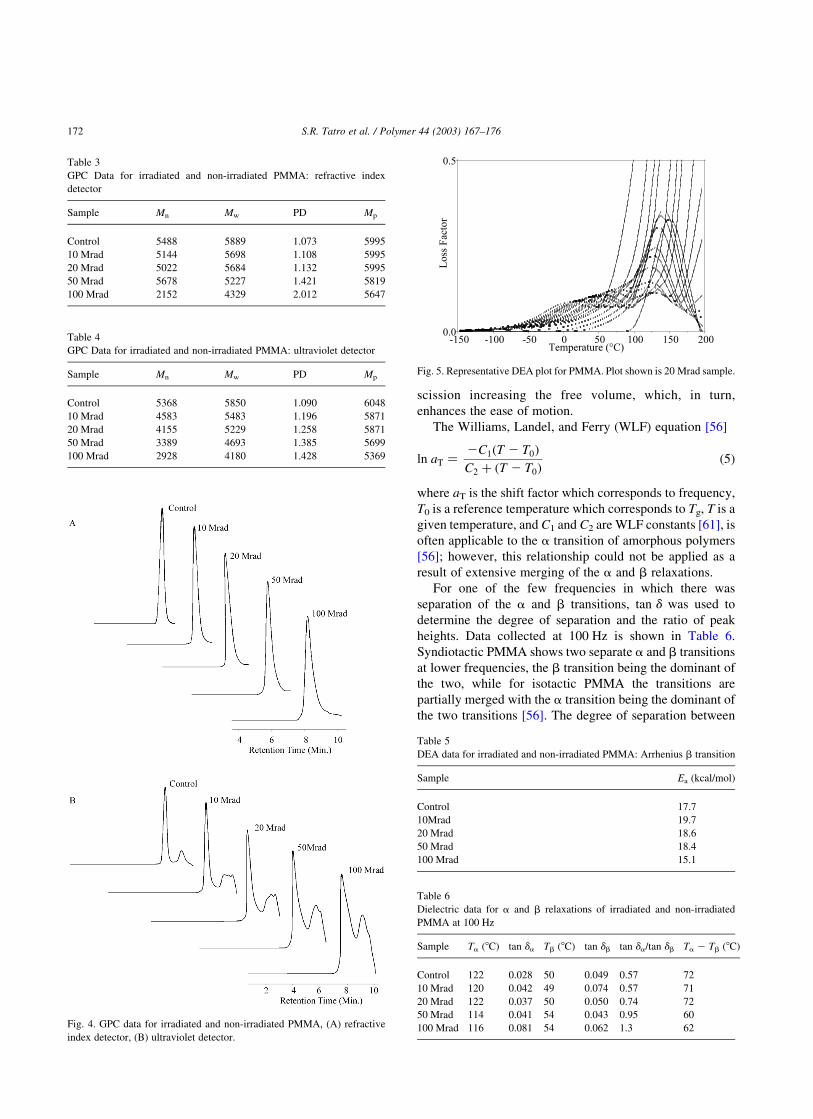
(Fig. 4). While the origin of the differences between the
GPC and MALDI molecular weight data is unclear, the
tendency for molecular weight data collected through
MALDI to be slightly higher than that collected through
GPC has been shown previously [20,24,25].
In the UV detector, a low molecular weight peak
increases as the dose increases. This peak is not visible
with the RI detector indicating the presence of a
chromophore that absorbs at 254 nm with a refractive
index similar to that of the solvent. The refractive index of
THF is 1.407 [60] and the refractive index for methyl
methacrylate is 1.414 as determined by Aldrich. These data
suggest the low molecular weight peak illustrates the
presence of monomer that increases with dose.
The GPC data shows agreement with the MALDI data,
and therefore, substantiates the reliability of the data
collected through the MALDI, including the decrease in
molecular weight and the increase in PD.
Fig. 1. MALDI molecular weight spectra for irradiated and non-irradiated PMMA.
S.R. Tatro et al. / Polymer 44 (2003) 167–176170
Page 5
3.3. DEA
Because the MALDI data demonstrated the loss of a side
group, the DEA was used for sample analysis to observe any
possible changes in the b transition, the transition
corresponding to the rotation of a side group. Over a wide
range of frequencies, the loss factor (100) was measured at
temperatures from 2150 to 200 8C. (Fig. 5 is a representa-
tive DEA plot of 100 vs. temperature.) Over the frequency
range where the a and b transitions did not overlap, the
natural log of the frequency was plotted vs. the inverse of
the temperature at maximum peak height for the b peak
giving a linear relationship indicating the b transition
showed Arrhenius behavior. These plots were then used to
calculate the activation energy (Ea) for the b transition. As
seen in the DEA data presented in Table 5, Ea increases with
the 10 Mrad sample and then steadily decreases with
increasing doses. The Ea of the b transition for the control
group (17.7 kcal/mol) agreed with the Ea for neat atactic
PMMA (17.6 kcal/mol) published by Emran et al. [34], and
the decrease in Ea with increased dose can be attributed to
Fig. 2. MALDI molecular weight spectra for irradiated and non-irradiated PMMA, expanded view.
Table 2
MALDI data for irradiated and non-irradiated PMMA: ratio of peak
heights. Peak C: polymer chain after the removal of one side group. Peak A:
intact polymer chain
Sample Peak C/peak A
Control 0.014
10 Mrad 0.043
20 Mrad 0.075
50 Mrad 0.144
100 Mrad 0.214Fig. 3. Ratio of peak heights determined from MALDI vs. total dose.
S.R. Tatro et al. / Polymer 44 (2003) 167–176 171
Page 6
scission increasing the free volume, which, in turn,
enhances the ease of motion.
The Williams, Landel, and Ferry (WLF) equation [56]
ln aT ¼2C1ðT 2 T0Þ
C2 þ ðT 2 T0Þð5Þ
where aT is the shift factor which corresponds to frequency,
T0 is a reference temperature which corresponds to Tg, T is a
given temperature, and C1 and C2 are WLF constants [61], is
often applicable to the a transition of amorphous polymers
[56]; however, this relationship could not be applied as a
result of extensive merging of the a and b relaxations.
For one of the few frequencies in which there was
separation of the a and b transitions, tan d was used to
determine the degree of separation and the ratio of peak
heights. Data collected at 100 Hz is shown in Table 6.
Syndiotactic PMMA shows two separate a and b transitions
at lower frequencies, the b transition being the dominant of
the two, while for isotactic PMMA the transitions are
partially merged with the a transition being the dominant of
the two transitions [56]. The degree of separation between
Fig. 4. GPC data for irradiated and non-irradiated PMMA, (A) refractive
index detector, (B) ultraviolet detector.
Fig. 5. Representative DEA plot for PMMA. Plot shown is 20 Mrad sample.
Table 3
GPC Data for irradiated and non-irradiated PMMA: refractive index
detector
Sample Mn Mw PD Mp
Control 5488 5889 1.073 5995
10 Mrad 5144 5698 1.108 5995
20 Mrad 5022 5684 1.132 5995
50 Mrad 5678 5227 1.421 5819
100 Mrad 2152 4329 2.012 5647
Table 4
GPC Data for irradiated and non-irradiated PMMA: ultraviolet detector
Sample Mn Mw PD Mp
Control 5368 5850 1.090 6048
10 Mrad 4583 5483 1.196 5871
20 Mrad 4155 5229 1.258 5871
50 Mrad 3389 4693 1.385 5699
100 Mrad 2928 4180 1.428 5369
Table 5
DEA data for irradiated and non-irradiated PMMA: Arrhenius b transition
Sample Ea (kcal/mol)
Control 17.7
10Mrad 19.7
20 Mrad 18.6
50 Mrad 18.4
100 Mrad 15.1
Table 6
Dielectric data for a and b relaxations of irradiated and non-irradiated
PMMA at 100 Hz
Sample Ta (8C) tan da Tb (8C) tan db tan da/tan db Ta 2 Tb (8C)
Control 122 0.028 50 0.049 0.57 72
10 Mrad 120 0.042 49 0.074 0.57 71
20 Mrad 122 0.037 50 0.050 0.74 72
50 Mrad 114 0.041 54 0.043 0.95 60
100 Mrad 116 0.081 54 0.062 1.3 62
S.R. Tatro et al. / Polymer 44 (2003) 167–176172
Page 7
the a and b transitions for the irradiated samples remained
relatively constant up through 20 Mrad (Table 6). At
50 Mrad, the degree of separation drops significantly and
then once again remains constant. The decrease in
separation was due to a decrease in Tg caused by scission.
The ratio of peak heights (Table 6), tan da/tan dbevidences a trend. The ratio remains constant through
10 Mrad and then increases at the dose increases illustrating
the emergence of the a transition as the dominant peak, a
result of the loss of the ester side groups.
This study will be expanded to include further tacticities
to determine if the same trends are evident as configuration
has a significant effect on the peak height ratios and the
separation of the two transitions.
3.4. DSC
DSC was used to examine the change in the Tg cause by
exposure to irradiation. Table 7 shows the Tg and breadth of
transition for various doses of radiation. As the radiation
dose increases, the Tg of the PMMA decreases. The decrease
in Tg is a result of the decrease in molecular weight already
demonstrated by MALDI. In addition to the decrease in
molecular weight, there is also an increase in the breadth of
the transition. The breadth of the transition starts at 9.31 8C
for the control group and increases to 15.55 8C for the
100 Mrad sample, a change of 67%. A completely
homogenous material demonstrates a very narrow transition
breadth, and a broad transition indicates a heterogeneous
blend [62]. Thus, the increase in the breadth of the transition
evidences an increase in the content of radiation products,
including monomer, as the total dose is increased.
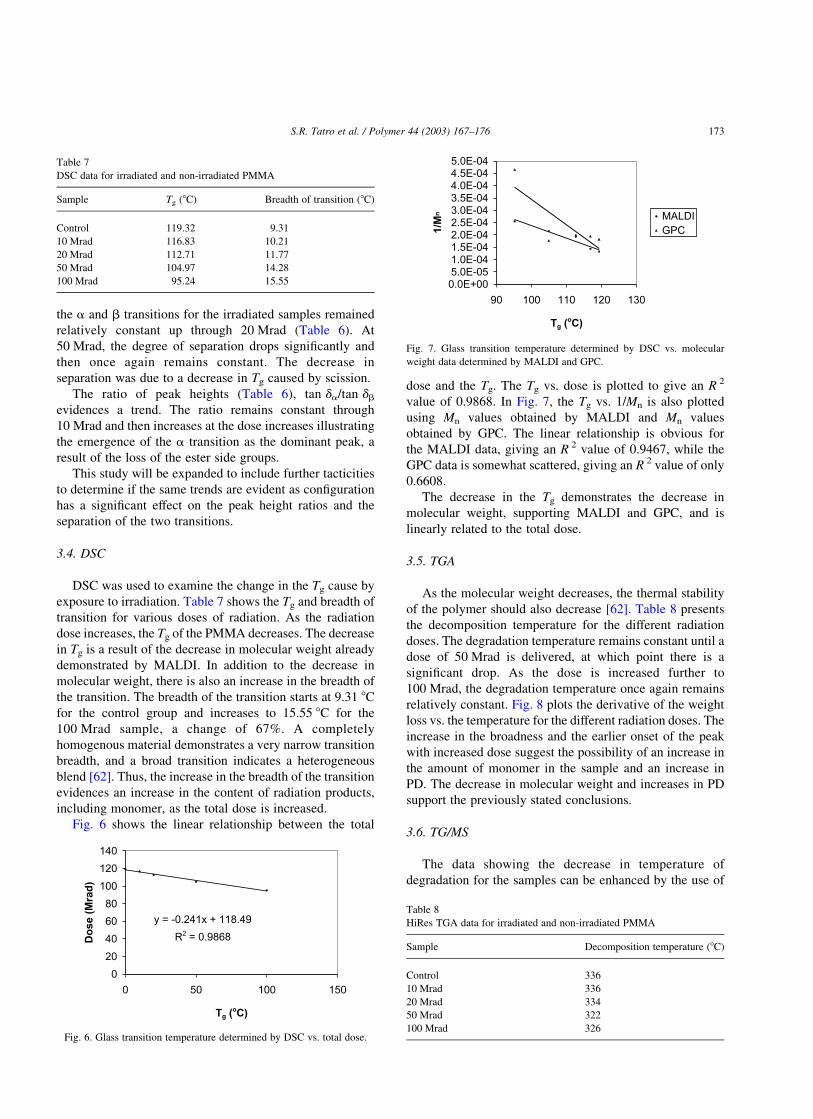
Fig. 6 shows the linear relationship between the total
dose and the Tg. The Tg vs. dose is plotted to give an R 2
value of 0.9868. In Fig. 7, the Tg vs. 1/Mn is also plotted
using Mn values obtained by MALDI and Mn values
obtained by GPC. The linear relationship is obvious for
the MALDI data, giving an R 2 value of 0.9467, while the
GPC data is somewhat scattered, giving an R 2 value of only
0.6608.
The decrease in the Tg demonstrates the decrease in
molecular weight, supporting MALDI and GPC, and is
linearly related to the total dose.
3.5. TGA
As the molecular weight decreases, the thermal stability
of the polymer should also decrease [62]. Table 8 presents
the decomposition temperature for the different radiation
doses. The degradation temperature remains constant until a
dose of 50 Mrad is delivered, at which point there is a
significant drop. As the dose is increased further to
100 Mrad, the degradation temperature once again remains
relatively constant. Fig. 8 plots the derivative of the weight
loss vs. the temperature for the different radiation doses. The
increase in the broadness and the earlier onset of the peak
with increased dose suggest the possibility of an increase in
the amount of monomer in the sample and an increase in
PD. The decrease in molecular weight and increases in PD
support the previously stated conclusions.
3.6. TG/MS
The data showing the decrease in temperature of
degradation for the samples can be enhanced by the use of
Table 7
DSC data for irradiated and non-irradiated PMMA
Sample Tg (8C) Breadth of transition (8C)
Control 119.32 9.31
10 Mrad 116.83 10.21
20 Mrad 112.71 11.77
50 Mrad 104.97 14.28
100 Mrad 95.24 15.55
Fig. 6. Glass transition temperature determined by DSC vs. total dose.
Fig. 7. Glass transition temperature determined by DSC vs. molecular
weight data determined by MALDI and GPC.
Table 8
HiRes TGA data for irradiated and non-irradiated PMMA
Sample Decomposition temperature (8C)
Control 336
10 Mrad 336
20 Mrad 334
50 Mrad 322
100 Mrad 326
S.R. Tatro et al. / Polymer 44 (2003) 167–176 173
Page 8
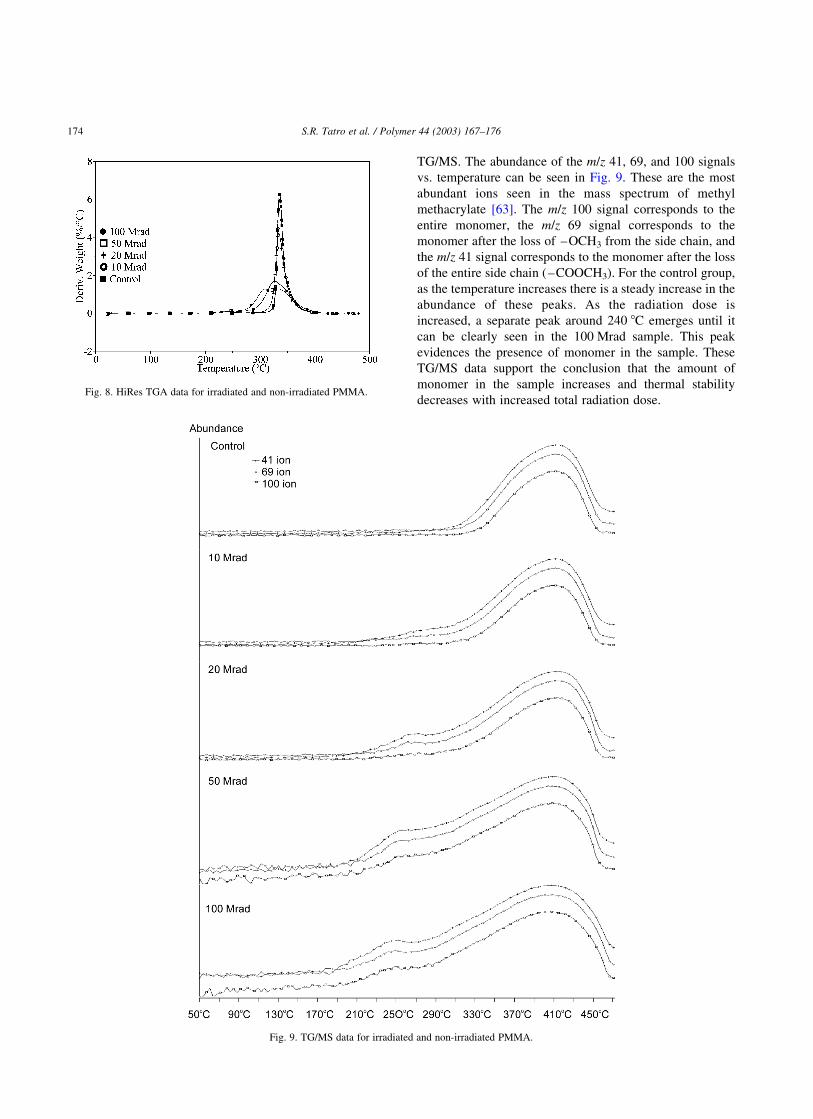
TG/MS. The abundance of the m/z 41, 69, and 100 signals
vs. temperature can be seen in Fig. 9. These are the most
abundant ions seen in the mass spectrum of methyl
methacrylate [63]. The m/z 100 signal corresponds to the
entire monomer, the m/z 69 signal corresponds to the
monomer after the loss of –OCH3 from the side chain, and
the m/z 41 signal corresponds to the monomer after the loss
of the entire side chain (–COOCH3). For the control group,
as the temperature increases there is a steady increase in the
abundance of these peaks. As the radiation dose is
increased, a separate peak around 240 8C emerges until it
can be clearly seen in the 100 Mrad sample. This peak
evidences the presence of monomer in the sample. These
TG/MS data support the conclusion that the amount of
monomer in the sample increases and thermal stability
decreases with increased total radiation dose.Fig. 8. HiRes TGA data for irradiated and non-irradiated PMMA.
Fig. 9. TG/MS data for irradiated and non-irradiated PMMA.
S.R. Tatro et al. / Polymer 44 (2003) 167–176174
Page 9
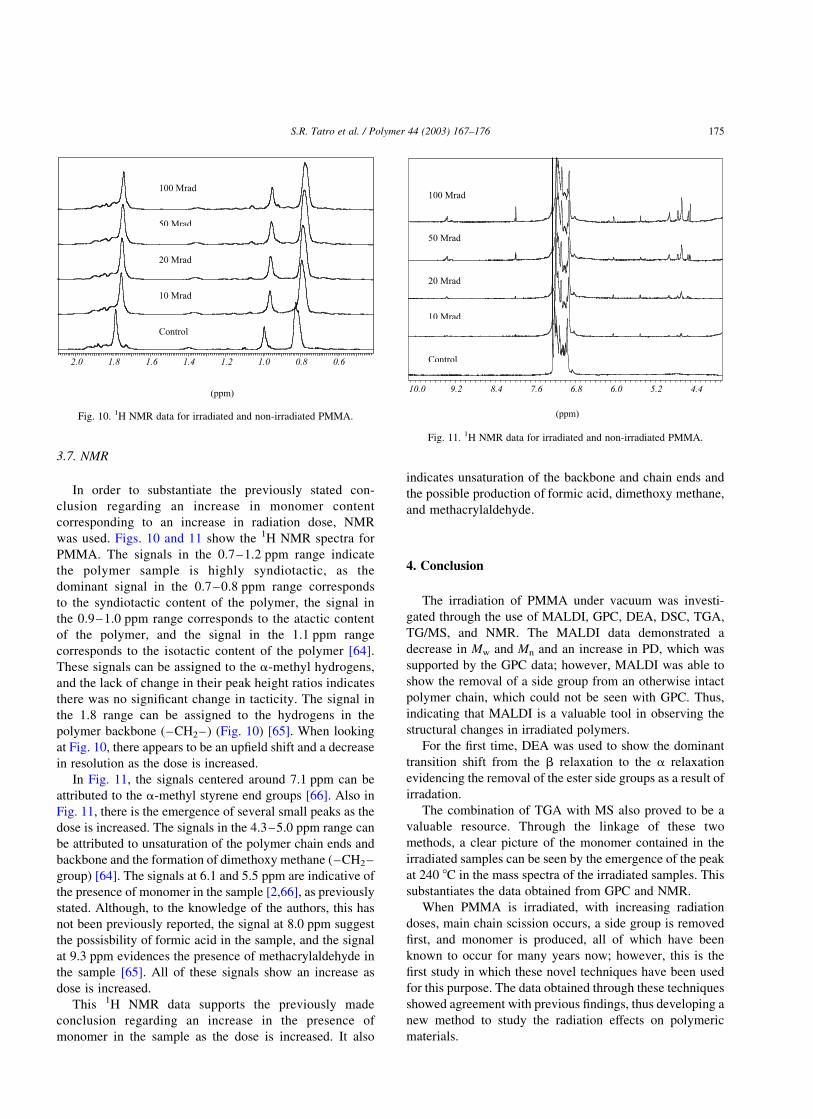
3.7. NMR
In order to substantiate the previously stated con-
clusion regarding an increase in monomer content
corresponding to an increase in radiation dose, NMR
was used. Figs. 10 and 11 show the 1H NMR spectra for
PMMA. The signals in the 0.7–1.2 ppm range indicate
the polymer sample is highly syndiotactic, as the
dominant signal in the 0.7–0.8 ppm range corresponds
to the syndiotactic content of the polymer, the signal in
the 0.9–1.0 ppm range corresponds to the atactic content
of the polymer, and the signal in the 1.1 ppm range
corresponds to the isotactic content of the polymer [64].
These signals can be assigned to the a-methyl hydrogens,
and the lack of change in their peak height ratios indicates
there was no significant change in tacticity. The signal in
the 1.8 range can be assigned to the hydrogens in the
polymer backbone (–CH2–) (Fig. 10) [65]. When looking
at Fig. 10, there appears to be an upfield shift and a decrease
in resolution as the dose is increased.
In Fig. 11, the signals centered around 7.1 ppm can be
attributed to the a-methyl styrene end groups [66]. Also in
Fig. 11, there is the emergence of several small peaks as the
dose is increased. The signals in the 4.3–5.0 ppm range can
be attributed to unsaturation of the polymer chain ends and
backbone and the formation of dimethoxy methane (–CH2–
group) [64]. The signals at 6.1 and 5.5 ppm are indicative of
the presence of monomer in the sample [2,66], as previously
stated. Although, to the knowledge of the authors, this has
not been previously reported, the signal at 8.0 ppm suggest
the possisbility of formic acid in the sample, and the signal
at 9.3 ppm evidences the presence of methacrylaldehyde in
the sample [65]. All of these signals show an increase as
dose is increased.
This 1H NMR data supports the previously made
conclusion regarding an increase in the presence of
monomer in the sample as the dose is increased. It also
indicates unsaturation of the backbone and chain ends and
the possible production of formic acid, dimethoxy methane,
and methacrylaldehyde.
4. Conclusion
The irradiation of PMMA under vacuum was investi-
gated through the use of MALDI, GPC, DEA, DSC, TGA,
TG/MS, and NMR. The MALDI data demonstrated a
decrease in Mw and Mn and an increase in PD, which was
supported by the GPC data; however, MALDI was able to
show the removal of a side group from an otherwise intact
polymer chain, which could not be seen with GPC. Thus,
indicating that MALDI is a valuable tool in observing the
structural changes in irradiated polymers.
For the first time, DEA was used to show the dominant
transition shift from the b relaxation to the a relaxation
evidencing the removal of the ester side groups as a result of
irradation.
The combination of TGA with MS also proved to be a
valuable resource. Through the linkage of these two
methods, a clear picture of the monomer contained in the
irradiated samples can be seen by the emergence of the peak
at 240 8C in the mass spectra of the irradiated samples. This
substantiates the data obtained from GPC and NMR.
When PMMA is irradiated, with increasing radiation
doses, main chain scission occurs, a side group is removed
first, and monomer is produced, all of which have been
known to occur for many years now; however, this is the
first study in which these novel techniques have been used
for this purpose. The data obtained through these techniques
showed agreement with previous findings, thus developing a
new method to study the radiation effects on polymeric
materials.
Fig. 10. 1H NMR data for irradiated and non-irradiated PMMA.
Fig. 11. 1H NMR data for irradiated and non-irradiated PMMA.
S.R. Tatro et al. / Polymer 44 (2003) 167–176 175
Page 10
Acknowledgements
The authors would like to thank Talal Al-Azemi for his
help with the NMR and GPC data, Dr Katherine Williams of
the University of Florida for her help for the use of the
irradiation chamber, Dr Charles Moorefield and Dr Venkat
R. Dudipala of the University of Akron for their help with
the NMR data, and Dr Michael Zaworotko for the use of the
TG/MS.
References
[1] Kudoh H, Sasuga T, Seguchi T, Katsumura Y. Polymer 1996;37(21):
4663–5.
[2] Reich L, Stivala S. Elements of polymer degradation. New York:
McGraw-Hill; 1971. Chapter 1.
[3] Shrempel F, Witthuhn W. Nuclear Instrum Meth Phys Res B 1997;
132:430–8.
[4] Ichikawa T, Oyama K, Kondoh T, Yoshida H. J Polym Sci, Part A:
Polym Chem 1994;32:2487–92.
[5] Goyanes SN, Benites GM, Gonzalez JJ, Rubiolo GH, Marzocca AJ.
Polym Test 1997;16:7–18.
[6] Okudaira KK, Morikawa E, Hasegawa S, Sprunger PT, Saile V, Seki
K, Harada Y, Ueno N. J Electron Spectrosc 1998;88–89:913–7.
[7] Goyanes SN, Benites GM, Rubiolo GH, Marzocca AJ. J Phys III
1996;6:587–90.
[8] Sayyah SM, Sabbah IA, Ayaub MMH, Barsoum BN, Elwy E. Polym
Degrad Stab 1997;58:1–9.
[9] El-Salmawi K, Abu Zeid MM, El-Naggar AM, Mamdouh M. J Appl
Polym Sci 1999;72:509–20.
[10] Gaynor J, Schueneman G, Schuman P, Harmon JP. J Appl Polym Sci
1993;50:1645–53.
[11] Harmon JP, Gaynor JF, Taylor AG. Radiat Phys Chem 1993;41:
153–64.
[12] Bertolucci PRH, Harmon JP. Polym Engng Sci 1998;38:699–705.
[13] Harmon JP, Gaynor JF. J Polym Sci, Part B: Polym Phys 1993;31:
235–6.
[14] Karas M, Hillenkamp F. Anal Chem 1988;60:2299–301.
[15] Hillenkamp F, Karas M, Beavis RC, Chait BT. Anal Chem 1991;63:
1193–203.
[16] McEwen CN, Peacock PM. Anal Chem 2002;74:2743–8.
[17] Campbell I. Introduction to synthetic polymers. Oxford: Oxford
University Press; 1994. p. 45, see also p. 18–9.
[18] Stevens M. Polymer chemistry, 3rd ed. New York: Oxford University
Press; 1999. p. 168.
[19] Larsen BS, Simonsick Jr. WJ, McEwen CN. J Am Soc Mass
Spectrosc. 1996;7:287–92.
[20] Thompson B, Suddaby K, Rudin A, Lajoie G. Eur Polym 1996;32(2):
239–56.
[21] Lehrle RS, Sarson DS. Polym Degrad Stab 1996;51:197–204.
[22] Guo B, Chen H, Rashidzadeh H, Liu X. Rapid Commun Mass
Spectrom. 1997;11:781–5.
[23] Danis PO, Karr DE, Simonsick Jr. WJ, Wu DT. Macromolecules
1995;28:1229–32.
[24] Cottrell JS, Koerner M, Gerhards R. Rapid Commun Mass Spectrom.
1995;9:1562–4.
[25] Zhu H, Yalcin T, Li L. J Am Soc Mass Spectrosc 1998;9:275–81.
[26] Tatro SR, Baker GR, Fleming R, Harmon JP. Polymer 2002;43:
2329–35.
[27] Karas M, Bahr U, Geissman U. Mass Spectrom Rev 1992;10:335–7.
[28] Beavis RC, Chait BT. Rapid Commun Mass Spectrom 1989;3:432–5.
[29] Spengler B, Pan Y, Cotter RJ, Kan LS. Rapid Commun Mass
Spectrom 1990;4:99–102.
[30] Jackson AT, Bunn A, Hutchings LR, Kiff FT, Richards RW, Williams
J, Green MR, Bateman RH. Polymer 2000;41:7437–50.
[31] Montaudo G, Garozzo D, Montaudo M, Puglisi C, Samperi F.
Macromolecules 1995;28:7983–9.
[32] Hanton SD. Chem Rev 2001;101:527–69.
[33] Emran SK, Newkome GR, Weis CD, Harmon JP. J Polym Sci, Part B:
Polym Phys 1999;37:2025–38.
[34] Emran SK, Liu Y, Newkome GR, Harmon JP. J Polym Sci, Part B:
Polym Phys 2001;39:1381–93.
[35] Borman CD, Jackson AT, Bunn A, Cutter AL, Irvine DJ. Polymer
2000;41:6015–20.
[36] Kaisersberger E, Post E. Thermochim Acta 1998;324:197–201.
[37] Groenewoud WM, Jong W. Thermochim Acta 1996;286:341–54.
[38] Statheropoulos M, Kyriakou S, Tzamtzis N. Thermochim Acta 1998;
322:167–73.
[39] Szelely G, Nebuloni M, Zerilli LF. Thermochim Acta 1992;196:
511–32.
[40] Leskela T, Lippmaa M, Niinisto L, Soininen P. Thermochim Acta
1993;214:9–18.
[41] Holdiness MR. Thermochim Acta 1984;75:361–99.
[42] Dollimore D, Gamlen GA, Taylor TJ. Thermochim Acta 1984;75:
59–69.
[43] Jaenicke-Robler K, Leitner G. Thermochim Acta 1997;295:133–45.
[44] Raemaekers KGH, Bart JC. Thermochim Acta 1997;295:1–58.
[45] Mittleman M. Thermochim Acta 1990;166:301–8.
[46] Maciejewski M, Bailer A. Thermochim Acta 1997;295:95–105.
[47] Jansen JAJ, Haas W. Anal Chim Acta 1987;196:69–74.
[48] Redfern JP. Polym Int 1991;26:51–8.
[49] Gedde UW. Polymer physics. London: Chapman & Hall; 1995.
[50] Roberts GE, White EFT. The physics of glassy polymers. London:
Applied Science Publishers; 1973. p. 153.
[51] Heijboer J. Molecular basis of transitions and relaxations. London:
Meier/Gordon and Breach; 1978. p. 75.
[52] Calves MC, Harmon JP, ACS Symposium Series, Washington, DC:
American Chemical Society; 2001.
[53] Harmon JP, Noren GK. Optical polymers: fibers and waveguides.
Washington, DC: American Chemical Society; 2001. chapter 6.
[54] Aihara T, Saito H, Inoue T, Wolff HP, Stuhn B. Polymer 1998;39(1):
129–34.
[55] Higgenbotham-Bertolucci PR, Gao H, Harmon JP. Polym Engng Sci
2001;41:873–80.
[56] McCrum NG, Read BE, Williams G. Anelastic and dielectric effects
in polymeric solids. New York: Dover Publications; 1967.
[57] TA Instruments. DEA 2970 Dielectric Analyzer Operator’s Manual
1991.
[58] XMASS data processing software, version 3.1. Bruker; May 1997.
[59] Guillet J. Polymer photophysics and photochemistry. Cambridge:
Cambridge University; 1985.
[60] The Merck Index. 12th ed. Whitehouse Station: Merck Research
Laboratories; 1996.
[61] Emran SK. Doctoral Dissertation. Viscoelastic properties of dendri-
mers, dendrimer blends, and dendrimer gels. Florida: 2000.
[62] Turi EA. Thermal characterization of polymeric materials. New York:
Academic Press; 1981.
[63] National Institute of Standards and Technology. Chemistry WebBook.
webbook.nist.gov/chemistry/2002.
[64] Dong L, Hill D, O’Donnell J, Carswell-Pomerantz T, Pomery P,
Whittaker A, Hatada K. Macromolecules 1995;28:3681–91.
[65] Subramanian K. Eur Polym J 2001;37:55–64.
[66] Pouchert CJ. The Aldrich library of NMR spectra. Milwaukee:
Aldrich Chemical Company, Inc.; 1983.
S.R. Tatro et al. / Polymer 44 (2003) 167–176176