7575 Golden Valley Road Suite 385 Golden Valley, MN 55427 612.338.0012 www.maxfieldresearch.com A Market Feasibility Study for Rental Housing, Commercial Retail and Permanent Supportive Housing in Downtown Pine City, Minnesota FINAL
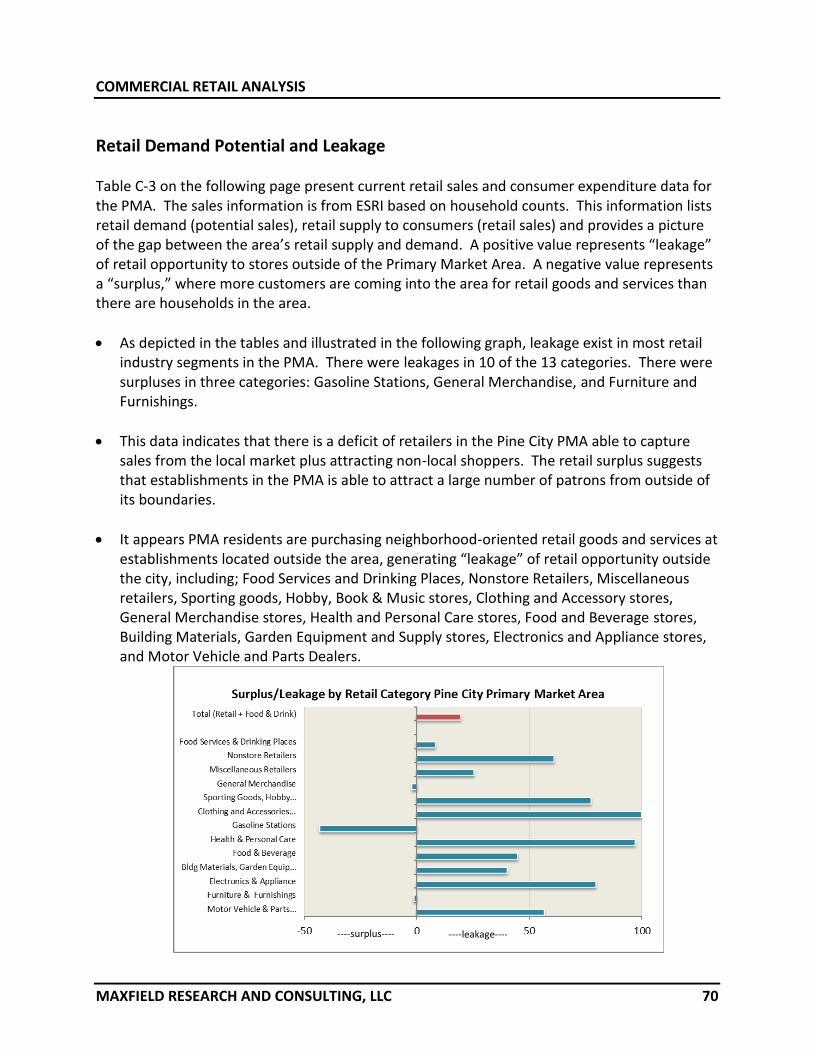
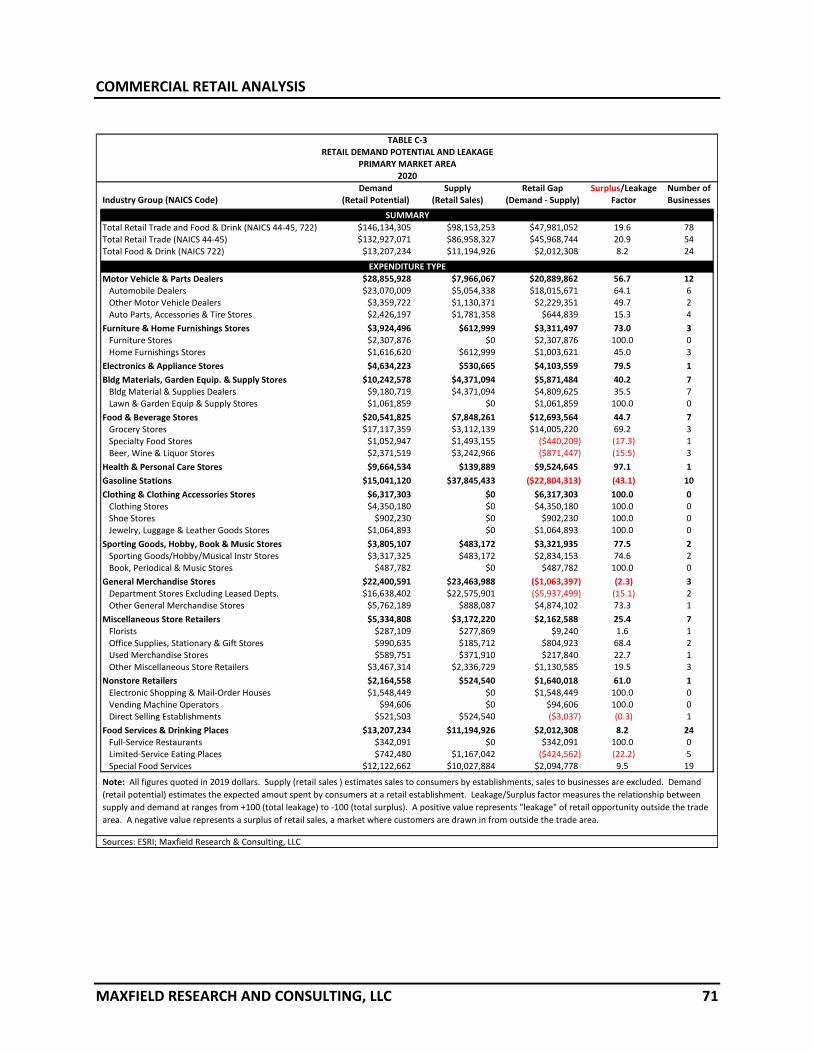
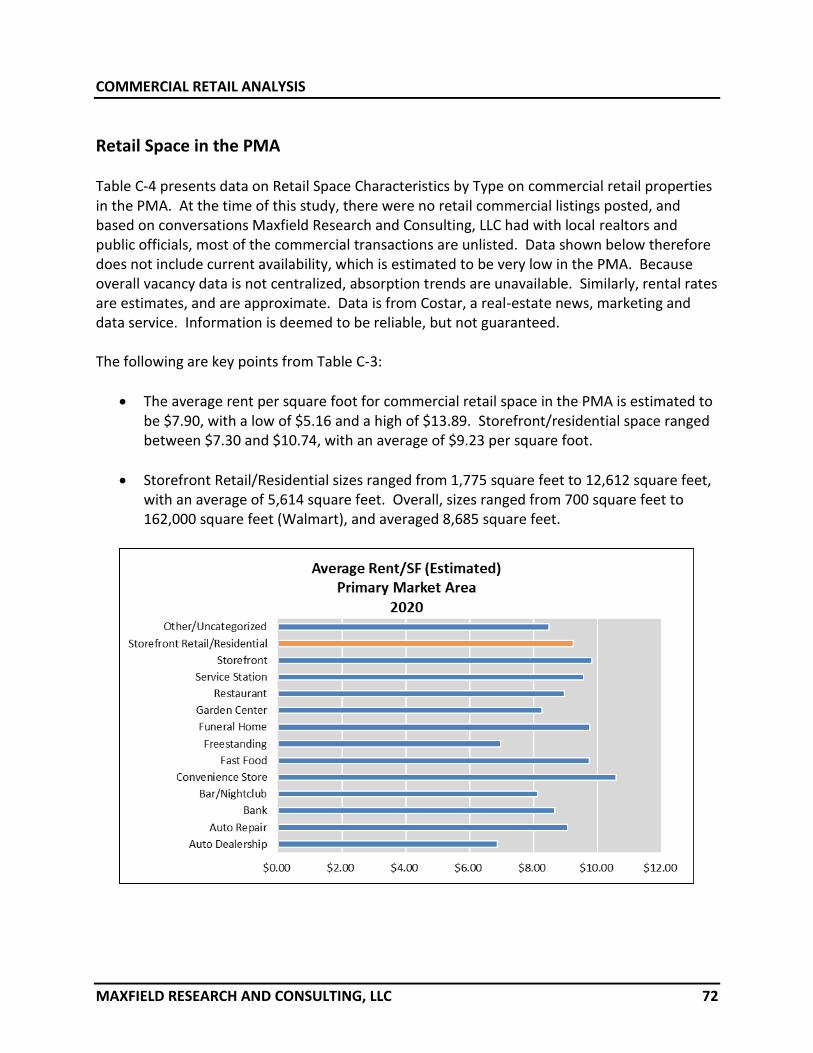
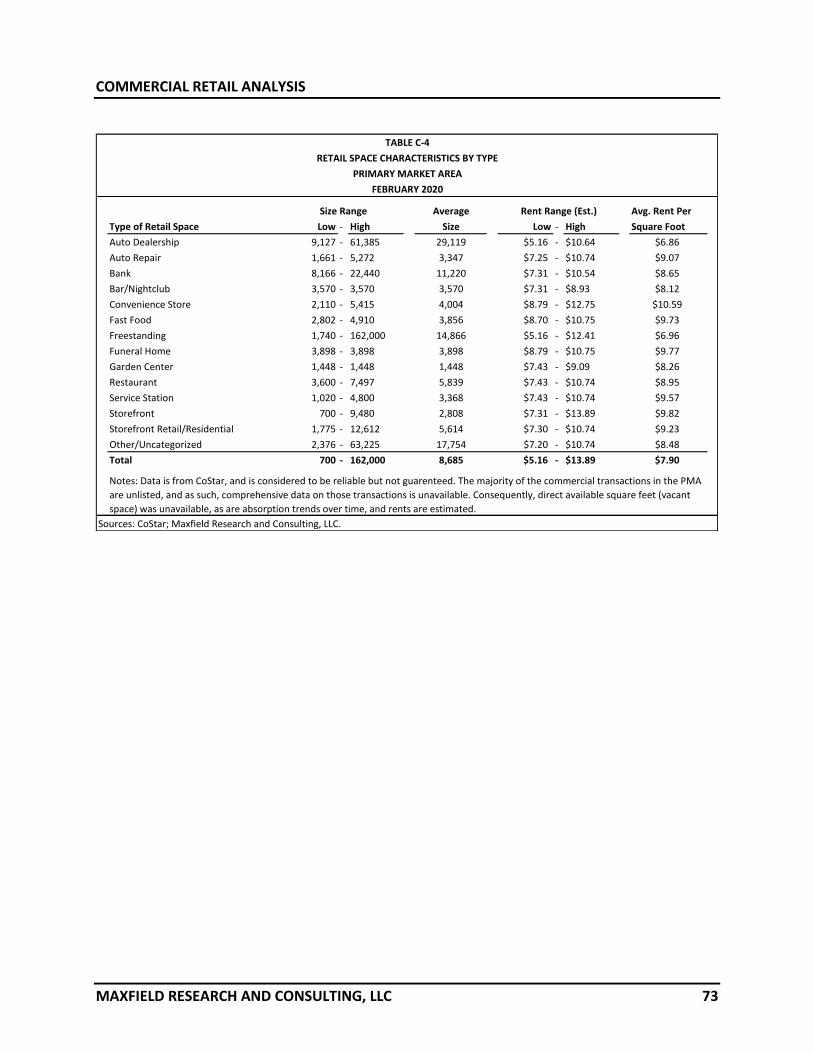
Transcript
7575 Golden Valley Road Suite 385 Golden Valley, MN 55427 612.338.0012 www.maxfieldresearch.com
A Market Feasibility Study for Rental Housing, Commercial Retail and
Permanent Supportive Housing in Downtown Pine City, Minnesota
FINAL
March 9, 2020 Ms. Leslie Sauter Community Development Director City of Pine City 315 Main St. S, Suite 100 Pine City, MN 55063
Dear Ms. Sauter: Attached is our study entitled “A Market Feasibility Study for Rental Housing, Commercial Retail and Permanent Supportive Housing in Downtown Pine City, Minnesota.” The study considers the potential demand for general occupancy rental housing development with a first-floor retail space and a supportive housing component to be located on a 0.68-acre parcel located at 320 3rd Street Southeast in Pine City, Minnesota. This study assesses demographic and economic characteristics of the primary draw area, analyzes the competitive market situation for market rate rental housing, and quantifies demand for market rate rental units that could be captured on the subject Site. Our findings reveal that there is demand for 20 units of market rate rental housing, 15 units of deep-subsidy housing, 13 units of permanent supportive housing and approximately 2,100 square feet of commercial retail space. We discuss a potential project’s ability to capture a share of the target market and project the rate of absorption for the subject development. Two development concept recommendations are also provided, including suggestions for an appropriate unit mix, pricing, features, and common area amenities. We enjoyed completing this study and are available should you have any further questions or require additional information. Sincerely, Maxfield Research and Consulting, LLC Matt Mullins Rob Wilder Vice President Research Associate Attachment
TABLE OF CONTENTS Page STUDY PURPOSE & SCOPE ............................................................................................ 1 EXECUTIVE SUMMARY .................................................................................................. 2 SITE ANALYSIS ........................................................................................................................ 5 DEMOGRAPHIC ANALYSIS ..................................................................................................... 13 Introduction ...................................................................................................................... 13 Market Area Definition ..................................................................................................... 13 Population and Household Growth Trends ...................................................................... 14 Age Distribution ................................................................................................................ 16 Household Income Distribution ........................................................................................ 18 Tenure by Age of Householder ......................................................................................... 20 Tenure by Household Size ................................................................................................. 21 Household Type ................................................................................................................ 23 Tenure by Household Income ........................................................................................... 25 Building Permit Trends ...................................................................................................... 27 Summary of Demographic Trends .................................................................................... 29 EMPLOYMENT ANALYSIS ...................................................................................................... 30 Introduction ...................................................................................................................... 30 Employment Projections ................................................................................................... 30 Resident Labor Force......................................................................................................... 31 Employment and Wages by Industry ................................................................................ 33 Commuting Patterns ......................................................................................................... 36 Resident Profile ................................................................................................................. 40 Major Employers ............................................................................................................... 41 Summary of Employment Trends ..................................................................................... 42 HOMELESS POPULATIONS ..................................................................................................... 43 Introduction ...................................................................................................................... 43 Demographic and Economic Statistics on Homeless Population...................................... 43 Number of Homeless in Central Minnesota ..................................................................... 43 Age Distribution of Homeless in Central Minnesota ........................................................ 44 Ethnic Background of the Homeless ................................................................................. 45 Monthly Income of the Homeless ..................................................................................... 46 Maximum Affordable Rents .............................................................................................. 47 Size of Bedroom Needed................................................................................................... 48 Comparison of 2015 and 2018 Figures ............................................................................. 49 Summary of Homeless Populations .................................................................................. 50
TABLE OF CONTENTS CONTINUED RENTAL MARKET ANALYSIS .................................................................................................. 51 Introduction ...................................................................................................................... 51 Overview of Rental Market Conditions ............................................................................. 51 General Occupancy Rental Projects .................................................................................. 55 Market Rate Projects ........................................................................................................ 55 Affordable/Subsidized ....................................................................................................... 58 HOUSING AFFORDABILITY ............................................................................................ 61 Introduction ...................................................................................................................... 61 Naturally-Occurring Affordable Housing........................................................................... 61 Rent and Income Limits ..................................................................................................... 62 COMMERCIAL REAL ESTATE ANALYSIS ................................................................................. 64 Introduction ...................................................................................................................... 64 Daytime Population........................................................................................................... 64 Consumer Expenditure Patterns ....................................................................................... 64 Types of Retail Goods and Customer Shopping Patterns ................................................. 68 Retail Demand Potential and Leakage .............................................................................. 70 Retail Space in the PMA .................................................................................................... 72 PLANNED AND PROPOSED RESIDENTIAL AND COMMERICIAL DEVELOPMENTS .............. 74 DEMAND CALCULATIONS .............................................................................................. 75 Rental Housing Demand Analysis...................................................................................... 75 Retail Development Potential ........................................................................................... 78 Permanent Supportive Housing Demand Potential .......................................................... 80 CONCLUSIONS AND RECOMMENDATIONS .................................................................... 82 Recommended Development Concept ............................................................................. 82 Suggested Features and Amenities ................................................................................... 85 Projected Absorption ........................................................................................................ 86
LIST OF TABLES
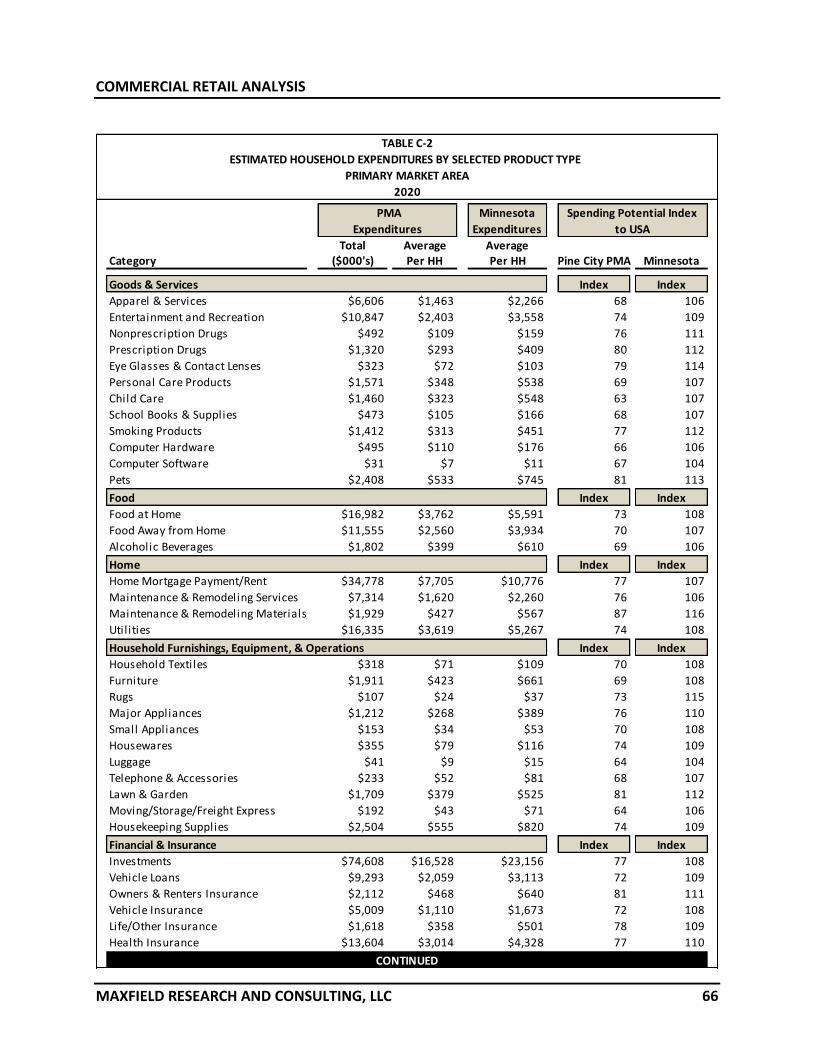
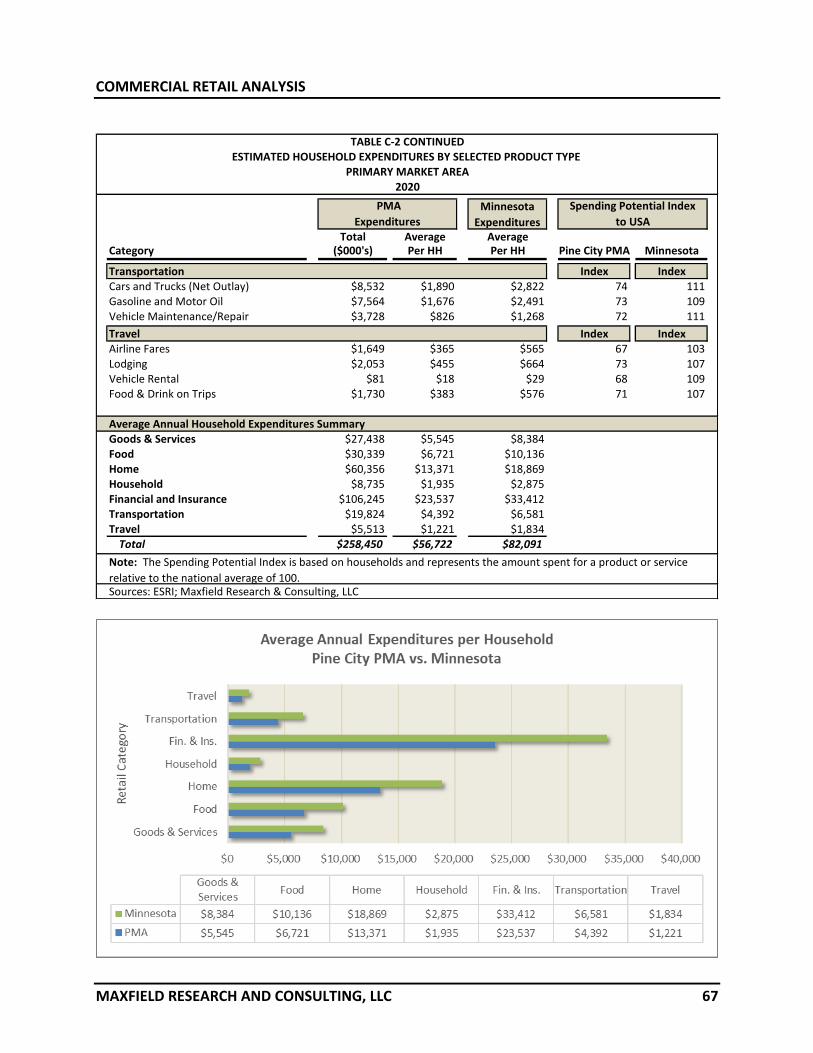
Table Number and Title Page D1. Population and Household Growth Trends and Projections, PMA, 2000-2030 .............. 14 D2. Population Age Distribution, Primary Market Area, 2000-2025 ..................................... 17 D-3. Household Income by Age of Householder, Primary Market Area, 2020 & 2025 ......... 25 D4. Tenure by Age of Householder, Primary Market Area, 2010 & 2017 ............................. 21 D5. Households by Size, Primary Market Area, 2017 ............................................................ 22 D6. Household Type, Primary Market Area, 2010 & 2017 .................................................... 24 D7. Tenure by Household Income, Primary Market Area, 2017 ........................................... 26 D8. Building Permit Trends, Pine City, 2009 to 2019 ............................................................. 27 E1. Employment Projections, Central Minnesota Planning Area, 2016 to 2026 ................... 30 E2. Annual Average Resident Employment, Pine County, EDR-7E, 2000 to Nov. 2019 ........ 32 E3. Quarterly Census of Employment and Wages, Pine City and Pine County, 2018 Q3 to 2019Q3 .......................................................................................................... 35 E4. Commuting Patterns, City of Pine City, 2017 ................................................................... 37 E5. Commuting Inflow/Outflow Characteristics, City of Pine City, 2017 ............................... 38 E6. Resident Profile, Pine City, 2017 ...................................................................................... 40 E7. Major Employers, Pine City, 2017 .................................................................................... 41 H1. Number of Homeless People, Central Minnesota, October 2018 .................................. 43 H2. Age Distribution of Homeless People, Central Minnesota, October 2018 ..................... 44 H3. Ethnic Background of Homeless People, Central Minnesota, October 2018 ................. 45 H4. Monthly Income Homeless People, Central Minnesota, October 2018 ......................... 46 H5. Maximum Affordable Rents for Homeless People, Central Minnesota, October 2018 .. 47 H6. Size of Bedroom Needed, Central Minnesota, October 2018 ......................................... 48 R1. Bedrooms by Gross Rent, Pine City, Pine County and PMA, 2017 .................................. 52 R2. General Occupancy Rental Projects, PMA, February 2020 ............................................. 57 R3. Summary of Market Rate Rental Projects, PMA, February 2020 .................................... 58 R4. MFHA/HUD Income and Rent Limits, Pine County, 2019 ................................................ 63 C1. Daytime Population, Pine City, 2012-2017 ...................................................................... 64 C2. Estimated Household Expenditures by Selected Product Type, Primary Market Area, 2020 66 C4. Retail Demand Potential and Leakage, Primary Market Area, 2020 ............................... 71 C5. Retail Space Characteristics, PMA, February 2020 .......................................................... 73 P1. Proposed, Planned,Under Construction Commercial and Housing Projects, Pine City, 2020 74
LIST OF TABLES CONTINUED
Table Number and Title Page
DMD1. Demand for Additional Rental Housing, PMA, 2020 to 2025 .................................... 76 DMD2. Demand for Retail Space, PMA, 2020 to 2025 .......................................................... 79 DMD3. Estimated Demand for Permanent Supportive Housing, PMA, 2020 to 2025 .......... 81 CR1. Demand Summary, PMA, March 2020 .......................................................................... 82 CR2. Recommended Pricing, Unit Mix and Sizes, Pine City, March 2020 .............................. 84
STUDY PURPOSE AND SCOPE
MAXFIELD RESEARCH AND CONSULTING, LLC 1
Study Purpose
Maxfield Research and Consulting, LLC was engaged by the City of Pine City to assess the market potential of various real estate uses at a subject Site in Pine City, including demographic and economic trends, trends on various real estate product types, and recommended concepts. This study is intended to provide guidance on the future demand for real estate products on the site, provide specific recommendations on pricing, absorption, demand calculations, for a potential mixed-use project at the subject Site.
Scope of Services
The scope of this study includes an evaluation of the subject property. The scope of this study provides a review of the economic and demographic characteristics of the Primary Market Area (abbreviated as PMA) that would factor into the type of development that could be supported on the subject property. In addition, various real estate market segments in were analyzed including multifamily residential, retail, and permanent supportive housing. We identified planned/pending and developments under construction in Primary Market Area that are in the development pipeline. The report contains primary and secondary research. Primary research includes interviews with property managers/owners, Realtors, builders, and city staffs. All of the information on competitive real estate developments and pending developments was collected by Maxfield Research and Consulting, LLC and is accurate to the best of our knowledge. This study also utilizes secondary data. Secondary research is always used as a basis for analysis and is carefully reviewed in light of other factors that may impact projections. The analysis will assess the market potential to develop these product types in the Primary Market Area and, more specifically, on the subject site.
EXECUTIVE SUMMARY
MAXFIELD RESEARCH AND CONSULTING, LLC 2
Demographic Analysis
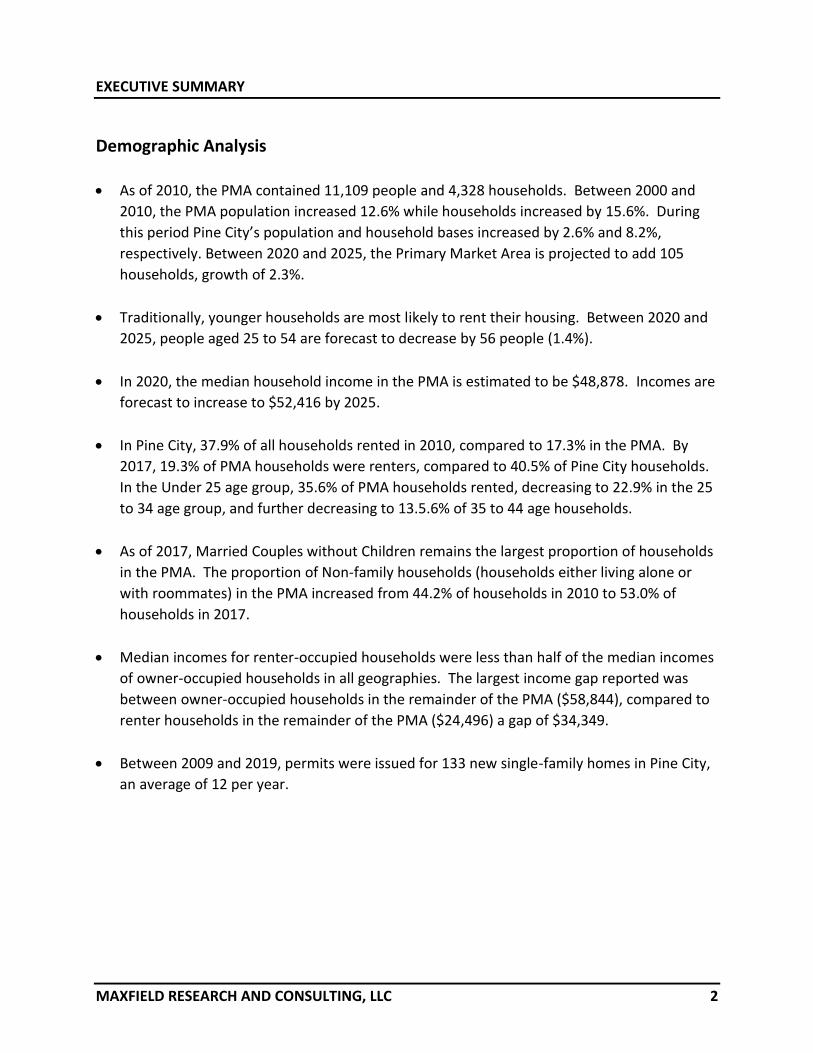
• As of 2010, the PMA contained 11,109 people and 4,328 households. Between 2000 and
2010, the PMA population increased 12.6% while households increased by 15.6%. During
this period Pine City’s population and household bases increased by 2.6% and 8.2%,
respectively. Between 2020 and 2025, the Primary Market Area is projected to add 105
households, growth of 2.3%.
• Traditionally, younger households are most likely to rent their housing. Between 2020 and
2025, people aged 25 to 54 are forecast to decrease by 56 people (1.4%).
• In 2020, the median household income in the PMA is estimated to be $48,878. Incomes are
forecast to increase to $52,416 by 2025.
• In Pine City, 37.9% of all households rented in 2010, compared to 17.3% in the PMA. By
2017, 19.3% of PMA households were renters, compared to 40.5% of Pine City households.
In the Under 25 age group, 35.6% of PMA households rented, decreasing to 22.9% in the 25
to 34 age group, and further decreasing to 13.5.6% of 35 to 44 age households.
• As of 2017, Married Couples without Children remains the largest proportion of households
in the PMA. The proportion of Non-family households (households either living alone or
with roommates) in the PMA increased from 44.2% of households in 2010 to 53.0% of
households in 2017.
• Median incomes for renter-occupied households were less than half of the median incomes
of owner-occupied households in all geographies. The largest income gap reported was
between owner-occupied households in the remainder of the PMA ($58,844), compared to
renter households in the remainder of the PMA ($24,496) a gap of $34,349.
• Between 2009 and 2019, permits were issued for 133 new single-family homes in Pine City,
an average of 12 per year.
EXECUTIVE SUMMARY
MAXFIELD RESEARCH AND CONSULTING, LLC 3
Summary of Employment Trends
• As of November 2019, the unemployment rate in Pine County was 4.8%, above Economic
Development Region 7 East (abbreviated EDR-7E) unemployment rate of 4.8% and above
the State of Minnesota (2.9%).
• The Education and Health Services sector is the largest employment sector in Pine City,
accounting for 26.4% of jobs with an average weekly wage of $790.
• Across Pine County, average weekly wages increased by 8.4%, $50 per week, between 2018
Q3 and 2019 Q3. Wages increased in nine of the ten Industry groups. Wages in the
Professional and Business services sector fell 8.6% ($62/week).
• Most Pine City workers travel less than 10 miles to their jobs (55.0%). An estimated 25.8%
travel between 10 and 24 miles to their job, while 8.7% travel between 25 and 50 miles and
10.5% travel 50 miles or more.
• Most Pine City workers commute into Pine City, with 1,929 employees commuting into the
City and 513 workers living and working in the City, compared to 1,034 workers leaving the
City.
• The largest employers in Pine City are Walmart, Pine City School District, and Pine Technical
and Community College.
Rental Housing Summary
• Overall, five market rate properties with a combined 76 units were surveyed. Overall, these
units were 100% occupied. This is below the equilibrium vacancy rate of 5.0% for market
rate units and suggests that there is pent-up demand for market rate rental units.
• One-bedroom units rented for an average of $638 per month, two-bedrooms were $794
per month and three-bedroom units were $945 per month. Across all unit types, rents
were 768 on average.
EXECUTIVE SUMMARY
MAXFIELD RESEARCH AND CONSULTING, LLC 4
Demand Summary
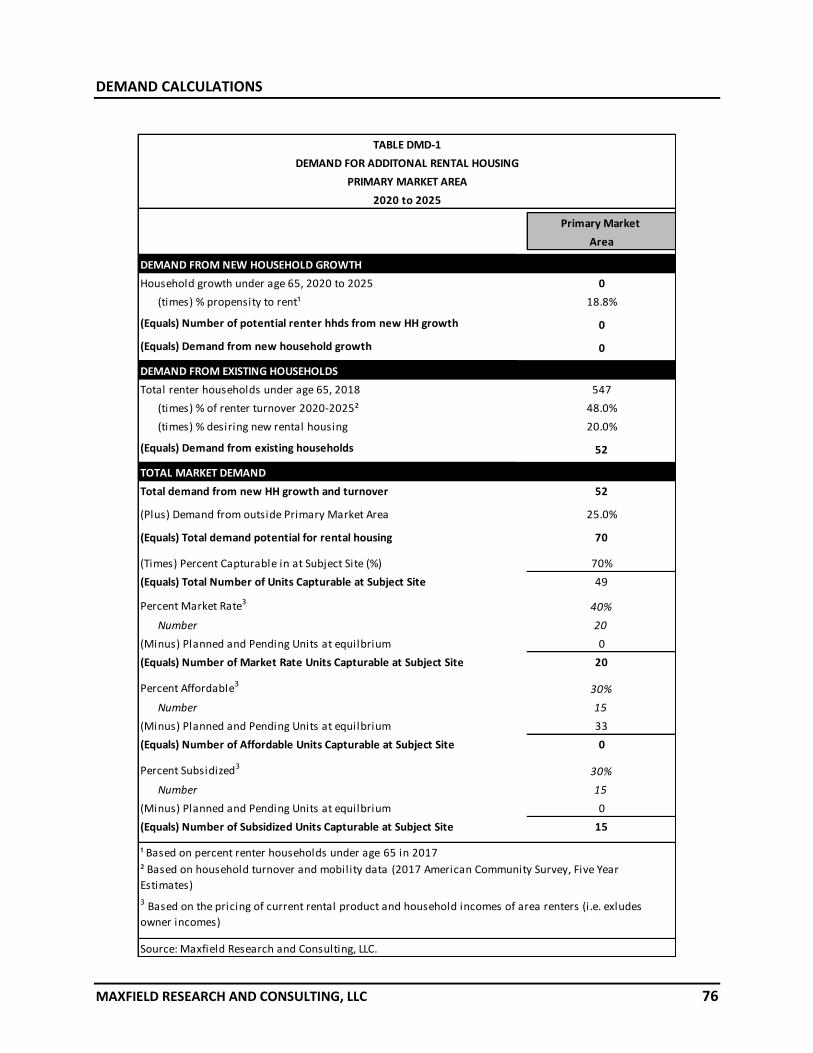
• Demand was found at the subject site for 20 units of market rate rental units, 15 units of subsidized rental units (deep subsidy) and 13 units of Permanent Supportive Housing, for a total of 48 new housing units.
• Demand for commercial retail space was found for 2,138 square feet at the subject site.
Recommended Development Concept
• Based on the sites current size and the currently attainable rent structure, it would be difficult to develop a vertical multifamily development without significant tax incentives or subsidies. Therefore, we recommend a 10-unit market rate tuck-under townhome development on the subject site.
• The recommended rents would start at $1,050 for a two-bedroom unit, and $1,250 for a three-bedroom unit.
• If the parcel currently used by “A Place for You” transitional housing could be acquired, we recommend a development concept that includes 20-market rate apartments, as well as relocating the 10 beds currently at “A Place for You” into a separate wing of the development with a separate access.
• Although there is demand for retail space, the financial challenges of a first-floor retail component in a mixed-use development are difficult given the lease rate needed to cover development costs, and as such we do not recommend a retail component in either concept.
SITE ANALYSIS
MAXFIELD RESEARCH AND CONSULTING, LLC 5
Introduction This section of the report assesses the attributes of the subject Site as they relate to the appeal of the property as a location for general occupancy rental housing (market rate and affordable), supportive housing and commercial retail space. These attributes include community orientation and aesthetics, adjacent and surrounding land use, proximity to area resources, access and visibility. These factors individually and collectively impact the attractiveness of a site for the above-mentioned uses. Maxfield Research and Consulting, LLC visited the Site in February 2020 and assessed the location based on these factors.
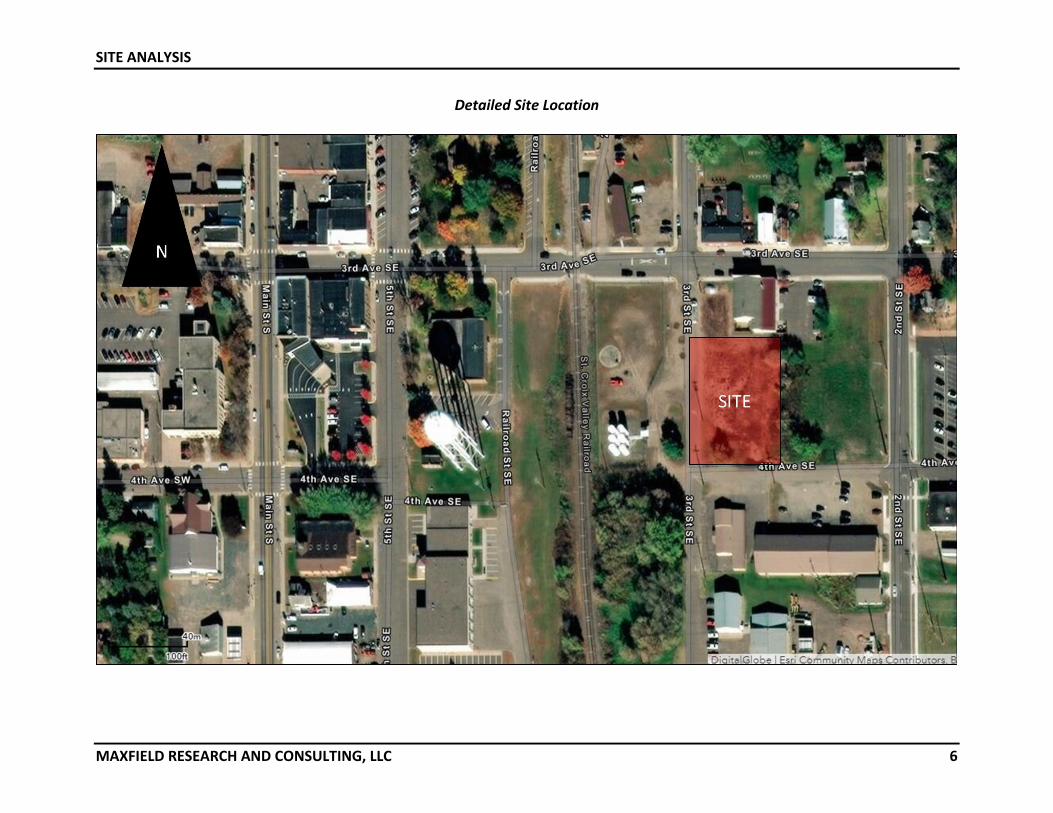
Site Location and Characteristics This section of the report assesses the characteristics of the subject Site as they relate to the appeal for the proposed Pine City Feed Mill Site development in Pine City, Minnesota. The site is the location of the former feed mill, which was razed in 2018. Pine City is in Pine County located about 70 miles north of the Twin Cities. As of 2010, Pine City had a population of about 3,100 people. More specifically, the subject Site is at 320 3rd Avenue SE in Pine City, about three blocks to the east of Main Street, the main thoroughfare in Pine City, and south of the Snake River which bisects Pine City. Maps and photos are located on the following pages.
Site Location
SITE ANALYSIS
MAXFIELD RESEARCH AND CONSULTING, LLC 6
Detailed Site Location
SITE ANALYSIS
MAXFIELD RESEARCH AND CONSULTING, LLC 7
Site Photos
Looking east at Site Looking north at Site
Vacant Land east of site Looking west toward site
4th Ave SE, southside of Site 3rd Ave SE, northside of Site
SITE ANALYSIS
MAXFIELD RESEARCH AND CONSULTING, LLC 8
Adjacent and Surrounding Land Uses
The subject Site is at 320 3rd Street SE in Pine City, Minnesota. The immediate neighborhood is a mix of residential uses to the east and north, light industrial to the south, and commercial uses to the west. The Site is located on the eastside of 3rd Street SE, which runs north/south in Pine City south of the Snake River.
• North of the Site: A Place for You (transitional housing), Village Bar and Grill, single-family neighborhood
• East of the Site: Single-family neighborhood, Cross Lake.
• West of the Site: Public utilities, St. Croix Valley Railroad, Downtown Pine City.
• South of the Site: Light industrial uses, Lakeside Medical Center, Single-family neighborhood.
Access and Visibility Primary access to the Site is via 3rd Ave SE, which intersects with Main Street S. Mains St S intersects Hillside Ave SW, which has access to Interstate 35W to the west of town. Interstate 35 W connects Pine City to the Twin Cities to the south and Duluth to the north. The Site is not located along the main thoroughfare in Pine City and is not directly visible from Main Street SE, which will serve to enhance the privacy of residents, and is two-blocks away from 5th St SE and Robinson Park, from which it is clearly visible. The general location of the site is somewhat secluded, as access to the southeast portion of Pine City is only approachable via Main Street S from the north, west and south. From the east, access is via St. Croix Road SE, which approaches from around the south side of Cross Lake.
SITE ANALYSIS
MAXFIELD RESEARCH AND CONSULTING, LLC 9
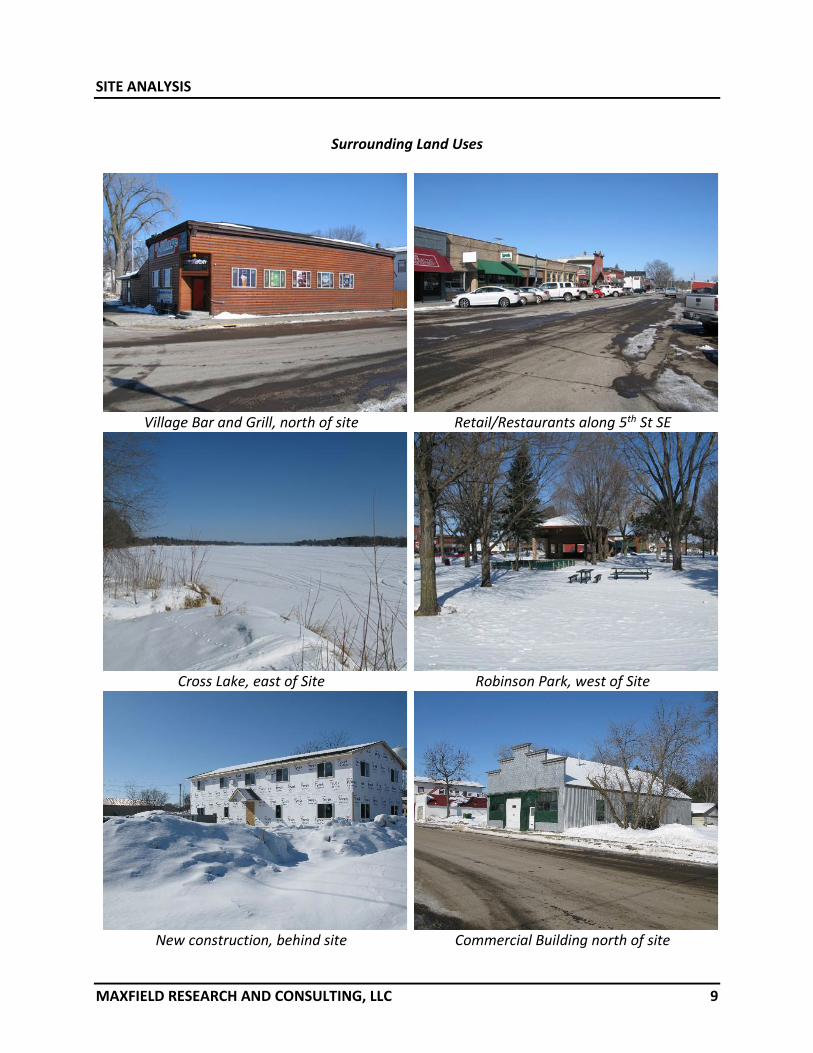
Surrounding Land Uses
Village Bar and Grill, north of site Retail/Restaurants along 5th St SE
Cross Lake, east of Site Robinson Park, west of Site
New construction, behind site Commercial Building north of site
SITE ANALYSIS
MAXFIELD RESEARCH AND CONSULTING, LLC 10
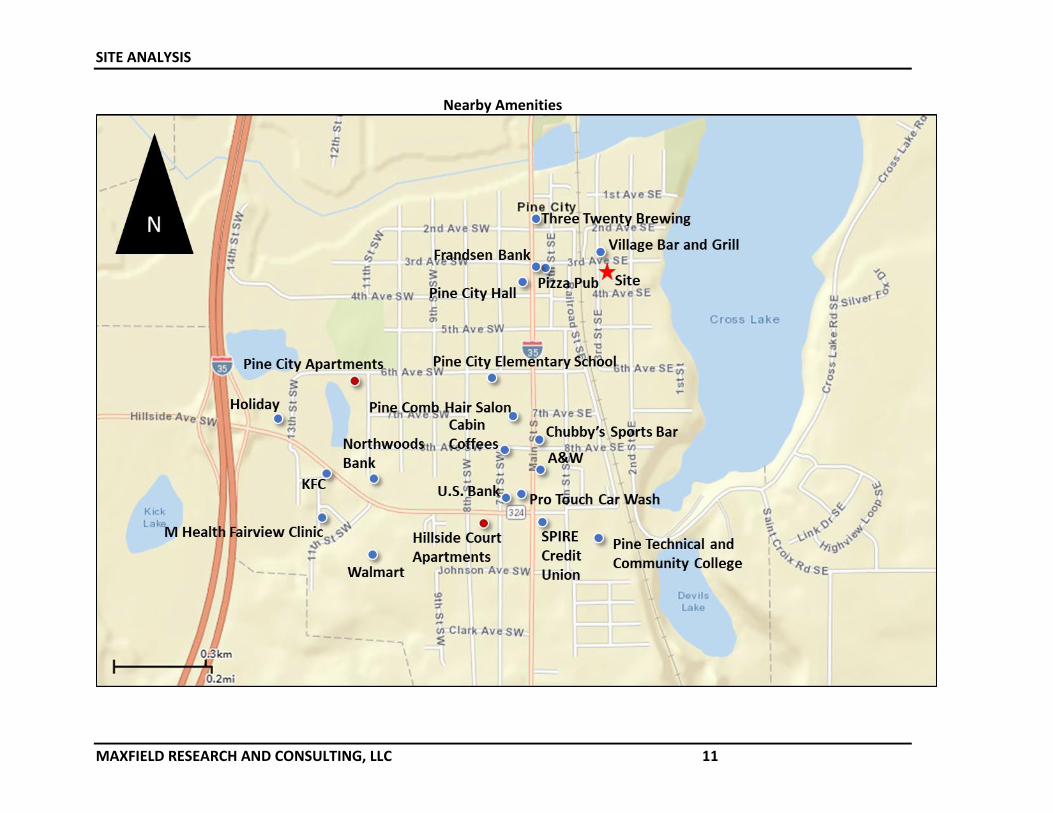
Proximity to Shopping, Services, and Health Care The ease of access to retail, healthcare, and community services is important to residents and retail tenants and enhances the marketability of a mixed-use development. The proposed development would have access to a large number of goods and services in Pine City, and some shopping and restaurants are within walking distance from the site. Many retail stores exist within a convenient driving distance of the proposed Site and would offer residents an array of goods and services. The nearest grocery store is Walmart, about five-minutes from the site. The Village Bar and Grill is directly across 3rd Ave SE from the Site. The nearest medical clinic is Fairview Clinic, Pine City, about five minutes from the Site. Other nearby notable nearby services Pine City Public Library, Frandsen Bank and Trust, Pizza Pub, New Horizons Thrift Store, Three Twenty Brewing Co., and Robinson Park, all within walking distance of the site. Additionally, directly north of the site is A Place for You, a transitional housing shelter for singles with 10 beds. Nearby shopping centers are Walmart, about a five-minute drive from the site, numerous stores along Main Street SE. There are also several churches of all denominations near the Site.
SITE ANALYSIS
MAXFIELD RESEARCH AND CONSULTING, LLC 11
Nearby Amenities
SITE ANALYSIS
MAXFIELD RESEARCH AND CONSULTING, LLC 12
Appropriateness of Site for Housing and Retail The Site is appropriate for rental housing for several reasons:
• The Site is located on a less developed area with low traffic on the southeast side Pine City is close enough to nearby amenities to be convenient but is secluded from the busy traffic and activity that occurs along Main Street S.
• The Site has high visibility from 3rd Avenue SE and Robinson Park, which will increase the marketability of the rental housing units. The Site’s walkable location and close proximity to many services will be especially attractive to residents.
• The Site is within a reasonable driving distance to retail, healthcare, and community services.
The Site is appropriate for first floor retail for several reasons:
• The site has good visibility from 3rd Street SE and 3rd Avenue SE, although it is more neighborhood oriented.
• The site is walkable from other shopping at 5th Street SE.
• The site could be home to a number of different retail tenants, from apparel store, or pharmacy.
In summary, the Site is appropriate for the development of rental housing and commercial retail space and should be well-received by people desiring rental housing in the surrounding area. The Site’s local visibility and will make it very attractive to renters seeking a convenient lifestyle in Pine City. Strengths Weaknesses
• Low-traffic, semi-secluded • Medium Visibility from Main St S
• Walkable from shopping at 5th St SE • Somewhat Limited Access
• Large number of nearby amenities
DEMOGRAPHIC ANALYSIS
MAXFIELD RESEARCH AND CONSULTING, LLC 13
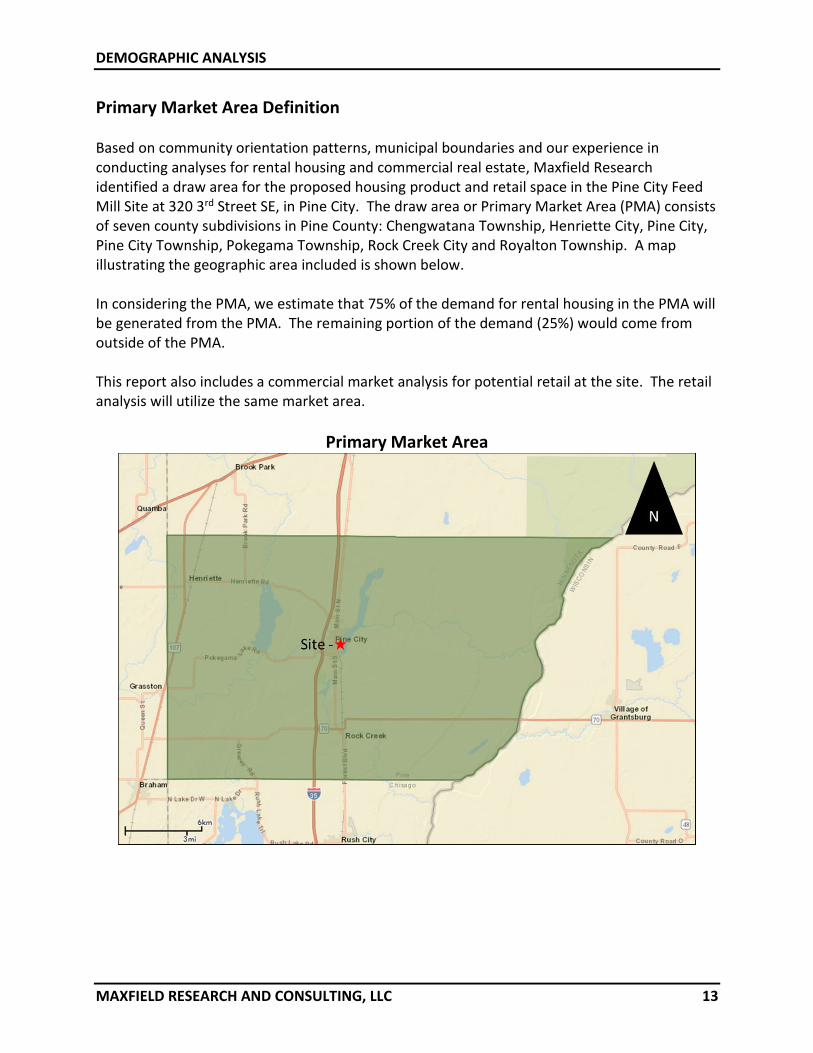
Primary Market Area Definition Based on community orientation patterns, municipal boundaries and our experience in conducting analyses for rental housing and commercial real estate, Maxfield Research identified a draw area for the proposed housing product and retail space in the Pine City Feed Mill Site at 320 3rd Street SE, in Pine City. The draw area or Primary Market Area (PMA) consists of seven county subdivisions in Pine County: Chengwatana Township, Henriette City, Pine City, Pine City Township, Pokegama Township, Rock Creek City and Royalton Township. A map illustrating the geographic area included is shown below. In considering the PMA, we estimate that 75% of the demand for rental housing in the PMA will be generated from the PMA. The remaining portion of the demand (25%) would come from outside of the PMA. This report also includes a commercial market analysis for potential retail at the site. The retail analysis will utilize the same market area.
Primary Market Area
DEMOGRAPHIC ANALYSIS
MAXFIELD RESEARCH AND CONSULTING, LLC 14
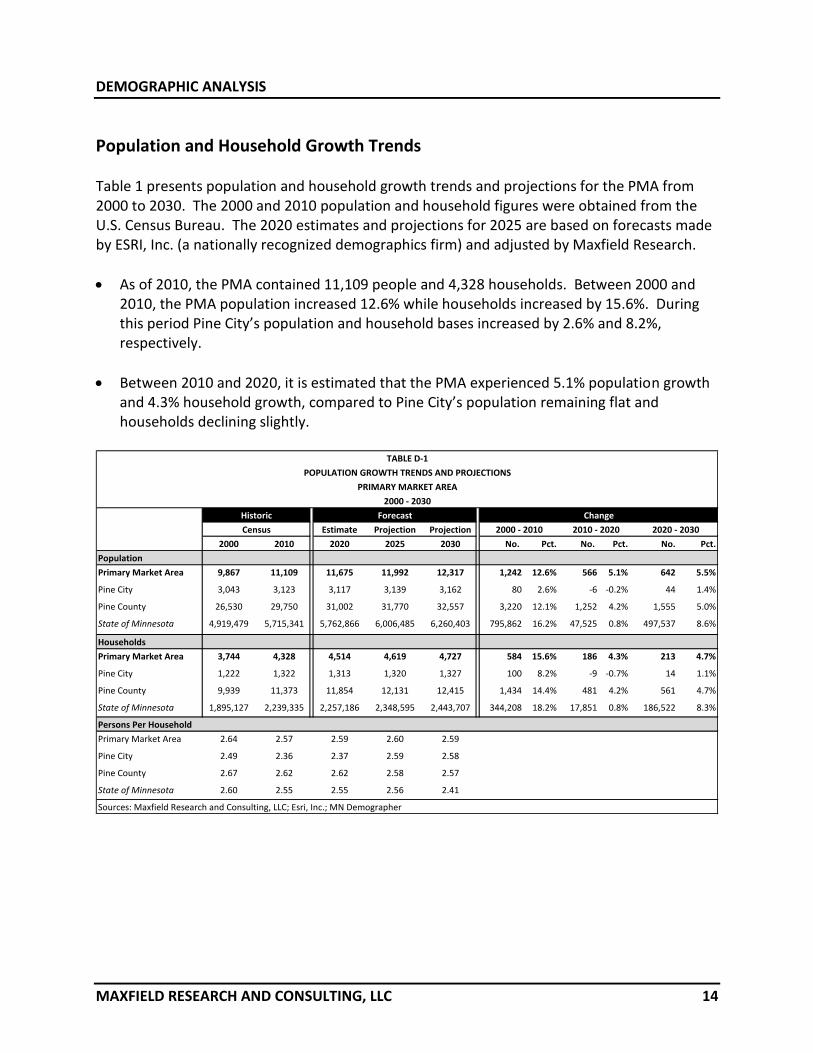
Population and Household Growth Trends Table 1 presents population and household growth trends and projections for the PMA from 2000 to 2030. The 2000 and 2010 population and household figures were obtained from the U.S. Census Bureau. The 2020 estimates and projections for 2025 are based on forecasts made by ESRI, Inc. (a nationally recognized demographics firm) and adjusted by Maxfield Research.
• As of 2010, the PMA contained 11,109 people and 4,328 households. Between 2000 and 2010, the PMA population increased 12.6% while households increased by 15.6%. During this period Pine City’s population and household bases increased by 2.6% and 8.2%, respectively.
• Between 2010 and 2020, it is estimated that the PMA experienced 5.1% population growth and 4.3% household growth, compared to Pine City’s population remaining flat and households declining slightly.
Pine City 1,222 1,322 1,313 1,320 1,327 100 8.2% -9 -0.7% 14 1.1%
Pine County 9,939 11,373 11,854 12,131 12,415 1,434 14.4% 481 4.2% 561 4.7%
State of Minnesota 1,895,127 2,239,335 2,257,186 2,348,595 2,443,707 344,208 18.2% 17,851 0.8% 186,522 8.3%
Persons Per Household
Primary Market Area 2.64 2.57 2.59 2.60 2.59
Pine City 2.49 2.36 2.37 2.59 2.58
Pine County 2.67 2.62 2.62 2.58 2.57
State of Minnesota 2.60 2.55 2.55 2.56 2.41
Sources: Maxfield Research and Consulting, LLC; Esri, Inc.; MN Demographer
Census 2000 - 2010 2020 - 2030
Forecast
TABLE D-1
POPULATION GROWTH TRENDS AND PROJECTIONS
PRIMARY MARKET AREA
2000 - 2030
Historic Change
2010 - 2020
DEMOGRAPHIC ANALYSIS
MAXFIELD RESEARCH AND CONSULTING, LLC 15
• Since households represent occupied housing units, household growth trends are a better indicator of housing demand than population growth trends. Between 2020 and 2030, the Primary Market Area is projected to add 213 households, growth of 4.7%.
• The average household size in the Market Area decreased from 2.64 people per household in 2000 to 2.57 people per household in 2010. The household size in the PMA is anticipated to remain flat between 2010 and 2025, rising slightly from 2.57 to 2.60 by 2025 and 2.59 in 2030.
DEMOGRAPHIC ANALYSIS
MAXFIELD RESEARCH AND CONSULTING, LLC 16
Age Distribution
The age distribution of a community’s population helps to assess the type of housing needed. For example, younger and older people are more attracted to higher density housing located near urban services and entertainment while middle-aged people (particularly those with children) traditionally prefer lower-density single-family homes. Table D-2 presents the age distribution of the PMA population from 2000 to 2025. Information from 2000 and 2010 is sourced from the U.S. Census. The 2020 estimates and projections for 2025 were calculated by ESRI, a reputable national demographics firm and adjusted by Maxfield Research. The following are key trends about the age distribution of the PMA’s population.
• In 2010, the largest adult age group in Pine City was 25 to 34, totaling 450 people (14.4% of the City’s population). As of 2020, it is estimated that the 25 to 34 age cohort remains the largest age cohort, representing 14.0% of the total population. In the PMA in 2010, the largest adult age group was age 45 to 54 (16.6% of the total population). By 2020, the largest adult age group is the 55 to 64 age group, with 15.9% of the total population.
• Traditionally, younger households are most likely to rent their housing. Between 2020 and 2025, people aged 18 to 34 are forecast to decrease by 111 people (5.1%). As a portion of baby boomers consider alternative housing products to their single-family homes, some will seek out maintenance-free housing and may select general-occupancy rental housing. People age 55 to 74 are also forecast to experience growth during this period, increasing by 237 people (7.4%).
DEMOGRAPHIC ANALYSIS
MAXFIELD RESEARCH AND CONSULTING, LLC 17
2000 2010 2020 2025 No. Pct. No. Pct.
Under 18 2,585 2,578 2,355 2,378 -7 -0.3% 24 1.0%18 to 24 771 767 803 761 -4 -0.5% -42 -5.2%25 to 34 1,083 1,269 1,361 1,291 186 17.2% -70 -5.1%35 to 44 1,621 1,381 1,365 1,453 -240 -14.8% 88 6.5%45 to 54 1,259 1,843 1,527 1,453 584 46.4% -74 -4.8%55 to 64 1,004 1,385 1,858 1,793 381 37.9% -65 -3.5%65 to 74 860 1,024 1,358 1,659 164 19.1% 302 22.2%75 plus 684 862 1,049 1,202 178 26.0% 154 14.7%
Total 9,867 11,109 11,675 11,992 1,242 12.6% 317 2.7%
Under 18 771 679 615 615 -92 -11.9% 0 0.0%18 to 24 319 272 242 236 -47 -14.7% -6 -2.5%25 to 34 352 450 435 403 98 27.8% -32 -7.4%35 to 44 410 342 345 373 -68 -16.6% 28 8.1%45 to 54 311 419 375 361 108 34.7% -14 -3.7%55 to 64 233 297 361 348 64 27.5% -13 -3.6%65 to 74 244 282 357 390 38 15.6% 33 9.2%75 plus 403 382 379 408 -21 -5.2% 29 7.7%0
Total 3,043 3,123 3,117 3,139 80 2.6% 22 0.7%
Under 18 6,752 6,599 6,121 6,176 -153 -2.3% 55 0.9%18 to 24 2,054 2,100 2,124 2,008 46 2.2% -116 -5.5%25 to 34 3,024 3,763 3,865 3,668 739 24.4% -197 -5.1%35 to 44 4,378 3,778 3,785 3,975 -600 -13.7% 190 5.0%45 to 54 3,500 4,868 4,006 3,839 1,368 39.1% -167 -4.2%55 to 64 2,835 3,786 4,784 4,678 951 33.5% -106 -2.2%65 to 74 2,221 2,800 3,643 4,310 579 26.1% 667 18.3%75 plus 1,766 2,056 2,523 2,961 290 16.4% 438 17.4%0
Total 26,530 29,750 31,002 31,770 3,220 12.1% 768 2.5%
Sources: U.S. Census; ESRI; Metropolitan Council; Maxfield Research & Consulting, LLC
TABLE D-2POPULATION AGE DISTRIBUTION
PRIMARY MARKET AREA2000-2025
U.S. Census ESRI Change 2000-2010 Change 2020-2025
Primary Market Area
Pine City
Pine County
DEMOGRAPHIC ANALYSIS
MAXFIELD RESEARCH AND CONSULTING, LLC 18
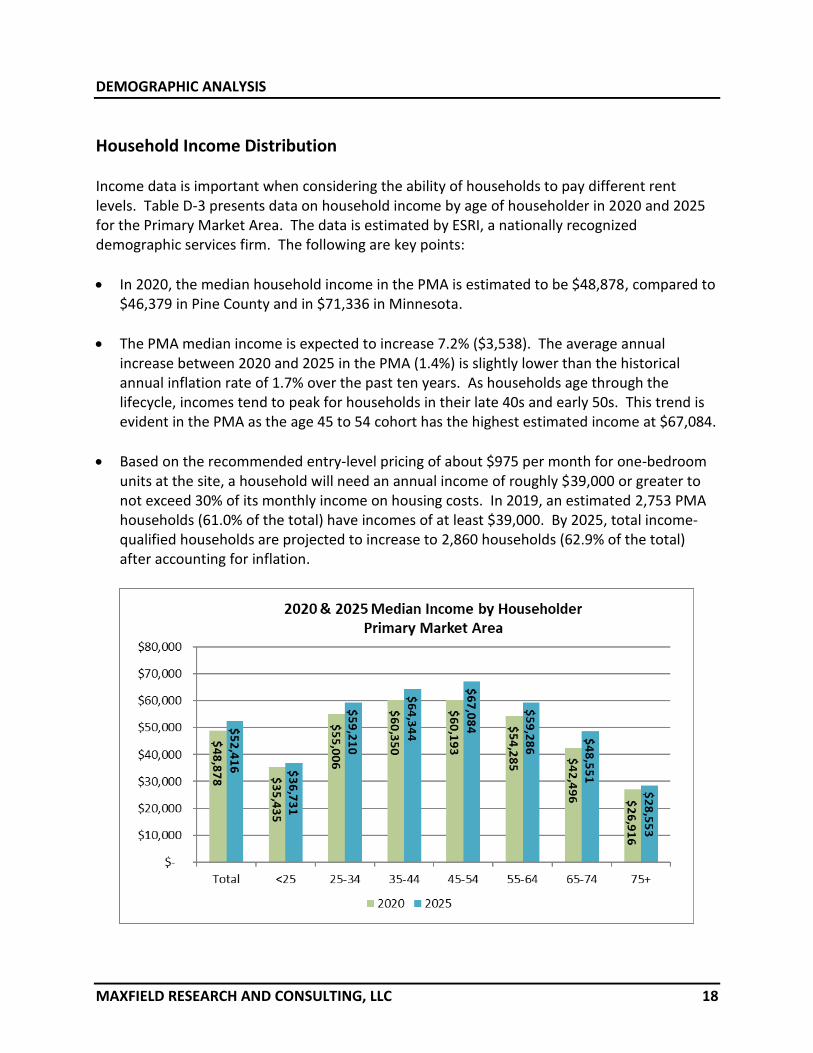
Household Income Distribution Income data is important when considering the ability of households to pay different rent levels. Table D-3 presents data on household income by age of householder in 2020 and 2025 for the Primary Market Area. The data is estimated by ESRI, a nationally recognized demographic services firm. The following are key points:
• In 2020, the median household income in the PMA is estimated to be $48,878, compared to $46,379 in Pine County and in $71,336 in Minnesota.
• The PMA median income is expected to increase 7.2% ($3,538). The average annual increase between 2020 and 2025 in the PMA (1.4%) is slightly lower than the historical annual inflation rate of 1.7% over the past ten years. As households age through the lifecycle, incomes tend to peak for households in their late 40s and early 50s. This trend is evident in the PMA as the age 45 to 54 cohort has the highest estimated income at $67,084.
• Based on the recommended entry-level pricing of about $975 per month for one-bedroom units at the site, a household will need an annual income of roughly $39,000 or greater to not exceed 30% of its monthly income on housing costs. In 2019, an estimated 2,753 PMA households (61.0% of the total) have incomes of at least $39,000. By 2025, total income-qualified households are projected to increase to 2,860 households (62.9% of the total) after accounting for inflation.
DEMOGRAPHIC ANALYSIS
MAXFIELD RESEARCH AND CONSULTING, LLC 19
Total <25 25-34 35-44 45-54 55-64 65 -74 75+
Less than $15,000 534 15 44 51 75 125 89 134$15,000 to $24,999 535 16 37 45 51 95 112 178$25,000 to $34,999 498 16 50 49 60 71 108 143$35,000 to $49,999 733 22 94 102 113 151 139 113
$50,000 to $74,999 878 15 125 154 167 217 150 51$75,000 to $99,999 626 9 79 109 146 161 84 38$100,000 or more 711 3 93 146 158 171 99 41Total 4,514 96 524 655 770 991 780 698
Median Income $48,878 $35,435 $55,006 $60,350 $60,193 $54,285 $42,496 $26,916
Less than $15,000 481 16 34 45 60 98 91 136$15,000 to $24,999 509 13 30 41 41 78 116 189$25,000 to $34,999 454 13 37 46 45 56 107 149$35,000 to $49,999 739 23 83 103 97 137 162 134
$50,000 to $74,999 897 15 117 158 150 205 189 63$75,000 to $99,999 651 9 76 115 139 157 107 47$100,000 or more 889 3 103 175 184 203 158 63Total 4,619 92 482 684 716 934 931 780
Median Income $52,416 $36,731 $59,210 $64,344 $67,084 $59,286 $48,551 $28,553
Less than $15,000 -53 1 -10 -6 -15 -26 2 2$15,000 to $24,999 -26 -3 -7 -4 -10 -17 5 11$25,000 to $34,999 -44 -3 -13 -3 -15 -15 -0 6$35,000 to $49,999 6 1 -11 2 -15 -14 23 21$50,000 to $74,999 18 -0 -7 4 -17 -12 39 12$75,000 to $99,999 24 -0 -3 7 -7 -4 23 9$100,000 or more 178 -0 10 29 26 32 59 22Total 105 -4 -42 28 -54 -57 151 83
Median Income $3,538 $1,296 $4,204 $3,994 $6,891 $5,001 $6,055 $1,637
Sources: ESRI; US Census Bureau; Maxfield Research & Consulting, LLC
2020
2025
Change 2020 - 2025
TABLE D-3HOUSEHOLD INCOME BY AGE OF HOUSEHOLDER
PRIMARY MARKET AREA2020 & 2025
Age of Householder
DEMOGRAPHIC ANALYSIS
MAXFIELD RESEARCH AND CONSULTING, LLC 20
Tenure by Age of Householder Table D-4 shows the number of owner and renter households in Pine City, the PMA and Pine County by age cohort in 2010 and 2017. This data shows the propensity of households to own or rent their housing based on their age.
• In Pine City, 37.9% of all households rented in 2010, compared to 17.3% in the PMA. By 2017, 19.3% of PMA households were renters, compared to 40.5% of Pine City households. In the Under 25 age group, 35.6% of PMA households rented, decreasing to 22.9% in the 25 to 34 age group, and further decreasing to 13.5.6% of 35 to 44 age households.
• Renter households are clustered in the youngest and oldest age cohorts. The younger age groups tend to be mobile, are more likely to be single, may not have yet accumulated a down payment for a single-family home or do not want to settle into homeownership. Seniors often no longer need the space of a single-family home, some travel frequently or have a second home in the warmer climates, and others just want/need to rid themselves of the burden of home maintenance.
• By the time households reach their senior years, rental housing often becomes a more viable option than homeownership. The rental rate increased in Pine City from 15.9% for households age 65 to 74 to 34.0% for households age 75 and older. The dramatic increase between these two age cohorts indicates that seniors move into rental housing alternatives in their mid-70s.
DEMOGRAPHIC ANALYSIS
MAXFIELD RESEARCH AND CONSULTING, LLC 21
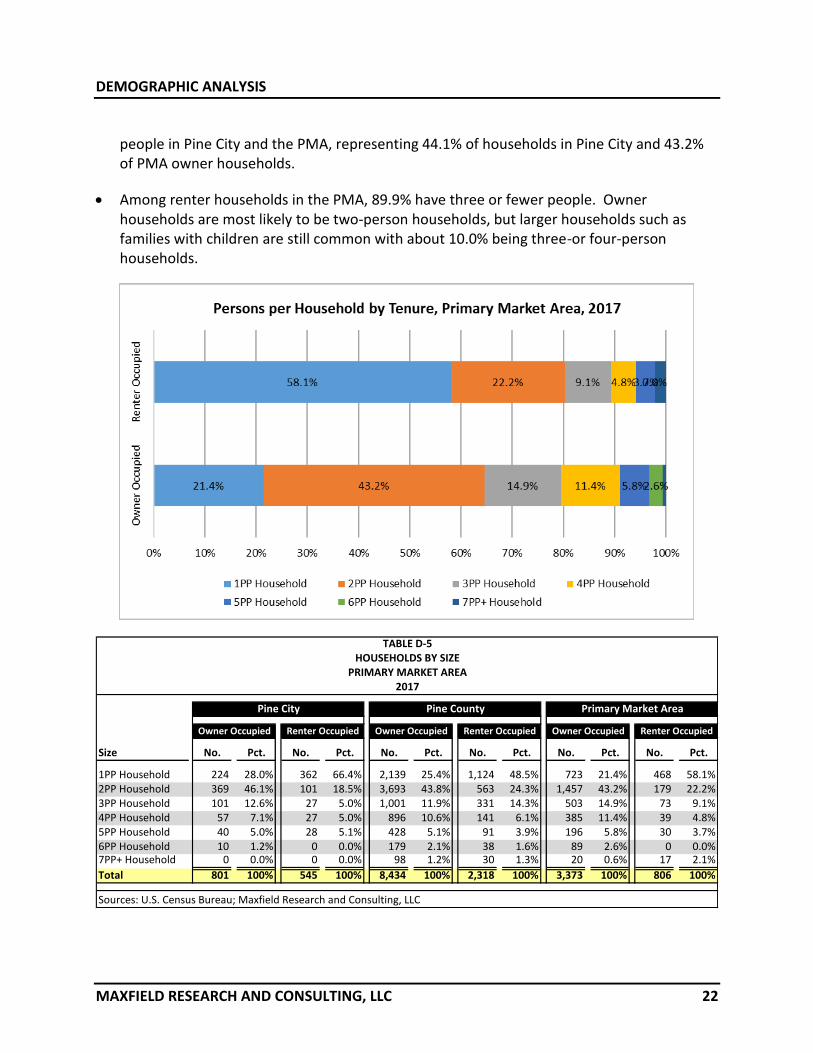
Tenure by Household Size Table D-5 shows the distribution of households by size and tenure in the Primary Market Area in 2017. This data is useful in that it sheds insight into the types of housing units that may be most needed in the PMA.
• Household size for renters tends to be smaller than for owners. This trend is a result of the typical market segments for rental housing, including households that are younger and are less likely to be married with children, as well as, older adults and seniors who choose to downsize from their single-family homes. In 2016, 80.3% of renter households in the PMA were one- or two-person households.
• This trend is reflected in both Pine City and the PMA where 66.4% and 58.1% of renter households had only one person. Owner households were most likely to contain two
Sources: U.S. Census Bureau; Maxfield Research & Consulting, LLC
Pine City
2017
Pine County
TABLE D-4
TENURE BY AGE OF HOUSEHOLDER
PRIMARY MARKET AREA
2010 to 2017
20172017
Primary Market Area
2010 2010 2010
DEMOGRAPHIC ANALYSIS
MAXFIELD RESEARCH AND CONSULTING, LLC 22
people in Pine City and the PMA, representing 44.1% of households in Pine City and 43.2% of PMA owner households.
• Among renter households in the PMA, 89.9% have three or fewer people. Owner households are most likely to be two-person households, but larger households such as families with children are still common with about 10.0% being three-or four-person households.
Household Type Table D-6 shows a breakdown of the type of households present in Pine City, the Primary Market Area, Pine County and Minnesota in 2010 and 2017. The data is useful in assessing housing demand since the household composition often dictates the type of housing needed and preferred. The following key points are summarized from Table D-6.
• Married couples without children represented the largest household type in the Primary Market Area in 2010. These households accounted for 35.7% of all households in the PMA.
• The next largest household type in the PMA was non-family households living alone (25.3% of households). A growing proportion of single-person households reflects several demographic and cultural shifts. The biggest contributing factor is the aging of the population, as baby boomers age and millennials postpone starting families.
• As of 2017, Married Couples without Children remains the largest proportion of households in the PMA, holding steady at 33.2%. Married with Children households in the PMA decreased from 18.7% to 17.1% of households, an 1.6% decrease. In Pine City, Married with Children households is projected to have decreased by 3.8% between 2010 and 2017.
• The proportion of Non-family households in the PMA increased from 44.2% of households in 2010 to 53.0% of households in 2017. Other Family households decreased slightly from 13.9% of households to 13.8%.
State of Minnesota 65,975 3.2% 17,105 3.9% 21,388 3.5% 2,673 0.9% 25,349 4.3% -540 -0.4%
* Single-parents with children** Includes unmarried couples without children and group quarters
Sources: U. S. Census; ESRI, Inc.; Maxfield Research and Consulting, LLC
Change 2010-2017
Total HH's Married w/ Child Married w/o Child Other * Living Alone Roommates **
TABLE D-6HOUSEHOLD TYPE
PRIMARY MARKET AREA2010 & 2017
Family Households Non-Family Households
DEMOGRAPHIC ANALYSIS
MAXFIELD RESEARCH AND CONSULTING, LLC 25
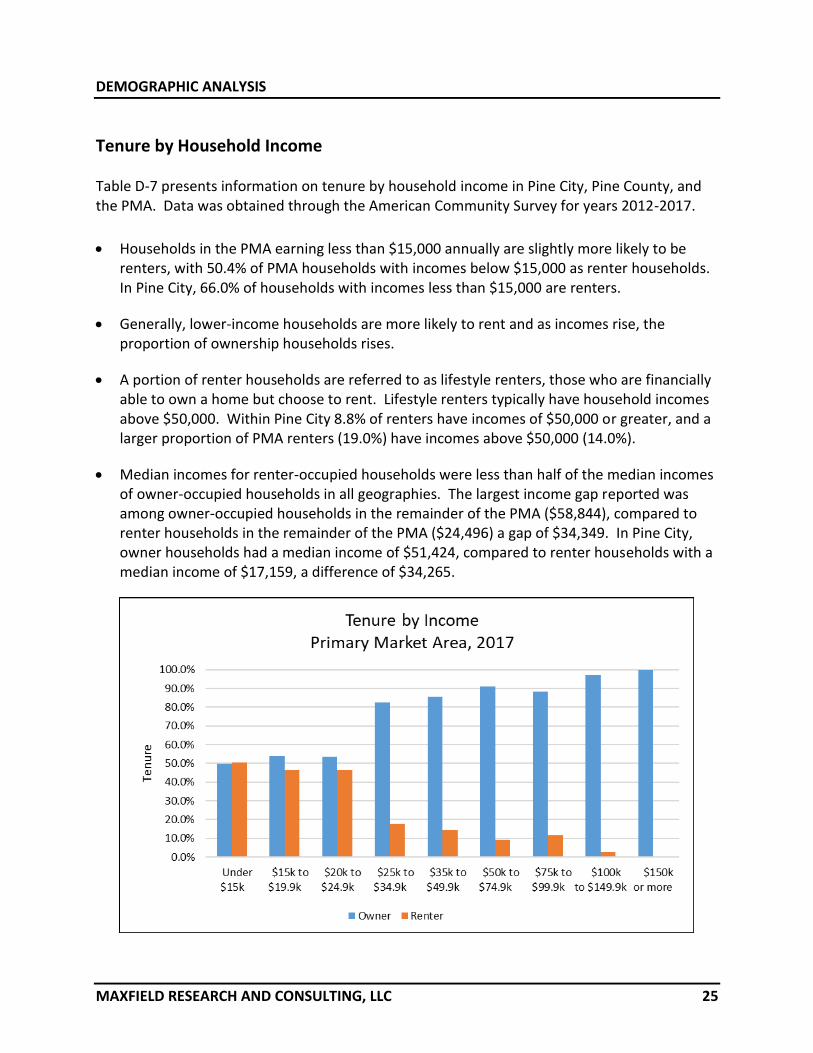
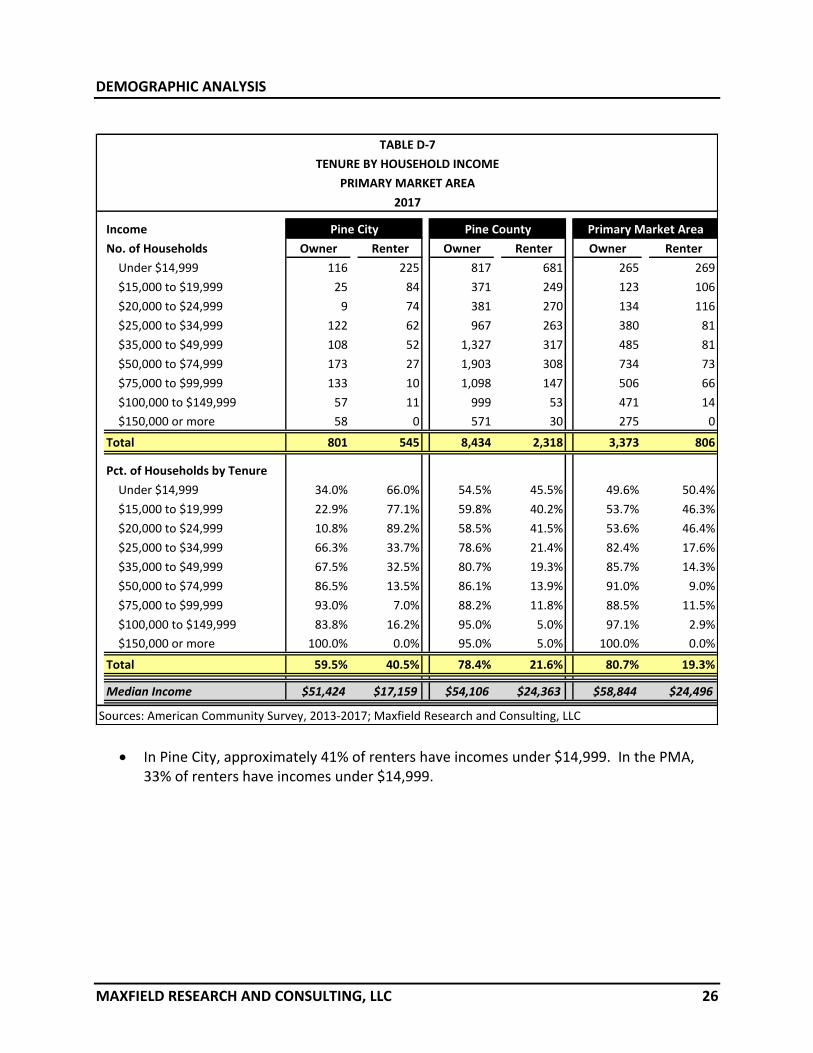
Tenure by Household Income Table D-7 presents information on tenure by household income in Pine City, Pine County, and the PMA. Data was obtained through the American Community Survey for years 2012-2017.
• Households in the PMA earning less than $15,000 annually are slightly more likely to be
renters, with 50.4% of PMA households with incomes below $15,000 as renter households. In Pine City, 66.0% of households with incomes less than $15,000 are renters.
• Generally, lower-income households are more likely to rent and as incomes rise, the proportion of ownership households rises.
• A portion of renter households are referred to as lifestyle renters, those who are financially able to own a home but choose to rent. Lifestyle renters typically have household incomes above $50,000. Within Pine City 8.8% of renters have incomes of $50,000 or greater, and a larger proportion of PMA renters (19.0%) have incomes above $50,000 (14.0%).
• Median incomes for renter-occupied households were less than half of the median incomes of owner-occupied households in all geographies. The largest income gap reported was among owner-occupied households in the remainder of the PMA ($58,844), compared to renter households in the remainder of the PMA ($24,496) a gap of $34,349. In Pine City, owner households had a median income of $51,424, compared to renter households with a median income of $17,159, a difference of $34,265.
DEMOGRAPHIC ANALYSIS
MAXFIELD RESEARCH AND CONSULTING, LLC 26
• In Pine City, approximately 41% of renters have incomes under $14,999. In the PMA, 33% of renters have incomes under $14,999.
Income
No. of Households Owner Renter Owner Renter Owner Renter
Under $14,999 116 225 817 681 265 269
$15,000 to $19,999 25 84 371 249 123 106
$20,000 to $24,999 9 74 381 270 134 116
$25,000 to $34,999 122 62 967 263 380 81
$35,000 to $49,999 108 52 1,327 317 485 81
$50,000 to $74,999 173 27 1,903 308 734 73
$75,000 to $99,999 133 10 1,098 147 506 66
$100,000 to $149,999 57 11 999 53 471 14
$150,000 or more 58 0 571 30 275 0
Total 801 545 8,434 2,318 3,373 806
Pct. of Households by Tenure
Under $14,999 34.0% 66.0% 54.5% 45.5% 49.6% 50.4%
$15,000 to $19,999 22.9% 77.1% 59.8% 40.2% 53.7% 46.3%
$20,000 to $24,999 10.8% 89.2% 58.5% 41.5% 53.6% 46.4%
$25,000 to $34,999 66.3% 33.7% 78.6% 21.4% 82.4% 17.6%
$35,000 to $49,999 67.5% 32.5% 80.7% 19.3% 85.7% 14.3%
$50,000 to $74,999 86.5% 13.5% 86.1% 13.9% 91.0% 9.0%
$75,000 to $99,999 93.0% 7.0% 88.2% 11.8% 88.5% 11.5%
$100,000 to $149,999 83.8% 16.2% 95.0% 5.0% 97.1% 2.9%
$150,000 or more 100.0% 0.0% 95.0% 5.0% 100.0% 0.0%
Total 59.5% 40.5% 78.4% 21.6% 80.7% 19.3%
Median Income $51,424 $17,159 $54,106 $24,363 $58,844 $24,496
TABLE D-7
TENURE BY HOUSEHOLD INCOME
PRIMARY MARKET AREA
2017
Sources: American Community Survey, 2013-2017; Maxfield Research and Consulting, LLC
Pine City Pine County Primary Market Area
DEMOGRAPHIC ANALYSIS
MAXFIELD RESEARCH AND CONSULTING, LLC 27
Building Permit Trends Table D-8 shows building permit trends for Pine City for new single-family units between 2009 and 2019. Building permit trends are useful as a proxy for evaluating household growth in a market as well as housing turnover over a period of time. The following are key points from Table D-9:
• Between 2009 and 2019, permits were issued for 133 new single-family homes in Pine City. The most active year was 2011, with 24 permits issued, and the least active year was 2009, right after the 2008 housing crash.
• On average, 12 homes have been issued permits annually, and activity has been above this average since 2015.
Permits
Year Issued
2009 2
2010 7
2011 24
2012 3
2013 14
2014 8
2015 16
2016 11
2017 17
2018 17
2019 14
Total 133
Average 12
Source: City of Pine City
TABLE D-8
RESIDENTIAL BUILDING PERMITS ISSUED
2009 to 2019
PINE CITY, MN
DEMOGRAPHIC ANALYSIS
MAXFIELD RESEARCH AND CONSULTING, LLC 28
DEMOGRAPHIC ANALYSIS
MAXFIELD RESEARCH AND CONSULTING, LLC 29
Summary of Demographic Analysis
• As of 2010, the PMA contained 11,109 people and 4,328 households. Between 2000
and 2010, the PMA population increased 12.6% while households increased by 15.6%.
During this period Pine City’s population and household bases increased by 2.6% and
8.2%, respectively. Between 2020 and 2025, the Primary Market Area is projected to
add 105 households, growth of 2.3%.
• Traditionally, younger households are most likely to rent their housing. Between 2020
and 2025, people aged 25 to 34 are forecast to decrease by 111 people (5.1%).
• In 2020, the median household income in the PMA is estimated to be $48,878. Incomes
are forecast to increase to $52,416 by 2025.
• In Pine City, 37.9% of all households rented in 2010, compared to 17.3% in the PMA. By
2017, 19.3% of PMA households were renters, compared to 40.5% of Pine City
households. In the Under 25 age group, 35.6% of PMA households rented, decreasing
to 22.9% in the 25 to 34 age group, and further decreasing to 13.5.6% of 35 to 44 age
households.
• Median incomes for renter-occupied households were less than half of the median
incomes of owner-occupied households in all geographies. The largest income gap
reported was among owner-occupied households in the remainder of the PMA
($58,844), compared to renter households in the remainder of the PMA ($24,496) a gap
of $34,349.
• As of 2017, Married Couples without Children remains the largest proportion of
households in the PMA. The proportion of Non-family households in the PMA increased
from 44.2% of households in 2010 to 53.0% of households in 2017.
• Between 2009 and 2019, permits were issued for 133 new single-family homes in Pine
City, an average of 12 per year.
EMPLOYMENT TRENDS
MAXFIELD RESEARCH AND CONSULTING, LLC 30
Introduction Employment characteristics are an important component in assessing housing needs in any given market area. These trends are important to consider since job growth can generally fuel household and population growth as people usually desire to live near where they work. Long commute times have encouraged households to move closer to major employment centers.
Employment Projections Table E-1 shows Total Employment projections from the Minnesota Department of Employment and Economic Development, which provides employment projections for the major economic development regions in the state, and the State of Minnesota. The Primary Market Area is located in the Central Minnesota Planning Area, which consists of thirteen counties: Benton, Chisago, Isanti, Kanabec, Kandiyohi, McLeod, Meeker, Mille Lacs, Pine, Renville, Sherburne, Stearns and Wright Counties. Total employment in the Central Minnesota Planning Area is projected to increase by 8.6% between 2016 and 2026, while employment in the State is projected to grow by 5.9%.
Area 2016 2026 No. Change Pct. Change
Central Minnesota 310,433 337,062 26,629 8.6%
Minnesota 3,097,300 3,278,900 181,600 5.9%
Sources: MNDEED, Maxfield Research and Consulting, LLC
TABLE E-1
EMPLOYMENT PROJECTIONS (TOTAL EMPLOYMENT)
CENTRAL MINNESOTA PLANNING AREA & STATE OF MINNESOTA
2016 - 2026
Central Minnesota Planning Area consists of 13 counties in Central Minnesota: Benton, Chisago,
Isanti, Kanabec, Kandiyohi, McLeod, Meeker, Mille Lacs, Pine, Renville, Sherburne, Stearns, and
Wright Counties.
EMPLOYMENT TRENDS
MAXFIELD RESEARCH AND CONSULTING, LLC 31
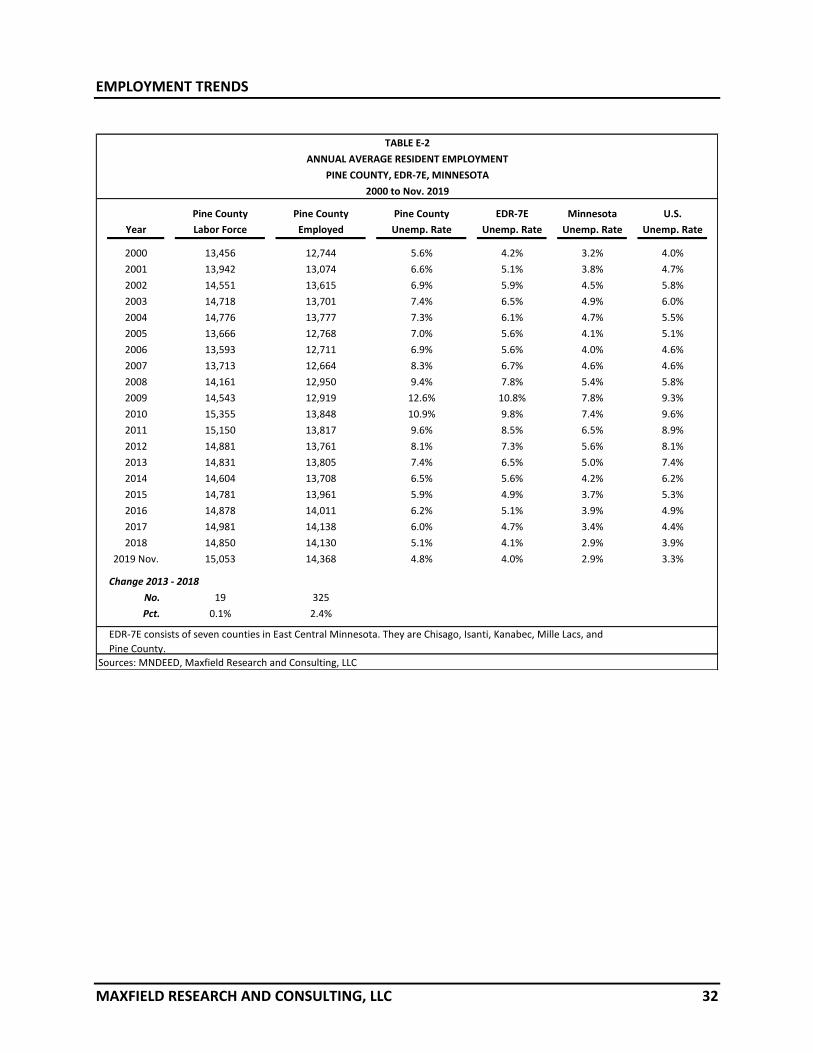
Resident Labor Force Table E-2 presents resident employment data for Pine County from 2000 through Nov. 2019. Resident employment data is calculated as an annual average and reveals the work force and number of employed persons living in the County. Not all of these individuals however, work in Pine County. The unemployment rate for Economic Development Region 7E (Economic Development Region 7 East, which includes the PMA) also shown, along with the State of Minnesota for comparison purposes. The data is obtained from the Minnesota Department of Employment and Economic Development.
• As of November 2019, the unemployment rate in Pine County was 4.8%, above EDR-7E unemployment rate of 4.0% and above the State of Minnesota (2.9%).
• Between 2000 and 2017, the labor force in Pine County fluctuated between 12,774 in 2000 and 14,368 (Nov. 2019), averaging 13,524 annually in this period, with a recent upwards trend upwards since 2014.
• The East Central Economic Development Region, which includes Pine County, had an unemployment rate of 4.0% as of November 2019. Between 2000 and November 2019, the EDR 7W had an average unemployment rate of 4.0%.
• The effects of the national economic recession are reflected strongly in the unemployment rate for Pine County and EDR-7E. The unemployment rate in EDR-7E fell from 10.8% in 2009 to 4.0% as of November 2019.
EMPLOYMENT TRENDS
MAXFIELD RESEARCH AND CONSULTING, LLC 32
Pine County Pine County Pine County EDR-7E Minnesota U.S.
Year Labor Force Employed Unemp. Rate Unemp. Rate Unemp. Rate Unemp. Rate
2000 13,456 12,744 5.6% 4.2% 3.2% 4.0%
2001 13,942 13,074 6.6% 5.1% 3.8% 4.7%
2002 14,551 13,615 6.9% 5.9% 4.5% 5.8%
2003 14,718 13,701 7.4% 6.5% 4.9% 6.0%
2004 14,776 13,777 7.3% 6.1% 4.7% 5.5%
2005 13,666 12,768 7.0% 5.6% 4.1% 5.1%
2006 13,593 12,711 6.9% 5.6% 4.0% 4.6%
2007 13,713 12,664 8.3% 6.7% 4.6% 4.6%
2008 14,161 12,950 9.4% 7.8% 5.4% 5.8%
2009 14,543 12,919 12.6% 10.8% 7.8% 9.3%
2010 15,355 13,848 10.9% 9.8% 7.4% 9.6%
2011 15,150 13,817 9.6% 8.5% 6.5% 8.9%
2012 14,881 13,761 8.1% 7.3% 5.6% 8.1%
2013 14,831 13,805 7.4% 6.5% 5.0% 7.4%
2014 14,604 13,708 6.5% 5.6% 4.2% 6.2%
2015 14,781 13,961 5.9% 4.9% 3.7% 5.3%
2016 14,878 14,011 6.2% 5.1% 3.9% 4.9%
2017 14,981 14,138 6.0% 4.7% 3.4% 4.4%
2018 14,850 14,130 5.1% 4.1% 2.9% 3.9%
2019 Nov. 15,053 14,368 4.8% 4.0% 2.9% 3.3%
Change 2013 - 2018
No. 19 325
Pct. 0.1% 2.4%
TABLE E-2
ANNUAL AVERAGE RESIDENT EMPLOYMENT
PINE COUNTY, EDR-7E, MINNESOTA
2000 to Nov. 2019
Sources: MNDEED, Maxfield Research and Consulting, LLC
EDR-7E consists of seven counties in East Central Minnesota. They are Chisago, Isanti, Kanabec, Mille Lacs, and
Pine County.
EMPLOYMENT TRENDS
MAXFIELD RESEARCH AND CONSULTING, LLC 33
Employment and Wages by Industry Table E-3 displays information on employment and wages in Pine City and Pine County (the PMA) and the East Central Economic Development Region 7E. The data is sourced from the Minnesota Department of Employment and Economic Development (MNDEED) for the third quarters of 2018 Q3 through 2019 Q3. All establishments covered under the Unemployment Insurance (UI) Program are required to report wage and employment statistics quarterly to MNDEED. Federal government establishments are also covered by the Quarterly Census of Employment and Wages (QCEW) program. Certain industries in the table may not display any information which means that there is either no reported economic activity for that industry or the data has been suppressed to protect the confidentiality of cooperating employers. This generally occurs when there are too few employers or one employer comprises too much of the employment in that geography.
• Within Pine City, the Manufacturing sector reported the highest weekly wage, $926, or approximately $48,152 annually. The lowest average weekly wage was in the Leisure and Hospitality sector at $236.
• The Education and Health Services sector is the largest employment sector in Pine City, accounting for 26.4% of jobs with an average weekly wage of $790.
• The Education and Health Services sector experienced the largest proportional increase in wages between the third quarters of 2018 and 2019. Wages increased by 13.7%, a gain of $95 per week.
• Across Pine County, average weekly wages increased by 8.4%, $50 per week, between 2018 Q3 and 2019 Q3. Wages increased in nine of the ten Industry groups. Wages in the Professional and Business services sector fell 8.6% ($62/week).
• The largest employment sector in the Pine County is the Leisure and Hospitality Services sector, with 2,543 employees as of 2019 Q3, representing 29.0% of the PMA’s workers. The second largest employment sector is Education & Health Services sector, with 1,692 employees, accounting for 19.2% of total employment.
• Wages in EDR-7E East Central had a weekly average wage of $782 as of 2019 Q3. The highest average weekly wage in EDR-7E is in the Construction industry, with an average weekly wage of $1,189.
Sources: Minnesota Department of Employment and Economic Development; Maxfield Research and Consulting LLC
EDR-7E (East Central)
Pine City
Pine County
TABLE E-2QUARTERLY CENSUS OF EMPLOYMENT AND WAGES
2018 Q3 to 2019 Q3
Employment
# %
Wage
# %
Change 2018 - 20192019 Q32018 Q3
Pine City and Pine County
EMPLOYMENT TRENDS
MAXFIELD RESEARCH AND CONSULTING, LLC 36
Commuting Patterns Proximity to employment is often a primary consideration when choosing where to live, since transportation costs often account for a considerable proportion of households’ budgets. Table E-4 highlights the commuting patterns of workers in Pine City and Pine County in 2017 (the most recent data available), based on the Local Employer-Household Dynamics database (LEHD) compiled and published by the U.S. Census Bureau. Home destination is defined as where workers live who are employed in the selection area. Work destination is defined as where workers are employed who live in the selection area.
• As Table E-4 illustrates, an estimated 33.2% of workers who are employed in Pine City live in
Pine City and 7.4% live in Hinckley. The next largest work destinations were Rush City (4.8%) and Cambridge (2.8%). The top three home destinations for workers in Pine City are Pine City (21.0%), Rock Creek (5.9%), and Rush City (2.1%).
• Most Pine City workers travel less than 10 miles to their jobs (55.0%). An estimated 25.8% travel between 10 and 24 miles to their job, while 8.7% travel between 25 and 50 miles and 10.5% travel 50 miles or more.
• Workers with longer commutes may be interested in new rental or for-sale housing that is closer to their place of employment. Workers with commutes of more than 50 miles, may be workers working remotely on a regular basis or may be working from a regional location of a larger company that is based elsewhere.
EMPLOYMENT TRENDS
MAXFIELD RESEARCH AND CONSULTING, LLC 37
Place of Residence Count Share Place of Employment Count Share
Pine City city, MN 513 21.0% Pine City city, MN 513 33.2%Rock Creek city, MN 143 5.9% Hinckley city, MN 114 7.4%Rush City city, MN 52 2.1% Rush City city, MN 74 4.8%Hinckley city, MN 49 2.0% Cambridge city, MN 43 2.8%North Branch city, MN 39 1.6% Mora city, MN 42 2.7%Sandstone city, MN 36 1.5% North Branch city, MN 37 2.4%Mora city, MN 31 1.3% Wyoming city, MN 30 1.9%Grantsburg village, WI 20 0.8% Duluth city, MN 24 1.6%Cambridge city, MN 18 0.7% Minneapolis city, MN 24 1.6%Braham city, MN 16 0.7% St. Paul city, MN 22 1.4%All Other Locations 1,525 62.4% All Other Locations 624 40.3%
Distance Traveled Distance Traveled
Total Primary Jobs 2,442 100.0% Total Primary Jobs 1,547 100.0% Less than 10 miles 1,343 55.0% Less than 10 miles 620 40.1% 10 to 24 miles 630 25.8% 10 to 24 miles 338 21.8% 25 to 50 miles 212 8.7% 25 to 50 miles 220 14.2% Greater than 50 miles 257 10.5% Greater than 50 miles 369 23.9%
Home Destination: Where workers live who are employed in the selection areaWork Destination: Where workers are employed who live in the selection area
Sources: U.S. Census Bureau Local Employment Dynamics, Maxfield Research & Consulting, LLC
TABLE E-4COMMUTING PATTERNS
PINE CITY, MN2017
Home Destination Work Destination
EMPLOYMENT TRENDS
MAXFIELD RESEARCH AND CONSULTING, LLC 38
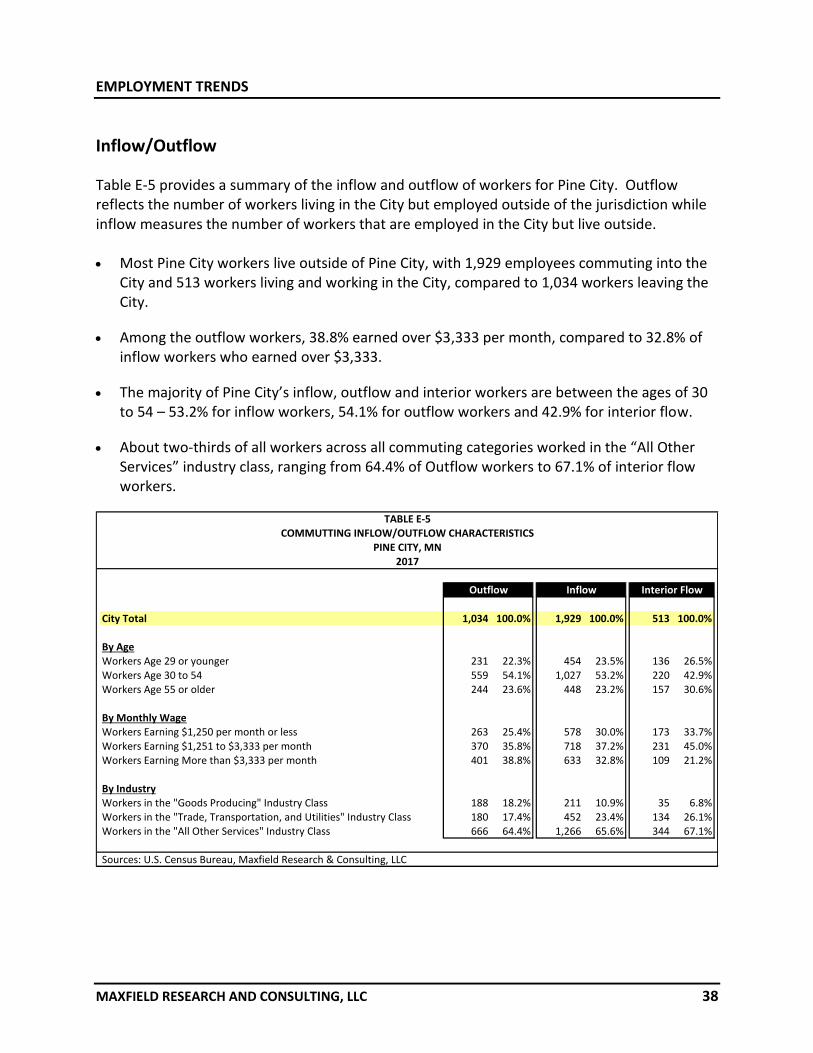
Inflow/Outflow
Table E-5 provides a summary of the inflow and outflow of workers for Pine City. Outflow reflects the number of workers living in the City but employed outside of the jurisdiction while inflow measures the number of workers that are employed in the City but live outside.
• Most Pine City workers live outside of Pine City, with 1,929 employees commuting into the
City and 513 workers living and working in the City, compared to 1,034 workers leaving the City.
• Among the outflow workers, 38.8% earned over $3,333 per month, compared to 32.8% of inflow workers who earned over $3,333.
• The majority of Pine City’s inflow, outflow and interior workers are between the ages of 30 to 54 – 53.2% for inflow workers, 54.1% for outflow workers and 42.9% for interior flow.
• About two-thirds of all workers across all commuting categories worked in the “All Other Services” industry class, ranging from 64.4% of Outflow workers to 67.1% of interior flow workers.
City Total 1,034 100.0% 1,929 100.0% 513 100.0%
By AgeWorkers Age 29 or younger 231 22.3% 454 23.5% 136 26.5%Workers Age 30 to 54 559 54.1% 1,027 53.2% 220 42.9%Workers Age 55 or older 244 23.6% 448 23.2% 157 30.6%
By Monthly WageWorkers Earning $1,250 per month or less 263 25.4% 578 30.0% 173 33.7%Workers Earning $1,251 to $3,333 per month 370 35.8% 718 37.2% 231 45.0%Workers Earning More than $3,333 per month 401 38.8% 633 32.8% 109 21.2%
By IndustryWorkers in the "Goods Producing" Industry Class 188 18.2% 211 10.9% 35 6.8%Workers in the "Trade, Transportation, and Utilities" Industry Class 180 17.4% 452 23.4% 134 26.1%Workers in the "All Other Services" Industry Class 666 64.4% 1,266 65.6% 344 67.1%
Sources: U.S. Census Bureau, Maxfield Research & Consulting, LLC
Resident Profile Table E-6 compares characteristics of employed residents living in Pine City in 2017 with the State of Minnesota. Information on monthly earnings, age, race and ethnicity, educational attainment and job classification is provided. Key points from Table E-6 are below.
• Pine City residents earning more than $3,333 per month accounted for 33.0% of workers. This is less than the proportion of residents in Minnesota (48.4%). Workers between the ages of 30 to 54 accounted for 50.4% of workers, slightly lower than the proportion in the State of Minnesota (53.0%).
MNNo. Pct. Pct.
Total All Jobs 1,547 100.0% 100.0%
$1,250 per month or less 436 28.2% 23.4%$1,251 to $3,333 per month 601 38.8% 28.2%More than $3,333 per month 510 33.0% 48.4%
Age 29 or younger 367 23.7% 24.2%Age 30 to 54 779 50.4% 53.0%Age 55 or older 401 25.9% 22.9%
White Alone 1,479 95.6% 86.5%Black or African American Alone 12 0.8% 6.1%American Indian or Alaska Native Alone 19 1.2% 0.9%Asian Alone 14 0.9% 4.9%Native Hawaiian or Other Pacific Islander Alone 1 0.1% 0.1%Two or More Race Groups 22 1.4% 1.6%
Not Hispanic or Latino 1,531 99.0% 95.8%Hispanic or Latino 16 1.0% 4.2%
Less than high school 94 6.1% 6.1%High school or equivalent, no college 394 25.5% 19.8%Some college or Associate degree 422 27.3% 26.3%Bachelor's degree or advanced degree 270 17.5% 23.7%Educational attainment not available (workers aged 29 or younger) 367 23.7% 24.2%
TABLE E-6RESIDENT PROFILE
PINE CITY2017
Pine City
Sources: U.S. Census Bureau, Maxfield Research and Consulting, LLC
Total Jobs
Monthly Earnings
Worker Ages
Worker Race and Ethnicity
Ethnicity
Worker Educational Attainment
EMPLOYMENT TRENDS
MAXFIELD RESEARCH AND CONSULTING, LLC 41
• The proportion of workers who live in Pine City with only a high school diploma (25.5%) was higher than the State of Minnesota (19.8%). Pine City workers with a Bachelor’s degree were 17.5% of workers compared to 23.7% in the State of Minnesota.
Major Employers A portion of employment growth in the Pine City PMA will be generated by the largest employers in Pine City. Table E-7 below lists the top employers in Pine City along with a description of their primary industry and number of employees based on data provided by ReferenceUSA, a database of businesses in the United States. The following are key points from Table E-7:
• The largest employer in Pine City is Walmart, a retail department store, with an estimated 300 jobs.
• The next largest employers are Pine City schools and the Technical and Community College.
• Pine City has a diverse employment base, and the largest employers being local schools is not unusual, especially in more rural areas.
No. of
Employer Name Industry (NAICS Description) Employees
Walmart Supercenter Department Stores 300
Pine City District Office Elementary & Secondary Schools 150
Pine Technical & Community Clg Junior Colleges 140
Pine City Elementary School Elementary & Secondary Schools 120
Atscott Manufacturing Machine Shops 80
Community Living Options Other Residential Care Facilities 70
Mc Donald's Limited-Service Restaurants 65
Minpack Paper Bag & Coated & Treated Paper Manufacturing 50
Eide Chrysler Pine City New Car Dealers 40
Firstlight Health System Freestanding Ambulatory Surgical & Emergency Ctrs 40
Phase Human Rights Organizations 40
FEBRUARY 2020
TABLE E-7
MAJOR EMPLOYERS
PINE CITY
Sources: ReferenceUSA; Maxfield Research and Consulting, LLC
EMPLOYMENT TRENDS
MAXFIELD RESEARCH AND CONSULTING, LLC 42
Summary of Employment Trends
• As of November 2019, the unemployment rate in Pine County was 4.8%, above EDR-7E
unemployment rate of 4.0% and above the State of Minnesota (2.9%).
• The Education and Health Services sector is the largest employment sector in Pine City,
accounting for 26.4% of jobs with an average weekly wage of $790.
• Across Pine County, average weekly wages increased by 8.4%, $50 per week, between 2018
Q3 and 2019 Q3. Wages increased in nine of the ten Industry groups. Wages in the
Professional and Business services sector fell 8.6% ($62/week).
• Most Pine City workers travel less than 10 miles to their jobs (55.0%). An estimated 25.8%
travel between 10 and 24 miles to their job, while 8.7% travel between 25 and 50 miles and
10.5% travel 50 miles or more.
• Most Pine City workers commute into Pine City, with 1,929 employees commuting into the
City and 513 workers living and working in the City, compared to 1,034 workers leaving the
City.
• The largest employers in Pine City are Walmart, Pine City School District, and Pine Technical
and Community College.
HOMELESS POPULATIONS
MAXFIELD RESEARCH AND CONSULTING, LLC 43
Introduction This section presents findings from the 2018 Wilder Survey of the homeless population and information on the housing needs of the homeless in the Central Region, which includes the PMA, and Minnesota totals. The Wilder Foundation only presents data at the regional geography
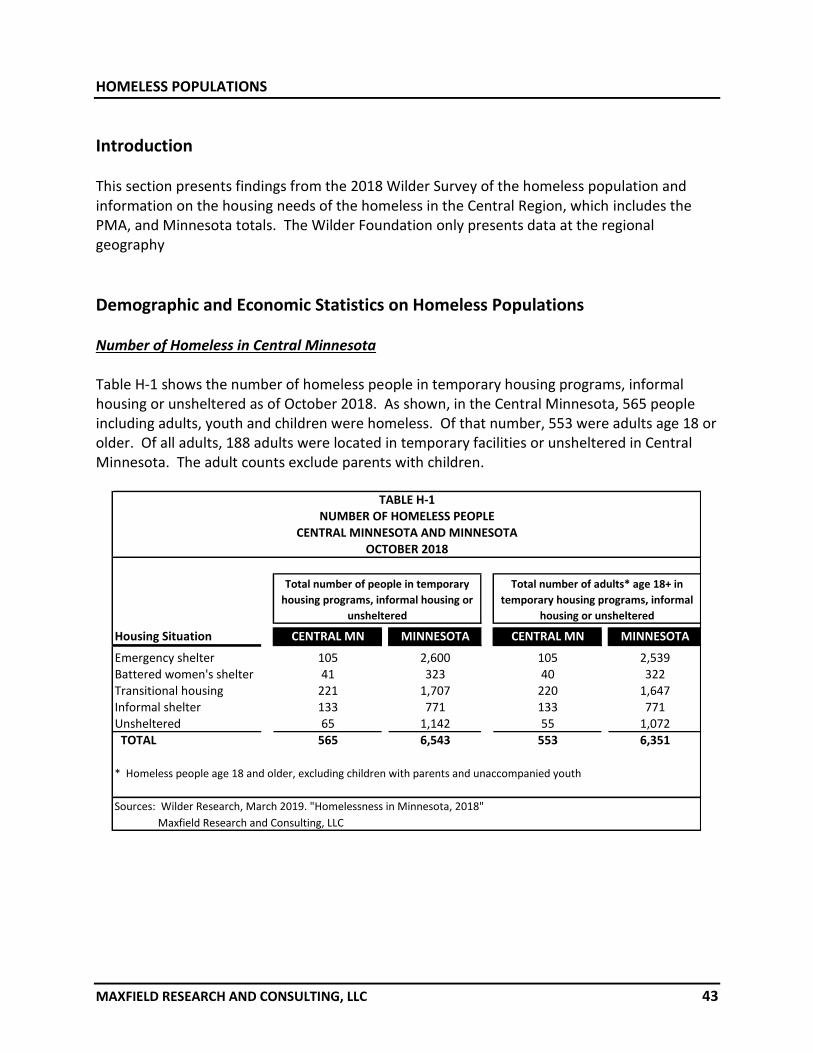
Demographic and Economic Statistics on Homeless Populations Number of Homeless in Central Minnesota Table H-1 shows the number of homeless people in temporary housing programs, informal housing or unsheltered as of October 2018. As shown, in the Central Minnesota, 565 people including adults, youth and children were homeless. Of that number, 553 were adults age 18 or older. Of all adults, 188 adults were located in temporary facilities or unsheltered in Central Minnesota. The adult counts exclude parents with children.
Housing Situation CENTRAL MN MINNESOTA CENTRAL MN MINNESOTA
* Homeless people age 18 and older, excluding children with parents and unaccompanied youth
Sources: Wilder Research, March 2019. "Homelessness in Minnesota, 2018"
Maxfield Research and Consulting, LLC
Total number of people in temporary
housing programs, informal housing or
unsheltered
Total number of adults* age 18+ in
temporary housing programs, informal
housing or unsheltered
TABLE H-1NUMBER OF HOMELESS PEOPLE
OCTOBER 2018CENTRAL MINNESOTA AND MINNESOTA
HOMELESS POPULATIONS
MAXFIELD RESEARCH AND CONSULTING, LLC 44
Age Distribution of Homeless in Central Minnesota Table H-2 presents information on the age distribution of homeless adults, age 18 or older in Central Minnesota as of 2018. The table shows that the average age of the homeless in Central Minnesota and Minnesota was nearly equal, about 39 and 40 years. In each geographic area, the largest number of homeless was those ages 30 to 39, followed by those 40 to 49 and those 20 to 29. Fewer people age 50 or older were homeless.
This table shows that, in general, the largest group of homeless is young to mid-age, between the ages of 20 and 50 years old.
Age Number Pct. Number Pct.
18 to 21 59 10.7% 655 10.3%21 to 29 99 17.9% 1,114 17.5%30 to 39 150 27.1% 1,544 24.3%40 to 49 117 21.2% 1,226 19.3%50 to 54 37 6.7% 669 10.5%55 to 59 55 9.9% 568 8.9%60 to 69 35 6.3% 521 8.2%70 to 79 1 0.2% 49 0.8%80+ 0 0.0% 2 0.0%
553 100.0% 6,348 100.0%
Average age
Sources: Wilder Research, March 2019. "Homelessness in Minnesota, 2018"
Maxfield Research and Consulting, LLC
TABLE H-2AGE DISTRIBUTION
OCTOBER 2018HOMELESS PEOPLE IN CENTRAL MN AND MINNESOTA
* People living in temporary housing programs or informal housing and identified
unsheltered people, excluding youth less than 18 years of age and children staying with
parents
Central MN Minnesota
39 40
HOMELESS POPULATIONS
MAXFIELD RESEARCH AND CONSULTING, LLC 45
Ethnic Background of the Homeless Table H-3 presents information on the ethnic background of those that were identified as homeless in 2018. The table presents information based on self-identification of ethnic background from the homeless that were surveyed. As shown on the table, the largest number of homeless persons was identified as being White or Caucasian in Central Minnesota. In Central Minnesota 56.6% of homeless were identified as White or Caucasian. In Minnesota as a whole, the proportion was nearly 32.1%. The second highest category was African American, accounting for 15.3% of the homeless in Central Minnesota and 32.1% in Minnesota. American Indians accounted for 7.3% in Central Minnesota and 12.0% in Minnesota. Other ethnicities such as Asian, African Native, or other groups were identified in much smaller proportions.
Racial/Ethnic background Number Pct. Number Pct.
White or Caucasian 343 56.6% 2,296 33.4%
African American 93 15.3% 2,206 32.1%
American Indian 44 7.3% 826 12.0%
Multi-racial 36 5.9% 482 7.0%
African Native 8 1.3% 162 2.4%
Other 16 2.6% 162 2.4%
Asian or Pacific Islander 9 1.5% 116 1.7%
Not Specified 4 0.7% 100 1.5%
Hispanic, Latino, or Chicano 53 8.7% 515 7.5%
TOTAL 606 100.0% 6,865 100.0%
Sources : Wi lder Research, March 2019. "Homelessness in Minnesota, 2018"
Maxfield Research and Consulting, LLC
Central MN Minnesota
TABLE H-3
ETHNIC BACKGROUND OF HOMELESS PEOPLE SURVEYED
OCTOBER 2018
HOMELESS PEOPLE IN CENTRAL MN AND MINNESOTA
HOMELESS POPULATIONS
MAXFIELD RESEARCH AND CONSULTING, LLC 46
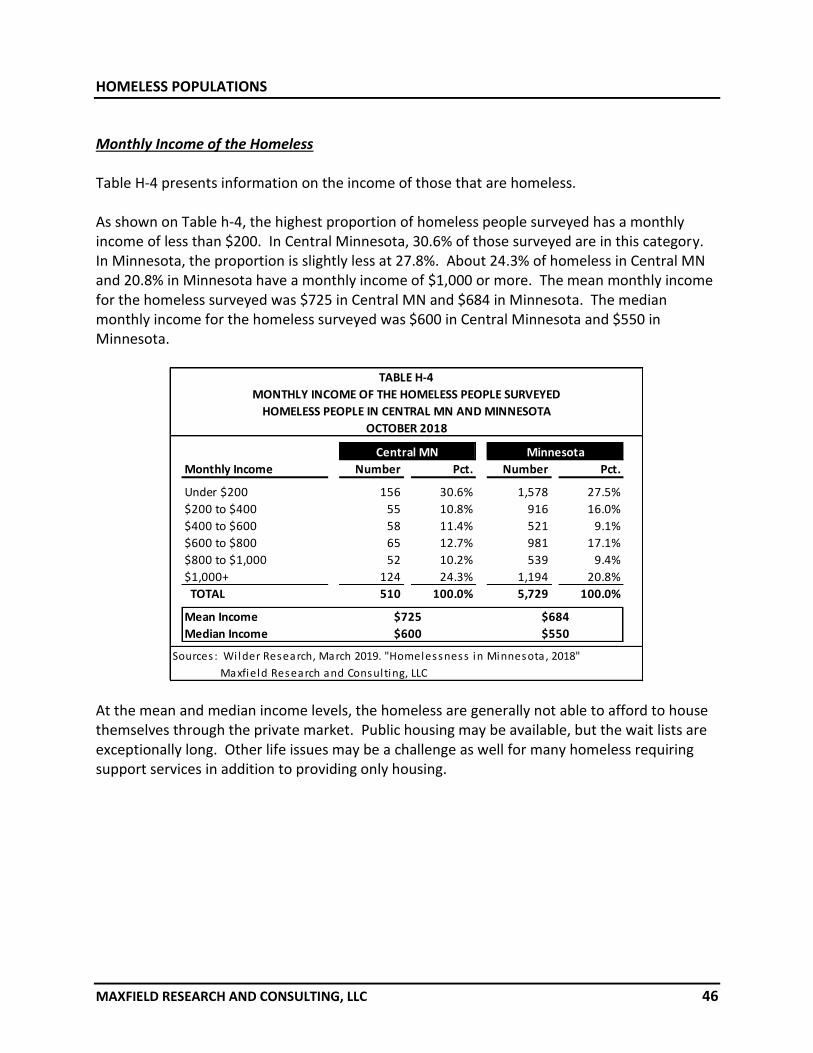
Monthly Income of the Homeless Table H-4 presents information on the income of those that are homeless. As shown on Table h-4, the highest proportion of homeless people surveyed has a monthly income of less than $200. In Central Minnesota, 30.6% of those surveyed are in this category. In Minnesota, the proportion is slightly less at 27.8%. About 24.3% of homeless in Central MN and 20.8% in Minnesota have a monthly income of $1,000 or more. The mean monthly income for the homeless surveyed was $725 in Central MN and $684 in Minnesota. The median monthly income for the homeless surveyed was $600 in Central Minnesota and $550 in Minnesota.
At the mean and median income levels, the homeless are generally not able to afford to house themselves through the private market. Public housing may be available, but the wait lists are exceptionally long. Other life issues may be a challenge as well for many homeless requiring support services in addition to providing only housing.
Monthly Income Number Pct. Number Pct.
Under $200 156 30.6% 1,578 27.5%
$200 to $400 55 10.8% 916 16.0%
$400 to $600 58 11.4% 521 9.1%
$600 to $800 65 12.7% 981 17.1%
$800 to $1,000 52 10.2% 539 9.4%
$1,000+ 124 24.3% 1,194 20.8%
TOTAL 510 100.0% 5,729 100.0%
Mean Income
Median Income
Sources : Wi lder Research, March 2019. "Homelessness in Minnesota, 2018"
Maxfield Research and Consulting, LLC
TABLE H-4
MONTHLY INCOME OF THE HOMELESS PEOPLE SURVEYED
HOMELESS PEOPLE IN CENTRAL MN AND MINNESOTA
OCTOBER 2018
$725
$600
$684
$550
Central MN Minnesota
HOMELESS POPULATIONS
MAXFIELD RESEARCH AND CONSULTING, LLC 47
Maximum Affordable Rents Table H-5 presents information on the maximum rent affordable for the homeless that were surveyed in October 2018. The table shows the mean affordable rent was $290 per month in Central Minnesota and $274 per month in Minnesota. The median affordable rent in Central Minnesota was $240 per month and $220 in Minnesota a whole. The table shows that 35.4% of those surveyed could only afford a monthly rent of less than $290 in Central Minnesota. In Minnesota, 33.5% of those surveyed could only afford less than $274. With an average rent in the in the PMA at $768 per month, it is easy to understand the dilemma. Unless the household can obtain a Housing Choice Voucher or is in project-based Section 8 housing or public housing, there is little likelihood of being able to find housing at a cost level that is affordable to the vast majority of these households.
Monthly Income Number Pct. Number Pct.
Under $200 156 30.6% 1,578 27.5%
$200 to $400 55 10.8% 916 16.0%
$400 to $600 58 11.4% 521 9.1%
$600 to $800 65 12.7% 981 17.1%
$800 to $1,000 52 10.2% 539 9.4%
$1,000+ 124 24.3% 1,194 20.8%
TOTAL 510 100.0% 5,729 100.0%
Mean Affordable Rent
Median Affordable Rent
Sources : Wi lder Research, March 2019. "Homelessness in Minnesota, 2018"
Maxfield Research and Consulting, LLC
$290 $274
$240 $220
TABLE H-5
MAXIMUM AFFORDABLE RENTS AMONG SURVEYED HOMELESS PEOPLE
HOMELESS PEOPLE IN CENTRAL MN AND MINNESOTA
OCTOBER 2018
Central MN Minnesota
HOMELESS POPULATIONS
MAXFIELD RESEARCH AND CONSULTING, LLC 48
Size of Bedroom Needed Table H-6 presents information on the size of bedroom needed for those surveyed as of October 2018. The data shows that the overwhelming need was for efficiency and one-bedroom units. One quarter of those surveyed indicated they would need an efficiency unit or a single-room in Central Minnesota. Another 30.1% indicated a need for a one-bedroom. For Minnesota, the proportions were 26.4% and 36.2%, respectively.
The data on the table indicates that the majority of homeless are likely singles that do not have children and would only require housing for themselves.
No. of Bedroom No. Pct. No. Pct.
0BR or single-room occ. 137 25.0% 1,648 26.1%
1 BR 165 30.1% 2,282 36.2%
2 BR 138 25.1% 1,476 23.4%
3 BR 90 16.4% 667 10.6%
4 or More 19 3.5% 236 3.7%
TOTAL 549 100.0% 6,309 100.0%
Sources : Wi lder Research, March 2019. "Homelessness in Minnesota, 2018"
Maxfield Research and Consulting, LLC
NUMBER OF BEDROOM SIZE NEEDED
Central MN Minnesota
TABLE H-6
HOMELESS PEOPLE IN CENTRAL MN AND MINNESOTA
OCTOBER 2018
HOMELESS POPULATIONS
MAXFIELD RESEARCH AND CONSULTING, LLC 49
Comparison of 2015 and 2018 Homeless Figures Based on figures from the 2015 and 2018 studies completed by the Wilder Foundation, homeless populations in Minnesota have continued to increase. The Wilder study counted 6,531 homeless in Minnesota as of October 2018, a 17.9% increase from October 2015. Clearly, despite an improving economy many people are being left behind. Consistent with findings from the 2015 report, the 2018 study showed increasing levels of distress among the homeless, including high rates of mental illness, physical disabilities and recent incarceration. Other significant findings as compared to the 2015 report include:
• 55.2% of all homeless adults had been homeless for more than one year (up from 46.4% in 2015);
• 31.6% of all homeless adults had been jobless for more than one year (up from 27.9% in 2015);
• 16.3% of homeless adults reported full-time employment (down from 18.8% in 2015);
• 5.2% of homeless adults reported a “lack of employment opportunities” as one of their main reasons for not working (up from 4.8% in 2015);
• Median monthly income of homeless adults was $600 in 2018, the same as in 2015;
• 50.8% of homeless adults reported using food stamps during the month of October 2018 (up from 45.1% in 2015).
• Study findings show that those who are homeless for at least one year are significantly more likely to experience barriers to finding stable housing situations.
• Examples of these barriers to finding and securing a stable housing situation include:
• Persistent mental illness
• Chronic health condition
• Cognitive disability
• Traumatic Brain Injury
• Substance abuse
HOMELESS POPULATIONS
MAXFIELD RESEARCH AND CONSULTING, LLC 50
Summary of Homeless Populations Based on the data presented in this section, following are the key points relating to the potential need/demand for housing to serve the homeless population.
• The majority of the homeless population in Central Minnesota was adults over the age of 18.
• Among this group, most were young to mid-age between the ages of 20 and 50;
• The largest group of homeless was White/Caucasian, followed by African Americans. Minorities are more likely to experience homelessness than white/Caucasians in Central Minnesota.
• The median monthly income of the homeless was $600 per month (2018 Dollars) in Central Minnesota.
• The maximum affordable median rent was $240 per month in Central Minnesota (2018 Dollars) with most people responding that they would be looking for is a one-bedroom unit, followed by studio units.
RENTAL MARKET ANALYSIS
MAXFIELD RESEARCH AND CONSULTING, LLC 51
Introduction The following section of the report analyzes current market conditions for general occupancy rental housing in Pine City and the Primary Market Area. Topics covered include rental housing data from the American Community Survey and detailed information on individual rental developments in the Primary Market Area. Maxfield Research and Consulting identified and surveyed larger rental properties of eight or more units in PMA. For the purposes of the analysis, we classify rental properties into three categories of general occupancy rental properties: market rate (those without income restrictions), affordable (those receiving tax credits or some type of moderate assistance to keep rents affordable) and subsidized (those with income restrictions based solely on a proportional allocation of income to housing).
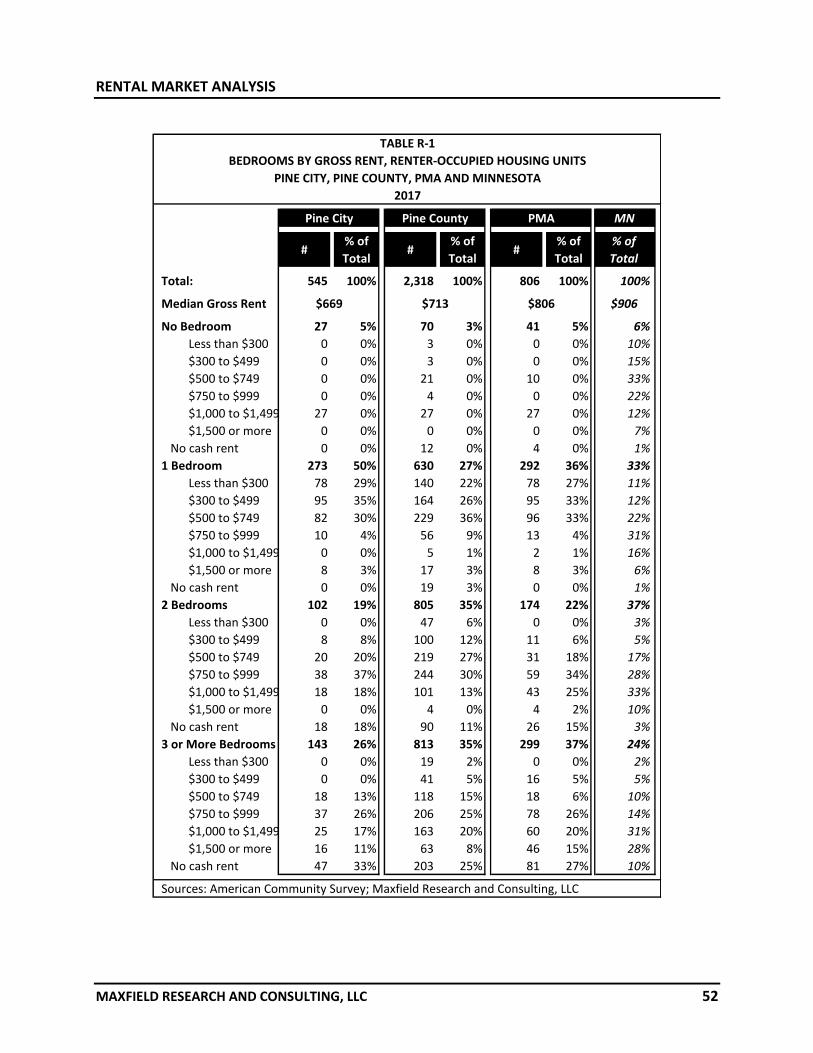
Overview of Rental Market Conditions Maxfield Research utilized data from the American Community Survey (ACS) to summarize overall rental market conditions in Pine City, Pine County and the PMA. The ACS is an ongoing survey conducted by the United States Census Bureau that provides data every year rather than every ten years as presented by the Decennial Census. This data is used to provide more current information on housing than the Decennial Census (every ten years). Table R-1 on the following page presents a breakdown of median gross rent and monthly gross rent ranges by number of bedrooms in renter-occupied housing units from the 2013-2017 ACS in Pine City, Pine County and the PMA, in comparison to Minnesota. Gross rent is defined as the amount of the contract rent plus the estimated average monthly cost of utilities (electricity, gas, and water and sewer) and fuels (oil, coal, wood, etc.) if these are paid by the renter.
• A median gross monthly rent of $669 was reported in Pine City, which was below the PMA ($806). The PMA median rent is 11.0% less than the median gross rent reported in Minnesota ($906).
• An estimated 67.6% of rental units in the PMA are located in Pine City. The most common type of rental unit in Pine City is a one-bedroom unit, which comprises half of all units (50%) and is proportionally higher than the PMA (33%). Three or more-bedroom units are the next most common in Pine City comprising 26% of rental units. In the PMA, two-bedroom units are the most common unit type, comprising 36% of rental units.
RENTAL MARKET ANALYSIS
MAXFIELD RESEARCH AND CONSULTING, LLC 52
MN
#% of
Total#
% of
Total#
% of
Total
% of
Total
Total: 545 100% 2,318 100% 806 100% 100%
Median Gross Rent $906
No Bedroom 27 5% 70 3% 41 5% 6%
Less than $300 0 0% 3 0% 0 0% 10%
$300 to $499 0 0% 3 0% 0 0% 15%
$500 to $749 0 0% 21 0% 10 0% 33%
$750 to $999 0 0% 4 0% 0 0% 22%
$1,000 to $1,499 27 0% 27 0% 27 0% 12%
$1,500 or more 0 0% 0 0% 0 0% 7%
No cash rent 0 0% 12 0% 4 0% 1%
1 Bedroom 273 50% 630 27% 292 36% 33%
Less than $300 78 29% 140 22% 78 27% 11%
$300 to $499 95 35% 164 26% 95 33% 12%
$500 to $749 82 30% 229 36% 96 33% 22%
$750 to $999 10 4% 56 9% 13 4% 31%
$1,000 to $1,499 0 0% 5 1% 2 1% 16%
$1,500 or more 8 3% 17 3% 8 3% 6%
No cash rent 0 0% 19 3% 0 0% 1%
2 Bedrooms 102 19% 805 35% 174 22% 37%
Less than $300 0 0% 47 6% 0 0% 3%
$300 to $499 8 8% 100 12% 11 6% 5%
$500 to $749 20 20% 219 27% 31 18% 17%
$750 to $999 38 37% 244 30% 59 34% 28%
$1,000 to $1,499 18 18% 101 13% 43 25% 33%
$1,500 or more 0 0% 4 0% 4 2% 10%
No cash rent 18 18% 90 11% 26 15% 3%
3 or More Bedrooms 143 26% 813 35% 299 37% 24%
Less than $300 0 0% 19 2% 0 0% 2%
$300 to $499 0 0% 41 5% 16 5% 5%
$500 to $749 18 13% 118 15% 18 6% 10%
$750 to $999 37 26% 206 25% 78 26% 14%
$1,000 to $1,499 25 17% 163 20% 60 20% 31%
$1,500 or more 16 11% 63 8% 46 15% 28%
No cash rent 47 33% 203 25% 81 27% 10%
Sources: American Community Survey; Maxfield Research and Consulting, LLC
TABLE R-1
PINE CITY, PINE COUNTY, PMA AND MINNESOTA
2017
Pine City Pine County PMA
BEDROOMS BY GROSS RENT, RENTER-OCCUPIED HOUSING UNITS
$669 $713 $806
RENTAL MARKET ANALYSIS
MAXFIELD RESEARCH AND CONSULTING, LLC 53
• In Pine City, most monthly rents ranged from $300 to $499 (22.0% of units) and 18.9% of units had rents between $200 and $299. In the PMA, the most common rent range was $300 to $499, (19.2% of units), followed by the $500 to $749 range (18.6%).
• Units with no cash rent, which are often owned by a friend or family member, owned by a charitable organization, or part of a subsidized rental program, represented 11.9% of rental units in Pine City and 13.8% of units in the PMA.
RENTAL MARKET ANALYSIS
MAXFIELD RESEARCH AND CONSULTING, LLC 54
RENTAL MARKET ANALYSIS
MAXFIELD RESEARCH AND CONSULTING, LLC 55
General Occupancy Rental Projects
Analysis of the Primary Market Area’s general occupancy rental market included a survey of five market rate apartment properties (8 units and larger) and four affordable/subsidized communities during February 2020. These properties represent a combined total of 145 units, including 76 market rate units and 69 subsidized units.
At the time of the survey, market rate units and affordable/subsidized units were 100% occupied. The market rate vacancy rate is lower than the industry standard of 5% vacancy for a stabilized market rate rental market, which promotes competitive rates, ensures adequate choice, and allows for unit turnover. Affordable and subsidized units have an equilibrium vacancy rate of 2.0% to 3.0%.
Tables R-2 and R-3 summarize information on market rate properties including unit types, vacancies and pricing. Table R-4 provides information for the subsidized properties.
Market Rate
• Overall, five market rate properties with a combined 76 units were surveyed. Overall, these units had a 100% occupancy rate. This is below the equilibrium vacancy rate of 5.0% for market rate units and suggests that there is pent-up demand for market rate rental units (units without income restrictions). However, rent levels in Pine City are quite low and rent levels for new construction market rate units would likely be much higher than what is currently being charged. Therefore, demand is indicated at the current market pricing, but may be less if new construction units are priced substantially higher.
• Two-bedroom units accounted for the majority of market rate units in the PMA. The breakout by unit type is summarized below.
o One-bedroom units: 18 | 26.5% o Two-bedroom units: 43 | 63.2% o Three-bedroom units: 7 | 10.3%
• The following are the monthly rent ranges and average rent for each unit type: o One-bedroom units: $550 to $765 | Avg. $638 o Two-bedroom units: $575 to $845 | Avg. $794 o Three-bedroom units: $945 | Avg. $945
• One- and two-bedroom units are the most common in the PMA. These units rented for averages of $0.84 and $0.95 rent per square foot, respectively. Three-bedroom apartment rented for $0.95 per square foot.
RENTAL MARKET ANALYSIS
MAXFIELD RESEARCH AND CONSULTING, LLC 56
RENTAL MARKET ANALYSIS
MAXFIELD RESEARCH AND CONSULTING, LLC 57
Year Units/Property Name/Location Built Vacant Comments
PRIMARY MARKET AREAPine City Apartments 2003 12 4 - 1BR Units have full size washer/dryer, full kitchen appliance615 11th Street SW 0 8 - 2BR packages, and wall air conditioning units. Garage included.Pine City Tenant pays for electricity.Northridge Apartments 2006 24 3 - 1BR 700 - 750 $0.91 - $0.98615 Northridge Dr 0 14 - 2BR 850 - 925 $820 - $845 $0.89 - $0.96Pine City 7 - 3BR 1,000 - 1,100 $0.86 - $0.95Lone Oak Manor 1999 8800 2nd St NE 0Pine CityWoodhaven Apartments 1989 24 4 - 1BR $695 - $765 $1.24 - $1.37 Common Space Laundry, wall mounted A/C.1030 Main St S 0 20 - 2BR $775 - $845 $1.02 - $1.11Pine City925 6th Ave Apartments 1979 8 7 - 1BR Water and sewer included. Full kitchen appliance package.925 6th Ave SW 0 1 - 2BR Tenants a mix of young and older adults. Generally steadyPine City occupancy.Total Market Rate Units in PMA/Vacancy 76 0 0.0%
There are no general occupancy affordable housing projects located in the Primary Market Area.
Subsidized.
30% of incomen/a Rural Development.
RENTAL MARKET ANALYSIS
MAXFIELD RESEARCH AND CONSULTING, LLC 58
• The majority of the properties surveyed offer common laundry facilities on-site or have washer/dryer hook-ups in the units. It is also common for properties to include heat, water, and trash in the monthly rent.
Affordable/Subsidized
• There are three subsidized (deep-subsidy) properties in the PMA, These properties provide 69 units of affordable/subsidized housing. There are no affordable (shallow-subsidy) general occupancy projects in the PMA at this time.
• The subsidized properties have a high proportion of one-bedroom (49.3%) and efficiency units (29.0%). Only 21.7% of the subsidized units have two-bedrooms.
• The affordable properties had were 100% occupied, with no units available at the time of the survey.
• All the affordable developments offer common laundry facilities either on-site or in the unit.
• Trash, sewer and water were included in the rent at most of the properties and a few also include heat/gas in the rent payment.
Unit Type No. Pct. Average Size Average Rent Rent PSF
1BR 18 26.5% 760 $638 $0.84
2BR 43 63.2% 832 $794 $0.95
3BR 7 10.3% 1,000 $945 $0.95
Total 68 100.0% 830 $768 $0.93
Sources: Maxfield Research and Consulting, LLC
FEBRUARY 2020
TABLE R-3
SUMMARY OF MARKET RATE RENTAL PROJECTS
PRIMARY MARKET AREA
Note: Averages are calculated only from units where number, size and rents were
available.
RENTAL MARKET ANALYSIS
MAXFIELD RESEARCH AND CONSULTING, LLC 59
Select General Occupancy Rental Projects
Pine City Apartments - MR
Lone Oak Manor - MR
Northridge Apartments - MR
Woodhaven Apartments - MR
925 6th Ave SW - MR Johnson Apartments - Subsidized
RENTAL MARKET ANALYSIS
MAXFIELD RESEARCH AND CONSULTING, LLC 60
North Pine Apartments - Subsidized Hillside Court – Subsidized
As the chart above shows, the plurality of rental units surveyed were built in the 1980s, with the next most active decade being the 2000s. Rental units shown only include buildings with 8 or more units.
HOUSING AFFORDABILITY
MAXFIELD RESEARCH AND CONSULTING, LLC 61
Introduction Affordable housing is a term that has various definitions according to different people, but it is fundamentally the ability to buy or rent based on local housing costs. According to the U.S. Department of Housing and Urban Development (HUD), the definition of affordability is for a household to pay no more than 30% of its annual income on housing (including utilities). Households who pay more than 30% of their income for housing (either rent or mortgage) are considered cost burdened and may have difficulty affording necessities such as food, clothing, transportation and medical care. Generally, housing that is income-restricted to households earning at or below 80% of Area Median Income (AMI) is considered affordable. However, many individual properties have income restrictions set anywhere from 30% to 80% of AMI. Rent is not based on income but instead is a contract amount that is affordable to households within the specific income restriction segment. Moderate-income housing, often referred to as “workforce housing,” refers to both rental and ownership housing. Hence the definition is broadly defined as housing that is income-restricted to households earning between 50% and 120% AMI. Figure 1 below summarizes income ranges by definition.
Naturally-Occurring Affordable Housing (i.e. Unsubsidized Affordable) Although affordable housing is typically associated with an income-restricted property, there are other housing units in communities that indirectly provide affordable housing. Housing units that were not developed or designated with income guidelines (i.e. assisted) yet are more affordable than other units in a community are considered “naturally-occurring” or “unsubsidized affordable” units. This rental supply is available through the private market, versus assisted housing programs through various government agencies. Home values are lower based on a combination of factors, such as: age of structure/housing stock, location, condition, size, functional obsolescence, school district, current market conditions, etc. Because of these factors, housing costs may tend to be lower.
Definition
Extremely Low Income 0% - 30%
Very Low Income 31% - 50%
Low Income 51% - 80%
Moderate Income | Workforce Housing 80% - 120%
Note: Pine County 4-person AMI = $72,400 (2019)
AMI Range
AREA MEDIAN INCOME (AMI) DEFINITIONSFIGURE 1
HOUSING AFFORDABILITY
MAXFIELD RESEARCH AND CONSULTING, LLC 62
According to the Joint Center for Housing Studies at Harvard University, the privately unsubsidized housing stock supplies three times as many low-cost affordable units than assisted projects nationwide. Unlike assisted rental developments, most unsubsidized affordable units are scattered across small properties (one to four-unit structures) or in older multifamily structures. Many of these older developments may be vulnerable to redevelopment due to their age, modest rents and deferred maintenance. Because many of these housing units have affordable rents or sales prices, project-based and private housing markets cannot be easily separated. Some households (typically those with household incomes of 50% to 60% AMI) income-qualify for both market rate and project-based affordable housing. Based on the review of Pine City’s housing stock and the inventory of rental properties; we find a substantial portion of the housing stock would be classified as naturally-occurring affordable housing. Because this naturally occurring affordable housing is available in the private market, households may elect to reside in housing where the cost is less than 30% of their income. These households choose to live below their means and elect instead, to spend or save additional income in other ways. As a result, a portion of naturally occurring affordable housing is occupied by those that could, theoretically, move-up to higher priced housing. This creates a need for additional affordable housing to satisfy the demand from households whose incomes are at a level that would qualify Rent and Income Limits Table R-4 shows the maximum allowable incomes by household size to qualify for affordable housing and maximum gross rents that can be charged by bedroom size in the PMA. These incomes are published and revised annually by the Minnesota Housing and based on the date the project was placed into service. Fair market rent is the amount needed to pay gross monthly rent at modest rental housing in a given area. Fair market rents are used as the standard by which local housing authorities consider the availability of private market units to be considered for potential availability through the Housing Choice Voucher Program. This table is used as a basis for determining the payment standard amount used to calculate the maximum monthly subsidy for families at financially assisted housing. Table R-4 also shows the maximum rents by household size and AMI based on income limits. The rents are based on HUD’s allocation that monthly rents should not exceed 30% of income. For each additional bedroom, the maximum household size increases by two people.
HOUSING AFFORDABILITY
MAXFIELD RESEARCH AND CONSULTING, LLC 63
1 pph 2 phh 3 phh 4 phh 5 phh 6 phh 7 phh 8 phh
30% of median $15,210 $17,400 $19,560 $21,720 $23,460 $25,200 $26,940 $28,680
50% of median $25,350 $29,000 $32,600 $36,200 $39,100 $42,000 $44,900 $47,800
60% of median $30,420 $34,800 $39,120 $43,440 $46,920 $50,400 $53,880 $57,360
80% of median $40,560 $46,400 $52,160 $57,920 $62,560 $67,200 $71,840 $76,480
100% of median $50,700 $58,000 $65,200 $72,400 $78,200 $84,000 $89,800 $95,600
120% of median $60,840 $69,600 $78,240 $86,880 $93,840 $100,800 $107,760 $114,720
EFF 1BR 2BR 3BR 4BR
30% of median $380 $435 $489 $543 $586
50% of median $633 $725 $815 $905 $977
60% of median $760 $870 $978 $1,086 $1,173
80% of median $1,014 $1,160 $1,304 $1,448 $1,564
100% of median $1,267 $1,450 $1,630 $1,810 $1,955
120% of median $1,521 $1,740 $1,956 $2,172 $2,346
EFF 1BR 2BR 3BR 4BR
Fair Market Rent $514 $593 $784 $987 $1,186
Sources: HUD, Novogradac, Maxfield Research and Consulting LLC
TABLE R-4MHFA/HUD INCOME AND RENT LIMITS
PINE COUNTY- 2019
Income Limits by Household Size
Maximum Gross Rent
Fair Market Rent
COMMERCIAL RETAIL ANALYSIS
MAXFIELD RESEARCH AND CONSULTING, LLC 64
Introduction This section of the Study analyzes economic and demographic characteristics of the PMA as the specifically relate to the feasibility of additional retail space being developed at the subject site. Data presented in this section includes daytime population figures, from the U.S. Census Bureau, consumer expenditure patterns and retail surplus/leakage with data from Esri, Inc., and retail space characteristics with data from Costar. Daytime Population Table C-1 shows daytime population figures for Pine City, Minnesota, in 2017 (the most recent data available) and 2012, for comparison. The data is from the United States Census Bureau. Daytime population is estimated based on net population inflow from commuting patterns. As shown in Table C-1, the daytime population in Pine City increased by 3.7% from 2012 to 2017, while the ratio of people living in the selection area and working in the selection area remained flat, falling from 1.59 in 2012 to 1.58 in 2017.
Consumer Expenditure Patterns Table C-2 shows estimated consumer expenditures and average expenditures per households for retail goods and services in the PMA compared to Minnesota in 2020, according to data obtained from ESRI based on Consumer Expenditure Surveys from the Bureau of Labor Statistics.
Net Job Inflow (+) or Outflow (-) 863 895 3.7%Live Here/Work Here Ratio 1.59 1.58 -0.5%
Sources: US Census Bureau LEHD; Maxfield Research & Consulting, LLC
TABLE C-1DAYTIME POPULATION
2012 - 2017PINE CITY, MN
COMMERCIAL RETAIL ANALYSIS
MAXFIELD RESEARCH AND CONSULTING, LLC 65
The table shows the average expenditures per household in the Primary Market Area and the amount spent in Minnesota by product or service. In addition, a Spending Potential Index (SPI) is illustrated for comparison purposes. The SPI is based on households and represents the annual expenditures for a product or service relative to the national average which is given a benchmark index of 100. An SPI of 115 indicates that the average annual expenditure by local consumers is 15% above the national average. In addition, Minnesota is indexed in the table. The average expenditure reflects the average amount spent per household, while the total expenditure reflects the aggregate amount spent by all households. Consumer spending is influenced by market conditions and trends. In times of economic troubles, market conditions drive spending patterns toward convenience and necessities, whereas in times of a booming economy consumer trends feature opportunity and luxury items. Sales of luxury items and other large purchases are generally the first to falter in economic downturns. Two-thirds of the national economy is driven by consumer spending. During the most recent recession, households decreased spending, increased savings, and reduced credit card debt as many households were faced with job losses. In essence, when the housing market began its decline in late 2006 into 2007, consumer spending and consumer confidence followed. The following are key points from the household expenditures table.
• Overall, residents will spend an estimated $27,438,000 on retail goods and services in 2020 in the PMA, excluding housing, finance/insurance, and travel expenditures, as well as vehicle purchases.
• Average annual expenditures (excluding the categories mentioned above) are estimated to be $5,565 per household in the PMA. This compares to an average of $8,384 per household in Minnesota.
• Total average annual expenditures per household are estimated to be approximately $56,722 in the PMA and $82,091 in the Minnesota.
• Compared to Minnesota, it appears that PMA residents are allocating a slightly higher portion of their resources toward housing. Housing expenses account for approximately 23.6% of total consumer expenditures in the PMA, compared to 23.0% in Minnesota.
• Among the retail categories, Market Area spending was greatest for Food at Home (i.e. groceries) at an average of $3,762 per household in the PMA compared to $5,591 per household in Minnesota.
• Spending was also high for Food Away from Home goods and services ($2,560 per household in the PMA) and Entertainment and Recreation ($2,403 per PMA household).
COMMERCIAL RETAIL ANALYSIS
MAXFIELD RESEARCH AND CONSULTING, LLC 66
Minnesota
Expenditures
Total Average AverageCategory ($000's) Per HH Per HH Pine City PMA Minnesota
Goods & Services Index Index
Apparel & Services $6,606 $1,463 $2,266 68 106
Entertainment and Recreation $10,847 $2,403 $3,558 74 109
Nonprescription Drugs $492 $109 $159 76 111
Prescription Drugs $1,320 $293 $409 80 112
Eye Glasses & Contact Lenses $323 $72 $103 79 114
Personal Care Products $1,571 $348 $538 69 107
Child Care $1,460 $323 $548 63 107
School Books & Supplies $473 $105 $166 68 107
Smoking Products $1,412 $313 $451 77 112
Computer Hardware $495 $110 $176 66 106
Computer Software $31 $7 $11 67 104
Pets $2,408 $533 $745 81 113
Food Index Index
Food at Home $16,982 $3,762 $5,591 73 108
Food Away from Home $11,555 $2,560 $3,934 70 107
Alcoholic Beverages $1,802 $399 $610 69 106
Home Index Index
Home Mortgage Payment/Rent $34,778 $7,705 $10,776 77 107
Sources: ESRI; Maxfield Research & Consulting, LLC
ESTIMATED HOUSEHOLD EXPENDITURES BY SELECTED PRODUCT TYPE PRIMARY MARKET AREA
2020
Spending Potential Index
to USA
TABLE C-2 CONTINUED
PMA
Expenditures
Note: The Spending Potential Index is based on households and represents the amount spent for a product or service
relative to the national average of 100.
COMMERCIAL RETAIL ANALYSIS
MAXFIELD RESEARCH AND CONSULTING, LLC 68
Types of Retail Goods and Customer Shopping Patterns The following describes the various types of retail goods and the manner in which customers generally shop for these goods. Because of the significant diversification of retail outlets, some of these categories overlap in certain cases.
Shopping goods are those on which shoppers spend the most effort and for which they have the greatest desire to comparison shop. The trade area for shopping goods tends to be governed by the urge among shoppers to compare goods based on selection, service and price. Therefore, the size of the trade area for shopping goods is affected most by the overall availability of goods in alternate locations. Some examples of shopping goods include furniture, appliances, clothing and automobiles. Convenience goods are those that consumers need immediately and frequently and are therefore purchased where it is most convenient for shoppers. Shoppers as a rule find it most convenient to buy such goods near home, near work or near a temporary residence when traveling. Examples of these types of goods include gasoline, fast food, liquor, groceries, pharmaceuticals, health and beauty aids, among others. Specialty goods are those on which shoppers spend more effort to purchase. Such merchandise has no clear trade area because customers will go out of their way to find specialty items wherever they are sold. By definition, comparison shopping for specialty goods is much less significant than for shopping goods. Examples of these include gift shops, florists, pet stores, art gallery, antiques, home furnishings, textiles (needlework and fabrics), art supplies, books. The home furnishings segment has some overlap between shopping goods and specialty goods. Impulse goods are those that shoppers do not actively or consciously seek. In stores, impulse goods are positioned near entrances or exits or in carefully considered relationships to shopping goods. Examples of these types of goods are: candy and drinks at a dry-cleaning establishment, candy or small novelty items near the cash register at a gift shop, accessories or jewelry at the counter in a clothing store. These may be located within existing stores but would not be a separate establishment.
According to the International Council of Shopping Centers (ICSC), general-purpose retail shopping centers can generally be classified into five major categories, as described below.
Strip/Convenience: The smallest shopping center category, at less than 30,000 square feet. Strip centers are generally an attached row of stores with on-site parking typically located in front of the stores and have a trade area of less than one mile.
COMMERCIAL RETAIL ANALYSIS
MAXFIELD RESEARCH AND CONSULTING, LLC 69
Neighborhood Center: Neighborhood centers are usually anchored by a grocery store or a drug store and have a draw area of one to three miles. This type of center fulfills the day-to-day needs of the surrounding neighborhood, is located at major street intersections, and is typically between 30,000 and 125,000 square feet. Community Center: Community Centers generally range in size from 125,000 to 400,000 square feet and have at least two anchor tenants which may include a general merchandise discount store in addition to a supermarket or drug store. Limited small shop space is occupied by a mix of service-oriented tenants and soft-goods retailers. Community centers typically have a trade area of three to six miles. Regional Center: A regional center is a major shopping area generally with two or more anchor department stores and a variety of additional shops. These centers are generally 400,000 to 800,000 square feet in size and draw customers from a broad geographical area (i.e. five to 15 miles). Super-Regional Center: Similar to a regional center, but larger in size (over 800,000 square feet) and offer a greater variety and number of goods and services. The trade area for a super-regional center is also larger, generally five to 25 miles.
There are also other specialized purpose shopping centers, including lifestyle centers, factory outlets, festival/theme centers, and Central Business District retail. Central Business District retail offerings are typically located on skyways or street fronts and are often smaller than 20,000 square feet due to the smaller size and scope of the market. Visibility and access are primary considerations for retailers seeking a location. Several factors are taken into consideration based on traffic counts and visibility when retailers select a site, including: daily traffic volumes in the area; proximity to public transportation; accessibility for potential customers as well as delivery vehicles; visibility of the store and business signage from surrounding road network; and, the sites proximity to other traffic generators. The following figure summarizes the various types of retail shopping centers, typical size ranges, and typical trade area sizes.
Center Type Size Range (Sq. Ft.) Trade Area Size
Community 125,000 to 400,000 3 to 6 miles Neighborhood 30,000 to 125,000 1 to 3 miles Regional 400,000 to 800,000 5 to 15 miles Super-Regional 800,000 or larger 5 to 25 miles Strip/Convenience Less than 30,000 Less than 1 mile
COMMERCIAL RETAIL ANALYSIS
MAXFIELD RESEARCH AND CONSULTING, LLC 70
Retail Demand Potential and Leakage Table C-3 on the following page present current retail sales and consumer expenditure data for the PMA. The sales information is from ESRI based on household counts. This information lists retail demand (potential sales), retail supply to consumers (retail sales) and provides a picture of the gap between the area’s retail supply and demand. A positive value represents “leakage” of retail opportunity to stores outside of the Primary Market Area. A negative value represents a “surplus,” where more customers are coming into the area for retail goods and services than there are households in the area.
• As depicted in the tables and illustrated in the following graph, leakage exist in most retail industry segments in the PMA. There were leakages in 10 of the 13 categories. There were surpluses in three categories: Gasoline Stations, General Merchandise, and Furniture and Furnishings.
• This data indicates that there is a deficit of retailers in the Pine City PMA able to capture sales from the local market plus attracting non-local shoppers. The retail surplus suggests that establishments in the PMA is able to attract a large number of patrons from outside of its boundaries.
• It appears PMA residents are purchasing neighborhood-oriented retail goods and services at establishments located outside the area, generating “leakage” of retail opportunity outside the city, including; Food Services and Drinking Places, Nonstore Retailers, Miscellaneous retailers, Sporting goods, Hobby, Book & Music stores, Clothing and Accessory stores, General Merchandise stores, Health and Personal Care stores, Food and Beverage stores, Building Materials, Garden Equipment and Supply stores, Electronics and Appliance stores, and Motor Vehicle and Parts Dealers.
----surplus---- ----leakage----
COMMERCIAL RETAIL ANALYSIS
MAXFIELD RESEARCH AND CONSULTING, LLC 71
Demand Supply Retail Gap Surplus/Leakage Number ofIndustry Group (NAICS Code) (Retail Potential) (Retail Sales) (Demand - Supply) Factor Businesses
Total Retail Trade and Food & Drink (NAICS 44-45, 722) $146,134,305 $98,153,253 $47,981,052 19.6 78
Total Retail Trade (NAICS 44-45) $132,927,071 $86,958,327 $45,968,744 20.9 54
Special Food Services $12,122,662 $10,027,884 $2,094,778 9.5 19
Sources: ESRI; Maxfield Research & Consulting, LLC
SUMMARY
EXPENDITURE TYPE
Note: All figures quoted in 2019 dollars. Supply (retail sales ) estimates sales to consumers by establishments, sales to businesses are excluded. Demand
(retail potential) estimates the expected amout spent by consumers at a retail establishment. Leakage/Surplus factor measures the relationship between
supply and demand at ranges from +100 (total leakage) to -100 (total surplus). A positive value represents "leakage" of retail opportunity outside the trade
area. A negative value represents a surplus of retail sales, a market where customers are drawn in from outside the trade area.
TABLE C-3RETAIL DEMAND POTENTIAL AND LEAKAGE
PRIMARY MARKET AREA2020
COMMERCIAL RETAIL ANALYSIS
MAXFIELD RESEARCH AND CONSULTING, LLC 72
Retail Space in the PMA Table C-4 presents data on Retail Space Characteristics by Type on commercial retail properties in the PMA. At the time of this study, there were no retail commercial listings posted, and based on conversations Maxfield Research and Consulting, LLC had with local realtors and public officials, most of the commercial transactions are unlisted. Data shown below therefore does not include current availability, which is estimated to be very low in the PMA. Because overall vacancy data is not centralized, absorption trends are unavailable. Similarly, rental rates are estimates, and are approximate. Data is from Costar, a real-estate news, marketing and data service. Information is deemed to be reliable, but not guaranteed. The following are key points from Table C-3:
• The average rent per square foot for commercial retail space in the PMA is estimated to be $7.90, with a low of $5.16 and a high of $13.89. Storefront/residential space ranged between $7.30 and $10.74, with an average of $9.23 per square foot.
• Storefront Retail/Residential sizes ranged from 1,775 square feet to 12,612 square feet, with an average of 5,614 square feet. Overall, sizes ranged from 700 square feet to 162,000 square feet (Walmart), and averaged 8,685 square feet.
COMMERCIAL RETAIL ANALYSIS
MAXFIELD RESEARCH AND CONSULTING, LLC 73
Average Avg. Rent Per
Type of Retail Space Low - High Size Low - High Square Foot
Auto Dealership 9,127 - 61,385 29,119 $5.16 - $10.64 $6.86
Auto Repair 1,661 - 5,272 3,347 $7.25 - $10.74 $9.07
Sources: CoStar; Maxfield Research and Consulting, LLC.
Size Range Rent Range (Est.)
Notes: Data is from CoStar, and is considered to be reliable but not guarenteed. The majority of the commercial transactions in the PMA
are unlisted, and as such, comprehensive data on those transactions is unavailable. Consequently, direct available square feet (vacant
space) was unavailable, as are absorption trends over time, and rents are estimated.
FEBRUARY 2020
PRIMARY MARKET AREA
COMMERCIAL RETAIL ANALYSIS
MAXFIELD RESEARCH AND CONSULTING, LLC 74
Planned, Proposed Residential and Commercial Developments Maxfield Research interviewed planning staff members in communities in the Primary Market Area to identify housing developments under construction, planned, or pending. At the time of the study, there is one development under construction. In total, there are five residential projects underway as of February 2020. Timber Pines Senior Living is currently under construction, with 103 units of service-based senior living. Elan shores has been proposed but has not been approved. These units would not be competitive with new general occupancy units at the subject site. Hilltop Cottages is a Low-Income Housing Tax Credit (LIHTC) Project with 35 units that is slated to begin construction in early 2020. Two other general occupancy projects are proposed, including the former Feed Mill Site, which is the subject of this report, and housing units above Frandsen Bank. Both projects unit totals are too be determined and will not be included in demand calculations.
Project Name Type Address Status Notes
Timber Pines Senior Living Senior Housing 1550 Northridge Drive NW Under Construction 103 Units, continuum of care
Hilltop Cottages General Occupancy 1345 8th St SW Approved LIHTC 35 units, TIF in progress, 2020 start
Former Feed Mill Site General Occupancy 320 3rd St SE Proposed Subject site of this report
Frandsen Bank & Trust General Occupancy 560 3rd Street Proposed Add apartments above bank
Elan Shores Senior Housing 6 1st St SE Proposed 60 unit senior CoC building.
Don Julio Commercial 1120 Hillside Ave Under Construction Opening in 2020
EZ Electrical Solutions Commercial Pine City Industrial Park Planned Manufacturing
Airport Road Hangar/Range Commercial Pine City Industrial Park Planned Commercial site once cleaned up
Sources: Pine City; Maxfield Research and Consulting, LLC
Residential Projects
Commerical Projects
TABLE P-1
PROPOSED, PLANNED AND UNDER CONSTRUCTION COMMERICAL AND HOUSING PROJECTS
PINE CITY
FEBRUARY 2020
DEMAND CALCULATIONS
MAXFIELD RESEARCH AND CONSULTING, LLC 75
Rental Housing Demand Analysis Tables DMD-1 presents a calculation of market rate general occupancy rental housing demand for the Pine City Primary Market Area. This analysis identifies potential demand for rental housing that is generated from new households and turnover households.
• According to our projections, the PMA household base is expected to decrease in the age groups under 65 between 2020 and 2025. Because the 65 and older cohort is typically not a target market for new general-occupancy market rate rental housing, we limit demand from household growth to only those households under age 65, if however, there are no senior rentals, some seniors may choose general occupancy rental housing.
• We identify the percentage of new households likely to rent their housing based on 2017 tenure data. The propensity to rent for new households is 18.8%. After adjusting household growth by renters, there is no organic growth to 2025 for renter households in the PMA.
• We calculate demand from existing households under age 65 in the Primary Market Area that are expected to turnover between 2020 and 2025. As of 2020, there are 547 renter households under age 65 in the PMA. Based on household turnover data from the 2017 American Community Survey, we estimate that 48.0% of these under-65 renter households will experience turnover between 2020 and 2025.
• We then estimate the percent of existing renter households turning over that would prefer to rent in a new rental development. Considering the age of the PMA’s housing stock, we estimate that 20% of the households turning over in the PMA will desire new rental housing. This estimate results in demand from existing households for 52 new residential rental units between 2020 and 2025.
• We estimate that 25% of the total demand for new rental housing units in the PMA will come from people currently living outside of the PMA. As a result, we find demand for 70 renter households based on household growth and existing households alone between 2020 and 2025.
• Pine City is the largest draw in the PMA, but the subject site will not capture 100% of excess demand. Therefore, we apply a 70% capture rate to the Subject Site. This results in 49 units of rental housing demand capturable at the Site between 2020 and 2025.
DEMAND CALCULATIONS
MAXFIELD RESEARCH AND CONSULTING, LLC 76
DEMAND FROM NEW HOUSEHOLD GROWTH
Household growth under age 65, 2020 to 2025
(times) % propensity to rent¹
DEMAND FROM EXISTING HOUSEHOLDS
Total renter households under age 65, 2018
(times) % of renter turnover 2020-2025²
(times) % desiring new rental housing
TOTAL MARKET DEMAND
Total demand from new HH growth and turnover
(Plus) Demand from outside Primary Market Area
(Equals) Total demand potential for rental housing
(Times) Percent Capturable in at Subject Site (%)
(Equals) Total Number of Units Capturable at Subject Site
Percent Market Rate3
Number
(Minus) Planned and Pending Units at equilbrium
(Equals) Number of Market Rate Units Capturable at Subject Site
Percent Affordable3
Number
(Minus) Planned and Pending Units at equilbrium
(Equals) Number of Affordable Units Capturable at Subject Site
Percent Subsidized3
Number
(Minus) Planned and Pending Units at equilbrium
(Equals) Number of Subsidized Units Capturable at Subject Site
¹ Based on percent renter households under age 65 in 2017
Source: Maxfield Research and Consulting, LLC.
70
25.0%
70%
49
33
0
(Equals) Demand from existing households 52
52
48.0%
20.0%
(Equals) Demand from new household growth 0
547
0(Equals) Number of potential renter hhds from new HH growth
TABLE DMD-1
DEMAND FOR ADDITONAL RENTAL HOUSING
PRIMARY MARKET AREA
2020 to 2025
Primary Market
Area
0
18.8%
3 Based on the pricing of current rental product and household incomes of area renters (i.e. exludes
owner incomes)
² Based on household turnover and mobility data (2017 American Community Survey, Five Year
Estimates)
0
20
0
15
40%
20
30%
15
30%
15
DEMAND CALCULATIONS
MAXFIELD RESEARCH AND CONSULTING, LLC 77
• Based on a review of renter household incomes and sizes and monthly rents at existing properties, we estimate that 40% of the total demand will be for market rate housing, while the remaining 60% of demand is split between affordable and subsidized units. Then, planned and pending and under construction units are subtracted from the total, to give the number of units capturable at the subject site. Hilltop Cottages is currently approved, with 35-units of affordable housing, which will satisfy demand for affordable units during this period.
• Between 2020 and 2025 we find excess demand at the subject site for 20 units of market rate rental housing, no affordable housing because Hilltop Cottages will satisfy demand for this period, and 15 units of subsidized housing.
• Affordable housing is broader term for housing that includes Low-Income Housing Tax Credit (LIHTC) projects, Workforce Housing projects, and generally income restricted housing that is shallow-subsidy. Figure 1 on page 61 shows the Area Median Income definitions and the associated income range. In Pine County the Area Median Income in 2019 is $72,400 for a four-person household.
DEMAND CALCULATIONS
MAXFIELD RESEARCH AND CONSULTING, LLC 78
Retail Development Potential Demand for additional retail space, measured in gross leasable space in square feet, is calculated in the tables on the following pages which combine demand information with supply to calculate the amount of retail space supportable in the Primary Market Area. Sources of data used in the calculations include the Maxfield Research and Consulting, LLC, ESRI, and the Urban Land Institute. The demand calculation begins with household growth projections combined with an estimate of the total expenditures for retail goods and services by Market Area residents, excluding expenditures for automobiles, homes, finance and insurance, education, and travel. We anticipate that the primary source of demand for new retail space on the Site will be generated by household and consumer expenditure growth in the PMA. The following points summarize the retail demand methodology.
• As of 2020, there are an estimated 4,515 households in the PMA. The household base is projected to grow by 104 households between 2020 and 2025.
• Based on a review of consumer expenditure patterns in the PMA, PMA residents will spend an average of $16,703 on retail goods and services in 2020.
• Because of growth in the household base and accounting for inflation, as well as projected increases in household income, PMA residents are expected to increase their overall retail expenditures from an estimated $75.4 million in 2020 to $82.7 million in 2025. Projected increases in households and annual expenditures will result in growth in retail expenditures by PMA residents of roughly $7.2 million between 2020 and 2025.
• As of 2020, total leakage of retail expenditures (including food and drink) from the Trade Area is estimated to be at -19.8%, indicating a deficit of retail sales in the PMA. Incorporating the sales surplus into the total PMA expenditures results in purchasing power that will be retained in the PMA.
• Accounting for inflation, we anticipate that the average retail sales per square foot will increase from an estimated $200 in 2020 to $215 in 2025. The retail sales per square foot reflects an average across neighborhood shopping centers in the Midwest and is based on information published in the “Dollars & Cents of Shopping Centers” prepared by the International Council of Shopping Centers and the Urban Land Institute, with adjustments made by Maxfield Research and Consulting.
DEMAND CALCULATIONS
MAXFIELD RESEARCH AND CONSULTING, LLC 79
• Dividing purchasing power by average retail sales per square foot equates to total demand for about 450,976 square feet of retail space in the PMA in 2020, increasing to about 460,061 square feet in 2025, for a net gain of 9,085 square feet from 2020 to 2025.
• We anticipate that 85% of the demand for retail goods and services on the Site will come from households in the PMA and the remaining 15% will come from sources other than PMA households. Some of these sources include employees working at businesses establishments in the area and daily traffic on the surrounding road network.
• Adding in demand generated by sources other than PMA households results in potential demand for an estimated 10,668 square feet of new retail space in the PMA between 2020 and 2025.
• We estimate that the subject property could capture 20% of the total growth in retail demand in the PMA, resulting in demand for approximately 2,138 square feet of retail space on the Site between 2020 and 2025.
2020 2025
PMA Households 4,515 4,619
(times) Annual Household Expenditures1 x $16,703 $17,905
(equals) PMA Area Expenditures = $75,414,045 $82,703,195
(plus) Approx. % Leakage Outside the PMA2 + -19.6% -19.6%
(equals) Leakage Outside of PMA = -$14,781,153 -$16,209,826
(equals) Total Purchasing Power $90,195,198 $98,913,021
(divided by) Average sales per Sq. Ft. / $200 $215
(equals) Total Retail Space Demand (Sq. Ft.) = 450,976 460,061
Growth in Retail Demand from PMA Households 2020 to 2025
(plus) Demand from outside PMA (15%)3 +
(equals) Potential Demand for Retail Space (Sq. Ft.) in Pine City =
(times) % of Demand Growth Capturable on Site x
(equals) Retail space supportable on Site (square feet) =
2 Leakage is the estimated amount of retail dollars spent outside the Primary Market Area.3 An estimated 15% of the demand will be generated by households from outside the PMA.
Sources: ESRI; ULI; Maxfield Research & Consulting, LLC
TABLE DMD-2
DEMAND FOR RETAIL SPACE
RETAIL MARKET AREA
2020 to 2025
Note: The leakage factor is derived from subtracting the estimated retail sales in the PMA from the total retail
expenditures by PMA residents.
1 Excluding expenditures for home buying, finance & insurance, travel, vehicle sales.
9,085
2,138
20.0%
1,603
10,688
DEMAND CALCULATIONS
MAXFIELD RESEARCH AND CONSULTING, LLC 80
Permanent Supportive Housing Demand Potential Table DMD-3 shows our calculation of demand for individual adults in the PMA. The table calculates demand from homeless households utilizing data from the American Community Survey, 2013-2017 figures, as well as ESRI data on household incomes.
• First, we estimate the number of new age and income qualified households, which is household growth in households under age 65 with incomes below the federal poverty level of $12,760 for a single household in 2020 and estimated to be $14,140 in 2025. Then, we multiply this figure by the number of households estimated to be living along in the Primary Market Area, which was 28.5% in 2017, per the American Community Survey. There is forecast to be no growth among age, income and household type qualified households in the PMA between 2020 and 2025.
• Next, we apply the same calculations to existing households in the PMA. In 2020, we estimate that there are 270 age and income qualified households in the Primary Market Area. It is estimated that 48.0% of these households will experience turnover between 2020 and 2025, which equals 130 households. Then we multiply this figure by 28.5% to account for households living alone, which equals 37 households. A portion of demand will come from outside of the market area. We anticipate approximately 20% of demand for permanent supportive housing will be from households currently residing from outside the PMA, which brings demand to 44 units in the PMA.
• No single site can capture all of the excess demand in a given market. We estimate that the subject site could capture 30% of the excess demand for permanent supportive housing, or 13 units between 2020 and 2025.
DEMAND CALCULATIONS
MAXFIELD RESEARCH AND CONSULTING, LLC 81
Projected unit demand from new type and income qualified HHs, 2020 to 20251 =
(times) Estimated proportion of single-person adult households2 x(equals) Total Existing Households that would be age and income-qualified =
(plus) Additional demand from outside PMA3 +(equals) Projected demand for subject housing from household growth =
Number of existing age and income-qualified HHs in Market Area in 20201 =
(times) Estimated % turnover between 2020 and 20254 x(equals) Total Existing Households Projected to Turnover =
(times) Estimated proportion of single-person adult households2 x(equals) Total Existing Potential Households =
(plus) Additional Demand from outside the Market Area (20%) x(equals) Projected demand for subject housing from existing households =
(equals) Demand from qualified base of existing and new households =
(times) Estimated Capture Rate at Subject Site x(equals) Demand Capturable at Subject Site =
2This figure is based on American Community Survey, 2013-2017.3This figure is based on previous place of residence from American Community Survey, 2013-2017.4We estimate that households attracted to the facility from outside of the PMA will be 20%.Source: Maxfield Research and Consulting, LLC
1330%
44
1Single adults with incomes below poverty threshold in 2019. Growth was calculated using ACS data (five-year estimates).
0
00
48.0%
270
130
44
Demand from Existing Renter Households
7
28.5%37
Total Demand from Household Growth and Existing Single Households that are LTH, 2020 to 2025
28.5%0
TABLE DMD-3ESTIMATED DEMAND FOR PERMANENT SUPPORTIVE HOUSING
PRIMARY MARKET AREA2020 to 2025
Demand from Projected Household Growth
CONCLUSIONS AND RECOMMENDATIONS
MAXFIELD RESEARCH AND CONSULTING, LLC 82
Recommended Development Concept Based on the assessment of market rate rental housing in the PMA, including occupancy rates and the overall performance of comparable properties and new product, we find market support for additional market rate rental units in the PMA, as well as modest demand for commercial retail space. Additionally, demand was found for subsidized and permanent supportive housing. However, given the lack of funding to develop subsidized housing and permanent supportive housing, we are recommending two potential concepts, which are outlined on the following page: 1) a 10-unit townhome development on the site as is, or 2) a mixed-use development with market rate rental units and retail space at the subject site, if additional land could be secured to enlarge the site.
We understand the project would be located at 320 3rd St SE in Pine City, Minnesota. The proposed location is suitable for rental housing and commercial retail and should be well-received by prospective tenants and businesses. The subject site is approximately 0.68 acres (30,000 square feet), however the entire block is 2.13 acres (93,000 square feet). The adjacent A Place for You to the north encompasses three parcels and about 25,500 square feet that could be considered for redevelopment into the subject parcel. As Table CR-1 indicated, the subject site could capture about 70% of the excess general occupancy housing demand in the PMA, combined results in 35 units in a mixed income development. Given the current site acreage of approximately 0.68 acres, a vertical multifamily concept would be needed to accommodate this demand. In addition, a parking structure would be required to accommodate parking minimums that would increase the development cost to the project. Given the current rent structures and development costs it would be financially
PMA Subject Site
Type of Real Estate Product Demand Demand
Market Rate Rental 28 20
Affordable Rental 0 0
Subsidized Rental 21 15
Permanent Supportive Housing 44 13
Total Housing Units 93 48
Commercial Retail Space (in Sq. Ft.) 10,688 2,138
MARCH 2020
TABLE CR-1
DEMAND SUMMARY
PRIMARY MARKET AREA
Source: Maxfield Research and Consulting, LCC
CONCLUSIONS AND RECOMMENDATIONS
MAXFIELD RESEARCH AND CONSULTING, LLC 83
difficult to cashflow a multifamily structure without substantial incentives and/or subsidies. Therefore, a lower density tuck-under townhome concept is recommended. Table CR-2 presents a recommended unit mix, sizes and monthly rents for new market rate rental housing at the subject Site. There are two options presented, a 10-unit townhome concept and a 20-unit market rate concept that would incorporate the existing transitional housing units at “A Place for You”. We recommend that the proposed development target primarily young to mid-age professional singles and couples, as well as empty-nesters. Our review of current market conditions in the PMA suggests that pricing and sizing for new construction rental townhomes or apartments would range as shown in Table CR-2. The proposed project should have rents competitive with or modestly higher than other new properties in the PMA. The building’s rents should reflect its location and in-unit features and building amenities. We recommend two potential developments: the first concept is a 10-unit townhome development that would be constructed on the site as is. The second potential development would be a 20-unit mixed-use development, with all 20-units market rate general occupancy units. This second concept would also relocate the 10 existing beds at “A Place for You” in a separate wing with a separate entrance. Although there is demand for retail space, the financial challenges of a first-floor retail component in a mixed-use development are difficult given the lease rate needed to cover development costs, and as such we do not recommend a retail component in either concept. We believe that given that there were no vacant units among surveyed properties, either concept of market rate rental housing would be well received in the market. Estimated rents in Table CR-1 are quoted in 2020 dollars. For the townhome concept, Maxfield Research recommends monthly rents range from $1,050 to $1,150 for two-bedroom units, $1,250 to $1,350 for three-bedroom units. For the apartment concept, Maxfield Research recommends monthly rents range from $850 to $900 for one-bedroom units, $950 to $1,000 for two-bedroom units, $1,150 to $1,250 for three-bedroom units. Rent premiums should be reviewed at the time of occupancy to ensure competitiveness with current market conditions. Finally, the recommended rents can be trended up by 1.5% annually prior to occupancy to account for inflation depending on overall market conditions.
CONCLUSIONS AND RECOMMENDATIONS
MAXFIELD RESEARCH AND CONSULTING, LLC 84
Newly constructed rental buildings are now requiring tenants to pay most, if not all of the utilities. We recommend the landlord provide professional management, grounds/common area maintenance and refuse removal. The tenant should be responsible for heat, water/sewer, electricity and the following optional fees: telephone, cable or satellite television, and internet. Enclosed garage parking would be included with the tuck-under townhome development, while surface lot parking spots would be free.
Market Rate Multifamily Concept if "A Place for You" Parcels are incorporated into project.1BR 6 - 30% 680 - 735 708 $850 - $900 $1.22 - $1.252BR 10 - 50% 840 - 900 870 $950 - $1,000 $1.11 - $1.133RB 4 - 20% 1,100 - 1,150 1,125 $1,150 - $1,250 $1.05 - $1.09Total/Average: 20 - 100% 680 - 1,150 872 Avg. = $1.13
*Pricing is in 2020 dollars.
Sources: Maxfield Research and Consulting LLC
$1,140
The 10 beds currently at "A Place for You" are not included in the multifamily rent structure above, however, this
assumes the 10 beds would be relocated into a component of the mixed use development.
$990
Range Range Range
TABLE CR-2
MARCH 2020PINE CITY GENERAL OCCUPANCY RENTAL
RECOMMENDED PRICING, UNIT MIX AND SIZES
Unit Mix Unit Sizes Average Rent Range Rent/SF
CONCLUSIONS AND RECOMMENDATIONS
MAXFIELD RESEARCH AND CONSULTING, LLC 85
Suggested Features and Amenities The following bullet points outline the recommended in-unit features and community amenities that should be incorporated into the proposed development. These recommendations mirror the features and amenities that are available at new construction rental apartments. In-Unit Features
• Open floor plans with 9ft. ceilings and over-sized windows maximizing natural light;
• Individual climate-controlled heating with central air conditioning;
• Full stainless-steel kitchen appliance package including refrigerator, stove top/oven, dishwasher, and garbage disposal; microwave oven;
• Hardwood laminate flooring in kitchen and entry foyer or throughout the unit;
• In-unit washer/dryer (full-size stacked or side-by-side);
• Wired for high-speed Internet; recommend wireless system;
• Window treatments Building Features & Amenities The following building amenities are recommended for the subject development: • Building security/surveillance system; • Attractive entrance lobby/reception and waiting area; • Package delivery system for residents; • Trash & recycling room (each floor recommended); • Extra storage (at additional monthly charge);
CONCLUSIONS AND RECOMMENDATIONS
MAXFIELD RESEARCH AND CONSULTING, LLC 86
Projected Absorption Most new general occupancy rental projects in the Twin Cities had a pre-lease rate of about 25% with an average per month absorption of 10 to 12 units. We believe that units in Pine City would lease up at a slower rate, about 2 to 3 units per month. Based on the aforementioned fundamentals, a 10-unit townhomes could be expected to reach stabilized occupancy in 4 months, while the 20-unit apartment building would reach stabilized occupancy in 6 to 8 months. The projected absorption rate assumes that the project would open for occupancy during the peak leasing season which begins in mid to late spring to allow for the maximum exposure to prospective renters and that an effective marketing campaign will be undertaken to generate awareness of the project. If the project comes on-line during the late fall or winter months, absorption will be slower, resulting in a slightly extended period from lease-up to stabilized occupancy. The absorption of the commercial space is somewhat more open ended, however, given that the space would be new and well located, it would be leased within 12-months. Additionally, should a substantial amount of additional product come online beyond what has been identified in this market analysis, the lease-up period would likely be extended.