A METHODOLOGY TO TRANSFORM SMALL AND MEDIUM COMPANIES TO LEAN MANUFACTURING ENTERPRISES IN ECUADOR By Víctor Hugo González Jaramillo A Dissertation Submitted to the Faculty Of the WORCESTER POLYTECHNIC INSTITUTE In partial fulfillment of the requirements for the Degree of Doctor of Philosophy In Manufacturing Engineering By _____________________________ Victor Hugo González Jaramillo April 2014 APPROVED: ____________________________ Dr. Yiming Rong, Major Advisor, Associate Director of Manufacturing and Materials Engineering. Professor of Mechanical Engineering. _____________________________ Dr. Arthur Gerstenfeld, Co-Advisor, Director of Wall Street Project Ctr. Professor, School of Business 1
Transcript
A METHODOLOGY TO TRANSFORM SMALL AND MEDIUM COMPANIES TO LEAN
MANUFACTURING ENTERPRISES IN ECUADOR
By
Víctor Hugo González Jaramillo
A Dissertation
Submitted to the Faculty
Of the
WORCESTER POLYTECHNIC INSTITUTE
In partial fulfillment of the requirements for the
Degree of Doctor of Philosophy
In
Manufacturing Engineering
By
_____________________________
Victor Hugo González Jaramillo
April 2014
APPROVED: ____________________________ Dr. Yiming Rong, Major Advisor, Associate Director of Manufacturing and Materials Engineering. Professor of Mechanical Engineering. _____________________________ Dr. Arthur Gerstenfeld, Co-Advisor, Director of Wall Street Project Ctr. Professor, School of Business
1
ABSTRACT The textile industry is an important foundation of Ecuador's economy because of its
contribution through the generation of jobs for unskilled labor and tight integration with other
industry such as the agricultural industry, livestock, plastics and chemistry. Within this sector
is sub sector Apparel, which is taken as a reference and represents 27% of production in the
Textile Industry. The project aims to develop "A methodology to transform small and
medium companies to lean manufacturing Enterprises." It seeks to define and evaluate
administrative, production and service processes in a textile company which manufactures
garment apparel, define problems in these processes, raise improvement plans and
recommendations for themselves and determine a simulation model to search for the
feasibility of the proposed improvement model designed. Some of the most important
problems identified in the companies in this sector are the following: the high number of
errors in production processes described informally by officials; a poor system for inventory
control of raw materials; work in processes, finished products, production processes, and a
disorganized workplace-office.
2
ACKNOWLEDGMENTS
Thanks to Jesus Christ, my God, my King, my Lord, my Savior.
Thanks to Dr. Kevin Rong for being my guide for this research. He not only served as my
major professor but also encouraged, and challenged me throughout my academic program.
Thanks to Dr. Arthur Gerstenfeld for giving me a direction in Management, and other issues
for this research. He has been my mentor, and given his knowledge to complete my research
successfully.
Thanks to Dr. Richard Sisson, Chris Brown and Mustafa Fofana in my Dissertation
Committee for their support.
Thanks to Billy D. McGowan for giving me his advice in my final written document.
Thanks to Tom Hartvig Thomsen, Janice T. Martin, for their support in the International
House.
Thanks to everyone who support me in my dissertation in Ecuador: Sergio Flores Macías,
Rector at ESPOL, Armando Altamirano, Ex-Vice-Rector at ESPOL, Dr. Leonardo Estrada,
Dean of Social Science and Humanistic Department, Dr. Kleber Barcia, Dean of Mechanical
Engineering Department at ESPOL. Everyone in this group has supporting me through the
research process, never accepting less than my best efforts.
Figure 3.1. Proposed methodology for the research ………………………………. 48
Figure 3.2. Main steps of the methodology to transform SMS companies to lean… 50
7
Figure 3.3. Main steps of the methodology: Process A1, Identify Problems ………. 51
Figure 3.4. Main steps of the methodology: Process A2, Identify/Define Processes. 52
Figure 3.5. Main steps of the methodology: Process A3, Make IDEF0 Diagrams… 53
Figure 3.6. Main steps of the methodology: Process A4, Analyze Possible Solutions 54
Figure 3.7. Main steps of the lean manufacturing guidebook ……………………… 55
Figure 4.1. Products of a pilot SMS company ……………………………………… 56
Figure 4.2. Causes of office process waste ………………………………………….. 59
Figure 4.3. Questionnaire designed for the office employees ………………………. 61
Figure 4.4. Questionnaire designed for the manufacturing employees ……………... 64
Figure 4.5. Steps to follow to develop an IDEF0 diagram for office, and Manufacturing.66
Figure 4.6. IDEF0 modeling of the company: Office and Manufacturing ………...... 68
Figure 4.7. A-0. Manufacturing the garment. Processes involved, reception, management, provision, production, and storage …………………………………………………... 69
Figure 4.8. A1. Reception. Processes involved: customer service, product design, order quotation, billing, and order report …………………………………………………... 70
Figure 4.9. A4. Manufacturing the garment. Processes involved, reception, management, provision, production, and storage …………………………………………………… 71
Figure 4.10. A411. Making the garment. Processes involved: shape and cut the garment, embroidery garment, swage garment, sewing garment, and finished garment ………. 72
Figure 4.11. Analyze Possible Solutions; Steps in the methodology to validate the results.73
Figure 4.12. Picture from the Cutting process activities for a textile company ………. 77
Figure 4.13. Picture from the production process showing WIP from the different activities for a textile company, and the sewing process ………………………………………… 78
Figure 4.14. Layout of the production and office processes showing the different activities for a textile company …………………………………………………………………… 79
Figure 4.15. Areas of waste found in manufacturing …………………………………… 81
Figure 4.16. Main causes of waste ……………………………………………………... 85
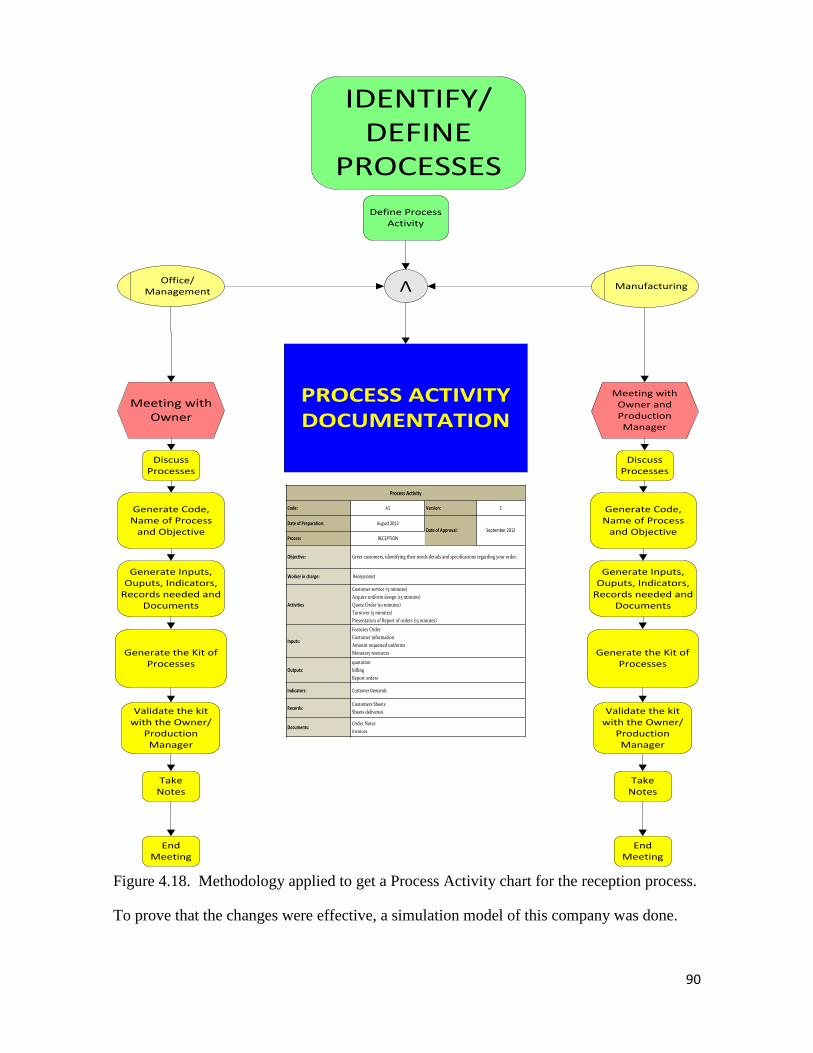
Figure 4.17. Process Activity of the reception process. ……………….……………….. 89
8
Figure 4.18. Methodology applied to get a Process Activity chart for the reception process …………………………………………………………………………………………… 90
Figure 4.19. Simulation model of actual conditions……………………………………. 91
Figure 4.20. Simulation model of future conditions …………………………………… 92
Figure 4.21. Actual conditions. Problems in Standardized work documents, WIP, and quality …………………………………………………………………………………… 93
Figure 4.22. Spreadsheet simulation model using @Risk® to make a comparison between scenarios ………………………........................................................................................ 95
Figure 5.1. Advantages of usig SME Methodology …………………………………….. 99
9
LIST OF TABLES
Table 2-1. Differences between BPR and BPM ……………………………………… 28
Table 2.2. Seven deadly wastes of manufacturing and information management.(Hicks,
2007) …………………………………………………………………………………... 38
Table 4.1. Final expectations taken from the owners of the company taken from Barcia
(2002) …………………………………………………………………………...…….. 57
Table 4.2. Company´s problems identified in manufacturing ……….……………….. 65
Table 4.3. Process chart: Main Office process activities for a textile company ……… 76
Table 4.4. Process chart: Cutting process activities for a textile company …………… 77
Table 4.5. Process chart: Sewing process activities for a textile company …………… 78
Table 4.6. Waste found in office processes …………………………………………… 82
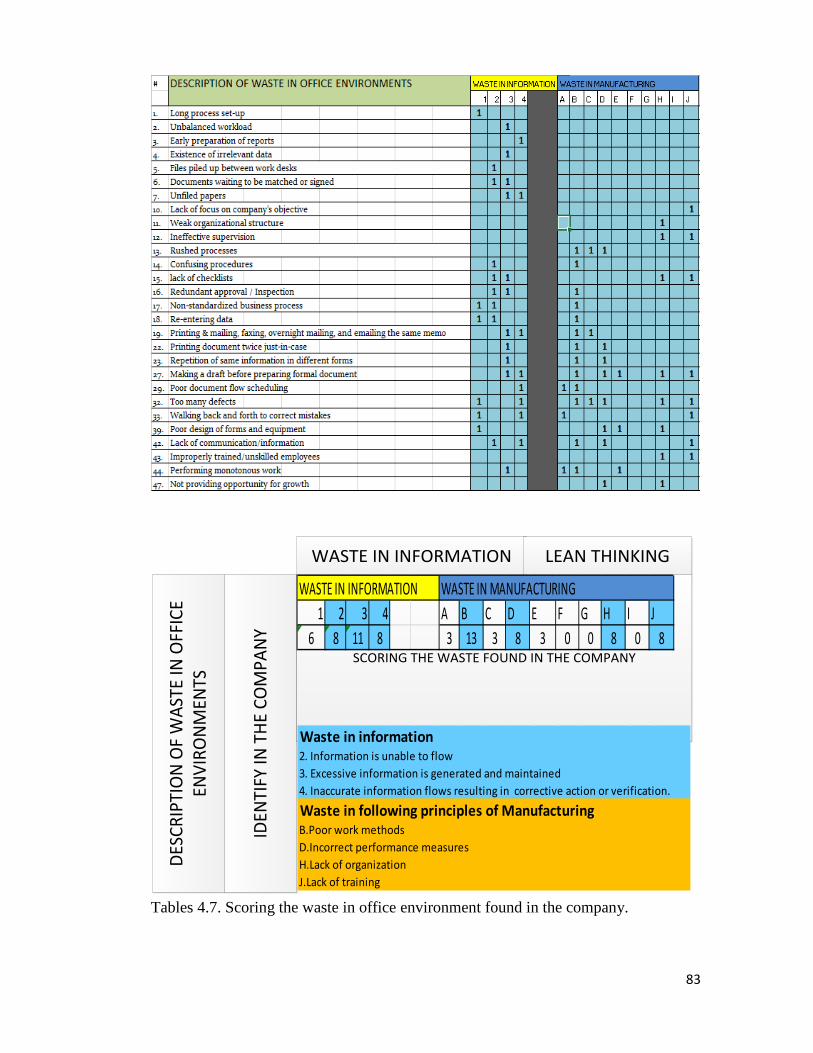
Table 4.7. Scoring the waste in office environment found in the company …………... 83
Table 4.8. Waste found in manufacturing processes and lean techniques to solve them. 84
Table 4.9. Lean Manufacturing Techniques generally used in SMS companies……… 85
Table 4.10. Hierarchy model to select the most suitable lean techniques to be applied. 86
Table 4.11. Final expectations of metrics in office and manufacturing for the textile
enterprise ………………………………………………………………………………. 87
Table 4.12. Final expectations of metrics in office and manufacturing for the textile
Table 4.13. Improvements in production using Simulation Software ………………… 92
Table 4.14. Problems of three SME textile companies in office and manufacturing …. 96
Table 4.15. Table of simulation results for three different SMS textile companies …... 97
10
CHAPTER 1
INTRODUCTION
When studying global production systems, factory environments and the office areas
have a strong relationship of interdependence. So when there is a defect-free production, it
is necessary that the plant has the correct documentation in the production line at the right
time and in the correct amount. This means that you must have a waste-free environment
both in the office and in the area of production.(Boardman & Johnson, July 2001). At the
same time, the office requires the right product or service at the right time and in the right
amount from the factory. In this relationship, for example, quotations and approved purchase
orders are sent to the customers with both product quantity and product delivery time based
on the efficiency of the factory process. Furthermore, the shop floor depends on the efficiency
of document processing to get sales orders on time and to ensure an accurate amount of raw
material when it is needed.
Enterprises want to reduce lead time to the customer, (Boardman & Johnson, July
2001) and this can be achieved when a lean office works with a lean factory, thus increasing
product quality. A company must implement radical changes to compete and grow.
(Underdown, 1997). The importance to implement lean office (Barcia, 2003) and lean
manufacturing("Lean System Implementation," 2012), as a joint strategy, in their business
has been increased, but companies in Ecuador don´t know about these issues. The Methods,
the concepts of lean manufacturing, and lean office are poorly understood in Ecuador, and in
this Dissertation, there will have an opportunity to introduce, and apply different
methodologies for a specific sector of the Small and Medium Enterprises (SME), the textile
sector. Little literature about the business processes has been developed in Ecuador, and
this study will show different results; among them are total lead-time consumed, from
11
receiving the request for the products to delivering the products to the customer, different
processes, documentation, etc.
In this Dissertation, some strategies for the shop floor, such as “5S” called for Sort,
Systematize, Shine, Standardize, Self-Discipline, words, Visual Management, Quality at the
source among others, are related to be applied in a particular textile enterprise (SME). These
methodologies are used extensively and are related to developing a new methodology to
apply in SME´s Ecuadorian companies.
1.1 Introduction to the Ecuadorian Textile Sector.
The textile industry constitutes an important pillar of the Ecuadorian economy due to three
main aspects: the source of employment, the demand for unskilled labor and the integration
of this industry with other industries (agriculture, livestock, industry plastics, chemicals).
The textile industry contributes significantly to the growth of the manufacturing sector
representing approximately 14% of GDP in 2009 this sector contributed about two
percentage points contribution to GDP has remained constant for 10 years (ECB, 2010). Also,
the manufacturing industry of textiles, clothing, and leather goods accounted for 3.5% of the
total manufacturing output in 2007, in turn, constituting an important source of employment.
11.5% of persons employed in the textile manufacturing industry is in the manufacturing of
clothing increases labor to more than 41%. In 2012, it represented nearly 1% of the Gross
Domestic Product of Ecuador. In 2013, the sector represented nearly 555 million dollars,
given an amount of 155 million dollars for manufacturing of apparel.
This shows the importance of this industry as one of the pillars of Ecuador's economy, and,
as a result, is a heavy source of employment. Despite the good performance that the industry
has had in recent years and its impact on employment and government incentives and
safeguards to imports, the textile companies must improve their internal processes to meet
the competition of imported products and the challenge of entering new international
markets, thus generating more jobs and helping to improve the country's economy further.
12
Figure 1.1. Textile Sector in Ecuador, 2013.
Despite the importance of the Ecuadorian textile industry to the economy and job
creation, there are serious problems facing this sector. Within these, there are both internal
and external problems, considering the latter as less controllable due to governmental issues,
legislative, technological, social and economic (Marco, June, 2010).
The lack of investments in technology to increase production volume (Marco, June,
2010), higher prices of inputs (El Comercio, 2010), the wage hike (Ecuador), December
2010), rigidity in the labor system and the new tax rules (HOY, 2008), are just some of the
problems facing this sector in recent years. As the solution to these problems are not available
to the companies but owned by the state, only the government can reduce the negative impact
on contingency plans.
The internal problems of Ecuadorian Textiles affect the productivity and efficiency in
resource utilization for companies in this sector. Some problems that exacerbate the sector
are as follows: a high number of errors in production processes described informally by
(555.8 Million Dollars)
13
officials, a poor system for inventory control of raw materials, work in process, finished
product and production processes, and a disorganized workplace.
The sector's problems, both internal and external, include low competitiveness which
produces substitute products from foreign countries. The causes of many controllable
problems take their roots in the different business processes such as these: Administrative
Process, Manufacturing Process and Process Service.
One of the ways to manage better and simplify the flow of processes for
Administrative, Manufacturing, and Services is to develop an Integrated Definition Methods
(IDEF0) model. The IDEF is a functional model of the said method, which is designed to
plan decisions, actions, and activities of systems, such a specific textile company. “IDEF0
is a widely used technique for the structured analysis and design of systems. Its use in
improving the productivity and communications in computer integrated manufacturing
systems and, more recently, as a tool for business process reengineering efforts are widely
documented.” (David A. Marca, 2006). Meanwhile, the IDEF0 model is also very efficient
in establishing the scope for functional analysis (Yanlei, Wuqiang, Shuang, & Jin'e, 2009).
Basically, the contents of the proposed IDEF0 model define the processes of a particular
manufacturing company in the textile sector.
1.1.1 Ecuador
Ecuador is a country located in the northwest region of South America. It has an
extension of 283 520 km². Its capital is Quito. Ecuador is the eighth largest economy in Latin
America, the seventh in South America. Guayaquil, Quito and Cuenca are the most
populated cities in Ecuador, which has a population of 15.492.264 inhabitants (2012).
Ecuador has a very good performance and is in the group of countries with the highest growth
rate of South America (3.7 %), registering a rate of 5. 0%. ((E.C.B), 2013)
14
The country has the potential to develop industries in a wide variety of sectors such as
oil, domestic production of raw materials and manufactured textile, mining, among others.
Most of the textile companies are located in Guayaquil, Cuenca, and Atuntaqui. This study
was focused on Guayaquil, the second biggest city in this country.
Figure 1.2. Textile Sector in Ecuador (Ecuador, October 4th, 2012),((E.C.B), 2013).
1.1.2 SWOT Analysis
One way to understand and familiarize oneself with the current condition of the small
textile companies in Ecuador is through the use of strengths, weaknesses, opportunities and
threats (SWOT) analysis.
Performing a SWOT analysis is critical to understanding and developing an IDEF0
model. This is because the contents of SWOT analysis are based on the considerations of
research and current issues affecting companies of this sector. Meanwhile, the development
15
of this model will be mostly based on the outcome of the SWOT analysis, problems and other
issues affecting a textile company.
From the opening of markets to the beginning of the 90's, it was thought if the textile
industry did significant efforts toward improved competitiveness, this would be absorbed by
the industry in neighboring countries, and especially by the powerful Colombian textile
industry.
After almost 10 years since opening, reality has shown that virtually all sectors of the
national textile industry, with the exception of exporting raw and the trade balance, shows a
higher growth of exports over imports. Opening a motor proved important to the pursuit of
regional markets. There are now several Ecuadorian companies with permanent penetration
in the textile markets of Venezuela, Colombia and Peru. This has led to a technique of their
marketing strategies through processes, mostly individual management training. Industrial
restructuring, as a phenomenon of transformation of enterprises, has led to the specialization
of the production lines, with the removal of concepts of cost center and its transformation
into generating units, adding value. The specialization has reduced the internal competition
for hard, small local markets, and conversely, has generated promising results in regional
markets.
So given this background, we have the following:
STRENGTHS of the Ecuadorian companies in the textile sector:
• There is exporter knowledge.
• Experience and good penetration in regional markets.
• Production technology is adequate.
• Industrial restructuring.
• Machinery amortized and with their respective maintenance.
• Variety of machinery to meet the expectations of the customer.
16
WEAKNESSES of the Ecuadorian companies in the textile sector:
While the regional market penetration has been developed managerial and marketing
skills, has highlighted the lack of centers training and industrial training for managers and
machine operators.
One of the most serious difficulties that companies have faced is financial aid. It gives
a disadvantage for SME textile companies compared to other companies in neighboring
countries due to difficulty of obtaining fresh capital to finance the operation or renew the
stock of machinery. It has been shown repeatedly that a major difficulty in the textile sector
is business internal policies to seek markets abroad. It is clearly Indicated there is a "Cultural
attitude" against efforts to optimize resources in the export task(Marco, June, 2010).
As the most significant deficiencies have been considered as follows:
• Lack of training programs: middle managers, operators
• Difficulty in providing raw materials and capital goods.
• Locks customs.
• The ECC (Ecuadorian Customs Corporation) fails to establish an efficient and agile in
the treatment of imports.
• High requirement of working capital: difficult access to credit and high
cost of money.
• Process technology textile finishing weak in knowledge and equipment
• Labor relations complicated. Outdated and inflexible labor codes.
• Low willingness to form business groups. There is a weak relationship between textiles
and the clothing sectors.
• Lack of quality manufacturing standards.
• The smuggling and the invasion of products coming from China.
17
OPPORTUNITIES of the Ecuadorian in the textile sector:
The main opportunities in the textile sector have been cited as follows:
• Andean regional market very attractive: by size and benefits tariff.
• An important component of local sales are destined for the borders market.
• Similarities in culture in countries in the region.
• Ability to exploit knowledge of developed exporter.
• The international conventions help manufacturing companies export their products.
1.2 Need for Lean Manufacturing
Manufacturing companies have serious problems with their office processes or
production; for this reason the need for Lean Manufacturing is born. This model will enable
us to achieve the satisfaction of companies toward the customers, because it is focused on
delivering maximum value using the minimal resources necessary, i.e., adjusted.
The creation of this model is emphasized in the reduction of waste in processes such
as these: over-production; waiting time; transport of unnecessary materials; inventory of
finished products, or in the process and correction of defects.
Once the reduction of unnecessary resources is made, the company will be able to increase
productive efficiency in all processes and involve the workers to participate in the concept
of proposing ideas for making things better.
Small and Medium Enterprises (SME) in Ecuador, in the textile sector, are full of waste
in their office and manufacturing processes. In this Dissertation, many textile companies
have been visited, and it has been found the same problems in office processes, and
manufacturing. An example of the office processes is shown in the following figure:
18
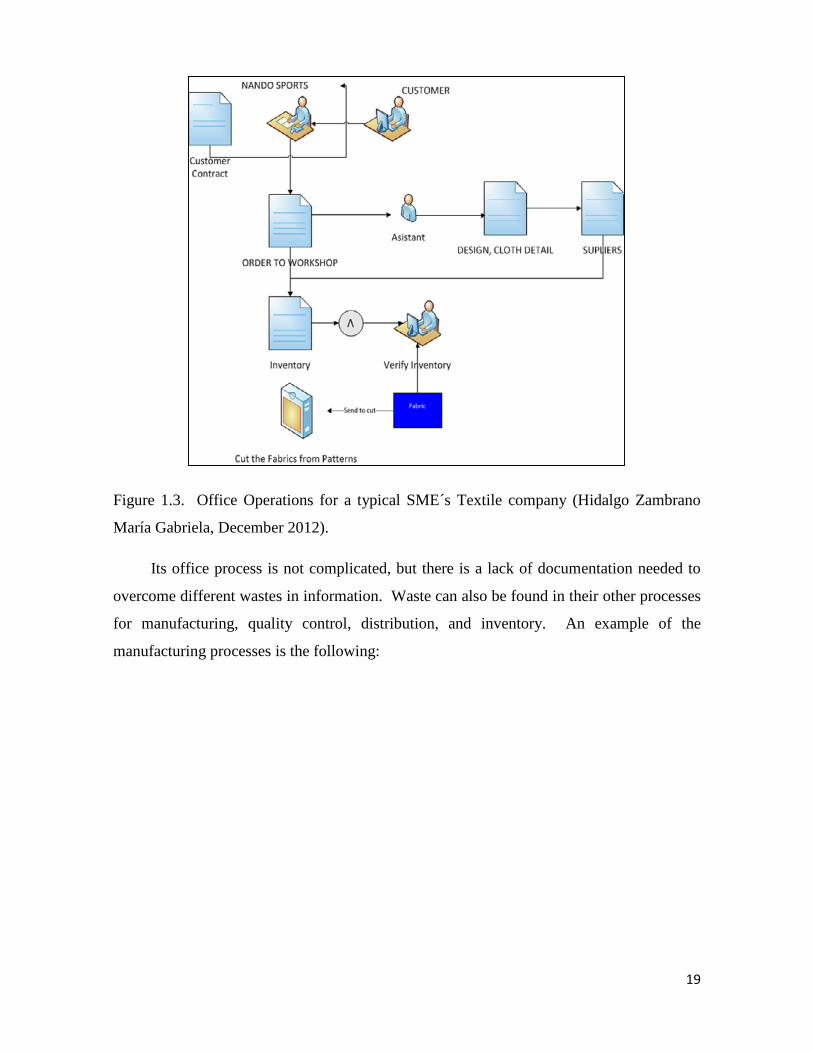
Figure 1.3. Office Operations for a typical SME´s Textile company (Hidalgo Zambrano
María Gabriela, December 2012).
Its office process is not complicated, but there is a lack of documentation needed to
overcome different wastes in information. Waste can also be found in their other processes
for manufacturing, quality control, distribution, and inventory. An example of the
manufacturing processes is the following:
19
IRONED
IRONED
IRONED
SEALINGMACHINE
SEALINGMACHINE
SEALINGMACHINE
SEALINGMACHINE
OVERLOCKMACHINE
OVERLOCKMACHINE
OVERLOCKMACHINE
OVERLOCKMACHINE
OVERLOCKMACHINE
SEAM SEALING
SEAMSEALING
SEAMSEALING
SEAMSEALING
Straight stitch
Straight stitch
Straight stitch
Straight stitch
CUTTING
QUALITYCONTROL
AREA
LABELING AND PACKAGING FINAL PRODUCTS FABRIC LININGFABRIC INVENTORY
STORAGE
OVERLOCKMACHINE
OVERLOCKMACHINE
OVERLOCKMACHINE
DOUBLENEEDLE
DOUBLENEEDLE
DOUBLENEEDLE
DOUBLENEEDLE
Eyeletsmachine
Eyeletsmachine
Eyeletsmachine
Paints & Jeans
Skirts
Blouses
shirts & sweatshirts
Figure 1.4. Typical Manufacturing operations for a SME´s Textile Company.(Llorenty
Macías & Rodríguez Alejandro, 2014)
Medium size companies work as shown in the Figure 1.4, not avoiding different kind
of wastes for the production line, work in process (WIP), movements, time, etc. In this thesis,
everything will be considered to develop the model.
1.3 Thesis Strategy
Integrated Definition (IDEF) – IDEF0 function modeling method as well as
Witness® simulation software, and @Risk® spreadsheet simulation software will be
used to support the development of a model to enhance productivity, and transform to
lean a SME´s textile companies at Ecuador.
20
1.4 PhD Dissertation Objectives and Specific Purposes
1.4.1 Problem Statement
Quality certification needed to get funding from national banks to minimize costs in
the defects, work in process (WIP), work methods, inventories, and low productivity. This
methodology is required to lean a company, design templates, develop processes, and make
the correct documentation. The main goal of this Dissertation is to develop a methodology
to guide the transformation of a SME´s textile company to lean manufacturing giving
designing templates with processes and documentation.
1.4.2 Objectives and Methodology
Today, the IDEF0 model and methodology is an enhanced method to define and
manage companies in different industrial sectors (IDEF, 2000). The objective of this
dissertation is to develop a model to guide the identification and elimination of waste in an
office and manufacturing environment in this sector. This model is an engineering approach
to transform an office, and a manufacturing textile company from a current state to a desired
future condition. This model is developed under the criterion that the lean principles can be
applied to identify and remove waste in all the environments of the company (Administrative,
Manufacturing and Services).
The model should integrate cultural, process and technology strategies to transform the
enterprise(Underdown, 1997). It is an organized collection of activities that describes
“what” must be done to change and improve the enterprise.
As a secondary objective, a field engineer’s guidebook for implementing this
methodology is developed to guide the transformation of the company from a current state
to a lean condition with the application of the developed methodology.
21
The model and the lean guidebook developed in this thesis must consider the office and
manufacturing environment as a whole connected and interdependent system. Literature
review will be taken from international sources, and it must be robust to establish a right
application of the methodology designed.
1.5 Thesis Roadmap
A roadmap is a detailed plan, or explanation, to guide you in setting standards or
determining a course of action. The Dissertation plan scheme is the following:
Figure 1.5. Thesis Road Map.
22
1.5.1 Initial Condition
From a group of textile companies in Ecuador, surveys and analysis have been
conducted to determine the current situation of enterprises in terms of financial, process
analysis, and the evaluation of the overall production process using Value Stream Mapping,
and other lean manufacturing techniques.
1.5.2 Expected Future Condition
The expected future condition is based upon the concept of a lean Enterprise, “A lean
enterprise is an integrated entity that efficiently creates value for its multiple stakeholders by
employing lean principles and practices” (Lean Enterprise Value: Insights from MIT´s
lean Aerospace Initiative, Murman Earll, Thomas Allen). With the processes identified,
there will be an IDEF0 model developed to follow and understand the application of lean
principles in different areas of the company (Jay, 1998). In this model, processes and
different steps of the production will be designed. After developing this model, a simulation
test of the model will be performed to proof its efficiency and performance.
1.5.3 Strategy
For this thesis, the IDEF0 function modeling method is extremely useful. This model
is able to define the different processes precisely, and the elements related in the office and
manufacturing environment. The flexible design of the IDEF0 function modeling enables it
to adapt to almost any type of environment, as the modification of the IDEF0 function
modeling can be easily in order to suit different departments and systems.
1.5.4 Objectives
The objectives that are stated in the road map are required to overcome, and achieve
the expected future condition. For this Thesis, the two main objectives are included as well
as a guideline of the methodology that an analyst should use to transform a SME´s Textile
company.
23
1.6 Thesis Report Organization
Chapter 1 establishes the need for a methodology for transforming an SMS enterprises
to lean manufacturing, and provides background on the companies from the textile industry,
given problems and making a SWOT analysis of the textile sector. The problem statement
and the objective of this research are also provided. A justification of the research approach
is given to clarify understanding about the method used to conduct this research.
Chapter 2 will contribute with a review of current literature concerning lean office and
manufacturing. Different methods to transform enterprise will be assess in this chapter.
IDEF0 is reviewed to provide a foundation for the research tasks. Simulation and other
concepts are covered to provide a foundation for enterprise transformation concepts.
Chapter 3 describes the methodology that is used in this Dissertation. This
methodology consists of 3 steps: Survey analysis, IDEF0 Modelling, and Simulation to proof
that the changes are effective.
Chapter 4 describes the research applications and results. This chapter describes the
tasks conducted in this research. In addition, the interview data is discussed and analyzed.
The IDEF0 diagrams of the final methodology are provided and described in terms that are
easy to understand. Finally, the brief description of the guidebook for the consultant is given.
Chapter 5 describes the final conclusions and recommendations for future research
directions. A summary of the research and accomplishments are provided.
24
CHAPTER 2
LITERATURE REVIEW
This chapter reviews the literature concerning the application of this research, and the
development of methodologies that have occurred over time to transform businesses
worldwide. It will review methods used for this purpose as well as specific techniques for
transforming businesses to lean enterprises.
In the first part, existing methodologies for transforming companies to lean companies are
examined as well as the methods used to raise these methodologies. In the second part,
different types of lean manufacturing techniques that exist, and the parameters for their
business application are assessed. Simulation methodology is presented as alternative to
prove that the techniques used would be effective in this study. A conclusion is made to
advance to the next step, methodology used to develop this research.
25
2.1 IDEF0 as a tool for the design and specifications of methodologies
An IDEF0 methodology is used to improve processes as a tool for Business Process
Reengineering in some enterprises (Al-Ahmari & Ridgway, 1999). A methodology can be
defined as how the research questions are articulated in a particular research solving
questions asked in the specific field of interest (Peter Clough, 2012). A methodology is a set
of methods used for a particular research interest.
2.1.1 Business Process Reengineering (BPR) and Business Process Management (BPM)
The management theory of Business Process Reengineering (BPR) has its beginnings
in 1990 with Michael Martin Hammer. He proposed a process oriented view of Business
Management in which organizations should take the processes that add value to the customers
minimizing the consumption of resources required for delivering their product or service
(Hammer, 1990).
Companies in Ecuador are challenged to compete with foreign companies which offer
better products and low prices. This has required that their operations and business processes
being managed adopt a process-oriented approach as an activity or group or activities that
take input, and provide an output with an increase value. ISO 9000 is beginning to be applied
in textile companies. A process can be defined as “an inherently distributed system: its
activities are performed by various employees, on different locations, using a heterogeneous
set of IT systems” (Smirnov, Reijers, Weske, & Nugteren, 2012) consist of “logically related
tasks performed to achieve a defined business outcome” (Davenport & Short, 1990) p #4;
they have a specific order, an explicit beginning and an end, and the inputs and outputs are
clearly identified (Davenport, 1993). See Figure 2.1.
26
BUSINESS PROCESS
Inputs Outputs
Controls
Mechanisms
Figure 2.1. Business Process Representation
The concept of Business Process Reengineering (BPR) involves innovation, as defined
by (Hammer, 1990) is “the fundamental rethinking and radical redesign of core business
processes to achieve dramatic improvements in critical performance measures such as
quality, cost, and cycle time”. Reengineering in a company is “tossing aside old systems and
starting over. It involves going back to the beginning and inventing a better way of doing
work” (Michael Hammer 2003).
According to Hammer, the idea is to achieve breakthroughs in quality, responsiveness,
flexibility, and cost to compete more effectively and efficiently in a chosen market. It means
obliterate what you have now and start from scratch. Transform every aspect of your
organization to this level (Hammer, 1990).
The main steps to this methodology are the following (Hammer, 1990):
• Organize around outcomes, not tasks.
• Have those who use the output of the process perform the process.
• Subsume information-processing work into the real work that produces the
information.
• Treat geographically dispersed resources as though they were centralized.
• Link parallel activities instead of integrating their results.
• Put decision points where the work is performed and build controls into the process.
• Capture information once and at the source.
27
Business Process Management (BPM) is a “management through processes method
which helps to improve the company´s performance in a more and more complex and ever-
changing environment” (Thiault, 2011). It means that the process has to be understandable,
as well as the management and governance. Then, three steps are accomplished when
implemented BPM, when the process approach is fully understood, Steered, and the active
process governance is integrated (Thiault, 2011).
Key differences are distinguished between BPR and BPM. Aspects as level of change,
time taken from implementation, etc., are shown in the following table (Alagse, 2013):
Table 2-1. Differences between BPR and BPM (Alagse, 2013).
These differences are used to get a better understanding of what method to apply in
the company.
28
2.1.2 IDEF0 Methodology
The Structured Analysis and Design Technique (SADT) is a graphic notation to system
description. This tool has been used in designing computer integrated manufacturing system.
SADT has been applied in many areas such as computer-aided design, computer system
configuration, personnel training, and some other management areas.
SADT system description is called a “model”. An SADT model gives meaning about a
particular system. It provides structure and precise semantics for the natural language
contained in a model, organizing a natural language in a particular and unique way, and
describing a system formerly beyond our ability to explain it well.
IDEF0 is a widely used technique for the structured analysis and design of systems. Its use
in improving the productivity and communications in computer integrated manufacturing
systems and, more recently, as a tool for business process reengineering efforts are widely
documented based on SADT (Feldmann, 1998).
In December 1993, the Computer Systems Laboratory of the National Institute of Standards
and Technology (NIST) released IDEFØ as a standard for Function Modeling in FIPS
Publication 183. The Integration Definition Function Modeling (IDEF0) is a Federal
Information Processing Standard (FIPS) based on the Air Force Wright Aeronautical
Laboratories Integrated Computer- Aided Manufacturing (ICAM) Architecture, Part II,
Volume IV - Function Modeling Manual (IDEF0), June 1981(IDEF, 2000). This standard
describes the IDEF0 modeling language (semantics and syntax), and associated rules and
techniques, for developing structured graphical representations of a system or enterprise. Use
of this standard permits the construction of models comprising system functions (activities,
actions, processes, and operations), functional relationships, and data (information or objects)
that support systems integration.
29
Figure 2.2. Decomposition Overview Reprinted from Information and 183 (1993).
IDEF0 models are composed of three types of information: graphic diagrams, text, and
glossary. These diagram types are cross-referenced to each other (Figure 2.2). The graphic
diagram in the IDEF0 model contains boxes, arrows, box/arrow interconnections and
associated relationships. Boxes represent each major function of a subject. These functions
are broken down or decomposed into more detailed diagrams until the subject is described at
a level necessary to support the goals of a particular project. The top-level diagram in the
30
model provides the most general, or abstract, description of the subject represented by the
model. This diagram is followed by a series of childlike diagrams providing more details
about the subject.
Methodologies developed with the IDEF0 model were a combination of action, methods, and
tools used together to achieve a specific purpose. Examples of these methodologies are in
the office environment (Kleber Barcia, 2002) and Manufacturing environment ("Lean
System Implementation," 2012), and other areas.
These methodologies were developed considering the steps needed for IDEF0 modelling,
which are the following:
Interview Process: The interview is needed to gather information from someone who has
the expertise considered important to develop the model. There are four types of interviews
that might be conducting during the analysis phase of an IDEF project. These interviews are
designed to establish the content of a current operations model, validate the Current
Operations Model and to provide the foundation for a Future Operations Model, establish the
content of a Future Operations Model, and the final interview referring to IDEF
Author/Reader Talk Session in which the author refines the model developed.
Model development: In this state, based on the interview done, the analyst will draw as many
diagrams as needed to describe the system. It would be thought as a brainstorm of the system
in which many attempts to describe it are developed.
Model validation: For the model validation, the IDEF0 model has some procedures to follow,
such as critiquing the model for a group of people, rules, and review procedures. The IDEF0
model requires interaction with the people involved, who worked in the System, starting the
author of the model creating initial diagrams and distributing them for review and comment.
Every person, who receives these diagrams should make written comments and submit them
to the author. The author replies in writing and the cycle will go on until the process is
complete. The results are officially accepted and validated (David A. Marca, 2006).
The IDEF0 is a well-documented methodology with a structure and easy steps to follow.
When it is applied to different company models, it is easy to repeat the steps and follow the
31
structure, giving a greater efficiency and effectiveness (Kim & Jang, 2002; Yanlei et al.,
2009).
In this case, IDEF0 is used as a top-down modelling. All the processes from the top can be
described and understood as the process structure that the company should have. When
analyzing a company for IDEF0, at the end it should be the best practice to analyze it with a
Business Process Management Notation (BPMN) modelling. In the following graphic a
decomposition of the structure of IDEF0 is shown with BPMN applications.
Figure 2.3. Decomposition of IDEF0 and the Workflow view or processes (eFaros, 2014).
32
2.2 Interview and survey as a tool to identify waste in office and manufacturing systems
The qualitative research (Kvale, 1983, page 174) interview is defined as "an interview,
whose purpose is to gather descriptions of the life-world of the interviewee with respect to
interpretation of the meaning of the described phenomena". Face-to-face (FtF) interviews
are the most common. Besides Face-to-Face (FtF) interviews, interviewing by telephone,
and using the internet or computer mediated communication (CMC) tools are popular too.
Beside face-to-face interview and telephone interview the use of new communication forms
such as e-mail and MSN messenger opens new ways for qualitative research workers for data
collection. The type of interview technique chosen by the researcher can depend upon the
advantages and disadvantages, which are linked to every interview technique.
A survey design provides a quantitative or numeric description of attitudes or opinions of a
population by studying a sample of that population (Creswell, 2014, page155). As one form
of control, researchers randomly assign individuals to groups.
The survey is used to identify specific information about a particular issue. To design a
survey, it is needed the following steps(Glasow, 2005):
- Identify the purpose of survey research.
- Indicate why a survey is the preferred type of data collection procedure for the study.
- Indicate why a survey will be cross sectional.
- Specify the form of data collection.
According to Glasow (2005), a survey research is used to answer questions that have been
raised, to solve problems that have been posed or observed, to assess needs and set goals, to
determine whether or not specific objectives have been met, to establish base lines against
which future comparisons can be made, to analyze trends across time, and generally, to
describe what exists, in what amount, and in what context. In this description, a survey can
be used to identify waste and other no-value added activities from the office and
manufacturing.
33
O’Leary (2010) divides interviews into three categories: structured, semi-structured, and
unstructured. Structured interviews contain a specific set of pre-defined questions that need
to be answered by respondents. Semi-structured questions, on the other hand, contain specific
questions, but at the same time, additional questions might be asked depending on the
previous answer in order to clarify some points. Unstructured interviews are fundamentally
different in a way that the numbers and wording of questions will not be pre-defined and
questions will be asked according to circumstances. In the case of being utilized to transform
a company, the best way to use it is with structured interviews which would contain some
pre-defined questions in which different kind of waste should be identified.
Although, face-to-face interviews are time consuming, it should be the best way to get data
from SMEs companies in Ecuador. Comprehensively detailed primary data about culture,
technology, process, and environment can be immediately analyzed. With this method, the
information obtained is detailed and rich, and the additional advantage of it is immediacy of
its data validation.
The interview may be used as a quantitative collection tool; however, it is mostly a qualitative
device. Information, including facts that can be checked, points of view, analyses and
opinions should be clearly distinguished.
2.3 Simulation of traditional office process
The application of Lean Manufacturing concepts outside the manufacturing
environment is new, and they are being applied in the last decade. Generally, 70% of the
labor cost is attributed to activities that are outside the manufacturing environment, such as
entering a customer order, generating an invoice, creating an engineering drawing, being
admitted to a hospital, filling out a medical form for an office, ordering online item, etc.
Because of this, companies have taken into account not only their manufacturing processes
have to be lean, but also the office.
There are currently many deals on specific training given by universities in lean offices;
these are easily found on the web. These companies and universities offer training from the
application of lean principles to a specific simulation process using lean concepts office.
34
The simulations are based on the application of lean principles in different areas of
office, as in the case of the health care industry. Below is a simple application of office
processes, in which the technique read the Value Stream Mapping was applied. In Figure 2.4
you can see the initial and the final Figure 2.5 (Wojtys et al., 2009).
Figure 2.4. VSM before implementing Lean Manufacturing Principles (Wojtys et al.,
2009).
35
Figure 2.5. VSM after implementing Lean Manufacturing Principles (Wojtys et al.,
2009).
36
As a result of this research, the amount of patients was improved from 70 to 89% of
care for patients with a call from an average of 2.5 minutes per call. Also, it increased the
number of patients, and had a significant improvement in the service provided by the health
care unit.
Simulation models are being used to improve efficiency and efficacy for different kind
of companies. To respond rapidly to threats and opportunities when a predictive simulation
of changes is needed to reduce waste and enhance productivity (Group, 2013). With
predictive simulation, a company can prove data models and variability of processes, and
make changes to show its effectiveness.
2.3.1 Waste in information
There is a need to classify the waste of information in order to obtain greater efficiency
in the processing and distribution of information in a firm. That is why the Lean Principles
have been applied in the context of identifying the waste in information management (Hicks,
2007).
Four types of waste were identified by Hicks ( 2007) which is the failure to demand,
demand flow, excess flow and flow flawed. The failure to demand refers to resources and
activities needed to overcome the lack of information. The flow of demand has to do with
the time lost to identify the different elements of information. The excess flow is due to the
excessive information "not necessary" for the process. And the flawed flow includes the
resources and activities required to correct the information is not accurate.
This concludes that the waste is comparable to manufacturing, given in the following
table, Table 2.2:
37
The seven deadly wastes of Manufacturing and Information Mangement
Table 2.2. Seven deadly wastes of manufacturing and information management (Hicks,
2007).
Based on this Table, if there is a classification of different types of waste, it could be
used to identify and remove them within the company.
2.3.2 Methodology for eliminating waste in office environment
Although the lean techniques can be equally applied to all office environments, it is
clear that only automating office processes can obtain the effectiveness to reduce the defects
produced by the office to zero.
The benefits of applying lean office can be summarized in the following:
1. Improved internal communications by applying visual management
2. Better use of space using the concept of 5S
3. The reduction of lead times identifying and eliminating delays between departments
4. Reducing the amount of papers to be processed using software
38
5. Implementation of standard operating procedures
6. Reducing delay times for purchasing new equipment
7. Reducing the meetings needed to complete the work
8. Elimination of long documents by implementing documents "on line"
These benefits can be translated into any extension to the different sizes of companies,
helping to reduce the total lead times for their products ("PRODUCTION MANAGEMENT:
The lean office," 2005).
Different suggestions on how to order the office and get a lean office have been given,
but none of them offer the active user participation and a well-documented track the process
or steps to take to achieve this goal.
In 2003, Kleber Barcia proposes a methodology to eliminate waste in the office
environment. To implement this methodology IDEF0 model is used, whereby the
repeatability is achieved applied to the different office environments. In Figure 2.6 you can
see the steps in your application (Barcia, 2003).
Figure 2.6. Identify and Eliminate Waste in Office Environment (Barcia, 2003).
39
The activities are Define Problem, Identify Waste, Eliminate Waste, and Measure and
Evaluate Improvement. With the identification of the problems to be removed in the office
environment and its definition, information becomes identifiable tangible problems. These
problems are discussed and identified according to the methodology developed by
Underdown (1997) in which culture, process, technology and environment are treated.
Interactively, workers participate to the development of IDEF0 processes identifying and
then eliminating waste measuring their system enhancements. This process can be applied as
often as deemed possible to obtain a high efficiency. The results given in the study were
measurable and encouraging.
2.4 Lean manufacturing
2.4.1 Methodology to lean a manufacturing enterprise
Any methodology to lean an enterprise always reduces waste anywhere in the
company; optimizing any methodology to lean an enterprise always reduces waste anywhere
in the company; optimizing core resources and establishing a corporate culture dedicated to
identifying and continuously fostering customer satisfaction. The principles to transform an
enterprise to lean are the following: Identifying value, eliminating waste, and generating of
smooth flow (Azharul Karim, 2013). The customers create value for the organization based
on needs, pricing, and timing for products or services. So, this customer information and
value transformation create the value stream for the product demanded by customer. These
principles guide the elimination of waste, and the simplification of all manufacturing and
support processes.
Many models and techniques had been developed by researchers to design and evaluate
the performance of lean, all of them evaluate manufacturing or service leanness by evaluating
productivity or operational efficiency. Among these models is the model developed by the
Wichita State University Department of Industrial and Manufacturing Engineering. This
model describes in an effective and precise manner about how to create a lean system in an
enterprise. Inputs, Outputs, Controls and Mechanism (ICOM´s) are explained in its web page
lavishly.
40
The Figures 2.7, and 2.8 describes this model using IDEF0 methodology, showing the
ICOM´s of the each activity and explained extensively the relationship among activities in
its glossary of its web page. (Engineering, 2013)
Figure 2.7. A-0 Lean activity model (model)("Lean System Implementation," 2012).
41
Figure 2.8. A0 Lean system implementation activities ("Lean System
Implementation," 2012).
42
Although the models has been well applied in different case studies in enterprises,
sometimes an incorrect application of lean strategies results in inefficiencies of an
organization’s resources and reduced employee confidence in lean strategies. The success
of any strategy depends upon organizational characteristics, which implies that all
organizations should not or cannot implement a similar set of strategies in their particular
case (Shah & Ward, 2007).
It is crucial to measure the performance to realize the benefits of lean practices. Many
models and techniques have been developed by researchers to evaluate the performance of
lean. Most of the researchers measured manufacturing leanness by evaluating productivity
or operational efficiency.
This Dissertation is intended to apply lean principles in a different manner, following
three simple steps, that is, interviews, IDEF0 modeling, and simulation. With these steps,
finding solutions with a kind of “muda,” or waste, is to be found.
• To cope with specific threats to the business – usually associated with poor relations
with the customer base, or a particular customer, and low productivity because of
culture, process, technology, and environment problems.
• Quality of product or delivery problems
• Requirement to reduce cycle time from order to delivery
• Launching and delivering new products or services
• Developing best value.
Waste elimination process found in this research is related to the lean techniques
developed by Toyota after World War II by modifying Ford’s mass production system to
meet the specific needs of the Japanese market at that time.
In the Figure 2.9, all the lean principles are displayed. Principles well known, such
as Just-in-time, Jidoka, Heijunka, visual management, are shown.
43
Figure 2.9. Lean Principles (Stump, 2008).
One of the principles applied in this Dissertation is the Waste Reduction. Waste
reduction is an important component of the Toyota house, and implies that waste excess
across the company must be eliminated. Three kind of waste are displayed in the Figure 2.10
(muda, Mura, and muri) these wastes are aimed to be eliminated in the methodology made
in this dissertation. .
Figure 2.10. Waste (Muda, Mura and Muri) (Stump, 2008).
44
2.4.2 Simulation as a tool to prove a methodology
Simulation in general is focused on steady state performance of models. Modern simulation
methodologies and software tools are specifically designed to limit transient effects on
measurements. Predictive simulation modeling can be used to prove that a methodology is
effective (Gahagan, 2008; Group, 2013).
Simulation, through the use of simulation software, creates statistically accurate models to
represent the behavior of real life systems in order to subject them to predictive
experimentation. Different scenarios can be proved by implementing solutions to the initial
model validated in the enterprise. The advantage of using this software is that many
questions can be answered without making a disturbance in the real life system.
Simulation has gained importance in the past few years and allows designers to imagine new
systems and enable them both to quantify and observe behavior. Whether the system is a
production line, an operating room or an emergency-response system, simulation can be used
to study and compare alternative designs or to troubleshoot existing systems. Simulation
models show statistical results of a real life system proving that the assumptions done for the
system are correct.
Several researchers in enterprises and journals have studied performance of a real life system
using simulation techniques. In this dissertation, simulation will be used to prove that the
changes needed in a particular system would be effective through eliminating waste and
implementing a documentation process in the enterprise developing IDEF0 modeling
technique. Thus, the user of the model conducts experiments on the model with a view to
understanding what would happen in the real system; this being the one that the model is
intended to represent, whether it actually exists making a scenario analysis or not.
2.5 Conclusion of literature review
To support the steps made in this methodology/Dissertation, which are interviews, and
surveys to identify and eliminate waste in office and manufacturing environments, IDEF0
methodology to define processes and documentation needed for the company to move
45
forward to a lean state, and simulation modeling to prove that the changes needed to
transform the company would actually work for.
For this purpose, although lean manufacturing has been used extensively in the
manufacturing environment, using the lean philosophy in the office environment to get a
better model to exceed the expectations is also needed.
Although many methodologies have been used to change enterprises to lean, in this
dissertation three steps are needed for the transformation of a SME´s to a lean enterprise in
the textile company; these are the following:
1. Lean implementation for documentation
In this step, waste must be eliminated in the company. A proposed model using IDEF0
methodology is designed in order to get a better understanding of the company. In this model,
documentation, such as procedure manual, work instructions, records, templates for
quotation, orders, suppliers, production orders a lean information management system, is
designed.
2. Lean implementation for production system
A process approach using IDEF0 is employed in this step too. All the documentation
to lean the production system is designed. A documentation system to link office
(administrative) and production is proposed. Templates, orders, manuals, work instructions,
records are designed too.
3. Simulation Analysis using Witness® Software and spreadsheet
simulation modeling
Simulation modeling is a valid tool to evaluate changes to be implemented in a SME´s.
A model is constructed and validated to show that the real system would enhance productivity
if the best scenario is applied. Statistical analysis as well as a graphical representation of the
“real world” is presented in this dissertation.
46
CHAPTER 3
METHOD
3.1. Principles
3.1.1. Research Method
The research method used is the survey because it can get relevant information through the types of survey recommended: interview, and questionnaire.
The interview was conducted in 4 SMS´s companies, in which the design of the
questions was about different topics, (Barcia, 2003; Martin, 1995) such as: • The culture • Processes • Technology • Environment The questions made were opened, close ended, and so, the worker can delve into the
various problems facing the company. Once all of the information relevant to the problems of the company is collected, an exhaustive examination was made. Thus, the classification of the waste with the owner´s expectations, main processes, documentation, and lean techniques to be used in the company will give a guide to make improvements needed to transform the company to lean.
With the data, and information, the processes of the company would be designed, and
a simulation model of the company in Witness® would prove that improvement proposed is effective. 3.1.2. Development of the preliminary interview instrument
The Interview instrument is developed considered the SMS Company to be analyzed, types of waste, processes, and documentation. In this case, the components of the interview instrument were the following:
• 13 questions to aid in the identification of waste in the culture area in office
processes - Manufacturing • 23 questions to aid in the identification of waste in the process area in office
processes - Manufacturing
47
• 15 questions to aid in the identification of waste in the technology area in office processes - Manufacturing
• 12 questions to understand the activities in the environment that enterprises are currently using to improve office processes – Manufacturing
In the Appendix C is shown the interview instrument used in this Dissertation, in which
each component was analyzed by members of the Committee, and an expert in the field.
3.1.3 Methodology
The methodology proposed, and used in this Dissertation is represented by the following flow:
Figure 3.1. Proposed methodology for the research.
In the first part of the flow, the survey instrument is designed, and applied. Interview is conducted to the owner, office, and manufacturing employees. Waste is identified, and the
48
IDEF0 modeling process is developed (David A. Marca, 2006; Feldmann, 1998). Processes and documentation are identified, proposed to the company. Lean techniques are analyzed, and then a simulation model to prove that the elimination of waste is designed. This model will show to the company´s owner about the advantages of following the change besought for this methodology. 3.1.4. Research Task The research tasks in this study were the following: 1. Designing the survey instrument to be used to the company. This survey is used to
identify and eliminate waste in office – manufacturing in the company. 2. Applying IDEF0 methodology to identify processes, documentation and waste in the
different departments, following BPMN principles too. A company´s model is designed presenting to the owners the advantages that the company would have if enforcing this model.
3. A simulation model is made to validate if the improvements, with the waste eliminated, include better processes and effective documentation. This model is validated with the current conditions of the company and a future model is made showing a better company in throughput, quality, WIP, and productivity.
3.2 Developing of the methodology using IDEF0 technique
In this methodology, which will be applied for SMS companies in Ecuador to enhance include identifying problems, identifying/defining processes, making IDEF0 diagrams, and analyzing possible solutions.
In the Figure 3.2, the main steps of this methodology are shown,
49
Identify Problems
1A1
Identify/Define Processes
2
A2
Make IDEF0 Diagrams
3A3
Analyze Possible Solutions
4
A4
Used At:
I1. Information about Office and Manufacturing Environment
Author:
C1. Type of Waste Culture, Process, Technology and environment
Notes: 1 2 3 4 5 6 7 8 9 10C2. Vision and Strategies of the company - Owner
Date:
Research Results
M1. Management Team
22/09/2013
Rev:
M2. Questionnaire
READER
22/09/2013
M3. Mfe Workers
DATE
M4. Office Team
WORKING
M5. Lean Techniques
DRAFT
O1. IDEF0 Modeling for Office Processes
RECOMMENDED
A0
O2. IDEF0 Modeling for Mfe Processes
PUBLICATION
Transform the company into Lean
O3. Simulation Results
Project:
A-0
Node:
Title:
Number:
2
Problems Identified
Process/Activity Documentation
Expectations
Page:
CONTEXT:
Validation
Figure 3.2. Main steps of the methodology to transform SMS companies to lean
The transformation of small and medium-sized companies to Lean Manufacturing presents a series of processes that are detailed below:
Identify Problems (A1) Identify/Define Processes (A2) Make IDEF0 Diagrams (A3) Analyze Possible Solution (A4) These steps are important for the company to implement the methodology. They
already allow the identification of problems (A1) that the company has through meetings with the owner, head of production, and the office manager. These people will identify and define processes (A2) in order to make IDEF0 Diagrams (A3) of the company, and visualize a complete picture of the company. Based on these diagrams, and waste identified in the meetings, an analysis of possible solution (A4) is done. In this analysis, any waste found is eliminated using minimal resources with high quality, achieving customer´s satisfaction.
Identified problems is divided as follows in Figure 3.3,
50
Used At:
Author:
Notes: 1 2 3 4 5 6 7 8 9 10
Date:
Research Results
23/09/2013
Rev:
READER
23/09/2013
DATE
WORKING
DRAFT
RECOMMENDED
A1
PUBLICATION
Identify Problems
Perform interviews
1
Perform Questionnaire
2
Project:
A0
Analyze Data
3
I1. Information about Office and Manufacturing Environment
C2. Vision and Strategies of the company - Owner
Node:
C1. Type of Waste Culture, Process, Technology and environment
Title:
M1. Management Team
Number:
M2. Questionnaire
4
Problems Identified
Expectations
Page:
CONTEXT:
Company Information
Surveys
Figure 3.3. Main steps of the methodology: Process A1, Identify Problems.
To make an effective identification of problems, conducting interviews of the managers of the company, using questionnaires to identify waste, and analysis of data acquired are all necessary.
Identify/Define processes is described in Figure 3.4.
51
Used At:
Author:
Notes: 1 2 3 4 5 6 7 8 9 10
Date:
Research Results
24/09/2013
Rev:
READER
24/09/2013
DATE
WORKING
DRAFT
Meet with owner
1
Meet with Office Manager
2
RECOMMENDED
A2
Meet with Production Manager
3
PUBLICATION
Identify/Define Processes
M4. Office Team
M3. Mfe Workers
Project:
A0
M1. Management Team
M2. Questionnaire
Problems Identified
Node:
C2. Vision and Strategies of the company - Owner
Title:
C1. Type of Waste Culture, Process, Technology and environment
Number:
Process/Activity Documentation
6
Page:
General Information
CONTEXT:
Identify of Office Processes
Identify of Production Processes
Figure 3.4. Main steps of the methodology: Process A2, Identify/Define Processes.
Meetings with the owner, office manager and production manager are a success key to identify/Define processes. With these people, all the processes would be identified and defined in a structured manner.
Making IDEF0 diagrams for the company is the following step to transform a SME company to lean. This point allows the author to have a global vision of the processes within the company. The IDEF0 tool brings all the explanatory information about each process (Figure 3.5).
52
Used At:
Author:
Notes: 1 2 3 4 5 6 7 8 9 10
Date:
Research Results
23/09/2013
Rev:
Define Personnel
Roles1
Select Proper Modeling
Parameters2
READER
23/09/2013
Construct an IDEF0
modeling3
Model peer review with the
company4
DATE
Process/Activity Documentation
WORKING
DRAFT
Validation
RECOMMENDED
A3
M3. Mfe Workers
PUBLICATION
Make IDEF0 Diagrams
M5. Lean Techniques
Project:
A0
O1. IDEF0 Modeling for Office Processes
O2. IDEF0 Modeling for Mfe Processes
M4. Office Team
M1. Management Team
Node:
Title:
Number:
8
Rules Defined
Parameters defined
Page:
Model defined
C1. Type of Waste Culture, Process, Technology and environment
CONTEXT:
C2. Vision and Strategies of the company - Owner
Figure 3.5. Main steps of the methodology: Process A3, Make IDEF0 Diagrams.
The steps to follow are defining personnel roles (A31) which will allow the author to identify the important points of the IDEF0 Model; select proper modeling parameters (A32) where it is broadly defined, the objective of the model for well constructing (Authoring) an IDEF0 Modeling (A33) with the purpose of Modeling peer review with the company (A34) in order to be able to use it properly.
Finishing the IDEF0 diagrams, the analysis of possible solutions (A4) must be done (Figure 3.6).
53
Used At:
Author:
Notes: 1 2 3 4 5 6 7 8 9 10
Date:
Research Results
23/09/2013
Rev:
READER
23/09/2013
DATE
WORKING
DRAFT
Apply Lean techniques
1
Apply Simulation Modeling
2
RECOMMENDED
A4
Validate Simulation
Model3
PUBLICATION
Analyze Possible Solutions
O1. IDEF0 Modeling for Office Processes
Expectations
Project:
A0
M5. Lean Techniques
M4. Office Team
Node:
Title:
O3. Simulation Results
Number:
Validation
O2. IDEF0 Modeling for Mfe Processes
10
M3. Mfe Workers
M1. Management Team
Page:
CONTEXT:
C2. Vision and Strategies of the company - Owner
Applied Technical
Applied Simulation
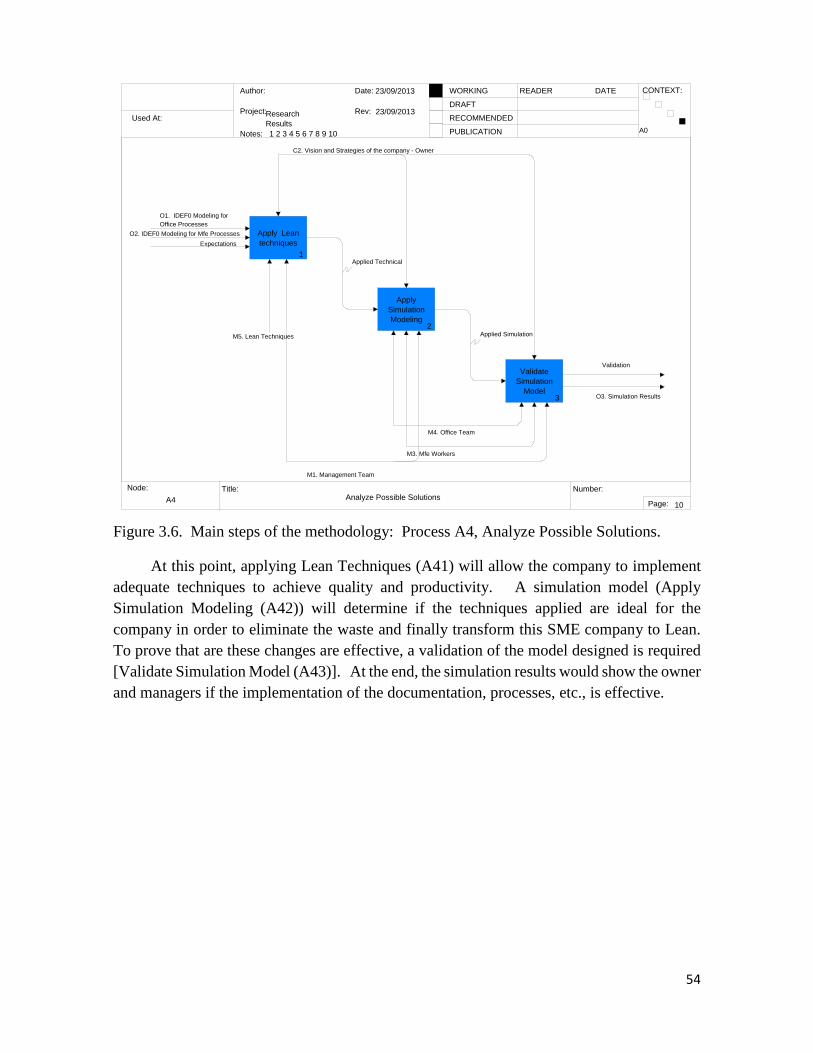
Figure 3.6. Main steps of the methodology: Process A4, Analyze Possible Solutions.
At this point, applying Lean Techniques (A41) will allow the company to implement adequate techniques to achieve quality and productivity. A simulation model (Apply Simulation Modeling (A42)) will determine if the techniques applied are ideal for the company in order to eliminate the waste and finally transform this SME company to Lean. To prove that are these changes are effective, a validation of the model designed is required [Validate Simulation Model (A43)]. At the end, the simulation results would show the owner and managers if the implementation of the documentation, processes, etc., is effective.
54
3.3 Lean Manufacturing Guidebook
The following image shows the guide that was used to implement Lean manufacturing technique:
Identify Problems
Identify/Define Processes
Interview with Questionnaire
Analyze Data
Meet the Owner
Select Office-MF Employees
Interview Office-MF Employees
Review Data Clasify Data Perform Analysis
Meeting with Owner-Office
Manager
Meeting with Owner-
Production Manager
Discuss Processes
Generate Code, Name of Process
and Objective
Validate the kit with the Owner/
Production Manager
Take Notes
End Meeting
Generate Inputs, Ouputs, Indicators,
Records needed and Documents
Generate the Kit of Processes
Make IDEF0 Diagrams
Define Personnel Roles
Authoring an IDEF0 Modeling
Select Proper Modeling
Parameters
Modeling peer review with the
company
Define Author: VHG
Define Expert: Dr. Kleber
Barcia
Define Reader: Owner and Production Manager
Define Commenter: Dr. Kleber Barcia, Dr.
Kevin Rong, Dr. Arthur Gerstenfeld
Review Committe: Owner and Production Manager
Define Purpose Define Viewpoint
Define Type of Breakdown
Define diagrams and texts From Process
activity Documentation
Layout the main path and
secondary path
Validate the diagram with
Company
Make the “Author Reader
Cycle”
Stop Modeling Processes
Reader/Author Review Cycle
Conduct Walkthrough
Sessions
Make the “Author Reader
Cycle”
Stop Modeling Processes
Analyze possible solutions
Apply Lean techniques
Process Observation /
Spaghetti –Workflow
Process Charts / Value Added and Non Value Added
Analysis
Waste Analysis
Solutions Ranked
Implementation Plan
Validate Simulation
Model
Apply Simulation Modelling
List of Waste and Solutions
Develop a Manufacturing/Office(*) model
Figure 3.7. Main steps of the lean manufacturing guidebook.
A guidebook for consultants is developed in Appendix A. In that guidebook, all the steps to follow to transform a SME company are shown in more detail.
55
CHAPTER 4
RESEARCH – RESULTS
In this chapter, a pilot case study is shown. In this case study, an extensively use of the methodology was applied. The main parts of the methodology as the description of the company, surveys, IDEF0 methodology applied to this SMS Company as well as the final simulation is shown.
4.1 Pilot Case Study
4.1.1 Company Background
The company selected was a garment company. It was started in 1998. It has 14 years of experience, and currently has 75 permanent employees and 60 machines. It has clients like IASA Caterpillar and Interagua. The company manufactures the following products (Figure 4.1):
Figure 4.1. Products of a pilot SMS company
56
4.1.2 Interview
Interview with the company´s owner
An interview was conducted with the owner, and some final expectations were determined. These expectations were focused in the office and manufacturing processes. These are shown in the Table 4.1.
Table 4.1. Final expectations taken from the owners of the company, taken from Barcia (2003).
Throughput, cycle time, work in process, and quality are the main concerns of the owner about his company. He wants to improve the four metrics to a minimum of 30 %.
Throughput is the units produced by a time unit, cycle time is the time that the product uses to finish all its operations, WIP is the material stored among the operations, and quality is the amount of defects produced not only in the office, but also in the production processes.
Interviews Office Employees
Designing the Questionnaire
The questions were prepared based on an analysis of the potential waste of the company. Here is a list of different topics and possible waste (Barcia "PRODUCTION MANAGEMENT: The lean office," 2005) 2003; Boardman & Johnson, July 2001; Glasow, 2005; Martin, 1995):
57
o Culture People Processing Defect Waiting Environmental
o Process People Overproduction Processing Waiting Inventory Motion Transportation Environmental
o Technology People Processing Waiting Inventory Environmental
o Environmental People Processing Defect Waiting Overproduction WIP Inventory Transportation
The possible causes of waste office process are long process set-up, an unbalanced workload, early preparation reports, etc. Fifty-five causes were identify by Barcia K., in a study done in US companies in 2003. These causes were used to develop the preliminary interview instrument. This instrument was checked with the owner´s expectations, validated, and applied.
58
Fifty-five causes have been identified (Barcia K. 2003) in a study done in US companies in 2003:
Causes Of Office Process Waste
Long Process Set-Up. Unbalanced Workload. Early preparation of reports. Existence of irrelevant data. Files piled up between work desks. Documents waiting to be matched or signed.
Large file storage area. Copier is too far from desk. Paper and stapler kept away from printer and copier.
Figure 4.2. Causes of office process waste. PhD Dissertation, Kleber Barcia V., 2003 (Barcia, 2003).
59
The following images represent a part detail of the questionnaire used for the interview with office employees:
60
Figure 4.3. Questionnaire designed for the office employees.
61
Interview with the manufacture workers
In the interview with manufacturing employees, the same topics covered in the office employees were used to develop the interview instrument:
• Culture • Process • Technology • Environmental
Design the questionnaire
The questions were prepared based on an analysis of the potential waste of the company. Here is a list of different topics and possible waste in manufacturing (Glasow, 2005; Shah & Ward, 2007):
o Culture People Processing Defect Waiting Environmental o Process People Overproduction Processing Waiting Inventory Motion Transportation Environmental o Technology People Processing Waiting Inventory Environmental o Environmental People Processing Defect Waiting Overproduction
62
WIP Inventory Transportation
Questionnaire
63
Figure 4.4. Questionnaire designed for the manufacturing employees.
64
Some of the questions were designed to be about information, another for information about office and manufacturing processes, and the others related to the final owner´s expectations in Throughput, cycle time, work in process, and quality. Appendix B shows a table about the questionnaire used in the pilot case study.
Results
Based on the information obtained in the interview with the manufacturing employees, a problem identification was made according to the questions and observations conducted in the company, as detailed below:
Table 4.2. Company´s problems identified in manufacturing
65
4.1.3 IDEF0 modeling
IDEF0 modeling is widely used for developing processes, and Business Process Reengineering in different kind of companies. To make an IDEF0 diagram the following steps must be followed(Information & 183, 1993):
1. Define Personnel roles: In this step, author, expert, reader, and commenter are selected.
2. Select Proper Modeling Parameters: To develop a correct model, the purpose, viewpoint, and type of breakdown is made.
3. Authoring an IDEF0 modeling: In this step, diagrams, texts, layouts of the main and secondary paths are designed. The final diagram is validated using the “author reader cycle”(David A. Marca, 2006).
4. Modelling peer review with the company: In this final step, the Reader/Author cycle is made conducting walkthrough sessions with the company. Documentation is selected for each process, and process taps are designed.
Make IDEF0 Diagrams
Define Personnel Roles
Define Author: VHG
Define Expert: Dr. Kleber
Barcia
Define Reader: Owner and Production Manager
Define Commenter: Dr. Kleber Barcia, Dr.
Kevin Rong, Dr. Arthur Gerstenfeld
Review Committe: Owner and Production Manager
Select Proper Modeling
Parameters
Define Purpose
Define Viewpoint
Define Type of Breakdown
Authoring an IDEF0 Modeling
Define diagrams and texts From Process
activity Documentation
Layout the main path and
secondary path
Validate the diagram with
Company
Make the “Author Reader
Cycle”
Stop Modeling Processes
Modeling peer review with the
Company
Reader/Author Review Cycle
Conduct Walkthrough
Sessions
Make the “Author Reader
Cycle”
Stop Modeling Processes
IDEF0 Model for Office Processes
IDEF0 Model for
Manufacturing Processes
V
Figure 4.5. Steps to follow to develop an IDEF0 diagram for office, and Manufacturing.
66
Outputs: IDEF0 for The Company: Purpose and viewpoint (1) In the next picture, IDEF0 diagram of a Textile Company is presented, which contains
information on the purpose, inputs, outputs, mechanisms and controls on the manufacturing process around viewpoint of Author.
We can see that the textile company has: Inputs: o Customer requirements o Financial Resources Outputs: o Finished product Mechanisms: o Human Resources o Machinery o Raw Material Controls: o Product features o Budget o Customer Demands
67
Used At:
Author:
Notes: 1 2 3 4 5 6 7 8 9 10
VICTOR HUGO GONZALEZ
Date: 11/09/2013
Rev:
READER
11/09/2013 OWNER
DATEWORKING
DRAFT
RECOMMENDED
A-0
PUBLICATION
MANUFACTURE THE GARMENT
Purpose:
Viewpoint:
Project:
Identify the processes in a Textile company, so a guidebook for this kind of company would be developed.
Author: VICTOR HUGO GONZALEZ
MANUFACTURE THE GARMENT
0
A0
Customer Requirements
Node:
Financial Resources
Title:
Budget
Number:
Customers Demands
1
Product Delivery
15/08/2013
Human Resources
16/08/2013
Page:
Raw Materials
CONTEXT:
Machinery
Product Features
Figure 4.6. IDEF0 modeling of the company: Office and Manufacturing
IDEF0 Main Processes
In the next figure, an IDEF0 of the Main Process of the Textile Company indicating distribution the processes of Office, and Manufacturing is presented, which contains information on the main processes of the company is shown:
• Reception – Receive order • Management – Manage order • Provision – Supply Raw Materials • Production – Make Garment • Storage – Layup Garment
68
Receive Order
1A1
Manage Order
2A2
Supply Raw Materials
3A3
Make Garment
4A4
OWNER
Layup Garment
5A5
Customer Requirements
Used At:
Financial Resources
Author:
Budget
Notes: 1 2 3 4 5 6 7 8 9 10
Customers Demands
Date:
VICTOR GONZALEZ
Human Resources
11/09/2013
Rev:
Raw Materials
READER
11/09/2013
Machinery
DATE
Product Delivery
WORKING
16/09/2013
DRAFT
RECOMMENDED
A0
PUBLICATION
MANUFACTURE THE GARMENT
Suppliers
Project:
A-0
Garment quoted
Budget to buy
materials
Materials ready for
production
Node:
Product Packaged
Title:
Number:
2
Order
Inventory
Payment Method
Page:
CONTEXT:
Product Features
Figure 4.7. A-0. Manufacturing the garment. Processes involved, reception, management, provision, production, and storage.
Description of Main Processes The priority of the company is to satisfy customer demands, which sells identifies and
develops the function of each of the employees of the company, the machinery that will be needed, the trainings will be provided and quality controls.
This operation starts a chain order entry at reception (A1) is performed by the Assistant
Front to hand the order to proceed with data entry and analysis administration quote (A2), it will be delivered to supply (A3) the report of materials required and the budget for each order. Supply will be responsible for inventory analysis, issuing purchase orders to suppliers and receiving the raw material for the production (A4) of the rules, which involve human resources and machinery for cutting, embroidery, printing, stitching and finishing, which will be supervised by the production and quality manager. Having completed the Jeans duly inspected the product moves Storage (A5) where they will be ready for delivery to customer garments.
69
Outputs: IDEF0 Office Processes In the next picture, there will be presented on IDEF0 Office Process of the Textile
Company indicating distribution the processes of Office, which contains information on the following:
o Customer Service – Serve customer. o Product Design – Design product. o Order Quotation – Budget order. o Billing – Bill order. o Order Report – Make order.
OWNER16/09/2013
Used At:
Author:
Notes: 1 2 3 4 5 6 7 8 9 10
Date:
VICTOR HUGO GONZALEZ
11/09/2013
Rev:
READER
11/09/2013
Serve Customer
1
Design Product
2
DATE
Budget Order
3
Bill Order
4
WORKING
Make Order
5
DRAFT
Customer Requirements
RECOMMENDED
A1
Financial Resources
PUBLICATION
Reception - RECEIVE ORDER
Budget
Customers Demands
Project:
A0
Garment quoted
Receptionist
Node:
Title:
Number:
4
Customer Requirements
Order Characteristics
Page:
CONTEXT:
Drawing Sketch
Final Drawing
Financial Resources
Order Contract
Client List
Figure 4.8. A1. Reception. Processes involved: customer service, product design, order quotation, billing, and order report.
Office Process Description The operation in reception before sending to Management starts with Customer Service
(A11) with the auxiliary reception, which is obtained from customer details, identifying needs and design specifications (A12) they want to purchase. Once the design is done, dimensions and size of the product, we proceed to order quotation (A13) products and, once
70
agreed, the client will provide the data and billing (A14), and the report is made (A15) to be sent to administration.
IDEF0 Production Processes In the next picture the IDEF0 Process of the Textile Company will be presented,
indicating distribution of the production processes, which contains information on these:
• Make the garment • Control Quality • Pack the Product
OWNERUsed At:
Author:
Notes: 1 2 3 4 5 6 7 8 9 10
Date:
VICTOR HUGO GONZALEZ
11/09/2013
Rev:
READER
11/09/2013
DATE
WORKING
18/09/2013
DRAFT
RECOMMENDED
A4
PUBLICATION
Production - MAKE GARMENT
Make the Garment
1A41
Control Quality
2A42
Project:
A0
Pack the product
3
A43
Raw Materials
Node:
Machinery
Title:
Materials ready for production
Number:
Product Packaged
10
Customers DemandsProduct Features
Quality Standards
Page:
CONTEXT:
Human Resources
Garment Made
Aproved Product
Figure 4.9. A4. Production. Make the Garment, Control Quality, and pack the product. This is done starting from the preparation, or making the garment (A41) with design
ideas proposed by the customer; once the garment is made (Figure 4.9), a quality control process is done (A42) supervised by the Head of Production and Quality Control, inspecting every garment to meet quality standards and customer requirements. Once accepted, the product moves to the packaging area (A43) where each product is packed according to customer specifications.
71
Used At:
Author:
Notes: 1 2 3 4 5 6 7 8 9 10
Date:
VICTOR HUGO GONZALEZ
17/09/2013
Cut garment
1A411
Embroidery garment
2A412
Rev:
READER
Swage garment
3A413
Sew Garment
4A414
17/09/2013
Finish garment
5A415
DATE
Materials ready for production
WORKING
Product Features
DRAFT
RECOMMENDED
Human Resources
A41
PUBLICATION
Machinery
Make the Garment
Garment Made
Project:
A4
Node:
Title:
Mold Patterns
Number:
12
Embroidered Pieces
Stamped Parts
Uniforms Sewn
Page:
CONTEXT:
Raw Materials
Figure 4.10. A411. Make the garment. Processes involved: cut the garment, embroider garment, swage garment, sew garment, and finish garment.
Specific details of the IDEF0 developed in different textile companies are in the
Appendix B, in which all the processes are explained in detail.
72
4.1.4 Simulation of proposed solution
In the following flow, simulation represents the application of the Lean techniques.
Figure 4.11. Analyze Possible Solutions; Steps in the methodology to validate the results.
4.2 Waste identification for office processes
According to interviews with office employees, the following wastes are identified in the process according to the topics set out above:
• Culture Problems o Communication o Training o Supervision in documents o Not Standards o Not Quality Standards
73
• Process Problems o Do not know the processes o No Order o No clear procedures o Documents waiting too long o No Standards o No Quality Standards • Technology Problems o Focused in efficiency and cost o No quality orientation o No templates for processes o Have computers but not expertise o No standards o Not quality standards • Environmental Problems o No recycling o Auditing without notice o No Energy plan
It can also be identified waste in the office environment:
• Information is unable to flow. • Excessive information is generated and maintained. • Inaccurate information flows resulting in corrective action or verification. Different type of waste can be identified for the information generated in the company.
In this case, the information cannot flow because it has not been generated; unable to flow because it cannot be identified or shared. Excessive information would be generated and maintained or inaccurate information flows resulting in inappropriate downstream activities, corrective action or verification. (Hicks, 2007)
4.3 Office Model: Proposed solution
Change to make Below are the possible changes that the company should make in the textile processes office: Office o Activity/ Process Templates. o Templates using same format for contracting different office documents. o 5S to apply in the office environment.
74
4.4 Current state of the company
In the interview with the owner, s/he allowed knowing the current state of the textile company. The topics discussed to obtain information and perform the analysis are:
• Company Advantages • The expectations of the end results • Processes Office
These are detailed below.
4.4.1. Company Advantages
In the interview with the owner, a SWOT (Strengths, Weakness, Opportunities and Threats) analysis was done. In this workshop, the company´s owner indicated the company has the following advantages:
Financial Advantages: • Access to capital when required • Degree of utilization of its borrowing capacity • Ability of the company to exit the market easily • Profitability, return on investment • Liquidity Competitiveness Advantages: • Stronghold with suppliers and availability of inputs. • Customer focus. • After sales programs. Technological Capabilities: • Technical skill in manufacturing. • Flexibility in manufacturing. Advantages in Human Resources: • Expertise.
75
4.4.2. Office and Manufacturing Processes
An office process chart was designed by a focus group with the company, and the following is the description of the activities to make a sweater or a particular garment:
Table 4.3. Process chart: Main Office process activities for a textile company.
In this chart, there is a problem with the activities 8 and 9, which are “receiving order from suppliers” and “sending the order to cut the fabric”. These two activities are the main problems in the office.
Activities for the production process
Once the office process is done, the manufacturing of the garment begins, and the activities for the different operations are designed with the owner and production manager, these are the following; cutting, and sewing processes.
The cutting process is done following the steps shown in the Table 4.4,
76
Table 4.4. Process chart: Cutting process activities for a textile company.
Following the Process chart, identifying Non-Value Added and Value Added activities, a lot of Work in Process is done (WIP). All the material cut is stored besides the cutting area. The following pictures were taken inside the company. As seen, there is a lot of WIP in the company.
Figure 4.12. Pictures from the Cutting process activities for a textile company.
77
The Sewing process is done following the steps of the Table 4.5,
Table 4.5. Process chart: Sewing process activities for a textile company.
All the material generated in this process is stored as WIP in the production plant as show in the Figure 4.13.
Figure 4.13. Picture from the production process showing WIP from the different activities for a textile company and the sewing process.
78
Following the sewing process, a quality and packing process is observed. After these processes, an order is complete.
Making a primary observation of the company, it shows how the company works. In
this particular textile company, a spaghetti diagram gives the idea of the disorder of its processes. The company urgently needs a reengineering and documentation for its processes. The following figure shows how the operations are done.
Figure 4.14. Layout of the production and office processes showing the different activities for a textile company.
79
4.5 Waste Analysis
From the interviews done for the owner, managers, and employees, a waste analysis was conducted to search for the different kinds of waste found in the pilot case (Textile Company). The waste analysis was divided in two parts: office processes and manufacturing processes.
4.5.1 Waste analysis results and solutions
Office Processes
The analysis of the information obtained from the interview with the office employee was classified following the four main expectations from the owner which are throughput, cycle time, work in progress and quality. Each one with a measure from the office and manufacturing processes.
Waste in Information is classified by Hicks as follows (2007).
o Information that cannot flow because it has not been generated. The process is broken. o Information is unable to flow. It cannot be identified. o Excessive information is generated and maintained excessive information flows. o Inaccurate information flows demands corrective action or verification. Based on this study, office waste was classified. Among several studies in
manufacturing and service systems, the lean thinking process must be applied to eliminate waste, and enhance productivity.
The Lean Thinking philosophy, the value, value stream, flow and perfection is classified following three main aspects (Womack, 1996)
To identify waste in the office environment, questions from the questionnaire were designed considering two main aspects:
1. Type of waste: Culture, process, technology, and environment (Martin, 1995). 2. Main expectations in Throughput, cycle time, work in progress, and quality
(defects)(Barcia, 2003).
Detailed results from the questions asked to the owner, office, and manufacturing employees are presented in the Appendix B. Measures were done in throughput, cycle time, work in progress, and quality. A detailed IDEF0 model of the company processes was analyzed, and a description of some waste of the company was identified. Main waste problems in the office processes are caused by overproduction, defects, processing, waiting, people, motion, transportation, and environment. Waste found in the office is shown in Table
80
4.6. With this waste, the main causes of waste in this company was identified based on a scoring model (Table 4.7).
Areas of Waste
According to Melton, 2005 (Rawabdeh, 2005), waste was divided in 3 dimensions: Men, machines, and materials. Overproduction and machines are caused by men and machines, and the defects would be caused by machines and materials.
Figure 4.15. Areas of waste found in manufacturing. Taken from (Ramunė Čiarnienė,
2012).
These areas were considered when naming some of the waste found in the company. Some of the causes found are the following:
A. Poor Layout B. Poor work methods C. Lack of adherence to process D. Incorrect performance measures E. Poor planning/forecasting F. Poor Supplier quality G. Long Setup time H. Lack of organization I. Lack of preventive Maintenance J. Lack of training
With the description in office environments (Kleber Barcia, 2002), the areas of waste
in manufacturing identified (Ramunė Čiarnienė, 2012), and the specified causes for waste previously defined, a scoring model was developed to classify the main causes of company´s waste. This model began with the classification of the different kind of waste found in the
81
company, then taken the classification of waste of information given by Hicks ( 2007) and the lean thinking philosophy.
Table 4.6. Waste found in office processes.
82
WASTE IN INFORMATION LEAN THINKING
DESC
RIPT
ION
OF
WAS
TE IN
OFF
ICE
ENVI
RONM
ENTS
IDEN
TIFY
IN T
HE C
OM
PANY
SCORING THE WASTE FOUND IN THE COMPANY
WASTE IN INFORMATION WASTE IN MANUFACTURING1 2 3 4 A B C D E F G H I J
6 8 11 8 3 13 3 8 3 0 0 8 0 8
Waste in information2. Information is unable to flow 3. Excessive information is generated and maintained 4. Inaccurate information flows resulting in corrective action or verification.
Waste in following principles of ManufacturingB.Poor work methodsD.Incorrect performance measuresH.Lack of organizationJ.Lack of training
Tables 4.7. Scoring the waste in office environment found in the company.
83
Final results from the company show that there is waste in information that is unable to flow, excessive information is generated, and inaccurate information is flowing in the company. All this waste of information is because of poor work methods, incorrect performance measures, lack of organizations, and lack of training. An implementation plan for the office is done for these purposes.
Manufacturing Processes
Following the same methodology used to analyze the waste in office environments and the four main expectations from the owner, which are throughput, cycle time, work in progress and quality, it was designed a scoring model to analyze, and prioritize. Waste was classified in culture, processes, technology, and environmental.
From the questionnaire, a classification of waste was found as shown in Table 4.8. In this table, the main causes of the waste are in culture and technology. In the Figure 4.16, a graphic of the main causes of waste is presented.
Table 4.8. Waste found in manufacturing processes and lean techniques to solve them.
Renewing the staff constantlyReduce the constant firing, to staff training stable 3, 9, 11
No exploits the abil ity of the employee.Encourage staff and operate as necessary and what is proposed skil led. 2, 3, 7,9,13, 14
Lack of selective hiring process.Create a selection process to avoid the constant resignation or dismissal. 2
Lack of knowledge of the company by managers.Employees do not share the same goals of the manager.Lack of Business Design
Lack of supervision in the process.Train employees to do the function of supervisor, for a better process. 1, 2, 3
Lack of transport for the distributionLack a specific process for the raw material.Unmet demand.Cost of Maintenance of machinery.
Waiting time between processes.Improve Machine Location and increased supervision of staff. 7, 9, 11, 13
Lack of space for raw material.Arrange the raw material inventory and conducting a respective also creating space for it. 9, 11, 12, 13, 14
Lack of space for machinery.Relocating machines for the process efficient and to avoid wasting space. 7. 12, 13
Waste of space.It wil l include the relocation of machinery and inventory organization. 8, 9, 11, 12, 14
Constant maintenance of machine failures.Distance from workshop and office.
There is no ISO Quality CertificateDesign a process that serves to meet the company for ISO quality certification. 12, 13, 14
They have not a recycling process.Create a recycling process of the company to prevent pollution. 9, 12, 14
It receives advice on matters of energy efficiency. Train staff on energy saving. 1,2,3
CULT
URA
PRO
CESO
SW
ORK
IN P
ROG
RESS
- LO
GIS
TICS
(T
ECH
NO
LOG
Y)A
MBI
ENTA
L
84
Figure 4.16. Main causes of waste. Lean manufacturing techniques were used to assess the current situation of the
company. Table 4.10 mentions these techniques.
Table 4.9. Lean Manufacturing Techniques generally used in SMS companies.
85
Ranking solutions
Having the problems of waste of the enterprise identified, a hierarchy model to select the most suitable lean techniques to be applied was designed.
It starts with the ranking of the techniques needed to solve the problems in the manufacturing environment with respect to cost, and then impact. Once given the weights of relationships between these two factors, a weight process for each variable assigning the cost one-weighting of 30% and 70% to impact. In Table 4.11, the final results of this weighting are given, leaving the 5S, quality at the source, and standardized work instructions techniques as the first to be implemented in the company in order to have an improvement in their processes and stable growth.
Table 4.10. Hierarchy model to select the most suitable lean techniques to be applied.
86
From this table, 5S, Quality on source and Standardized Work Instructions are the Lean techniques to be implemented in this company. These techniques will be implemented in the simulation model to get a future state of the company. In this future state, throughput, cycle time, WIP and quality will be measured.
4.5.2 Expected results
The expect results of office and manufacturing processes according to the owner:
Table 4.11. Final expectations of metrics in office and manufacturing for the textile enterprise.
To evaluate these metrics, a simulation software has been used, Witness®. Using this software will allow us to prove, from the actual manufacturing system that the changes needed will be effective in the company.
From the changes in these metrics, it is analyzed as follows:
Throughput: The unit of measure of this metric is Quotations/day. In the office, the customer service time is a critical factor to be considered. In manufacturing, the number of units produced by day is analyzed. Time and movements were taken in order to improve its processes.
Cycle time: The unit of measure of this metric is hr. /quotations (office) or min/unit (manufacturing). It takes the time needed to finish a quotation or unit in the office or Manufacturing.
Work in Process: This kind of metric is measured taken the number of units that are waiting to be processed.
87
Quality: The quality, following the owner´s perspective, will be the number of defects or units to be reprocessed.
Other records were developed with the processes. These are the following:
• Records of Business Processes for all the company, changing some of the actual records.
• Office Templates for contracts, orders, and common letters. • Records of Manufacturing Processes for all the company changing some of the actual
records. • Manufacturing Templates. • A way to enhance productivity. • A way to improve processes. • To initiate a quality certification process with the Government.
Following the applications of the 5S, Quality on source, and Standardized Work Instructions, some measures from the Initial conditions would improve to expect Future Conditions:
Table 4.12. Final expectations of metrics in office and manufacturing for the textile enterprise – future conditions.
To begin with the improvements needed a documentation of all processes were developed. Office and production processes were design based on meetings with the owner and production manager, following simple steps to generate the process activity documentation. The first step was the meeting with the office manager/owner of the company. In this step, processes, codes, times, validation kits, and validation from different office employees was done. As a result, each process designed has code, objective, activities to be performed, times, inputs, outputs, indicators, records, and associated documents. Some of these documents were described “in house” to be used in the company. A process activity is shown in Figure 4.17.
88
Process Activity
Code: A1 Version: 1
Date of Preparation: August 2012Date of Approval: September 2012
Process RECEPTION
Objective: Greet customers, identifying their needs details and specifications regarding your order.
Worker in charge: Recepcionist
Activities
Customer service (5 minutes)Acquire uniform design (15 minutes)Quote Order (10 minutes)Turnover (5 minutes)Presentation of Report of orders (15 minutes)
Inputs:
Features OrderCustomer informationAmount requested uniformsMonetary resources
Outputs:quotationbillingReport orders
Indicators: Customer Demands
Records:Customers SheetsSheets deliveries
Documents:Order Notesinvoices
Figure 4.17. Process Activity of the reception process.
A methodology that involves both office and production processes was developed (Figure 4.18).
89
IDENTIFY/ DEFINE
PROCESSESDefine Process
Activity
Meeting with Owner
Discuss Processes
Generate Code, Name of Process
and Objective
Validate the kit with the Owner/
Production Manager
Take Notes
End Meeting
Generate Inputs, Ouputs, Indicators,
Records needed and Documents
Generate the Kit of Processes
Office/Management Manufacturing
Meeting with Owner and Production Manager
Discuss Processes
Generate Code, Name of Process
and Objective
Validate the kit with the Owner/
Production Manager
Take Notes
End Meeting
Generate Inputs, Ouputs, Indicators,
Records needed and Documents
Generate the Kit of Processes
V
PROCESS ACTIVITY DOCUMENTATION
Process Activity
Code: A1 Version: 1
Date of Preparation: August 2012Date of Approval: September 2012
Process RECEPTION
Objective: Greet customers, identifying their needs details and specifications regarding your order.
Worker in charge: Recepcionist
Activities
Customer service (5 minutes)Acquire uniform design (15 minutes)Quote Order (10 minutes)Turnover (5 minutes)Presentation of Report of orders (15 minutes)
Inputs:
Features OrderCustomer informationAmount requested uniformsMonetary resources
Outputs:quotationbillingReport orders
Indicators: Customer Demands
Records:Customers SheetsSheets deliveries
Documents:Order Notesinvoices
Figure 4.18. Methodology applied to get a Process Activity chart for the reception process.
To prove that the changes were effective, a simulation model of this company was done.
90
4.6 Simulation model
In the current analysis, the company has bottlenecks for cutting raw material required in orders and packaging of the finished product. This is because the cycle time in these areas is too large. The General Manager performs many activities at once causing orders queued until they are processed.
Before improvements
Figure 4.19. Simulation model of actual conditions.
To improve these bottlenecks resort to adding an additional machine that required cuts are made in less time.
Machines were also used to improve the packing area, adding a board to allow the items to be packed in the shortest time possible. For the General Manager, it meant having more time available to open new customer relationships.
NOTE: All changes are specifically detailed in the process charts, changes such as creating templates, Dropbox account, buying a new laptop, etc.
91
• After Improvements
Figure 4.20. Simulation model of future conditions.
Implementing 5S, standardized work, process activities documentation, and some Information systems in the company would enhance productivity, and the four parameters discussed previously, lead the company to lean transformation, improving cycle time, throughput, quality, and work in progress.
The following table shows the improvement in production that this system would have if they follow the instructions to eliminate waste.
PACKAGED PRODUTS CURRENT
IMPROVED PACKAGED PRODUCTS
Day 1 to 230 Day 2 to 460 Day 3 to700 Day 4 to 935 Day 5 to 1180
Day 1 to 350 Day 2 to 690 Day 3‐ 1040
Day 4 to 1385 Day 5 to 1735
Table 4.13. Improvements in production using Simulation Software.
92
From the Figure 4.21, it is seen that the company clearly needs a 5S implementation program. They have low order time and documentation, higher WIP, and lower quality (measured as pieces defected by day), some problems are shown in the pictures below, Figure 4.21.
Figure 4.21. Actual conditions. Problems in Standardized work documents, WIP, and quality.
4.7 Case study reports
Once the simulation is done, Lean techniques to be implemented indicates the increase in daily production, which generates a higher profit as detailed in the following table
PACKAGED PRODUTS CURRENT
IMPROVED PACKAGED PRODUCTS
Day 1 to 230 Day 2 to 460 Day 3 to700 Day 4 to 935 Day 5 to 1180
Day 1 to 350 Day 2 to 690 Day 3‐ 1040 Day 4 to 1385 Day 5 to 1735
93
In the current process was observed an average production of 230 units per day. In the
improved process was observed an average production of 350 shirts per day.
One of the main problems was to demonstrate to the owner about the profit he/she would
make if the changes are made. A spread-sheet simulation model was developed using @Risk
® a Palisade Decision tools. In the following figure, it is show the flow used to develop this
model.
94
EXCELL SPREADSHEET WITH DATA ABOUT QUANTITIES AND TIME AS RANDOM VARIABLES
RAMDOM VARIABLES:- PRODUCTION TIMES- NUMBER OF UNITS
- DEMAND VARIABILITY- QUALITY SPREADSHEET
MODEL
SIMULATION MODEL USING MONTECARLO METHOD
RESULTS OF TOTAL NUMBER OF UNITS
COMPARISON BETWEEN 2 SCENARIOS: WITH AND WITHOUT METHODOLOGY (PROJECTED
DATA)
TOTAL SALES AND PROFIT RESULTS
METRICS
Figure 4.22. Spreadsheet simulation model using @Risk® to make a comparison between
scenarios.
95
In this flow, it begins with the selection of the random distribution functions for
different variables in the spreadsheet, such as production times, number of units, demand
variability, etc. Once these variables are identified, different outputs from the model are
selected and the results reflects a 95% interval of the value of the number of units and profit
results.
Once proving the effectiveness of this methodology, a document was presented to the owner for his/her evaluation process.
Three different companies were analyzed using this methodology, and the results of the problems found were the following:
Table 4.14. Problems of three SME textile companies in office and manufacturing.
96
Results from different companies for the effectiveness of this methodology are shown in the following table:
Table 4.15. Table of simulation results for three different SMS textile companies.
All the results were positive in its expectations and were presented to the owners of the SMS companies. More results can be found in Appendix C.
97
CHAPTER 5
CONCLUSIONS AND CONTRIBUTIONS
5.1 Conclusions
According to the main objectives of this research, the conclusions are the following:
1. A methodology as an engineering approach to transform office and manufacturing
environment was developed for a SMS of a particular sector (textile industry sector). This
model shows how to transform an office and a manufacturing textile company from a current
state to a desired future condition, proven the effectiveness of the methodology through
simulation modeling (Witness® Modeling, and Spreadsheet modeling using @Risk®) The
first model was developed under the criterion of lean principles to show a SMS company
production optimization (Manufacturing), and the second one under the criterion of
uncertainty in financial flows following all the recommendations given in the manufacturing
simulation (Administrative, and services). The model has integrated cultural, process, and
technology strategies to transform the enterprise
2. A field engineer’s guidebook for implementing this methodology was developed to
guide the transformation of the company from a current state to a lean condition with the
application of the developed methodology. This guidebook was presented in Ecuador in the
“workshop of Business and Economics – 2013”, in which the office and manufacturing
environments were presented as a whole connected and interdependent system (Appendix
A).
3. This methodology is easy to implement demanding low investment, creating a
documentation system to support waste elimination, reducing cycle time and enhancing
productivity. Figure 5.1 shows the advantages of using the proposed methodology.
98
Figure 5.1. Advantages of using SME´s methodology.
5.2 Contributions
1. A methodology is developed,
In its first step, it takes information directly from the customer, in this case, the
company. Problems or waste were identified from culture, process, technology and
environment. A Survey/Interview was developed in this research. Its main goal was to
identify waste in different Manufacturing & Office processes. Limitations in these steps are
as follows:
• Unbiased answers are difficult to get when the owner participates with the employees.
• This interview/questionnaire was developed for textile companies, family owner, a
different kind of company must require experts to identify waste from office &
manufacturing processes.
99
• This interview/questionnaire was only to identify waste from culture, process,
technology, and environment. Steps for processes, times and movements, and other issues
were identified with observation´s notes in Office & Manufacturing.
In the second step, general documentation was generated for office & manufacturing
operations to improve company´s operations, work methods, and reduce defects enhancing
quality control. For this purpose two IDEF0 diagrams were developed. The first one was to
identify old processes, its relationship, and hierarchy. In the second IDEF0 diagram, new
processes needed were designed. To support them, process/activity documents were
diagramed as well as work methods to support them.
In the step 3, Simulation was used to verify the effectiveness of changes and optimize
the model. Using Scenario Analysis, a simulation model showing improvements and
documentation is presented in different areas. Achieved improvements are shown in the
model for future decisions.
In the simulation model, a scenario analysis was applied, and the results after making
some changes are shown in Table 4.15.
Based on the simulation results, it clearly reflects an increasing value in productivity,
measured as production, cycle time, total WIP, and quality. On average, productivity has
increased in 61.38% of its original value. The methodology proposed in this research has
been shown in the textile sector in the workshop of economics and social science in Ecuador
but much must be done to other industrial sector to prove effectiveness in reducing waste and
increasing productivity in other companies of manufacturing in Ecuador. All these results
are reflected in income which increased by 119%, when changes are applied. With small
changes, the factory would double its income rate!!
100
This study has shown that applying lean manufacturing techniques to selected
industries can reduce their dependence on outsourcing. Production increased on average
52.84%. This could be due to the fact that in the nearly future enhancing the production rate
of this kind of companies, they would become so competitive that the outsourcing can be
significantly reduced and, in fact, reduced enough to change the balance of trade in Ecuador.
2. The second contribution of this research is the development of the guidebook
for consultants. This implementation guidebook concentrating on office-manufacturing
environment is the first developed in engineering literature for a developing country like
Ecuador.
3. The third contribution is the documentation process to initiate ISO9001:2008
developing a Quality manual “model” for this kind of companies shown in appendix B. A
process approach was done and is shown in appendix B the quality manual.
4. A documentation system needed to support the company. Process activity
charts and other documents for the company, given each document a suggested place to stay
in the office and manufacturing processes.
5. An office-manufacturing guidebook was developed. In this guidebook, the
methodology to transform SME companies is described. It has a guide to implement a lean
information management system, and a lean manufacturing system.
101
5.3 Future Research
From the results of this research, it is expecting to prove this methodology extensively
making more companies for its implementation, and verify its effectiveness.
All kind of SMS companies would use this methodology to enhance productivity, and
transform their companies to lean. Ecuador is intending to substitute imports, now more
than ever, needs this kind of research to transform its companies and be more competitive.
102
REFERENCES
(E.C.B), E. C. B. (2013). Macroeconomic Statistics. Retrieved from http://www.bce.fin.ec/frame.php?CNT=ARB0000019.
Al-Ahmari, A. M. A., & Ridgway, K. (1999). An integrated modelling method to support manufacturing systems analysis and design. Computers in Industry, 38(3), 225-238. doi: http://dx.doi.org/10.1016/S0166-3615(98)00094-3
Alagse. (2013). BPR to BPM. Promoting Thought Leadership... Retrieved Saturday, January 5th, 2013, 2013.
Azharul Karim, K. A.-U.-Z. (Cartographer). (2013). A methodology for effective implementation of lean strategies and its performance evaluation in manufacturing organizations. Retrieved from http://www.emeraldinsight.com/journals.htm?articleid=17077476
Barcia, k. (2003). A METHODOLOGY FOR IDENTIFYING AND ELIMINATING WASTE IN OFFICE ENVIRONMENTS. (PhD in Industrial Engineering), University of Texas at Austin, Austin Texas.
Boardman, B. S., & Johnson, M. E. (July 2001). Lean Techniques in an Office Setting. Proceedings of the 2001 8th Annual E&R Foundation Summer Workshop.
Creswell, J. W. (2014). Research Design: Qualitative, Quantitative, and Mixed Methods Approaches (4th Edition ed.). United Kingdom: SAGE Publications Ltd.
Davenport, T. (1993). Process Innovation: Reengineering work through information technology. Boston: Harvard Business School Press.
Davenport, T., & Short, J. (1990). The New Industrial Engineering: Information Technology and Business Process Redesign," Sloan Management Review. Sloan Management Review, 31(4), 46.
David A. Marca, C. L. M. (2006). IDEF0 and SADT: A Modeler´s Guide: Open Process, Inc.
Ecuador, B. C. d. (October 4th, 2012). Retrieved October 4th, 2012, from http://www.bce.fin.ec/contenido.php?CNT=ARB0000003
Ecuador), A. A. o. I. T. o. (December 2010). Monthly Newslatter # 1. eFaros. (2014). When to use IDEF0 and when to use BPMN. Retrieved March 1, 2014,
from http://www.efaros.com/home/process-models/idef0-vs-bpmn El Comercio, D. N. D. (2010). Textile industry runs out of supplies El Comercio. Retrieved
from http://www.elcomercio.com.ec/negocios/industria-textil-queda-insumos_0_384561567.html
Engineering, T. W. S. U. D. o. I. a. M. (2013). Lean System Implementation - IDEF models. Retrieved July 2013, 2013, from http://models.wichita.edu/enteng/idefmodels/lean/html/Index.html
Feldmann, C. G. (1998). The Practical Guide to Business Process Reengineering Using IDEF0: DORSET HOUSE PUBLISHING CO., INC.
Gahagan, S. M. (2008). SIMULATION AND OPTIMIZATION OF PRODUCTION CONTROL FOR LEAN MANUFACTURING TRANSITION (Doctor of Philosophy), University of Maryland, College Park, 2008.
Glasow, P. A. (2005). Fundamentals of Survey Research Methodology MITRE (Ed.) Group, L. (2013). Predictive Simulation. Simulation. 2013, from
Hammer, M. (1990). Reengineering Work: Don’t Automate, Obliterate. Harvard Business Review - The Magazine, 104-112.
Hicks, B. J. (2007). Lean information management: Understanding and eliminating waste. International Journal of Information Management, 27(4), 233-249. doi: http://dx.doi.org/10.1016/j.ijinfomgt.2006.12.001
Hidalgo Zambrano María Gabriela, G. R. E. C., Barriga Toala Rafael Andrés, Gonzalez Jaramillo Victor Hugo. (December 2012). "CREACION DE UNA MICROEMPRESA DE DISEÑO Y COMERCIALIZACION DE CAMISETAS TIPO SPORT PERSONALIZADAS VIA WEB”. (Bachellor), ESPOL, Guayaquil, Ecuador. Retrieved from http://www.dspace.espol.edu.ec/handle/123456789/10678
HOY, D. N. D. (2008). Textile Sector, against smuggling. HOY. Retrieved from http://www.hoy.com.ec/noticias-ecuador/sector-textil-contra-el-contrabando-296168.html
IDEF. (2000). IDEF Family of Methods. IDEF Family of Methods. Knowledge Based Systems, Inc. Retrieved January 2013, 2013, from http://www.idef.com/Downloads/free_downloads.html
Information, D. F., & 183, P. S. P. (1993). Announcing the Standard for
INTEGRATION DEFINITION FOR FUNCTION
MODELING (IDEF0). December 21, 1993: Federal Information Processing Standards Publications (FIPS PUBS).
Jay, B. (1998). Process analysis tools for process improvement. The TQM Magazine, 10(5), 342-354. doi: 10.1108/09544789810231225
Kim, S.-H., & Jang, K.-J. (2002). Designing performance analysis and IDEF0 for enterprise modelling in BPR. International Journal of Production Economics, 76(2), 121-133. doi: http://dx.doi.org/10.1016/S0925-5273(00)00154-7
Kleber Barcia, B. L. H. (2002). Using Simulation to Determine System Effectiveness: A Case Study of a Product-Repair Area in a Company. Paper presented at the Business Information Technology World Conference, Guayaquil, Ecuador.
Kvale, S. (1983). The qualitative research interview: A phenomenological and a hermeneutical mode of understanding. Journal of Phenomenological Psychology, 14(2), 171-196. doi: 10.1163/156916283X00090
Lean Enterprise Value: Insights from MIT´s lean Aerospace Initiative. (Murman Earll, Thomas Allen). (M. Aardvark Editorial, Suflolk Ed.). First Published 2002 by PALGRAVE: The Enterprise Value Foundation, Inc. 2002.
Lean System Implementation. (2012). Enterprise Engineering Wichita State University. Retrieved October 2012, from http://models.wichita.edu/enteng/idefmodels/lean/html/Index.html
Llorenty Macías, A. S., & Rodríguez Alejandro, M. B. (2014). "REINGENIERÍA DE PROCESOS DE OFICINA, SERVICIO AL CLIENTE Y MANUFACTURA EN UNA EMPRESA TEXTIL". (Ingeniería), ESPOL - ESCUELA SUPERIOR POLITECNICA DEL LITORAL, Guayaquil.
Marco, P. (June, 2010). Narket Analysis, The Market Textile Sector Ecuador with the supervision of the Economic and Commercial Office of the Embassy of Spain in Quito. Retrieved from http://www.icex.es/icex/cma/contentTypes/common/records/mostrarDocumento/?doc=4398019.
Martin, J. (1995). The Great Transition, Using the Seven Disciplines of Enterprise engineering to Align People, Technology, and Strategy. United States of America: AMACON.
Michael Hammer , J. C. (2003). Reengineering the Corporation: A Manifesto for Business Revolution: HarperCollins books.
O'Leary, Z. (2010). The Essential Guide to Doing Your Research Project: SAGE Publications Ltd.
Peter Clough, C. N. (2012). A Student's Guide to Methodology (Third Edition ed.): SAGE Publications Ltd.
PRODUCTION MANAGEMENT: The lean office. (2005). Metalworking Production, 12-12.
Ramunė Čiarnienė, M. V. (2012). LEAN MANUFACTURING: THEORY AND PRACTICE. ECONOMICS AND MANAGEMENT: 2012. 17 (2), 17(2), 726-732. doi: http://dx.doi.org/10.5755/j01.em.17.2.2205.
Rawabdeh, I. A. (2005). A model for the assessment of waste in job shop environments. International Journal of Operations & Production Management, 25(8), 800-822. doi: 10.1108/01443570510608619.
Shah, R., & Ward, P. T. (2007). Defining and developing measures of lean production. Journal of Operations Management, 25(4), 785-805. doi: http://dx.doi.org/10.1016/j.jom.2007.01.019.
Smirnov, S., Reijers, H., Weske, M., & Nugteren, T. (2012). Business process model abstraction: a definition, catalog, and survey. Distributed and Parallel Databases, 30(1), 63-99. doi: 10.1007/s10619-011-7088-5.
Stump, G. B. (2008). AN INTEGRATED FRAMEWORK FOR APPLYING LEAN MANUFACTURING
AND OTHER STRATEGIES IN MASS CUSTOMIZATION ENVIRONMENTS. (Master of Science in
Mechanical Engineering), University of Kentucky, Lexington, Kentucky. Thiault, D. (2011). Managing Performance Through Business Processes: From BPM to the
practice of process management (1st Edition ed.): CreateSpace Independent Publishing Platform (January 7, 2012).
Underdown, D. R. (1997). An Entreprise Transformation Methodology. (Dissertation), University of Texas at Arlington, Arlington, TX.
Wojtys, E. M., Schley, L., Overgaard, K. A., & Agbabian, J. (2009). Applying Lean Techniques to Improve the Patient Scheduling Process. Journal for Healthcare Quality, 31(3), 10-16. doi: 10.1111/j.1945-1474.2009.00025.x.
Yanlei, W., Wuqiang, L., Shuang, W., & Jin'e, H. (2009, 20-24 July 2009). Function model of efficient support system based on improved IDEF0 method. Paper presented at the Reliability, Maintainability and Safety, 2009. ICRMS 2009. 8th International Conference on.