A MULTI-CRITERIA DECISION ANALYSIS APPROACH FOR PRIORITIZATION OF PERFORMANCE METRICS
US Government Performance and Results Act (GPRA) and Oil Spill Response
I. LINKOV, F.K. SATTERSTROM, A. TKACHUK, A. LEVCHENKO Intertox, Inc. 83 Winchester Street Brookline, MA 02446 USA
T.P. SEAGER Social and Environmental Research Institute 278 Main Street, Room 404 Greenfield, MA 01301 USA
J.R. FIGUEIRA, T. TERVONEN CEG-IST (Center for Management Studies, Instituto Superior Tecnico) Technical University of Lisbon Tagus Park, Av. Cavaco Silva 2790-990 Porto Salvo, Portugal
Abstract
The Government Performance and Results Act (GPRA) of 1993 requires federal agencies to establish objective, quantifiable goals describing the outcomes of agency programs. The purposes of the Act are fairly straightforward: to improve confidence, performance, accountability, feedback, decision making and management in federal agencies. However, implementation of the Act in different agencies has been complicated by several factors including a lack of expertise in strategic planning, difficulty reconciling multiple missions or divergent perspectives, a lack of structured approaches to engaging relevant stakeholder groups, and the presence of multiple confounding factors that obscure the relationship between agency efforts and outcomes. Currently, there is no reliable, structured approach to establishing GPRA metrics that can be transferred from one agency to the next. Successful case studies have largely resulted from ad hoc efforts within agencies with different degrees of expertise related to performance measurement, public or stakeholder participation, and decision support. Consequently, the requirements of the Act remain a source of concern to many federal agency managers. This paper hypothesizes that many of the challenges posed by the Act are characteristic of the types of problems that multi-criteria decision analysis
2
(MCDA) is appropriate for and proposes an MCDA framework for establishing a suite of GPRA metrics for gauging the effectiveness of oil spill response efforts. The key advantage of this framework is the visualization and quantification of the uncertainties involved in planning or decision-making processes and the potential to model multiple stakeholder responses. Moreover, we expect an MCDA approach to be generalizable to multiple agencies engaged in environmental protection missions and/or crisis response.
1. Introduction
Government agencies can rarely be characterized by a single, focused mission. Most government agencies work towards multiple objectives and serve many ‘customers’ with divergent goals. Alternatively, a single purpose (e.g., protecting human health) may be served by multiple agencies. Consequently, agencies are often required to partner with each other and nongovernmental organizations to accomplish goals that seem to always be increasing in complexity. No single outcomes metric can reliably capture the efficacy of any single agency [10]. Nonetheless, the Government Performance and Results Act (GPRA) of 1993 requires federal agencies to set objective, measurable performance goals for the purpose of assessing the effectiveness of individual agency programs. Ostensibly, program budgets are revised in accordance with their perceived effectiveness in relation to the Act. A more efficient allocation of government resources is expected to result. However, in reality, implementing both the spirit and letter of the Act has been complicated by a surfeit of challenges related to strategic planning, performance measurement, stakeholder engagement, and disentangling the relationship between individual agency effectiveness and measurable program outcomes.
In retrospect, passage of the Act may seem like the inevitable intersection of two important sociopolitical trends of the early 1990s: the increasing adoption of measurable performance management systems in industry and the Clinton-Gore administration’s “reinventing government” reform initiative [4]. In industry during the early 1990s, there was an increasing movement towards adoption of standardized systems for managing quantitative information (as exemplified by International Standards Organization specifications for quality and environmental management) and application of quantitative management systems to foster continuous quality improvements (such as the Six Sigma approach [7]). There is no doubt that the framers of the Act envisioned making government more businesslike by increasing responsiveness to ‘customers,’ improving efficiency, reducing bureaucratic procedures (i.e., ‘red tape’), and fostering a culture of accountability. However, unlike business units that receive continuous feedback and capital from financial markets, government agencies operate in an environment comparatively isolated from market forces (relative to political forces). While connecting budgets and performance assessment may seem consistent with the goal of building a businesslike culture in government, in reality government agencies operate in a different milieu. Consequently, federal agencies must develop unique approaches to both information management systems and performance assessments.
In this paper, we argue that many of the challenges posed by the GPRA are amenable to multi-criteria decision analytic approaches such as those that have been adopted in some instances for social problems such as environmental decision making (Table 1). Multi-criteria decision analysis refers to a group of methods used to impart structure to the decision-making process. Generally, these decision analysis methods consist of four steps:
1. Creating a set of criteria relevant to the decision at hand, for use in evaluating the decision alternatives.
2. Weighting the relative importance of the criteria.
3. Scoring how well each alternative performs on each criterion
4. Combining scores across criteria to produce an aggregate score for each alternative or pairwise comparisons of alternatives.
The goal of the process is often to select the single best alternative, but ranking alternatives is very useful. Most multi-criteria decision analysis (MCDA) methodologies share similar steps 1 and 3, but diverge in their processes for steps 2 and 4 [22]. A detailed analysis of the theoretical foundations of different MCDA methods and their comparative strengths and weaknesses is presented in [1].
Table 1: Comparison of GPRA challenges and MCDA capabilities.
GPRA MCDA
Requires expertise in strategic planning Facilitates structured examination of objectives, alternatives
Must balance multiple missions and perspectives Criteria result from multiple objectives and may be weighed differently by different groups
Must engage stakeholders and be responsive to feedback
Structures and facilitates stakeholder value elicitation and non-expert knowledge
Requires expertise in performance measurement Accommodates multiple sources and types of information including qualitative and semi-quantitative
2. Performance Metrics for Oil Spill Response
Measuring the effectiveness of an oil spill response is extremely challenging. Until very recently there has been little research on what constitutes “good” environmental performance metrics within the context of environmental crisis, different types of metrics, how these could apply to oil spill response, and how they might relate to
4
stakeholder or public attitudes, expectations, or objectives. Incident-specific strategies must be identified early and on a case-by-case basis that usually must be implemented by an ad hoc association of many organizations that may be unfamiliar with working with one another [5]. To further complicate matters, little guidance is available to responders on how to incorporate stakeholder or public views into the initial assessment of priorities. Consequently, methods for setting objectives, tracking progress, and communicating or determining success depend largely on the experience of the on-scene coordinator and the level of interaction with state, local, or other nonfederal government groups outside the command structure, including the media. Even when the response is closely coordinated among agencies and planning documents are scrupulously adhered to, public perception can be that the response has failed—partly because it is not apparent what normative standards of success should be applied or how the measures of success employed by decision makers will be interpreted by the public or intermediaries (such as journalists or nongovernmental organizations [6,2]). In short, there currently is no comprehensive consensus approach to assessing the success of response efforts [18].
2.1. DIFFICULTIES IN PERFORMANCE MEASURES
Oil spill response, like many emergency or crisis response situations, displays many characteristics of a government function that is extremely difficult to assess with respect to the GPRA:
Every oil spill is unique. Although planning efforts are typically intense with regard to pre-positioning of equipment, establishing communication and leadership protocols, and personnel training, the response tactics are virtually impossible to plan ahead of time. Optimal alternatives are highly dependent upon the circumstances of individual spills. Therefore, compliance with the GPRA—in which strategic planning is an essential aspect—is complicated by the inability to establish a universal vision of how to achieve a successful response.
Even with generalizable goals for oil spill response in place, performance measurement requires a benchmark to determine the sensitivity of outcomes to agency efforts. In the case of oil spills (and other crisis response situations), it may be impossible to say what the level of measurable outcomes would be under alternative response scenarios. The unique nature of the crisis precludes comparative assessments to control or ‘normal’ circumstances. Moreover, the time-sensitive nature of the crisis typically prohibits dynamic modeling of alternative scenarios in real time. Consequently, decision outcomes must be judged without the benefit of context.
Oil spills inevitably engage multiple stakeholder groups including industry (e.g., fishing, tourism), nongovernmental organizations, local government agencies, journalists, and the greater public. In many cases, the goals of these groups may be at odds, complicating the process of incorporating key stakeholder concerns into GPRA measures.
Effective oil spill response requires close coordination between multiple public and private agencies (such as the responsible party and response contractors). The perceived success or failure of a response is a function of the collective efforts of the wide-ranging ad hoc administrative structure. Disentangling the contribution of each of these agents to the eventual outcome may be impossible, if not explicitly counterproductive to the extent that organizations may fail to cooperate effectively if they become preoccupied with their own performance assessment at the expense of overall system effectiveness.
2.2. REVIEW OF PERFORMANCE METRICS USED FOR OIL SPILLS
To examine performance metrics in oil spill response, we interviewed key stakeholders to study performance metrics used to assess two recent oil spill responses: the Bouchard-120 spill response that began on April 27, 2003, as the tugboat Evening Tide ran aground and released No. 6 home heating fuel oil just at the entrance to Buzzards Bay, Massachusetts; and the Chalk Point spill response that began on April 7, 2000, when an intrastate pipeline that transports oil to the Potomac Electric Power Company’s (PEPCO) Chalk Point electrical generating facility in Prince George’s County released No. 2 and No. 6 home heating fuel oil into Swanson Creek and subsequently into the Patuxent River. Those interviewed represented a diverse group involved in the spill response, including federal, state, and local government officials, NGO representatives, and local community members. The federal on-scene coordinator and state on-scene coordinators from each response were included in the interview samples.
We found that the stakeholders were collectively able to generate a large number of performance metrics. A sampling is listed in Table 2. Each metric can be characterized by where in the organization the metrics applies, how (and how well) the information is expressed, and what type of information is collected (Table 3) according to the typology of environmental performance metrics described in previous work [18].
The HOW columns in Table 3 characterize the mathematical form and quality of the metric. Mathematically, all metrics could be classified as either quantitative (e.g., cardinal measurement), semi-quantitative, or qualitative. In the GPRA, a clear preference is expressed for quantitative measures—although they may not always be available. Regarding quality, different metrics may have multiple attributes to different degrees. Therefore, a judgment regarding the quality of any metric may depend upon the relative importance of each attribute such as cost or verifiability to the decision maker.
The WHERE columns describe the relationship of a metric to both organizational structure and sequence events in crisis response. A different suite of metrics may be applicable at the strategic level of thinking than at the tactical or operational. Similarly, different metrics are applicable for an accounting of resources, processes, or outcomes depending upon whether the concern is spill response, systems recovery, or restoration. In some cases, outcome metrics for response (e.g., rescued birds) may be viewed as
6
Table 2: Example oil spill response metrics by type of information measured.
Economic Thermodynamic Environmental Ecological Human Health Sociopolitical
Clean up costs.
Property and ecosystem damage.
Ecosystem damages or lost services.
Lost marginal profits.
Volunteer opportunity costs.
Volume of oil spilled, recovered, destroyed, or contained.
Slick area and thickness.
Mass of clean up wastes generated.
Volume cleaning agent deployed.
Chemical concentration and toxicity.
Habitat suitability; e.g., acres shellfish bed.
Length of oiled shoreline.
Degradation rates.
Residual risk.
Wildlife deaths or populations, fecundity, and recovery rates.
Biodiversity.
Catch sizes.
Plantings, seedings.
Habitat suitability.
Threatened population
Quality-adjusted-life-years (QALYS).
Disability-adjusted-life-years (DALYS).
Life expectancy.
Injuries.
Newspaper column inches, minutes TV coverage, web hits.
input metrics for recovery (e.g., viable breeding population) or restoration. For example, an overarching strategy may be to reduce the severity of oil spills (e.g., as measured by wildlife deaths). One tactical approach may be to contain and remove slicks. In pre-spill planning, a resource metric might be to measure capital equipment expenditures for purchase and pre-positioning of additional equipment. In the event of an oil spill, the on-scene coordinator might track tactical measures such as the time
required to deploy the pre-positioned equipment during the response. At the operational level, the effectiveness of the deployed equipment must be tracked to ensure success of the overall strategy. The importance of tracking resource and process (or output) measures must be emphasized in cases where outcomes are significantly delayed or disconnected in time from the actual decisions. In many instances, mid-course corrections must be made before final outcomes can be tallied.
It has often been written that what gets measured will be managed. Therefore, it is essential to understand the relationship of any metric to the multiple objectives of the spill response. Table 3 proposes a fairly comprehensive—albeit far from exhaustive—list of different dimensions by which oil spill response success might be gauged. However, where two different dimensions are incompatible with one another (e.g., additional expense is required to remove additional oil from the environment, although the ecological benefits may be dubious) disagreement may exist about which measures are most important.
The ecological dimension refers to biological aspects of living organisms such as populations, health, or incidence of injury or disease. Presumably, human populations could be lumped together with wildlife in this category. However, the preeminence of human health protection in oil spill response likely justifies a separate category specifically tracking human health measures, such as worker injuries or exposures.
The environmental dimension refers to the chemical or physical characteristics of the impacted area, such as oil or toxic chemical concentrations. These are distinguished from ecological measures because the relationship between environmental conditions and biological endpoints may be complex, indirect, or difficult to reveal. Moreover, environmental endpoints (such as presence of oil in shoreline soils) that may have limited ecological relevance may nonetheless be held in high regard by some stakeholder groups.
The economic dimension may itself have several important aspects, such as the direct costs to the responsible party and the indirect costs to volunteers, impacted industries, or even potential beneficiaries of the spill expenses such as contractors hired to participate in response.
The thermodynamic dimension characterizes all the mass and/or energy measures that may be relevant process outputs (or resource inputs). For example, the mass of oiled litter recovered from beaches, the volume of oil recovered from shipboard, or the total gallons (barrels) of oil spilled into the environment.
The sociopolitical dimension describes the quality of human relationships and how they are impacted by the spill. For example, the incidence of litigation may be one symptom of a deterioration of trust. Criminal proceedings may be an indication of an ethically bankrupt culture. However, high incidence of volunteerism may be indicative of the quality or effectiveness of community outreach programs.
Ideally, an agency will populate the entire WHERE and WHAT dimensions of the typology with high-quality metrics that are applicable to every level of decision making
8
within the organization. For example, one important strategic goal listed in A Guide for Spill Response Planning in Marine Environments is:
…minimize adverse environmental and socioeconomic effects by coordinating all containment and removal activities to carry out a timely, effective response [17].
This single statement cuts across several dimensions of the environmental performance metrics typology. First, the notion of environmental “effects” is a qualitative, outcomes-based, environmental and ecological metric that should inform strategic decision making—while the notion of socioeconomic effects is also qualitative, outcomes-based, and strategic. It seemingly suggests aggregating the economic and sociopolitical information that are treated separately in the typology of Table 3. Second, specific suggestions are provided to tactical decision makers thinking about achieving the strategic goal, namely containment and removal. In this regard, the emphasis is on tactical processes, rather than strategic outcomes and the type of information to be gathered would presumably be thermodynamic (i.e., volume of oil contained or removed). Lastly, criteria for judging the spill response are suggested: specifically, the response should be “timely” and “effective.” However, it should also be apparent that this statement alone is insufficiently detailed to allow responders to gauge the effectiveness of their efforts. For example, how should containment operational effectiveness by\e measured? How would timeliness be measured quantitatively? A more comprehensive elicitation process such as interviews, literature review, and consultation with experts is called for. This exercise will allow identification of gaps that may concern managers or stakeholder groups. For example, they may discover a paucity of strategic or quantitative metrics, which may cause them to return to the step of metrics elicitation or invent new metrics to fill the gaps they consider important.
Following elicitation, the agency must reorganize the information in multiple directions to discover whether a suitable cross-section of different types of feasible, high-quality metrics are available for each organizational objective (strategic, tactical, operational) or at each step in the agency’s chain of influence (inputs, process outputs, and outcomes) or for each type (economic, environmental, ecological, sociopolitical, human health, and thermodynamic). Once again, significant deficiencies may be corrected by further elicitation or invention.
In any case, it is unlikely that all stakeholders (or agency managers) agree on which metrics (and their quality) should be employed to determine the relative success or the quality of any response. Overall, a four-step process that precedes MCDA is called for:
1. First, metrics must be elicited from the salient stakeholder groups.
2. Then, they must be characterized with regard to the typology in Table 3.
3. Where important gaps are identified, a return to elicitation may be called for—or perhaps entirely new metrics must be devised.
4. Lastly, the quality of the metrics must be must be assessed.
Only then should value-based weights be assigned to any set of sub-characteristics to allow aggregation to a higher-level assessment of which metrics should be adopted for any given situation. This prioritization framework could be easily coded in one of the MCDA platforms. Even then, the disaggregated information should remain available to agency managers.
5. Finally, decision makers should deliberate about the results of the overall process to select a final suite of metrics most relevant for a particular region or problem.
2.3. USE OF MCDA TO RESOLVE DIFFICULTIES
Multi-criteria decision support processes can overcome many of the challenges of performance measurement faced by federal agencies. The typical approach to an environmental MCDA involves identifying feasible alternatives and the criteria by which they should be judged and assessing the performance of each alternative relative to the salient criteria. While alternatives may be generated by experts, stakeholders, and/or public groups, the decision criteria and their relative importance may justifiably be the purview of affected parties (such as stakeholder groups), who may or may not also be experts. The performance assessments are typically performed by experts. For example, in considering the problem of managing contaminated sediments, stakeholder groups may emphasize the importance of environmental quality, preservation of ecological habitat, or economic development. All of the alternatives generated by expert and stakeholder groups must then be assessed relative to measurable criteria that capture each of these performance criteria—although different groups may value each criterion differently. The results are called a performance table that is subsequently analyzed with different mathematical approaches including multi-attribute utility theory, outranking, pairwise comparison, or others. The advantage of MCDA is that alternatives can be ranked or prioritized for multiple decision criteria, tradeoffs can be elucidated, different types of information including semi-quantitative or uncertainty information can be handled in a structured way, and conflicts or opportunities for compromise can be observed that may not otherwise have been discovered [13,3]. The principal disadvantage of MCDA approaches is that they can be time-intensive, especially when multiple stakeholder perspectives are important. In crisis response, there may not be time to engage in structured decision making [21,9]. Therefore, the typical MCDA approach to alternatives assessment is not helpful.
In the case of crisis response (such as oil spills), existing MCDA processes are at a distinct disadvantage. However, we propose a unique approach for the purposes of the GPRA. In this case, the metrics are the alternatives. Usually, metrics are associated with assessment criteria and relate to the underlying objectives or goals of the organization. However, the GPRA requires agencies to select a limited number of metrics from a theoretically infinite universe of potential outcomes metrics. Not all metrics would be cost-effective for the agency to track, nor can any single metric perfectly fulfill the requirements of the GPRA. Therefore, agencies need a process for generating a set of potential metrics, vetting these with key internal and external stakeholder groups, and prioritizing among them to establish a concise suite of metrics that capture agency performance. As in a typical environmental MCDA, some agency
10
customers may value certain metrics within the suite more highly than others. (Some may even place zero weighting on certain metrics.) Consequently, despite a common set of assessment metrics, it is possible that agency performance could be viewed positively by one group and negatively by others—a situation that may be all too familiar to government managers. The critical difference between the process we propose for GPRA and a typical MCDA is that the decision alternatives are which metrics to use. The criteria that represent the other half of the performance table are characteristics that agency and key stakeholder feel the selected metrics should have. Thus, the performance table is a guide to determining which metrics are better than others for any particular program.
3. Decision Analysis Example
As an illustrative example of MCDA application, consider the problem of prioritizing performance metrics for oil spill response according to specified management objectives. As a hypothetical example, we consider 14 alternative metrics in bold type in Table 2. These metrics represent different phases of the response (response, recovery, restoration) and the different types of metrics (economic, thermodynamic, environmental, human health, ecological, sociopolitical). Many of these performance metrics were mentioned by stakeholders in the case studies we examined [20].
3.1. SMAA METHODOLOGY
One of the most time-intensive, problematic aspects of MCDA for group decision making is the elicitation of weights that represent the values of each decision maker. The larger the group and the greater the number of relevant criteria (or objectives), the more burdensome the problem of value elicitation becomes. Moreover, the process is complicated by the fact that decision makers themselves may be uncertain about weights, preferences may evolve or change throughout the decision-making process, or the weights elicited may be unreliable in the sense that they depend upon the method of elicitation. Moreover, in some case the results of an MCDA may be highly sensitive to treatment of uncertainty in the weights. However, stochastic multiobjective acceptability analysis (SMAA) circumvents the difficulties of value elicitation and expedites analysis of uncertainty by using Monte Carlo simulation to explore a wide range of the weight spaces. The results can provide decision makers with a probabilistic characterization of preferred alternatives even prior to value elicitation. The results are especially helpful for understanding multiple-decision-maker problems by identifying when some alternatives are likely over a wide range of potential weighting schemes [19,11].
3.2. CRITERIA
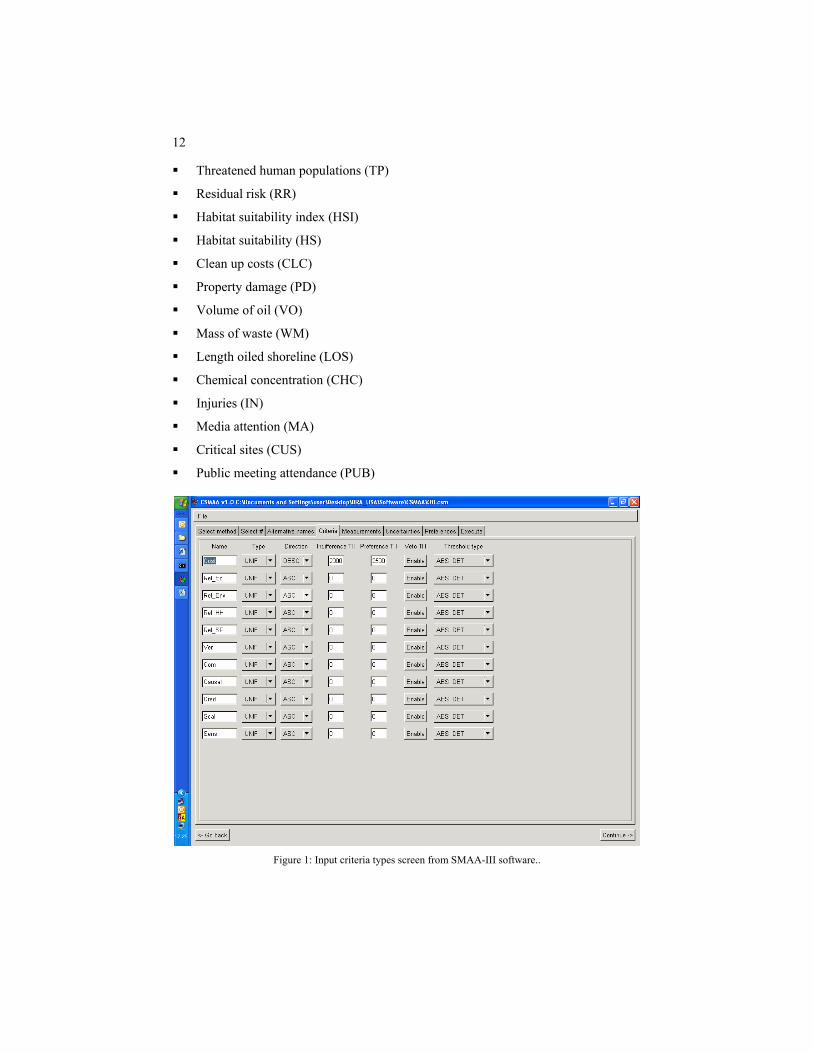
For the purposes of illustration, 11 of the criteria from Table 3 have been chosen for an example in the use of SMAA and are depicted in the rows of Figure 1, which is an input screen captured from a software program known as SMAA-III [19,12]. The criteria are:
Cost (e.g., of obtaining the data required to track a specific metric)
Ecological (Rel_Ec)
Environmental (Rel_Env)
Human health (Rel_HH)
Sociopolitical (Rel_SP)
Verifiability (ver)
Communicability (com)
Causality (causal)
Credibility (cred)
Scalability (scal)
Sensitivity (sens)
The analyst must specify different aspects of these criteria, such as whether ascending or descending ordering is preferred (i.e., more or less of the characteristic), the minimum precision with which two estimates on the scale of this criteria may be distinguished (the indifference threshold) and the difference between two estimates that would result in a complete preference for one estimate over another (the preference threshold; between indifference and preference, a decision maker may be uncertain about the extent to which one number is preferred over another). The SMAA-III software can work with different scales (including poorly defined ordinal scales), does not require precise preference information and is particularly adequate for situations where “big” uncertainties are present; these uncertainties referred to imperfect knowledge of basic data and technical and preference parameters. (In addition, SMAA-III software allows the definition of other model specifications that are not used in this example).
3.3. ASSESSMENT
Assessment of the performance of different metrics relative to the 11 listed criteria in general requires consultation with decision makers and technical experts. For example, the total volume of oil recovered from the environment may be very difficult to verify (because the liquids removed will be an oil-water mixture), or it may be expensive to determine. However, this measure may also be easily communicated and understood by the public. In any case, a determination must be made about the performance of a metric such as “total volume of oil recovered” relative to each criterion. It may be helpful to elicit performance estimates from a wide range of experts or stakeholders; these estimates need not agree. They may be expressed as a probabilistic distribution, or alternative analysis can be conducted for different performance assessments and the results compared. The quantities used in this example have been furnished by the authors for illustrative purposes only. Fourteen candidate metrics listed in bold in Table 2 are assessed:
12
Threatened human populations (TP)
Residual risk (RR)
Habitat suitability index (HSI)
Habitat suitability (HS)
Clean up costs (CLC)
Property damage (PD)
Volume of oil (VO)
Mass of waste (WM)
Length oiled shoreline (LOS)
Chemical concentration (CHC)
Injuries (IN)
Media attention (MA)
Critical sites (CUS)
Public meeting attendance (PUB)
Figure 1: Input criteria types screen from SMAA-III software..
Cost is measured in US dollars required to collect information for quantification. For example, we assumed a cost of $50,000 to track changes in the TP. For those criteria with the “Rel” prefix (all from the “What” column of Table 2) assessments of relevance to the criteria are gauged on a scale of 1-10 (10 being highly relevant and 1 having little relevance). All the candidate measures are recognized as being relevant to more than one of the “what” criteria, which is to say that these criteria are not completely independent. Metrics performance for other criteria (e.g., credibility, communicability) is assessed as merely High, Medium, and Low (represented by 3, 2, and 1 in Figure 2). For example, the TP metric is scored high on all criteria because it is a robust measure that is easy to communicate. Even though the MA metric is easy to communicate and somewhat sensitive to public perception, here it is listed as having low credibility and assessed low on other factors. The assessments are summarized in Figure 2. It bears repeating that these assessments are purely for the mathematical convenience of the authors. A more robust assessment would entail a wide elicitation of expert and stakeholder views.
Unlike some other MCDA tools, SMAA-III also allows defining the indifference and preference thresholds. Indifference thresholds could be used by decision makers to acknowledge that a small difference in assessments could be interpreted as indifference between two alternatives. In our example, indifference and preference thresholds are defined for cost criteria only. The indifference threshold of $2,000 defined in our example means that two alternatives with price difference of $2,000 are considered as indifferent (i.e., this amount of money is too small to worry about in spill response). However, differences of greater than $2,500 are considered to be important, which is to say that a decision maker would clearly prefer a metric that was at least $2,500 less costly to track. Between $2,000 and $2,500 savings, the decision maker may or may not consider the cost difference important. Therefore, the preference is considered to be incomplete.
14
Figure 2: Hypothetical assessment of candidate metrics relative to representative criteria.
4. Preference Analysis
SMAA-III is based upon an outranking approach to preference determination rather than a utility function approach [18,15]. SMAA-III offers several advantages compared with other MCDA approaches:
As depicted in Figure 1, SMAA-III works with the original and natural scales for different assessment criteria, including cardinal (e.g., cost), semi-quantitative, or qualitative (e.g., High, Medium, Low). There is no need to translate assessments into a single-dimensional utility or value function.
Low time requirements and cognitive efforts from decision makers.
Uncertainty can be incorporated in every aspect, including assessments and weightings.
In our example, we assumed that the decision maker cannot assign weights to the criteria a priori but believes that all of them are important and none dominates. This ignorance about the exact criteria importance is modeled by using imprecise weights (Figure 3). In an actual case, decision makers may assign their own bounds and different analyses may be conducted for individual bounds. The results may be
important for identifying opportunities for decision makers with different views to compromise on alternative(s) that are nonetheless highly ranked by all.
Figure 3: The range of weights tested for each assessment criterion range from a lower bound of 5% to an
upper bound of 49%.
4.1. RANK ACCEPTABILITY ANALYSIS
The rank acceptability index measures the share of feasible weights that grant each metric specific rank in the order of importance by simultaneously taking into account uncertainty in all parameters and criterion evaluations. It represents the share of all feasible parameter combinations that make the alternative acceptable for a particular rank, and it is most conveniently expressed as a percentage. The most acceptable (“best”) metrics are those with high acceptabilities for the best ranks. These are the metrics that are most likely to be valued by decision makers with a random assignment of criteria weights between the lower and upper bounds. That is, they may be the alternatives most likely to result in consensus. The results of the rank acceptability analysis for our case are presented at Figure 4. The left-most box represents the likelihood of the alternative metric being ranked as the most important, whereas the right-most indicates the likelihood of being ranked last. The top metrics include TP, LOS, CLC, and PD.
16
Figure 4: Rank acceptability analysis results show the likelihood of each alternative metric being ranked by
decision makers as most preferred (left-hand box) or least preferred (right-hand box).
4.2. PAIRWISE ALTERNATIVE COMPARISON
Alternatively, it is possible to compare the likelihood that one metric may be preferred to one other metric in a pairwise comparison rather than an overall ranking. Figure 5 is a pairwise comparison table. The alternative metrics are listed in the row titles at left. Although the column headings are omitted, the order of the alternatives is exactly the same. To determine the likelihood that a decision maker might prefer TP to LOS, it is necessary to follow the TP row to the right nine boxes, where we see the result is 74. (LOS is listed in the ninth row and therefore corresponds to the ninth column).
Figure 5: Pairwise comparison of alternative metrics in a 14x14 matrix showing the likelihood of the row
metric dominating the column metric. Note that column metrics are presented in the same order as the rows, although the headings are omitted.
4.3. SENSITIVITY TO WEIGHTING BOUNDS
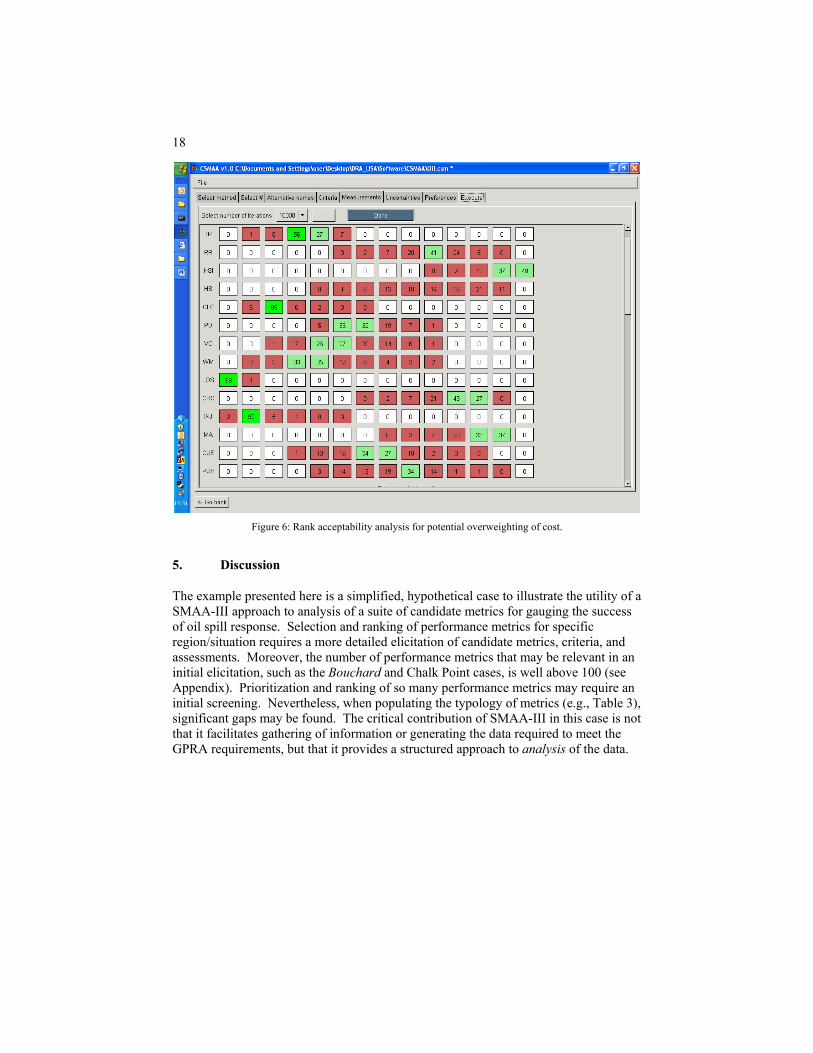
In some cases, decision makers will express a stronger preference for some assessment criteria than for others (compared with a randomly distributed, equally likely distribution of weights). In Figure 6 below we assign greater importance to cost by raising the lower bound on this weighting to 25% (without changing the upper bound of 49% or the bounds of any other criteria). For comparison, Figure 7 depicts the results of the rank acceptability analysis for over weighting of environmental considerations (Rel_Env) in the same way. It is interesting to note that in both cases, the results show that LOS is now most likely the preferred metric, compared with TP. While LOS is not the cheapest metric and it is not the most relevant metric to ecosystem health, its relative low cost and good performance on all criteria make it acceptable for both budget-conscious and environmentally-conscious stakeholder communities when these priorities are given greater weight.
18
Figure 6: Rank acceptability analysis for potential overweighting of cost.
5. Discussion
The example presented here is a simplified, hypothetical case to illustrate the utility of a SMAA-III approach to analysis of a suite of candidate metrics for gauging the success of oil spill response. Selection and ranking of performance metrics for specific region/situation requires a more detailed elicitation of candidate metrics, criteria, and assessments. Moreover, the number of performance metrics that may be relevant in an initial elicitation, such as the Bouchard and Chalk Point cases, is well above 100 (see Appendix). Prioritization and ranking of so many performance metrics may require an initial screening. Nevertheless, when populating the typology of metrics (e.g., Table 3), significant gaps may be found. The critical contribution of SMAA-III in this case is not that it facilitates gathering of information or generating the data required to meet the GPRA requirements, but that it provides a structured approach to analysis of the data.
Figure 7: Rank acceptability analysis for potential overweighting of environmental relevance.
6. Conclusion
Effective oil spill performance metric prioritization requires an explicit structure for jointly considering the environmental, ecological, technological, economic, human health, and sociopolitical factors relevant to evaluating alternatives and making a decision. Integrating this heterogeneous information with respect to human aspirations and technical applications demands a systematic and understandable framework to organize the people, processes, and tools for making a structured and defensible decision. Previous papers by the authors [14,8] introduced a general framework for management of environmental challenges based on MCDA. We have also tailored this framework specifically for application to management of contaminated sediments [15]. In general, we recommend a four-stage process of elicitation, characterization, assessment, and analytic deliberation. The work presented in this paper relies upon the results of the first three steps to help facilitate the final, deliberative step in which a decision is actually made. The overall goal of any MCDA process is not to make a decision, but rather to support a decision-making process. In the case of group decision-making processes, one of the strengths of the approach presented is the ability to characterize the sensitivity of the result to different weightings, assessments, or perspectives—especially in recognition of the fact that these perspectives may change. As managers gain experience with new spills or policies evolve, it is possible to revisit
20
the process by considering new metrics, revising assessments, or weighting boundaries and revisiting the suite of metrics considered most applicable to the next spill. An adaptive management process is called for. (See Linkov et al. [16] for an example charting adaptive MCDA management processes.)
The result of the entire process is a comprehensive, structured process for selecting the GPRA metrics for in any given situation, and vetting these metrics with stakeholder groups in a way that incorporates their value judgments as well as scientific modeling and risk analysis. This process could be of great benefit to management of oil spill response, where there is currently no structured approach for making justifiable and transparent determinations about the success of any particular response. In particular, an MCDA framework allows visualization and quantification of tradeoffs. The proposed framework can also be used to prioritize research and information gathering activities and thus can be useful for value of information analysis.
7. Acknowledgements
The authors express their gratitude to Dr. Seth Tuler and Rebecca Kay for comments and suggestions. This study was funded by NOAA through the Coastal Response Research Center at the University of New Hampshire (NOAA Grant NA04NOS4190063, Project 05–983).
21
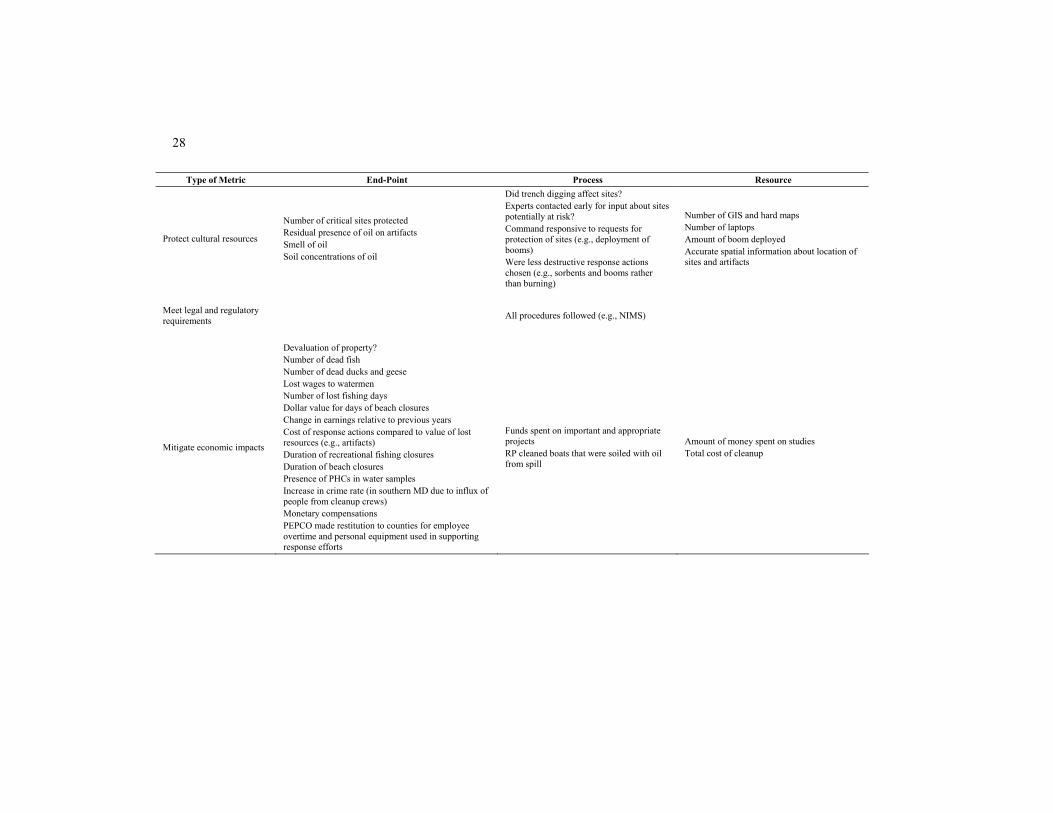
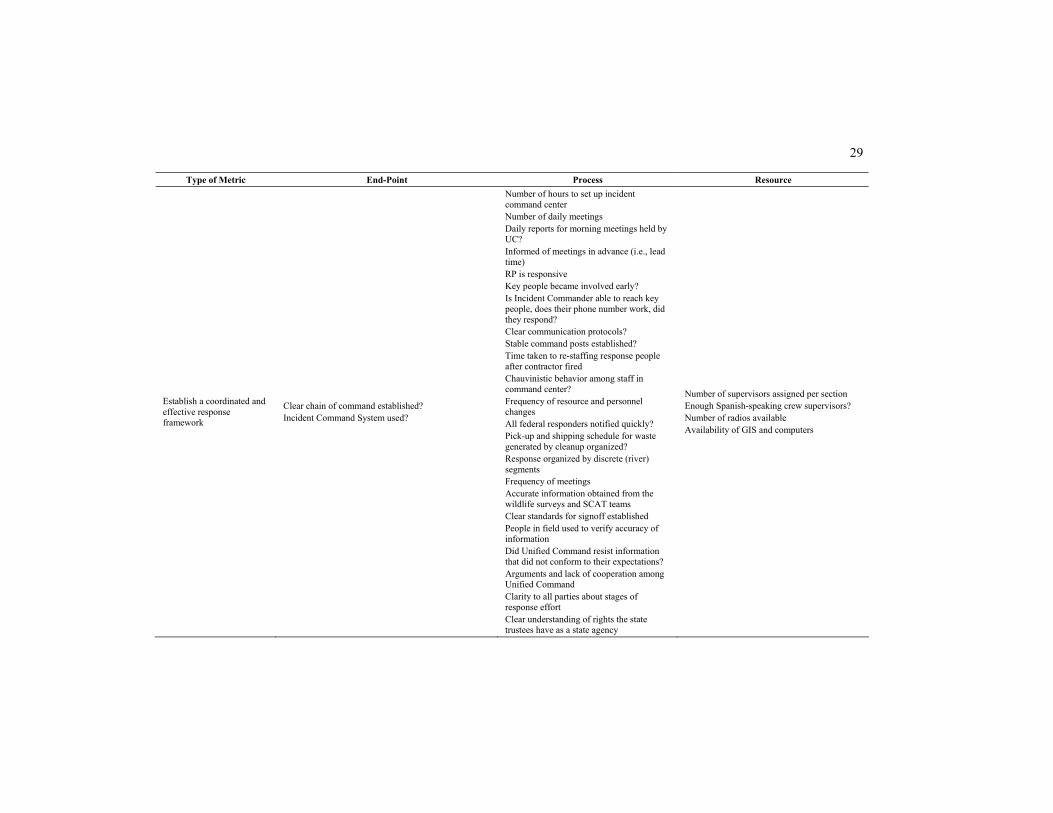
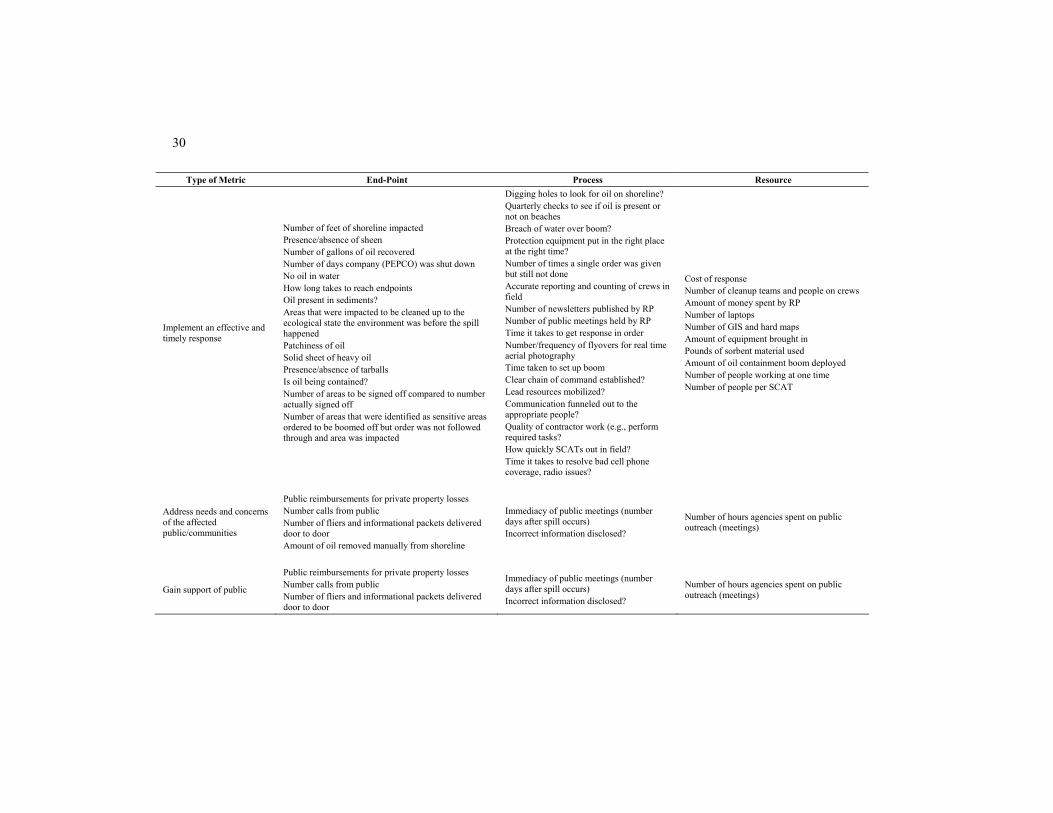
8. Appendix: Objectives and Metrics Elicited for Bouchard and Chalk Point Oil Spill Response
8.1. BOUCHARD-120 Type of Metric End-Point Process Resource
Protect worker and public health and safety
Number of people killed or injured Number of mishaps during hours worked NA Number of IRAC team members
OSHA/HAZMAT trained
Protect environment/ ecological systems
No re-oiling or residual oil causing chronic toxicity to something Number of estuaries “shut off” (i.e., areas prevented from oiling from via booming) Number of inlets that were able to boom off Number of miles of shoreline impacted Amount of oil or globules on shore Number of areas where oil contamination was prevented Oil contamination is on sandy beach (easier to clean up than rocky intertidal zone) Shellfish beds protected Number of miles that have been cleaned to an acceptable level How many pounds of oil contaminated debris has been recovered and sent off for disposal? How many gallons of oil have been recovered? Number of birds oiled? Number of birds released and survived Mortality/survival of wildlife (birds) Number of roseate terns lost Number of dead birds per unit search area Number of dead birds Percent of birds rehabilitated Number of birds rehabilitated Have cleanup standards for shoreline contamination been met?
Did getting required permits delay response action? Booming deployed around critical habitat (Roseate tern nesting habitat, salt marshes)? Attempt to direct oil to “sacrificial areas”? Good choices made about where to deploy boom? Oil being captured in open water before it hits the beach? Proper placement of skimmers? Resources placed in the proper locations How fast (# of days/ # of hours) rehabilitation efforts brought in and set up operations Is rehabilitation center handling all live birds coming in? Speed at which able to handle birds coming in for rehabilitation? Amount of area covered in search and recovery Volunteers able to get plugged in well? Time it takes to implement tasks, such as boom deployment?
Number of sandbags deployed? Number of people on cleanup crews to deal with oiled beaches? Amount of boom deployed Number of floating resources to pick up oil in open water oil? Number of skimming units available and operable Number of volunteers Number of bodies to manage different aspects of response, including organizing SCATs? Is there a ‘bird searcher’ on each team?
22
Type of Metric End-Point Process Resource
Establish a coordinated and effective response framework
Modelers able to get 24 hours ahead of spill with accurate projections Are pre-identified areas potentially being affected? Did we have information to keep governor’s office and other state senators and reps abreast of what was going on? Understanding of whether oil is still stored offshore re-contaminating cleaned up beaches? Is oil coming on shore several days later? Accurate accounting of volume oil spilled? Accurate accounting of amount of oil on the shore? How many areas have been cleaned as of today? Number of miles of shoreline impacted right now? Bad feelings among local responders toward the unified command staff? Level of conflict about plans and activities?
How quickly decisions made? Chain of command clear? Resources placed in the proper locations Are decisions correct (in hindsight)? Location of command center convenient and easily accessible? Are crews visiting hard hit areas every day? Shoreline assessment teams record information in a unified way 1) where is oil, 2) how much, and 3) what does shoreline look like; want minimal variability Organized, systematic way of recording where oil has come ashore and impacted is used Systematic, ‘non-political’ approach used to deploy cleanup crews Presence of watchdog to see what’s going on? Is there conflict or chaos in command center? Are players familiar with each other? and reliable communication technology available (e.g., cell phones working)? System established to track progress? Experts consulted for input on response strategies? Command center set up and people mobilized? Plans communicated day in advance? Ability to effectively and timely monitor what happening in field? Are there clear protocols? Are there clear schedules? Time it takes to implement tasks, such as boom deployment? Is all pertinent data gathered and recorded? Local responders notified quickly? Conflicts and heated emotions among responders addressed? All goals worked on together? Attend to short, medium, and long term needs simultaneously? Follow ‘best response’ protocol and integrated command system? Revise objectives and activities based on monitoring effort? Coordination of volunteers performed? Volunteers integrated into cleanup appropriately? Volunteers integrated into cleanup quickly? Equipment and personnel demobilized when no longer needed?
Number of teams of trained observers walk coastline and make observations of extent and coverage area of oil Number crews trained Type of oil Phones available and working Number of hours worked Number supervisors out in field
23
Type of Metric End-Point Process Resource
Implement an effective and timely response
Volume spilled compared to what’s removed from the shoreline What it looks like a year later Evidence of oil on shoreline How much oil was recovered off the water? How much oil was recovered off the shore? Endpoints in plan achieved? Are desired endpoints achieved in reasonable amount of time? Number of days until endpoints achieved? Are response actions having the desired effect? Members of the public voice support? Number of public meetings organized? Good working relationships with all parties involved? Command center and command personnel located in accessible location
Cleanup of impacted areas organized to be manageable and able to monitor? Access established for recovery and cleanup crews through private property? Plans communicated day in advance? Location of command center convenient and easily accessible? Ability to effectively and timely monitor what is happening in the field? Muster all forces in town? Local officials set up task force for how to handle spill response? Clear and reliable communication technology available (e.g., cell phones working)? Do efforts correspond to tides? Are there clear protocols? Are there clear schedules? Data sheets available and sufficient? Are cleanup crews assigned effectively to do a good job? Recovery or rehabilitation of wildlife conducted? How soon have experts been called and set up triage and rehab centers? Time it takes to implement tasks, such as boom deployment? Is entire shoreline being inspected—both oiled and non-oiled? How often is beach searched, all shoreline searched? Is all pertinent data gathered and recorded? Basic training for volunteers on bird collection and rehabilitation conducted? Equipment and personnel demobilized when no longer needed?
Number of people in the field? A ‘bird searcher’ on each SCAT? Hours worked? Supervisors out in field? Number of monitors in field to give direction and warning to clean up crews? Resources adequate for planned tasks? Amount of boom deployed? How much money spent? Types of skills represented on team? Number of volunteers? Number of packets of baby oil for oil removal distributed?
24
Type of Metric End-Point Process Resource
Mitigate economic impacts
Lost rental income? Lost tourism dollars? Loss of summer rentals? When beaches put back in use? Recreational opportunities that were lost that are now back to what they were? Acres of shellfish areas closed? How many acres of closures reopened? Duration of shell fish bed closures? Acres of shellfish beds lost? Costs of laboratory work? Money spent on response?
Meet legal and regulatory requirements
Achieve termination endpoints? No oil should come off to the touch Shoreline back to conditions prior to spill? Evaluate response with respect to endpoints achieved For sandy beach no visible oil For groin (jetties between properties), riprap no sheen or no oil available when touched For marshes no sheen No odor of oil
Number of days until endpoints achieved.
Mitigate social nuisance impacts
Presence of stained rocks that lead people to say that it’s not successful because you can still see evidence of that? Complaints about stained rocks? Oil on the beach?
25
Type of Metric End-Point Process Resource
Address needs and concerns of the affected public/communities
Level of staining and other aesthetic damage? Complaints about stained rocks? Residual oil on shore (tar balls)? Number of phone calls to complain? Spirit of state regulations for public involvement was met
A timeframe for ending the cleanup is established Ongoing monitoring and addressing of issues post-spill? People have a place or someone to go to with concerns? Public receives assurances that beaches will be cleaned up to the level of their expectation? Information fairs and public meetings set up? A forum is provided to public so they can hear what’s going on in response action and give their feedback Number of public meetings Level of conflict/anger People are happy Number of visuals for media People given examples of what was impacted and what kinds of cleanup was going on Public provided the kinds of information it wants? Establish and keep up to date website for public information
Number of pamphlets distributed to inform public of hazards Number of stakeholders involved in setting cleanup standards Number of dispatch teams arranged to reach out to various stakeholders Frequency of information postings on BBP website Number of flyers passed out about educating public on risks
26
Type of Metric End-Point Process Resource
Gain public support for the response
Members of the public voice support? Level of staining and other aesthetic damage? Complaints about stained rocks? Residual oil on shore (tar balls)? Number of phone calls to complain? Was there trust from the public? Public comments of support from critics and local residents (about response effort, not about outcomes)? Spirit of state regulations for public involvement was met
A timeframe for ending the cleanup is established Ongoing monitoring and addressing of issues post-spill? People have a place or someone to go to with concerns? Public receives assurances that beaches will be cleaned up to the level of their expectation? Information fairs and public meetings set up? Relationships and trust with local officials developed? A forum is provided to public so they can hear what’s going on in response action and give their feedback Number of public meetings Level of conflict/anger People are happy Number of visuals for media People given examples of what was impacted and what kinds of cleanup was going on Public provided the kinds of information it wants? Quality of questions from media Establish and keep up to date website for public information Able to ‘stay on message’ during public meetings, press conferences, etc.? Unified Command accessible for public questions and comments?
Number of pamphlets distributed to inform public of hazards Number of stakeholders involved in setting cleanup standards Number of dispatch teams arranged to reach out to various stakeholders Frequency of information postings on BBP website Number of flyers passed out about educating public on risks
8.2. CHALK POINT Type of Metric End-Point Process Resource
Protect worker and public health and safety
Presence of PHCs in water samples? Concentrations of oil in fish samples Level of PHCs in clam/oyster tissue Number of (human) life-threatening situations Toxins in smoke plume if do in situ burning
27
Type of Metric End-Point Process Resource
Protect environment and mitigate environmental impacts
Number of oiled swans Number of fish killed Damage from cleanup actions remediated? Number of animals saved “Appropriate” wildlife saved (e.g., not exotics or ‘varmints’) Oiling of osprey eggs Number of dead ducks Number of injured birds around marsh area Oiling on Diamondback terrapin eggs Mortality of wildlife How far sheen at surface extended out (miles)? How long oil stayed? Presence of odors of oil How much grass was destroyed? How many acres of marsh were impacted? How many oiled birds were observed? Dead and stressed organisms found (rather than estimated)? How long it takes to reach background levels/concentrations Observe water blowing over booms How long does it take for area to recover from cleanup related damage? Degree of change to beaches and sandbars from cleanup actions Types of animals and vegetation present after spill cleanup Areas that were impacted cleaned up to conditions before the spill happened
Accurate cataloguing and enumeration of what was found Monitoring stations established Deploy booming and double-booming in sensitive areas Immediacy of rehabilitator organization’s response to call for assistance Change of helicopter flight patterns in response to requests from biologists to not disturb nesting birds
Presence of booms Amount of oil containment boom deployed
28
Type of Metric End-Point Process Resource
Protect cultural resources
Number of critical sites protected Residual presence of oil on artifacts Smell of oil Soil concentrations of oil
Did trench digging affect sites? Experts contacted early for input about sites potentially at risk? Command responsive to requests for protection of sites (e.g., deployment of booms) Were less destructive response actions chosen (e.g., sorbents and booms rather than burning)
Number of GIS and hard maps Number of laptops Amount of boom deployed Accurate spatial information about location of sites and artifacts
Meet legal and regulatory requirements All procedures followed (e.g., NIMS)
Mitigate economic impacts
Devaluation of property? Number of dead fish Number of dead ducks and geese Lost wages to watermen Number of lost fishing days Dollar value for days of beach closures Change in earnings relative to previous years Cost of response actions compared to value of lost resources (e.g., artifacts) Duration of recreational fishing closures Duration of beach closures Presence of PHCs in water samples Increase in crime rate (in southern MD due to influx of people from cleanup crews) Monetary compensations PEPCO made restitution to counties for employee overtime and personal equipment used in supporting response efforts
Funds spent on important and appropriate projects RP cleaned boats that were soiled with oil from spill
Amount of money spent on studies Total cost of cleanup
29
Type of Metric End-Point Process Resource
Establish a coordinated and effective response framework
Clear chain of command established? Incident Command System used?
Number of hours to set up incident command center Number of daily meetings Daily reports for morning meetings held by UC? Informed of meetings in advance (i.e., lead time) RP is responsive Key people became involved early? Is Incident Commander able to reach key people, does their phone number work, did they respond? Clear communication protocols? Stable command posts established? Time taken to re-staffing response people after contractor fired Chauvinistic behavior among staff in command center? Frequency of resource and personnel changes All federal responders notified quickly? Pick-up and shipping schedule for waste generated by cleanup organized? Response organized by discrete (river) segments Frequency of meetings Accurate information obtained from the wildlife surveys and SCAT teams Clear standards for signoff established People in field used to verify accuracy of information Did Unified Command resist information that did not conform to their expectations? Arguments and lack of cooperation among Unified Command Clarity to all parties about stages of response effort Clear understanding of rights the state trustees have as a state agency
Number of supervisors assigned per section Enough Spanish-speaking crew supervisors? Number of radios available Availability of GIS and computers
30
Type of Metric End-Point Process Resource
Implement an effective and timely response
Number of feet of shoreline impacted Presence/absence of sheen Number of gallons of oil recovered Number of days company (PEPCO) was shut down No oil in water How long takes to reach endpoints Oil present in sediments? Areas that were impacted to be cleaned up to the ecological state the environment was before the spill happened Patchiness of oil Solid sheet of heavy oil Presence/absence of tarballs Is oil being contained? Number of areas to be signed off compared to number actually signed off Number of areas that were identified as sensitive areas ordered to be boomed off but order was not followed through and area was impacted
Digging holes to look for oil on shoreline? Quarterly checks to see if oil is present or not on beaches Breach of water over boom? Protection equipment put in the right place at the right time? Number of times a single order was given but still not done Accurate reporting and counting of crews in field Number of newsletters published by RP Number of public meetings held by RP Time it takes to get response in order Number/frequency of flyovers for real time aerial photography Time taken to set up boom Clear chain of command established? Lead resources mobilized? Communication funneled out to the appropriate people? Quality of contractor work (e.g., perform required tasks? How quickly SCATs out in field? Time it takes to resolve bad cell phone coverage, radio issues?
Cost of response Number of cleanup teams and people on crews Amount of money spent by RP Number of laptops Number of GIS and hard maps Amount of equipment brought in Pounds of sorbent material used Amount of oil containment boom deployed Number of people working at one time Number of people per SCAT
Address needs and concerns of the affected public/communities
Public reimbursements for private property losses Number calls from public Number of fliers and informational packets delivered door to door Amount of oil removed manually from shoreline
Immediacy of public meetings (number days after spill occurs) Incorrect information disclosed?
Number of hours agencies spent on public outreach (meetings)
Gain support of public
Public reimbursements for private property losses Number calls from public Number of fliers and informational packets delivered door to door
Immediacy of public meetings (number days after spill occurs) Incorrect information disclosed?
Number of hours agencies spent on public outreach (meetings)
31
9. References
1. Belton V, Stewart T. Multiple criteria decision analysis: an integrated approach. Boston: Kluwer Academic Publishers; 2002.
2. Chess C, Johnson BB, Gibson G. Communicating about environmental indicators. J Risk Research. 2005; 8:63-75.
3. Figueira J, Greco S, Ehrgott M, editors. Multiple criteria decision analysis: state of the art surveys. New York: Springer; 2005.
4. Gore A. From red tape to results: creating a government that works better & costs less - report of the National Performance Review. Washington, DC: U.S. Government Printing Office; 1993.
5. Grabowski MR, Harrald JH, Roberts KH. Decision support and organizational forms in a high velocity environment: responses to catastrophic oil spills. In: Grabowski MR, Wallace WA, editors. Advances in expert systems for management, vol. 2. Greenwich: JAI Press; 1997.
6. Harrald JR. Preparing for success: a systems approach to pollution response. Paper presented to the Five Years After the Exxon Valdez Oil Spill Conference, Anchorage Alaska. 1994.
7. Harry MJ. Six Sigma: a breakthrough strategy for profitability - making strides along the road to defect-free work. Quality Progress. 1994; 31(5):60-66.
8. Kiker G, Bridges T, Varghese AS, Seager TP, Linkov I. Application of multi-criteria decision analysis in environmental management. Integr. Environ. Assess. Manage. 2005; 1:49-58.
9. Klein G. Sources of power. Cambridge: MIT Press; 1999.
10. Kravchuck R, Schack R. Designing effective performance-measurement systems under the Government Performance and Results Act of 1993. Public Administration Review. 1996; 56(4):348-358.
11. Lahdelma R, Salminen P. SMAA-2: stochastic multicriteria acceptability analysis for group decision making. Operations Research. 2001; 49(3):444-454.
12. Lahdelma R, Salminen P. Pseudo-criteria versus linear utility function in stochastic multicriteria acceptability analysis. European Journal of Operational Research. 2002; 141(2):454-469.
13. Lahdelma R, Salminen P, Hokkanen J. Using multicriteria methods in environmental planning and management. Environmental Management. 2000; 26(6):595-605.
14. Linkov I, Varghese A, Jamil S, Seager TP, Kiker G, Bridges T. Multi-criteria decision analysis: framework for applications in remedial planning for contaminated sites. In: Linkov I, Ramadan A, editors. Comparative risk assessment and environmental decision making. Amsterdam: Kluwer; 2004.
15. Linkov I, Satterstrom FK, Seager TP, Kiker G, Bridges T, Belluck D, Meyer A. Multi-criteria decision analysis: comprehensive decision analysis tool for risk management of contaminated sediments. Risk Analysis. 2006; 26(1):61-78.
32
16. Linkov I, Satterstrom FK, Kiker G, Bridges T, Benjamin S, Belluck D. From optimization to adaptation: shifting paradigms in environmental management and their application to remedial decisions. Integrated Environmental Assessment and Management. 2006; 2(1):92-98.
17. NOAA. Characteristics of response strategies: a guide for spill response planning in marine environments. Washington DC; National Oceanic and Atmospheric Association; 2001. Available at: http://response.restoration.noaa.gov/book_shelf/910_response.pdf.
18. Seager TP. Understanding industrial ecology and the multiple dimensions of sustainability. In O’Brien and Gere Engineers, editors. Strategic environmental management. New York: John Wiley & Sons; 2004.
19. Tervonen T, Figueira JR, Lahdelma R, Salminen P. Towards robust ELECTRE III with simulation: theory and software of SMAA-III. European Journal of Operational Research. Under review. 2007.
20. Tuler SP, Seager TP, Kay R, Linkov I. Objectives and performance metrics in oil spill response: the Bouchard-120 and Chalk Point spill responses. In Linkov I, Kiker G, Wenning R, editors. Environmental security in harbors and coastal areas. Amsterdam: Springer; 2007. In press.
21. Tuler SP. Individual, group and organizational decision-making in technological emergencies. Indust. Crisis Quarterly. 1988; 2:109-138.
22. Yoe C. Tradeoff analysis planning and procedures guidebook. Prepared for Institute for Water Resources, U.S. Army Corps of Engineers. April 2002.