A multi-parametric flow cytometric assay to analyze DNA–protein interactions The MIT Faculty has made this article openly available. Please share how this access benefits you. Your story matters. Citation Arbab, M. et al. “A Multi-parametric Flow Cytometric Assay to Analyze DNA-protein Interactions.” Nucleic Acids Research 41.2 (2012): e38–e38. As Published http://dx.doi.org/10.1093/nar/gks1034 Publisher Oxford University Press Version Final published version Citable link http://hdl.handle.net/1721.1/77989 Terms of Use Creative Commons Attribution 3.0 Detailed Terms http://creativecommons.org/licenses/by-nc/3.0
Transcript
A multi-parametric flow cytometric assayto analyze DNA–protein interactions
The MIT Faculty has made this article openly available. Please share how this access benefits you. Your story matters.
Citation Arbab, M. et al. “A Multi-parametric Flow Cytometric Assay toAnalyze DNA-protein Interactions.” Nucleic Acids Research 41.2(2012): e38–e38.
As Published http://dx.doi.org/10.1093/nar/gks1034
A multi-parametric flow cytometric assay to analyzeDNA–protein interactionsMandana Arbab1, Shaun Mahony2, Hyunjii Cho2, Joel M. Chick3, P. Alexander Rolfe2,
John Peter van Hoff1, Viveca W.S. Morris1, Steven P. Gygi3, Richard L. Maas1,
David K. Gifford2 and Richard I. Sherwood1,*
1Division of Genetics, Department of Medicine, Brigham and Women’s Hospital and Harvard Medical School,77 Avenue Louis Pasteur, Boston, MA 02115, 2Computer Science and Artificial Intelligence Laboratory,Massachusetts Institute of Technology, Cambridge, MA 02139 and 3Department of Cell Biology, HarvardMedical School, Boston, MA 02115, USA
Received March 30, 2012; Revised September 25, 2012; Accepted October 5, 2012
ABSTRACT
Interactions between DNA and transcription factors(TFs) guide cellular function and development, yet thecomplexities of gene regulation are still far from beingunderstood. Such understanding is limited by apaucity of techniques with which to probe DNA–protein interactions. We have devised magneticprotein immobilization on enhancer DNA (MagPIE),a simple, rapid, multi-parametric assay using flowcytometric immunofluorescence to reveal inter-actions among TFs, chromatin structure and DNA.In MagPIE, synthesized DNA is bound to magneticbeads, which are then incubated with nuclearlysate, permitting sequence-specific binding by TFs,histones and methylation by native lysate factors thatcan be optionally inhibited with small molecules.Lysate protein–DNA binding is monitored by flowcytometric immunofluorescence, which allows foraccurate comparative measurement of TF-DNAaffinity. Combinatorial fluorescent staining allowssimultaneous analysis of sequence-specific TF-DNAinteraction and chromatin modification. MagPIEprovides a simple and robust method to analyzecomplex epigenetic interactions in vitro.
INTRODUCTION
The regulation of gene expression by transcription factors(TFs) and by epigenetic interactions is at the core ofcellular function and development. DNA is bound bysequence-specific TFs, covalently modified by methylationand wrapped around histones with chemical alterationsthat vary its accessibility, all of which contribute to
regulation of gene expression. Gaining a better under-standing of these mechanisms will allow more accurateunderstanding and manipulation of tissue-specific geneexpression, which carries significant implications formany areas of biology.Traditionally, TFs have been considered the primary
regulators of cell type-specific gene expression. TFs bindto 5–15 base pair sequences of DNA and can activate orrepress gene expression by interaction with RNA polymer-ase II through coactivators (1,2) or by alteration of chro-matin to facilitate or restrict gene expression indirectly(3,4). TFs bind in vivo to only a small fraction of the se-quences they can bind to in vitro (5), and predictions ofwhich sites a TF will occupy in a given cell type areimprecise. Our inability to accurately predict TF bindingcan be partly explained by differential chromatin structureand partly by the fact that TFs are known to operate inlarge multi-component complexes (6), and our knowledgeof the logic of multi-TF DNA-binding interactions isrudimentary.In addition to TFs, covalent modifications of DNA and
histones have been found to affect gene expression. DNAmethylation represses genes by recruitment of repressiveDNA-binding proteins and interference with transcrip-tional activators (7). Furthermore, a wide array ofhistone modifications (e.g. methylation, acetylation, phos-phorylation and ubiquitinylation) has been found to bepositively and negatively correlated with gene expressionat enhancer and promoter regions (8). However, how theDNA sequences and proteins contribute to sequence-specific chromatin alteration is largely unexplained.Much research has focused on elucidating the mechan-
isms through which TFs recognize and bind specific DNAsequences and how they influence gene expression. In vitrotechniques involve incubating nuclear lysate or purified
*To whom correspondence should be addressed. Tel: +1 617 525 4772; Fax: +1 617 525 4751; Email: [email protected] address:Mandana Arbab, Hubrecht Institute, Uppsalalaan 8, 3584 CT Utrecht, The Netherlands.
� The Author(s) 2012. Published by Oxford University Press.This is an Open Access article distributed under the terms of the Creative Commons Attribution License (http://creativecommons.org/licenses/by-nc/3.0/), whichpermits non-commercial reuse, distribution, and reproduction in any medium, provided the original work is properly cited. For commercial re-use, please [email protected].
Nucleic Acids Research Advance Access published November 11, 2012 at M
TFs with DNA containing putative binding sites. InDNase I footprinting, the DNA is cleaved with DNaseI after protein incubation, revealing binding sites bytheir ability to protect DNA from DNase I cleavage (9).In electrophoretic mobility shift assay (EMSA), DNA–protein complexes are run on a gel, revealing impededmobility of DNA regions that are protein bound (10).More recently, high-throughput protein-binding micro-arrays (PBMs) have been developed in which TFs areincubated with an arrayed collection of small oligonucleo-tides and stained using immunofluorescence, leading toinformation on binding preference for all possible oligo-nucleotide sequences (11,12). These assays have provedpowerful at elucidating the DNA-binding preferences ofTFs, allowing for generation of position weight matrices(PWMs) that represent TF sequence specificity. However,the assay has been used primarily with purified TFs ordefined combinations of TFs (13), thus overlookingcomplexities that exist within a cell. Furthermore, PBMassays do not easily allow for simultaneous multi-parametric analysis or simultaneous analysis of TFbinding and chromatin modifications.In vivo techniques are also useful at examining TF
binding. In chromatin immunoprecipitation (ChIP), TFsare crosslinked to bound DNA in live cells, and by frag-menting DNA, immunoprecipitating a TF of interest andeluting DNA, in vivo bound DNA can be assayed for byPCR or microarray (14). Recently, genome-wide mappingof TF-binding sites in vivo has become feasible bycombining ChIP with massively parallel DNA sequencing(ChIP-Seq) (5). ChIP has also been used to map genomicchromatin modifications (15). ChIP-Seq is a powerfultechnique for analyzing TF binding and chromatin modi-fication, but it is not easily amenable to manipulation ofbinding sites nor does it allow for multi-parametricanalysis. Mapping of open chromatin by DNase I hyper-sensitivity sequencing (DNase-Seq) (16) or formaldehyde-assisted isolation sequencing (FAIRE-Seq) (17) providesa broader view of active regulatory regions yet does notprovide information about the underlying epigeneticevents. Thus, in vitro techniques must be used to analyzeDNA-binding sites identified in ChIP-Seq, DNase-Seqand FAIRE-Seq experiments.We have devised a method, magnetic protein immobil-
ization on enhancer DNA (MagPIE), to allow rapid, high-throughput, semi-quantitative, multi-factorial analysis ofinteractions among TFs, chromatin and DNA. In thisassay, DNA is bound to magnetic beads using biotin–streptavidin (SA) interaction, and these DNA-coatedmagnetic beads are employed to pull down sequence-specific TFs and potentially their partners from crudenuclear lysate in a 10-min binding reaction (Figure 1).By immunostaining with fluorescently tagged TF-specificantibodies followed by flow cytometric analysis, TF occu-pancy on the DNA can be measured.MagPIE allows analysis not only of TF binding but
also of epigenetic modifications, as use of crude nuclearlysates allows DNA to be modified by methylation andto be packaged into chromatin, and we show usingimmunostaining for modified chromatin that both ofthese processes occur in a regulated fashion. By
combinatorial fluorescent staining, both TF-DNA inter-action and chromatin modification can be analyzed atonce with future possibility to analyze a wide array ofDNA-mediated interactions simultaneously. Thus, wehave devised a method to study relative affinities ofTF-DNA interactions while allowing simultaneousprobing of multiple proteins and chromatin modifications.
MATERIALS AND METHODS
DNA amplification and bead binding
Oligonucleotides used in this study are listed inSupplementary Table S1 and were ordered fromIntegrated DNA Technologies. Significantly, all DNAregions were amplified and attached to beads usingprimers shown previously to have minimal affinity toTFs (11). PCR was performed using Onetaq 2X MasterMix or Phusion 2X Master Mix (New England Biolabs)using recommended PCR conditions.
SA-coated magnetic beads (0.5 ml M-280 StreptavidinDynabeads per experiment, Life Technologies) arewashed twice with 1� DNA-binding buffer (1� DBB:10mM Tris–HCl, pH 7.5, 1M NaCl, 500 mM EDTA inH2O) and precipitated magnetically using a 100 � 100 � 100
NIB magnet (McMaster Carr). Beads are resuspended in2� DNA-binding buffer (2� DBB: 20mM Tris–HCl, pH7.5, 2M NaCl, 1mM EDTA in H2O), and an equalvolume of biotinylated DNA is added. DNA is incubatedwith beads for 20–60 min at RT with rotation. Beads arewashed twice with 1� DBB, blocked with 4% milk(Sigma) and stored in 1� protein wash buffer (1� PWB:10mM Tris–HCl pH 8.0, 5mM MgCl2, 50mM KCl,50mM NaCl, 4% glycerol, 0.05% Triton X-100 [Sigma]with 1:25 Protease Inhibitor Cocktail [PIC, Roche] and10mM DTT added fresh).
Cell culture
Undifferentiated 129P2/OlaHsd mouse ES cells anddoxycycline-inducible V5-tagged Cdx2 or Onecut1mouse ES cells (18) were maintained on gelatin-coatedplates with mouse embryonic fibroblast feeders inKnockout DMEM (Invitrogen) supplemented with 15%ES tested fetal bovine serum (FBS) (HyClone), 0.1mMnonessential amino acids (Invitrogen), Glutamax(Invitrogen), 0.55mM 2-mercaptoethanol (Sigma) and1� ESGRO LIF (Chemicon). For expansion, ES cellswere passaged onto gelatin-coated 15 cm dishes andcultured in Knockout DMEM (Invitrogen) supplementedwith 10% ES tested FBS (HyClone), 0.1mM nonessentialamino acids (Invitrogen), Glutamax (Invitrogen) and0.55mM 2-mercaptoethanol (Sigma). When necessary,cells were treated with 2 mg/ml doxycycline for 24–48 hbefore harvest to induce ectopic TF expression.
Cell lysate preparation
Cell lysate preparation was performed according to theCellLytic protocol (Sigma). Briefly, adherent 15 cmplates of mouse embryonic stem cells are washed twicewith ice cold PBS, 2ml PBS is added and cells are
Figure 1. MagPIE experimental flowchart. (A) Genomic regions are amplified by PCR using sequence-specific primers linked to MagPIE primersequences predicted to have low TF-binding affinity. The DNA is further amplified using a biotinylated MagPIE reverse primer and a MagPIEforward primer that may be tagged with a fluorophore. (B) Biotinylated DNA is captured on SA-coated magnetic beads. (C) Bead-immobilized DNAis incubated with crude nuclear protein lysate in the presence of competitor poly(dI:dC) DNA to pull down sequence-specific nuclear factors in a10-min binding reaction at 37�C. (D) TFs and other DNA-bound proteins are immunostained with fluorescently tagged antibodies, and fluorescenceintensity is analyzed by flow cytometry.
scraped and pelleted at 13 500� g for 5min at 4�C. Cellsare resuspended in 1ml/plate lysis buffer (10mM HEPESpH 7.9, 1.5mMMgCl2 and 10mMKCl with 1:25 PIC and10mM DTT added fresh) and incubated for 15 min at 4�Cwith rotation; 60 ml/plate of 10% Igepal-630 (Sigma) isadded, and the mixture is vortexed for 15 s and pelletedat 13 500g for 5 min at 4�C. Nuclei are resuspended in1ml/plate equilibration buffer (20mM HEPES pH 7.9,1.5mM MgCl2, 200 mM EDTA, 30mM KCl and 25%glycerol with 1:25 PIC and 10mM DTT added fresh)and pelleted at 12 000g for 4 min at 4�C. Nuclei are resus-pended in 50–100 ml/plate nuclear lysis buffer (20mMHEPES pH7.9, 1.5mM MgCl2, 420mM NaCl, 200 mMEDTA and 25% glycerol with 1:25 PIC and 10mMDTT added fresh), vortexed for 1 min and incubated for15–30 min at 4�C with rotation. Lysate is centrifuged at12 000g for 4 min at 4�C, and supernatant is passedthrough Ultrafree-MC columns (0.65 mm pore size,Millipore). Protein concentrations of 5–10mg/ml are rou-tinely obtained. Nuclear lysate is aliquotted, frozen inliquid nitrogen and stored at �80�C.
Protein–DNA binding and downstream analysis
Nuclear lysate is thawed on ice and diluted inprotein-binding buffer (PBB), such that lysate is at afinal concentration of �1–3mg/ml, and reaction hasa final concentration of 10mM Tris–HCl pH8.0, 5mMMgCl2, 50mM KCl, 50mM NaCl, 4% Glycerol, 0.05%Triton X-100 (Sigma) with 1:25 Protease InhibitorCocktail (PIC, Roche), 10mM DTT, 0.01% BSA,500mM ATP and 7 mg/ml poly(dI:dC) (Sigma) addedfresh. DNA-coated beads are precipitated magnetically,and 5 ml of lysate:PBB mix is added to 0.5 ml ofDNA-coated beads, mixed thoroughly and incubated for10 min at 37�C. Binding is terminated by placing thereaction on ice and adding 50 ml PWB. Beads are washedtwice in PWB.After magnetic precipitation, beads are resuspended
in 10 ml antibody solution containing all primary andfluorescent secondary antibodies. Staining is performedfor 20–60 min at 4�C with rotation. Beads are washedtwice in PWB and resuspended in 50 ml PWB for flowcytometric analysis using an Accuri C6 flow cytometer(BD Biosciences).For mass spectrometric preparation, reactions were
scaled up 100-fold keeping all components proportional.Beads were washed eight times with PWB. Protein precipi-tation was performed on each sample using a final con-centration of tricloroacetic acid of 20% and incubated onice for 1 h. Samples were centrifuged at 10 000g for 5minafter which the supernatant was discarded and the pelletwashed twice with 100% ice cold acetone. Each samplewas then resuspended in 50ml of 8M urea and then sub-sequently diluted to 1.5M urea using 50mM Tris(pH 8.2). Samples were digested overnight at 37�C usingtrypsin. Each sample was desalted using self-packed C18STAGE-tips (19), dried down using a vacuum centrifugeand resuspended in 1% formic acid. All LC�MS/MS datawere obtained using an LTQ-Orbitrap hybrid mass spec-trometer (Thermo Fisher). Each sample was loaded onto a
reverse phase column and separated using 120min LCgradient of 5–27% buffer B at a flow of 0.5–1 ml/min.MS analysis was performed using top10 methods wherethe MS1 scan was acquired in the Orbitrap followed by 10data-depended MS/MS scans on the 10 most intense ionsin the LTQ with CID for fragmentation. MS/MS spectraassignments were made with the Sequest algorithm (20)using the entire mouse IPI database (version 3.6).Sequest searches were performed using a target-decoystrategy (21) with the mouse IPI database in correct orien-tation (forward database) and the same database but withall sequences in reverse orientation (reverse database).Sequest searching was performed with a precursor ion tol-erance of 20 ppm with trypsin specificity, cysteinecarboxyamidomethylation was considered a static modifi-cation and methionine oxidation was considered adynamic modification. A protein level false discoveryrate of less than 1% was used as a threshold for proteinidentifications using the target decoy strategy.
DNase I digestion of beads was performed by incu-bating DNA-coated beads either alone or after proteinlysate binding with 1:100 final concentration of DNase I(Promega) in DNase I digestion buffer (Promega).Reactions were stopped after 3 min by addition ofDNase I stop solution (Promega), and supernatant wasrun on a 2.5% agarose gel and imaged using a TyphoonImager (GE Healthcare).
Antibodies used include mouse anti-V5 (R960-25,Invitrogen), mouse anti-Cdx2 (Biogenex), rabbit anti-Histone 3 Lysine 4 Monomethyl (Cell Signaling), sheepanti-Cytosine, 5-methyl (US Biological), sheep anti-Onecut1 (R&D Systems) and mouse anti-Sox2 (R&DSystems). Secondary antibodies include DyLight488 andDyLight649 conjugates (Jackson Immunoresearch) andFITC (Fisher Scientific).
Statistical analyses were performed using a Student’st-test unless otherwise stated.
Scores from three binding affinity metrics were comparedwith Cdx2MagPIE intensities for the collection of 16 testedsequences normalized, such that the flow cytometric per-centage of Cdx2+ beads in the sequence predicted byUniprobe to be the strongest binding sequence was set to1.Z scores for eachof the variable 8-merswere sourced fromCdx2 PBM contiguous 8-mer analysis files downloadedfrom the Uniprobe database, accession number UP00133(11) and normalized, such that the highest scorewas set to 1.The bead-attached sequences were also scored against aCdx2 consensus motif using two related metrics: (i) thestandard log-likelihood ratio score from the PWM and(ii) the probability of binding occupancy defined byGranek and Clarke (22) The Cdx2 consensus motif wasdefined from Cdx2 ChIP-seq experiments. Specifically,binding events were predicted in the Cdx2 ChIP-seq datausing GPS (23), and the GimmeMotifs (24) softwarepackage was used to perform de novo motif finding on200-bp windows centered on the 2000 most enrichedChIP-seq-binding events.
As a first step to using flow cytometry to study TF-DNAinteractions, we monitored binding of PCR-amplified 50-biotinylated DNA to SA-coated magnetic beads. By at-taching a fluorophore, TYE665, to the non-biotinylatedprimer, we were able to monitor bead-bound DNA con-centration by flow cytometry. We found DNA concentra-tion to steadily increase with increasing amounts of DNAup to a saturation point of �300 ng of 130 bp biotinylatedDNA per ml of beads (Supplementary Figure S1). Toassess the efficiency of DNA binding to beads, we per-formed restriction digest of the bead-bound DNA andDNA quantification, which confirmed that �150 ngDNA or �1million DNA molecules were bound perbead (data not shown). For all future experiments, con-centrations >500 ng of DNA per ml beads were used, suchthat beads were saturated with DNA.
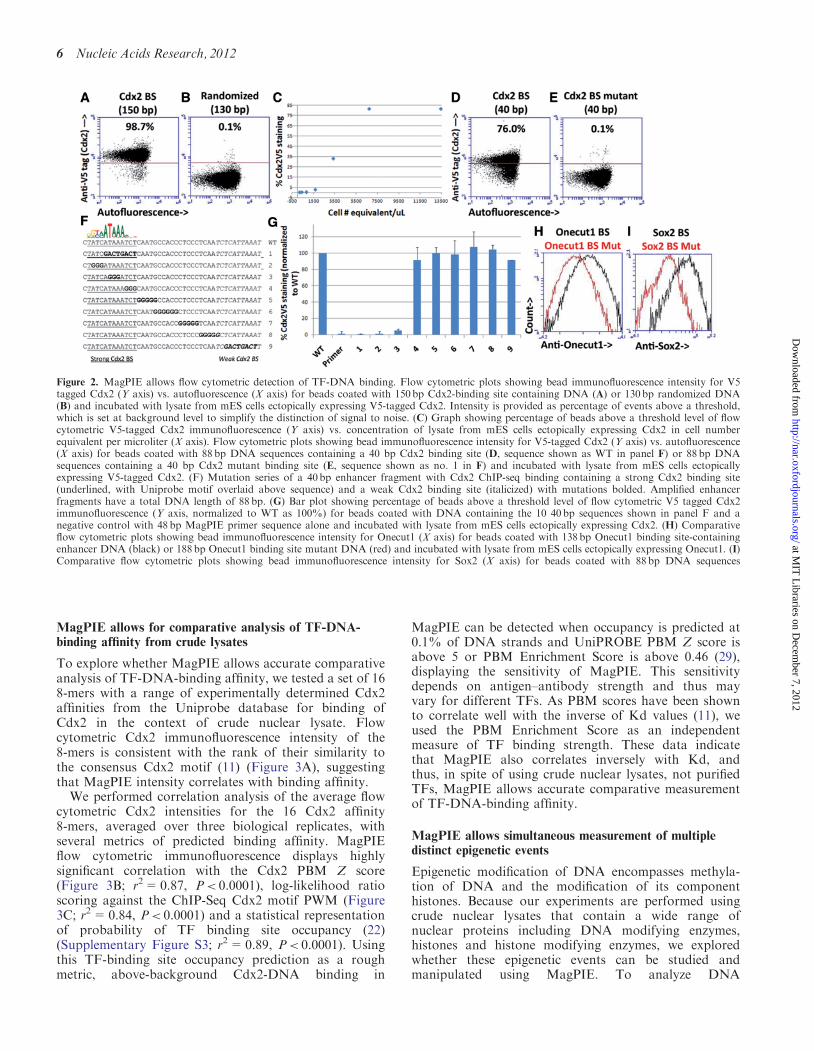
To determine whether DNA–protein interactions can beanalyzed using flow cytometry, DNA-bound SA beadswere incubated with crude nuclear lysate, andDNA–protein interactions were monitored using indirectimmunofluorescence staining. For these experiments, wefocused on binding of Cdx2, a TF which is required forproper intestinal development (18,25), and whose in vitroand in vivo binding preferences have been determined ex-tensively by PBM analysis and ChIP-Seq (26–28)(Sherwood et al., manuscript in preparation). DNAamplified using MagPIE primers from either a library ofrandomized 130 bp sequences or from a 150 bp enhancerregion displaying strong Cdx2 ChIP-seq binding(Sherwood et al., manuscript in preparation) wereincubated with nuclear lysate obtained from a mouse em-bryonic stem cell line that inducibly expressesV5 epitope-tagged Cdx2 protein (18) to allow monitoringof Cdx2 binding by means of an anti-V5 antibody(protocol detailed in Figure 1). A comparison of incuba-tion temperature and timing identified 10-min incubationat 37�C as optimal for rapid analysis of DNA–proteininteraction (data not shown), and incubation was per-formed in the presence of poly(dI:dC) competitor DNA(10). Flow cytometric analysis revealed a strong enrich-ment of Cdx2 binding to binding site-containing DNA,when compared with randomized DNA (Figure 2Aand B).
To optimize binding conditions, concentration of lysateand competitor DNA were tested. Concentration ofCdx2-containing lysate appears to have a linear bindingrelationship with binding site-containing DNA up to asaturation point (Figure 2C) and usage of lysate from>6� 103 cells per ml of final reaction volume (>3� 104
cells per reaction) corresponding to �1–3 mg/ml protein(5–15mg per reaction), a relatively minute quantity ofprotein compared with in vivo binding techniques, wasfound to allow for optimal enrichment and was usedfor the rest of the experiments. Concentration ofpoly(dI:dC) competitor DNA profoundly affectedthe comparative binding of Cdx2 to bindingsite-containing DNA versus randomized DNA
(Supplementary Figure S2) with specific interactions opti-mally enriched at 7–14 mg/ml poly(DI:DC). The amount ofDNA-bound SA beads added to a defined concentrationof lysate was also found to affect Cdx2 binding (data notshown), so bead amount was always kept constant at0.5ml (3� 105 beads) per reaction. Although distinctTFs, especially if not ectopically overexpressed as Cdx2was in these experiments, may require individualized op-timization of lysate and competitor DNA concentration,these values provide rough estimates to test TF-DNAbinding.To confirm that Cdx2-DNA binding was dependent on
the presence of a Cdx2 binding site, we analyzed the effectof binding site mutations. To facilitate this analysis, a40 bp ChIP-seq Cdx2-binding site with a strong [predictedby Uniprobe to be functional (26)] and a weak (predictedto be non-functional) Cdx2 motif were chosen formutation analysis. The motifs were amplified using theMagPIE forward and MagPIE biotinylated reverseprimers making the total sequence 88 bp long. Althoughthe strong 40 bp region displayed similar Cdx2-bindingaffinity to the 150-bp Cdx2-binding region (Figure 2D,sequence shown in Figure 2F as WT), missense mutationof the strong binding site resulted in a dramatic loss ofCdx2 binding to levels seen in DNA containing MagPIEprimers alone, which are predicted to have a low TF-binding affinity (Figure 2E, missense mutation sequenceshown in Figure 2F as no. 1 and MagPIE primer sequenceshown in Supplementary Table S1). Mutation of the weakbinding site did not affect Cdx2 binding (Figure 2F andG), confirming the prediction that Cdx2-DNA bindingdepends exclusively on the strong binding site.Additional analysis of 40 bp Cdx2-binding site regionscontaining 3–5 bp mutations at various locationsrevealed that mutations in three segments of the strongCdx2-binding site each completely ablate Cdx2 binding,whereas mutations in multiple regions outside of thestrong Cdx2-binding site do not affect Cdx2 binding(Figure 2F and G).To ensure that the optimized conditions developed
extend to factors other than Cdx2 and to lysates withoutectopically expressed TFs, further MagPIE analysis wasperformed. Beads bound with a 138 bp region from theOnecut1 promoter containing a strong Onecut1 bindingsite and incubated with lysate ectopically expressingOnecut1 display stronger flow cytometric immunofluores-cence for Onecut1 than MagPIE primer DNA or similar188-bp Onecut1-binding site DNA with the Onecut1-binding site mutated (Figure 2H). Similarly, beadsbound with an 88-bp DNA sequence containing a strongSox2-binding site and incubated with lysate from mEScells which endogenously express Sox2 display strongerflow cytometric immunofluorescence for Sox2 thanbeads bound with a similar 88 bp DNA sequence inwhich the Sox2-binding site is mutated (Figure 2I).Thus, MagPIE allows flow cytometric analysis ofTF-DNA interaction in the context of crude nuclearlysate, and binding depends strictly on the presence ofhigh affinity binding sites.
MagPIE allows for comparative analysis of TF-DNA-binding affinity from crude lysates
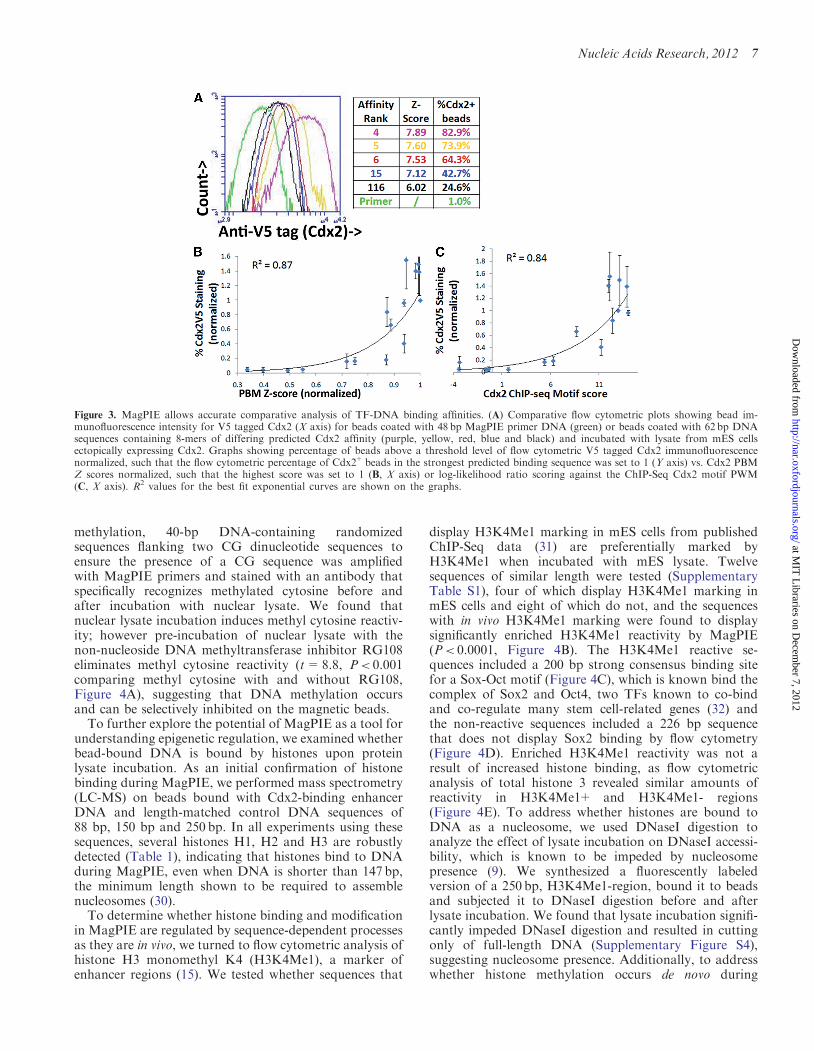
To explore whether MagPIE allows accurate comparativeanalysis of TF-DNA-binding affinity, we tested a set of 168-mers with a range of experimentally determined Cdx2affinities from the Uniprobe database for binding ofCdx2 in the context of crude nuclear lysate. Flowcytometric Cdx2 immunofluorescence intensity of the8-mers is consistent with the rank of their similarity tothe consensus Cdx2 motif (11) (Figure 3A), suggestingthat MagPIE intensity correlates with binding affinity.We performed correlation analysis of the average flow
cytometric Cdx2 intensities for the 16 Cdx2 affinity8-mers, averaged over three biological replicates, withseveral metrics of predicted binding affinity. MagPIEflow cytometric immunofluorescence displays highlysignificant correlation with the Cdx2 PBM Z score(Figure 3B; r2=0.87, P< 0.0001), log-likelihood ratioscoring against the ChIP-Seq Cdx2 motif PWM (Figure3C; r2=0.84, P< 0.0001) and a statistical representationof probability of TF binding site occupancy (22)(Supplementary Figure S3; r2=0.89, P< 0.0001). Usingthis TF-binding site occupancy prediction as a roughmetric, above-background Cdx2-DNA binding in
MagPIE can be detected when occupancy is predicted at0.1% of DNA strands and UniPROBE PBM Z score isabove 5 or PBM Enrichment Score is above 0.46 (29),displaying the sensitivity of MagPIE. This sensitivitydepends on antigen–antibody strength and thus mayvary for different TFs. As PBM scores have been shownto correlate well with the inverse of Kd values (11), weused the PBM Enrichment Score as an independentmeasure of TF binding strength. These data indicatethat MagPIE also correlates inversely with Kd, andthus, in spite of using crude nuclear lysates, not purifiedTFs, MagPIE allows accurate comparative measurementof TF-DNA-binding affinity.
MagPIE allows simultaneous measurement of multipledistinct epigenetic events
Epigenetic modification of DNA encompasses methyla-tion of DNA and the modification of its componenthistones. Because our experiments are performed usingcrude nuclear lysates that contain a wide range ofnuclear proteins including DNA modifying enzymes,histones and histone modifying enzymes, we exploredwhether these epigenetic events can be studied andmanipulated using MagPIE. To analyze DNA
Figure 2. MagPIE allows flow cytometric detection of TF-DNA binding. Flow cytometric plots showing bead immunofluorescence intensity for V5tagged Cdx2 (Y axis) vs. autofluorescence (X axis) for beads coated with 150bp Cdx2-binding site containing DNA (A) or 130bp randomized DNA(B) and incubated with lysate from mES cells ectopically expressing V5-tagged Cdx2. Intensity is provided as percentage of events above a threshold,which is set at background level to simplify the distinction of signal to noise. (C) Graph showing percentage of beads above a threshold level of flowcytometric V5-tagged Cdx2 immunofluorescence (Y axis) vs. concentration of lysate from mES cells ectopically expressing Cdx2 in cell numberequivalent per microliter (X axis). Flow cytometric plots showing bead immunofluorescence intensity for V5-tagged Cdx2 (Y axis) vs. autofluorescence(X axis) for beads coated with 88 bp DNA sequences containing a 40 bp Cdx2 binding site (D, sequence shown as WT in panel F) or 88bp DNAsequences containing a 40 bp Cdx2 mutant binding site (E, sequence shown as no. 1 in F) and incubated with lysate from mES cells ectopicallyexpressing V5-tagged Cdx2. (F) Mutation series of a 40bp enhancer fragment with Cdx2 ChIP-seq binding containing a strong Cdx2 binding site(underlined, with Uniprobe motif overlaid above sequence) and a weak Cdx2 binding site (italicized) with mutations bolded. Amplified enhancerfragments have a total DNA length of 88 bp. (G) Bar plot showing percentage of beads above a threshold level of flow cytometric V5 tagged Cdx2immunofluorescence (Y axis, normalized to WT as 100%) for beads coated with DNA containing the 10 40 bp sequences shown in panel F and anegative control with 48 bp MagPIE primer sequence alone and incubated with lysate from mES cells ectopically expressing Cdx2. (H) Comparativeflow cytometric plots showing bead immunofluorescence intensity for Onecut1 (X axis) for beads coated with 138bp Onecut1 binding site-containingenhancer DNA (black) or 188bp Onecut1 binding site mutant DNA (red) and incubated with lysate from mES cells ectopically expressing Onecut1. (I)Comparative flow cytometric plots showing bead immunofluorescence intensity for Sox2 (X axis) for beads coated with 88bp DNA sequences
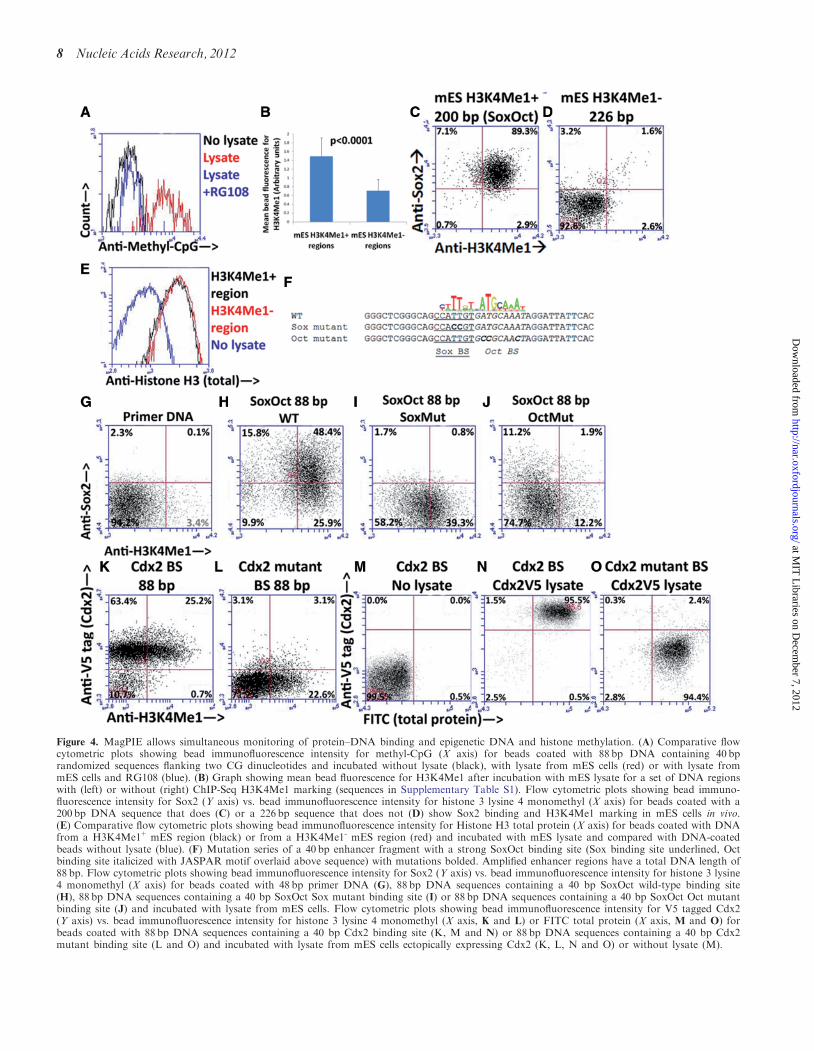
methylation, 40-bp DNA-containing randomizedsequences flanking two CG dinucleotide sequences toensure the presence of a CG sequence was amplifiedwith MagPIE primers and stained with an antibody thatspecifically recognizes methylated cytosine before andafter incubation with nuclear lysate. We found thatnuclear lysate incubation induces methyl cytosine reactiv-ity; however pre-incubation of nuclear lysate with thenon-nucleoside DNA methyltransferase inhibitor RG108eliminates methyl cytosine reactivity (t=8.8, P< 0.001comparing methyl cytosine with and without RG108,Figure 4A), suggesting that DNA methylation occursand can be selectively inhibited on the magnetic beads.
To further explore the potential of MagPIE as a tool forunderstanding epigenetic regulation, we examined whetherbead-bound DNA is bound by histones upon proteinlysate incubation. As an initial confirmation of histonebinding during MagPIE, we performed mass spectrometry(LC-MS) on beads bound with Cdx2-binding enhancerDNA and length-matched control DNA sequences of88 bp, 150 bp and 250 bp. In all experiments using thesesequences, several histones H1, H2 and H3 are robustlydetected (Table 1), indicating that histones bind to DNAduring MagPIE, even when DNA is shorter than 147 bp,the minimum length shown to be required to assemblenucleosomes (30).
To determine whether histone binding and modificationin MagPIE are regulated by sequence-dependent processesas they are in vivo, we turned to flow cytometric analysis ofhistone H3 monomethyl K4 (H3K4Me1), a marker ofenhancer regions (15). We tested whether sequences that
display H3K4Me1 marking in mES cells from publishedChIP-Seq data (31) are preferentially marked byH3K4Me1 when incubated with mES lysate. Twelvesequences of similar length were tested (SupplementaryTable S1), four of which display H3K4Me1 marking inmES cells and eight of which do not, and the sequenceswith in vivo H3K4Me1 marking were found to displaysignificantly enriched H3K4Me1 reactivity by MagPIE(P< 0.0001, Figure 4B). The H3K4Me1 reactive se-quences included a 200 bp strong consensus binding sitefor a Sox-Oct motif (Figure 4C), which is known bind thecomplex of Sox2 and Oct4, two TFs known to co-bindand co-regulate many stem cell-related genes (32) andthe non-reactive sequences included a 226 bp sequencethat does not display Sox2 binding by flow cytometry(Figure 4D). Enriched H3K4Me1 reactivity was not aresult of increased histone binding, as flow cytometricanalysis of total histone 3 revealed similar amounts ofreactivity in H3K4Me1+ and H3K4Me1- regions(Figure 4E). To address whether histones are bound toDNA as a nucleosome, we used DNaseI digestion toanalyze the effect of lysate incubation on DNaseI accessi-bility, which is known to be impeded by nucleosomepresence (9). We synthesized a fluorescently labeledversion of a 250 bp, H3K4Me1-region, bound it to beadsand subjected it to DNaseI digestion before and afterlysate incubation. We found that lysate incubation signifi-cantly impeded DNaseI digestion and resulted in cuttingonly of full-length DNA (Supplementary Figure S4),suggesting nucleosome presence. Additionally, to addresswhether histone methylation occurs de novo during
Figure 3. MagPIE allows accurate comparative analysis of TF-DNA binding affinities. (A) Comparative flow cytometric plots showing bead im-munofluorescence intensity for V5 tagged Cdx2 (X axis) for beads coated with 48 bp MagPIE primer DNA (green) or beads coated with 62 bp DNAsequences containing 8-mers of differing predicted Cdx2 affinity (purple, yellow, red, blue and black) and incubated with lysate from mES cellsectopically expressing Cdx2. Graphs showing percentage of beads above a threshold level of flow cytometric V5 tagged Cdx2 immunofluorescencenormalized, such that the flow cytometric percentage of Cdx2+ beads in the strongest predicted binding sequence was set to 1 (Y axis) vs. Cdx2 PBMZ scores normalized, such that the highest score was set to 1 (B, X axis) or log-likelihood ratio scoring against the ChIP-Seq Cdx2 motif PWM(C, X axis). R2 values for the best fit exponential curves are shown on the graphs.
Figure 4. MagPIE allows simultaneous monitoring of protein–DNA binding and epigenetic DNA and histone methylation. (A) Comparative flowcytometric plots showing bead immunofluorescence intensity for methyl-CpG (X axis) for beads coated with 88 bp DNA containing 40 bprandomized sequences flanking two CG dinucleotides and incubated without lysate (black), with lysate from mES cells (red) or with lysate frommES cells and RG108 (blue). (B) Graph showing mean bead fluorescence for H3K4Me1 after incubation with mES lysate for a set of DNA regionswith (left) or without (right) ChIP-Seq H3K4Me1 marking (sequences in Supplementary Table S1). Flow cytometric plots showing bead immuno-fluorescence intensity for Sox2 (Y axis) vs. bead immunofluorescence intensity for histone 3 lysine 4 monomethyl (X axis) for beads coated with a200 bp DNA sequence that does (C) or a 226 bp sequence that does not (D) show Sox2 binding and H3K4Me1 marking in mES cells in vivo.(E) Comparative flow cytometric plots showing bead immunofluorescence intensity for Histone H3 total protein (X axis) for beads coated with DNAfrom a H3K4Me1+ mES region (black) or from a H3K4Me1- mES region (red) and incubated with mES lysate and compared with DNA-coatedbeads without lysate (blue). (F) Mutation series of a 40 bp enhancer fragment with a strong SoxOct binding site (Sox binding site underlined, Octbinding site italicized with JASPAR motif overlaid above sequence) with mutations bolded. Amplified enhancer regions have a total DNA length of88 bp. Flow cytometric plots showing bead immunofluorescence intensity for Sox2 (Y axis) vs. bead immunofluorescence intensity for histone 3 lysine4 monomethyl (X axis) for beads coated with 48 bp primer DNA (G), 88 bp DNA sequences containing a 40 bp SoxOct wild-type binding site(H), 88 bp DNA sequences containing a 40 bp SoxOct Sox mutant binding site (I) or 88 bp DNA sequences containing a 40 bp SoxOct Oct mutantbinding site (J) and incubated with lysate from mES cells. Flow cytometric plots showing bead immunofluorescence intensity for V5 tagged Cdx2(Y axis) vs. bead immunofluorescence intensity for histone 3 lysine 4 monomethyl (X axis, K and L) or FITC total protein (X axis, M and O) forbeads coated with 88 bp DNA sequences containing a 40 bp Cdx2 binding site (K, M and N) or 88 bp DNA sequences containing a 40 bp Cdx2mutant binding site (L and O) and incubated with lysate from mES cells ectopically expressing Cdx2 (K, L, N and O) or without lysate (M).
MagPIE, we performed MagPIE in the presence of anon-hydrolyzable ATP analog, ATPgS. Addition ofATPgS significantly decreases H3K4Me1 reactivity(Supplementary Figure S4), suggesting that histonemethylation is actively recruited during lysate incubation.
The ability to detect sequence-specific H3K4Me1reactivity in mES lysate opens up the possibility of dissect-ing causal relationships between TF binding and histonemethylation through simultaneous flow cytometric exam-ination. To begin to address whether TF binding to aDNA sequence is correlated with H3K4Me1 marking ofhistones that have been wrapped by the bead-boundDNA, we synthesized a 40 bp region containing thestrong consensus Sox-Oct binding site in theH3K4Me1+ enhancer analyzed in Figure 4C (Figure 4F)and amplified this region using the MagPIE primers.When incubated with mES lysate and stained simultan-eously for Sox2 and H3K4Me1, this region displaysstrong Sox2 and H3K4Me1 reactivity, when comparedwith primer DNA (Figure 4G and H). H3K4Me1 reactiv-ity and affinity to Sox2 of the 40 bp region is comparableto that of the full length 248 bp Sox-Oct sequence(Figure 4C). To test the relationship between TF bindingand H3K4Me1 recruitment, we synthesized 88 bpsequences with point mutations in either the Sox2 orOct4 binding site (Figure 4F). When incubated withmES lysate, both sites display decreased Sox2 bindingand H3K4Me1 reactivity (Figure 4I and J); however,these processes are differently affected. Mutation of theSox2 binding site ablates Sox2 binding but has only amild effect on H3K4Me1 marking (Figure 4I), whereasmutation of the Oct4 binding site reduces the level ofSox2 binding and entirely extinguishes H3K4Me1reactivity (Figure 4J) to the levels comparable to anH3K4Me1 non-reactive DNA sequence (Figure 4D).These initial data suggest that Oct4 binding more signifi-cantly affects H3K4Me1 recruitment by a Sox-Oct motifthan Sox2 does. Furthermore, the diminished Sox2binding after Oct4 site mutation (Figure 4J) indicates acofactor relationship between Sox2 and Oct4 on theSox-Oct site.
To determine whether known TF binding induceshistone methylation in a distinct setting, 88 bp DNAsequences containing a strong Cdx2-binding site or asimilar sequence with a mutated Cdx2-binding site wereincubated with lysate from mES cells overexpressing Cdx2and probed for both Cdx2 and H3K4Me1. AlthoughCdx2-binding site presence affects Cdx2 binding,
H3K4Me1 reactivity is present with Cdx2-binding sitecontaining DNA and Cdx2-binding site mutant DNA(Figure 4K and L). To investigate possible reasons forthe lack of effect of Cdx2 mutation on histone methyla-tion, we used the fluorescent amine dye FITC in additionto the other two probes to indicate levels of total boundprotein. We find that total protein levels are unaffected byCdx2-binding site mutation (Figure 4M–O), suggestingthat histone methylation at this locus may be due tobinding of a distinct DNA-binding protein. Significantly,this analysis required the simultaneous probing of threedistinct fluorophores, possible due to the multi-parametricnature of MagPIE. These initial analyses indicate thatMagPIE is capable of dissecting the roles of co-factorinteractions on DNA binding and how TF binding regu-lates H3K4Me1 recruitment.
DISCUSSION
Interactions between DNA and its sequence-specificbinding factors comprise a code that instructs cellularfunction and development, yet the complexities of thiscode are still far from being understood. Such understand-ing is limited by a dearth of techniques available formodeling of complex DNA–protein interactions. Byadapting the commonly used method of in vitro protein–DNA binding to flow cytometric analysis, we have deviseda multi-parametric assay to study interactions among TFs,chromatin and DNA.We show that by binding DNA to magnetic beads using
biotin–SA chemistry, incubating DNA-bound beads withcrude nuclear lysate, performing immunofluorescentstaining and analyzing beads by flow cytometry(Figure 1), we can monitor TF-DNA-binding interactions.As in the electrophoretic TF-DNA binding assay EMSA(10), sequence-specific binding of a TF and DNA dependson lysate concentration, concentration of competitorDNA and TF-DNA affinity (Figure 2). In MagPIE,each individual bead essentially represents an independentbinding experiment with 1 million DNA molecules.The sensitivity provided by flow cytometry allows forrapid data generation (under 2 h total per experiment)using small quantities of protein (�5–15 mg/sample) thatis easily scalable to high-throughput screening approachesand is highly reproducible across biological replicates.TF-DNA complexes formed on beads under theseconditions are stable for several hours and can be storedat 4�C overnight with minor loss to fluorescence intensityby flow cytometric analysis (data not shown).MagPIE provides a simple method to compare
sequence-specific DNA-binding affinities of a TF in acomplex, biologically relevant lysate (Figure 3). This com-parative quantitation of TF-DNA affinity is not ad-equately provided by EMSA; in this regard, MagPIEprovides similar information to PBM technology (11).PBM assays can explore more sequence space thanMagPIE, and in direct comparison using Cdx2 as a testcase, MagPIE produces above-background signal for asmaller subset of k-mers than PBM technology(Figure 3). However, PBM assays are typically performed
Table 1. Mass spectrometric identification of histones in MagPIE
samples
Histone subunit Proteins with >5 peptides bound to88 bp, 150 bp and 250 bp DNA
1 Hist1h1a, Hist1h1b, Hist1h1c and Hist1h1e2 Hist1h2ba and Hist1h2bj3 Histone 3 (variants too similar to distinguish)4 None
using purified TFs, limiting analysis of cofactor bindingeffects. Cofactors can affect TF-binding specificity, as isillustrated in our experiments by diminished Sox2 bindingon Oct binding site mutant DNA (Figure 4) and morebroadly in recent work on Hox family members, whoseDNA-binding preferences depend on combinatorial inter-actions (33). Thus, MagPIE holds promise to dissectaffinity differences in complex TF-DNA interactions.Although MagPIE could be adapted to use with purifiedTFs instead of crude lysates, allowing its utilization in thecalculation of absolute TF-DNA affinity and specificity(34), one of the major benefits to flow cytometry isdissecting multiple simultaneous processes.In this vein, when performed with crude lysates,
MagPIE allows analysis of chromatin modification inconcert with TF-DNA interaction. Within 10 min of in-cubation at 37�C, an array of epigenetic modificationsincluding TF binding, DNA methylation and histonemethylation can be detected and their relationship toone another can be examined (Figure 4 andSupplementary Figure S4). Small molecule inhibitionindicates that these processes are occurring de novoduring this incubation. We have collected multiple linesof evidence, including mass spectrometry, flow cytometricimmunofluorescence and DNaseI digestion that togetherindicate that histones do bind to DNA during MagPIE.We cannot conclude from our data that intact nucleo-somes are being formed, especially on fragments ofDNA that are less than 147 bp, the standard sizerequired to assemble an intact nucleosome (30);however, our consistent detection of histones on smallDNA fragments could be a result of histone stabilizationby cooperative interactions among the large number ofDNA strands on each bead.Nonetheless, it is clear that histone binding and methy-
lation do occur in MagPIE (Figure 4 and SupplementaryFigure S4), and histone methylation follows similarsequence-dependent patterns as in vivo. We havedemonstrated this sequence-dependent histone methyla-tion on >200 bp enhancer sites marked in mES cells byH3K4Me1, which show enriched H3K4Me1 in MagPIEexperiments using mES cell lysate when compared withcontrol H3K4Me1- regions. Additionally, we have begunto establish causal relationships between sequence-specificenhancer binding and histone methylation by performingmutation analysis on 40 bp enhancer fragments, whichshow comparable yet less dramatic differences inH3K4Me1 marking than the longer enhancers. Thesedata, although currently limited to a small sample sizeof enhancer regions, already suggest that TFs can influ-ence histone methylation to varying degrees, as loss ofOct4 results in a stronger loss of H3K4Me1 markingthan loss of Sox2, and Cdx2 binding does not affectH3K4Me1 on one tested enhancer. Patterns of histonemethylation on DNA fragments less than the 147 bprequired to fully wrap one nucleosome correlate wellwith larger enhancers, yet the use of sub-nucleosomalDNA fragments raises concerns as to the physiologicalrelevance of these data. It will be important to keep thispoint in mind in future mechanistic enhancer dissectionexperiments, as the ability to synthesize libraries of
shorter DNA regions in a high-throughput manner (35)provides a major advantage for MagPIE, yet site-directedmutagenesis of specific binding sites within longer frag-ments of DNA will nonetheless be important to addressthe effects of intact nucleosomal architecture on histonemethylation.
In combination, the experiments in this study hint thathistone methylation machinery may be recruited to DNAin cell lysates by similar mechanisms as those that occurin vivo. These initial data point to protein–DNA inter-actions and modifications occurring in concert onspecific DNA sequences; however flow cytometry onlymeasures fluorescence at the level of individual beads,which contain 106 DNA strands each, and therefore, weare unable to detect whether such events are occurring onthe same strands of DNA. The recent association of par-ticular patterns of histone modification with states ofactivity in enhancers and promoters (36,37) hasemphasized the importance of understanding the mechan-ism by which these marks are induced, yet the histone codeis extremely complex (38,39), and the number of distincttypes of histone modifications has now reached almost onehundred (40). Thus, methods such as MagPIE that permitthe rapid analysis of the effect of DNA and protein com-position on combinations of histone modifications willbe powerful in deciphering how histone modificationsare placed.
The ability to perform multi-parametric analysis usingMagPIE holds great promise to uncovering mechanismsgoverning epigenetic interaction. It is common for flowcytometers to detect >10 distinct wavelengths of fluores-cence, so the complexity of simultaneous protein–DNAinteractions probed can be increased an order of magni-tude using this assay when compared with similar assays.Such combinatorial analysis has been used to great effectin uncovering rare cell types with unique biologicalfunction (41), where the number of cell types identifiedhas been limited solely by the number of antibodyspecies used or the extent of directly fluorescentlyconjugated fluorescent antibodies available. Such anarmory of directly fluorescently conjugated antibodiesdoes not yet exist for TFs and histone modifications, butas these reagents accumulate, MagPIE should be able tohelp decipher the complexities of the histone code (42) bysimultaneously monitoring the presence of multipledistinct TFs, multiple histone modifications, and DNAmethylation on a single DNA sequence. Sequence-specific epigenetic states can then be correlated withactivity using reporter assays to elucidate the epigeneticcode.
MagPIE also holds promise in the analysis of distinctDNA-mediated events. Use of fluorescently labeled DNA(Supplementary Figure S1) could be useful in allowinganalysis of protein–DNA binding using mixed popula-tions of DNA or in modified in vitro footprintinganalysis in which nuclease activity could be read out bythe absence of a fluorescent tag. Use of advancedfluorimetric techniques such as FRET (43) could alsoallow precise localization of protein–protein andprotein–DNA interactions to analyze events such asenhancer–promoter communication (44). MagPIE holds
promise as a tool for a wide array of DNA-based analyt-ical techniques such as optimization of assays to detectnovel protein–DNA interactions by mass spectrometry(45) and analysis of DNA damage using fluorescence.Thus, the combinatorial power of analysis of singleevents, in this case DNA-coated magnetic beads, withmulti-parametric analysis broadens the scope of in vitroepigenetic analysis substantially.
SUPPLEMENTARY DATA
Supplementary Data are available at NAR Online:Supplementary Table 1 and Supplementary Figures 1–4.
ACKNOWLEDGEMENTS
The authors thank Grigoriy Losyev and Jennifer Huynhfor technical assistance and Trevor Siggers for advice.
FUNDING
The National Institutes of Health Common Fund[5UL1DE019581, DE019021 and 5TL1EB008540;5R01HG002668 and P01-NS055923-01 to P.A.R.]; theHarvard Stem Cell Institute s Sternlicht Director’s Fundaward (to R.I.S.). Funding for open access charge:Internal funding.
Conflict of interest statement. None declared.
REFERENCES
1. Koch,F., Jourquin,F., Ferrier,P. and Andrau,J.C. (2008)Genome-wide RNA polymerase II: not genes only! TrendsBiochem. Sci., 33, 265–273.
2. Kee,B.L., Arias,J. and Montminy,M.R. (1996) Adaptor-mediatedrecruitment of RNA polymerase II to a signal-dependentactivator. J. Biol. Chem., 271, 2373–2375.
3. Rundlett,S.E., Carmen,A.A., Suka,N., Turner,B.M. andGrunstein,M. (1998) Transcriptional repression by UME6 involvesdeacetylation of lysine 5 of histone H4 by RPD3. Nature, 392,831–835.
4. Workman,J.L. and Kingston,R.E. (1998) Alteration ofnucleosome structure as a mechanism of transcriptionalregulation. Annu. Rev. Biochem., 67, 545–579.
5. Johnson,D.S., Mortazavi,A., Myers,R.M. and Wold,B. (2007)Genome-wide mapping of in vivo protein-DNA interactions.Science, 316, 1497–1502.
6. Carey,M. (1998) The enhanceosome and transcriptional synergy.Cell, 92, 5–8.
7. Jaenisch,R. and Bird,A. (2003) Epigenetic regulation of geneexpression: how the genome integrates intrinsic and environmentalsignals. Nat. Genet., 33(Suppl.), 245–254.
8. Young,R.A. (2011) Control of the embryonic stem cell state. Cell,144, 940–954.
9. Galas,D.J. and Schmitz,A. (1978) DNAse footprinting: a simplemethod for the detection of protein-DNA binding specificity.Nucleic Acids Res., 5, 3157–3170.
10. Lane,D., Prentki,P. and Chandler,M. (1992) Use of gelretardation to analyze protein-nucleic acid interactions. Microbiol.Rev., 56, 509–528.
11. Berger,M.F., Philippakis,A.A., Qureshi,A.M., He,F.S.,Estep,P.W. 3rd and Bulyk,M.L. (2006) Compact, universalDNA microarrays to comprehensively determinetranscription-factor binding site specificities. Nat. Biotechnol., 24,1429–1435.
12. Mukherjee,S., Berger,M.F., Jona,G., Wang,X.S., Muzzey,D.,Snyder,M., Young,R.A. and Bulyk,M.L. (2004) Rapid analysis ofthe DNA-binding specificities of transcription factors with DNAmicroarrays. Nat. Genet., 36, 1331–1339.
13. Siggers,T., Duyzend,M.H., Reddy,J., Khan,S. and Bulyk,M.L.(2011) Non-DNA-binding cofactors enhance DNA-bindingspecificity of a transcriptional regulatory complex. Mol. Syst.Biol., 7, 555.
14. Kuo,M.H. and Allis,C.D. (1999) In vivo cross-linking andimmunoprecipitation for studying dynamic Protein:DNAassociations in a chromatin environment. Methods, 19, 425–433.
15. Heintzman,N.D., Stuart,R.K., Hon,G., Fu,Y., Ching,C.W.,Hawkins,R.D., Barrera,L.O., Van Calcar,S., Qu,C., Ching,K.A.et al. (2007) Distinct and predictive chromatin signatures oftranscriptional promoters and enhancers in the human genome.Nat. Genet., 39, 311–318.
16. Boyle,A.P., Davis,S., Shulha,H.P., Meltzer,P., Margulies,E.H.,Weng,Z., Furey,T.S. and Crawford,G.E. (2008) High-resolutionmapping and characterization of open chromatin across thegenome. Cell, 132, 311–322.
17. Gaulton,K.J., Nammo,T., Pasquali,L., Simon,J.M., Giresi,P.G.,Fogarty,M.P., Panhuis,T.M., Mieczkowski,P., Secchi,A., Bosco,D.et al. (2010) A map of open chromatin in human pancreaticislets. Nat. Genet., 42, 255–259.
18. Sherwood,R.I., Maehr,R., Mazzoni,E.O. and Melton,D.A. (2011)Wnt signaling specifies and patterns intestinal endoderm. Mech.Dev., 128, 387–400.
19. Rappsilber,J., Ishihama,Y. and Mann,M. (2003) Stop and goextraction tips for matrix-assisted laser desorption/ionization,nanoelectrospray, and LC/MS sample pretreatment in proteomics.Anal. Chem., 75, 663–670.
20. Eng,J.K., McCormack,A.L. and Yates,J.R. 3rd (1994) Anapproach to correlate tandem mass spectral data of peptides withamino acid sequences in a protein database. J. Am. Soc. MassSpectrom., 5, 976–989.
21. Elias,J.E. and Gygi,S.P. (2007) Target-decoy search strategy forincreased confidence in large-scale protein identifications by massspectrometry. Nat. Methods, 4, 207–214.
22. Granek,J.A. and Clarke,N.D. (2005) Explicit equilibriummodeling of transcription-factor binding and gene regulation.Genome Biol., 6, R87.
23. Guo,Y., Papachristoudis,G., Altshuler,R.C., Gerber,G.K.,Jaakkola,T.S., Gifford,D.K. and Mahony,S. (2010) Discoveringhomotypic binding events at high spatial resolution.Bioinformatics, 26, 3028–3034.
24. van Heeringen,S.J. and Veenstra,G.J. (2011) GimmeMotifs: a denovo motif prediction pipeline for ChIP-sequencing experiments.Bioinformatics, 27, 270–271.
25. Chawengsaksophak,K., de Graaff,W., Rossant,J., Deschamps,J.and Beck,F. (2004) Cdx2 is essential for axial elongation inmouse development. Proc. Natl Acad. Sci. USA, 101, 7641–7645.
26. Berger,M.F., Badis,G., Gehrke,A.R., Talukder,S.,Philippakis,A.A., Pena-Castillo,L., Alleyne,T.M., Mnaimneh,S.,Botvinnik,O.B., Chan,E.T. et al. (2008) Variation inhomeodomain DNA binding revealed by high-resolutionanalysis of sequence preferences. Cell, 133, 1266–1276.
28. Verzi,M.P., Hatzis,P., Sulahian,R., Philips,J., Schuijers,J., Shin,H.,Freed,E., Lynch,J.P., Dang,D.T., Brown,M. et al. (2010) TCF4and CDX2, major transcription factors for intestinal function,converge on the same cis-regulatory regions. Proc. Natl Acad.Sci. USA, 107, 15157–15162.
29. Newburger,D.E. and Bulyk,M.L. (2009) UniPROBE: an onlinedatabase of protein binding microarray data on protein-DNAinteractions. Nucleic Acids Res., 37, D77–D82.
30. Widom,J. (1998) Structure, dynamics, and function of chromatinin vitro. Annu. Rev. Biophys. Biomol. Struct., 27, 285–327.
Sharp,P.A. et al. (2010) Histone H3K27ac separates active frompoised enhancers and predicts developmental state. Proc. NatlAcad. Sci. USA, 107, 21931–21936.
33. Slattery,M., Riley,T., Liu,P., Abe,N., Gomez-Alcala,P., Dror,I.,Zhou,T., Rohs,R., Honig,B., Bussemaker,H.J. et al. (2011)Cofactor binding evokes latent differences in DNA bindingspecificity between Hox proteins. Cell, 147, 1270–1282.
34. Stormo,G.D. and Zhao,Y. (2010) Determining the specificity ofprotein-DNA interactions. Nat. Rev. Genet., 11, 751–760.
35. Melnikov,A., Murugan,A., Zhang,X., Tesileanu,T., Wang,L.,Rogov,P., Feizi,S., Gnirke,A., Callan,C.G. Jr, Kinney,J.B. et al.(2012) Systematic dissection and optimization of inducibleenhancers in human cells using a massively parallel reporterassay. Nat. Biotechnol., 30, 271–277.
37. Rada-Iglesias,A., Bajpai,R., Swigut,T., Brugmann,S.A.,Flynn,R.A. and Wysocka,J. (2011) A unique chromatin signatureuncovers early developmental enhancers in humans. Nature, 470,279–283.
38. Ruthenburg,A.J., Li,H., Patel,D.J. and Allis,C.D. (2007)Multivalent engagement of chromatin modifications by linkedbinding modules. Nat. Rev. Mol. Cell Biol., 8, 983–994.
39. Ruthenburg,A.J., Allis,C.D. and Wysocka,J. (2007) Methylationof lysine 4 on histone H3: intricacy of writing and reading asingle epigenetic mark. Mol. Cell., 25, 15–30.
40. Tan,M., Luo,H., Lee,S., Jin,F., Yang,J.S., Montellier,E.,Buchou,T., Cheng,Z., Rousseaux,S., Rajagopal,N. et al. (2011)Identification of 67 histone marks and histone lysinecrotonylation as a new type of histone modification. Cell, 146,1016–1028.
41. Bryder,D., Rossi,D.J. and Weissman,I.L. (2006) Hematopoieticstem cells: the paradigmatic tissue-specific stem cell. Am.J. Pathol., 169, 338–346.
42. Jenuwein,T. and Allis,C.D. (2001) Translating the histone code.Science, 293, 1074–1080.
43. Haugland,R.P., Yguerabide,J. and Stryer,L. (1969) Dependenceof the kinetics of singlet-singlet energy transfer on spectraloverlap. Proc. Natl Acad. Sci. USA, 63, 23–30.
44. Fullwood,M.J., Liu,M.H., Pan,Y.F., Liu,J., Xu,H.,Mohamed,Y.B., Orlov,Y.L., Velkov,S., Ho,A., Mei,P.H. et al.(2009) An oestrogen-receptor-alpha-bound human chromatininteractome. Nature, 462, 58–64.
45. Yaneva,M. and Tempst,P. (2006) Isolation and massspectrometry of specific DNA binding proteins. Methods Mol.Biol., 338, 291–303.