A Novel Energy-Saving Management Mechanism in Cellular Networks Peng Yu, Wenjing Li, Xuesong Qiu State Key Laboratory of Networking and Switching Technology Beijing University of Posts and Telecommunications Beijing 100876, China {yupeng, wjli, xsqiu}@bupt.edu.cn Abstract—When regional traffic is low, one key issue of ESM (Energy-Saving Management) in cellular networks is how to sleep several BSs (Base Stations) and meanwhile guaranteeing regional coverage and service quality. Current ESM methods lack efficient regional coverage compensation method and accurate evaluation model for ESM algorithms. This paper proposes a novel ESM mechanism to resolve these problems. The mechanism includes selection of sleeping BSs based on TP (Trigonal Pair), a regional energy saving algorithm corresponding to TP through adjustments of down tilt and transmit power, and an integrated assessment model based on dynamic traffic. We then simulate the mechanism in WCDMA/HSPA network under urban scenarios with multiple services. Results show that with acceptable coverage and service quality, the ESM mechanism can save at least 34.83% of energy consumption for one sleeping BS. And it can still obtain 18.01% and 10.01% energy-saving gains during sleeping time and the entire simulation time, which takes on much practical significance. Keywords- energy-saving management; coverage compensation; minimum energy consumption I. INTRODUCTION Presently ICT (Information & Communication Technology) industry consumes 2% of the global energy consumption and it takes on a faster growth in the next five years [1]. Meanwhile, varieties of data services require high-density deployment of access nodes to meet bandwidth and throughput demands. These access nodes consume around 80% of energy consumptions in cellular networks [2]. However, capacities of cellular networks are designed in accordance with the peak traffic. During midnight, load of several active nodes is low and even may be zero, resulting in wastes of resource and unnecessary energy. Therefore, research on saving energy of cellular networks makes much significance for reducing OPEX (Operating Expense) and declining greenhouse effects [3]. Two methods can be adapted to save energy of wireless access networks. One is designing high energy-efficient BS hardware to improve the efficiency power amplifier. The second method is control in software level: when the traffic of BS is low, signaling is used to switch off the BS and control the neighbor BSs to compensate its coverage and traffic [2]. As a software level method for cellular networks, ESM is defined as followed [3]: when the regional traffic is low, management entity chooses several cells to sleep and control the neighbor cells to compensate their coverage and capacity. In order to decrease frequent manual adjustment for network parameters, ESM is categorized to self-optimization use case of SON (Self-Organizing Network). In this case, when triggering conditions is satisfied, network is able to execute energy-saving actions above without artificial interference. Thereby regional energy saving is achieved [4]. However, few literatures concentrate on effective regional energy-saving schemes and efficient algorithms assessment model. Currently ESM has been mainly research from microscopic and macroscopic perspectives. Microscopic methods resolve energy-saving problem through user connection reconfiguration with BS. Several literatures describe ESM as two-dimensional binary programming planning problems (which are proved to be NP- hard) and discuss proper algorithms to resolve them [5-8]. Besides, ESM is formulated as an integrated problem including BS operation and user association in [9] and resolved with efficient algorithms. These microscopic methods merely consider from semi-static user perspective and not suitable for dynamic traffic. Still, the problem scale is large as regional user number is huge, so the algorithms may take a long time. Macroscopic methods resolve energy-saving problem through regional traffic redistribution among BSs, so the problem scales are only determined by BS number. A few macroscopic energy-saving schemes have been proposed to sleep several BSs and meanwhile distribute their load to other active BSs [10-13]. But they are theoretical and interference is unfortunately neglected. Moreover, how to adjust wireless parameters (such as transmit power or down tilt) to compensate coverage, capacity and quality for sleeping BS have not been exactly analyzed. A traffic driven energy-saving based on practical BS deployment method is efficient with significant saving gains [14]. But radius constraint is strict, and interference in each grid is not analyzed. Compensation strategies .for one BS are elaborately studied with different traffic threshold [15]. However irregular BS deployments are not taken into consideration. Besides, energy consumption assessment model of wireless cellular networks has not been analyzed accurately. Static and dynamic components of BS power in wireless networks have been quantified in [14] and [16], but none precise relationship between traffic and dynamic power part is concluded. Correlations among coverage, capacity and dynamic power of 1 978-3-901882-48-7 c 2012 IFIP
Transcript
A Novel Energy-Saving Management Mechanism in Cellular Networks
Peng Yu, Wenjing Li, Xuesong Qiu State Key Laboratory of Networking and Switching Technology
Beijing University of Posts and Telecommunications Beijing 100876, China
{yupeng, wjli, xsqiu}@bupt.edu.cn
Abstract—When regional traffic is low, one key issue of ESM (Energy-Saving Management) in cellular networks is how to sleep several BSs (Base Stations) and meanwhile guaranteeing regional coverage and service quality. Current ESM methods lack efficient regional coverage compensation method and accurate evaluation model for ESM algorithms. This paper proposes a novel ESM mechanism to resolve these problems. The mechanism includes selection of sleeping BSs based on TP (Trigonal Pair), a regional energy saving algorithm corresponding to TP through adjustments of down tilt and transmit power, and an integrated assessment model based on dynamic traffic. We then simulate the mechanism in WCDMA/HSPA network under urban scenarios with multiple services. Results show that with acceptable coverage and service quality, the ESM mechanism can save at least 34.83% of energy consumption for one sleeping BS. And it can still obtain 18.01% and 10.01% energy-saving gains during sleeping time and the entire simulation time, which takes on much practical significance.
Keywords- energy-saving management; coverage compensation; minimum energy consumption
I. INTRODUCTION Presently ICT (Information & Communication Technology)
industry consumes 2% of the global energy consumption and it takes on a faster growth in the next five years [1]. Meanwhile, varieties of data services require high-density deployment of access nodes to meet bandwidth and throughput demands. These access nodes consume around 80% of energy consumptions in cellular networks [2]. However, capacities of cellular networks are designed in accordance with the peak traffic. During midnight, load of several active nodes is low and even may be zero, resulting in wastes of resource and unnecessary energy. Therefore, research on saving energy of cellular networks makes much significance for reducing OPEX (Operating Expense) and declining greenhouse effects [3].
Two methods can be adapted to save energy of wireless access networks. One is designing high energy-efficient BS hardware to improve the efficiency power amplifier. The second method is control in software level: when the traffic of BS is low, signaling is used to switch off the BS and control the neighbor BSs to compensate its coverage and traffic [2]. As a software level method for cellular networks, ESM is defined as followed [3]: when the regional traffic is low, management entity chooses several cells to sleep and control
the neighbor cells to compensate their coverage and capacity. In order to decrease frequent manual adjustment for network parameters, ESM is categorized to self-optimization use case of SON (Self-Organizing Network). In this case, when triggering conditions is satisfied, network is able to execute energy-saving actions above without artificial interference. Thereby regional energy saving is achieved [4].
However, few literatures concentrate on effective regional energy-saving schemes and efficient algorithms assessment model. Currently ESM has been mainly research from microscopic and macroscopic perspectives.
Microscopic methods resolve energy-saving problem through user connection reconfiguration with BS. Several literatures describe ESM as two-dimensional binary programming planning problems (which are proved to be NP-hard) and discuss proper algorithms to resolve them [5-8]. Besides, ESM is formulated as an integrated problem including BS operation and user association in [9] and resolved with efficient algorithms. These microscopic methods merely consider from semi-static user perspective and not suitable for dynamic traffic. Still, the problem scale is large as regional user number is huge, so the algorithms may take a long time.
Macroscopic methods resolve energy-saving problem through regional traffic redistribution among BSs, so the problem scales are only determined by BS number. A few macroscopic energy-saving schemes have been proposed to sleep several BSs and meanwhile distribute their load to other active BSs [10-13]. But they are theoretical and interference is unfortunately neglected. Moreover, how to adjust wireless parameters (such as transmit power or down tilt) to compensate coverage, capacity and quality for sleeping BS have not been exactly analyzed. A traffic driven energy-saving based on practical BS deployment method is efficient with significant saving gains [14]. But radius constraint is strict, and interference in each grid is not analyzed. Compensation strategies .for one BS are elaborately studied with different traffic threshold [15]. However irregular BS deployments are not taken into consideration.
Besides, energy consumption assessment model of wireless cellular networks has not been analyzed accurately. Static and dynamic components of BS power in wireless networks have been quantified in [14] and [16], but none precise relationship between traffic and dynamic power part is concluded. Correlations among coverage, capacity and dynamic power of
BS are analyzed [17]. But only propagation model is considered. Several energy efficiency metrics such as ECR, ECG is defined and described [18] [19], but they are mainly suitable for evaluation energy-saving gains for cellular networks with different architecture and could not obtain energy efficiency of ESM for operational networks.
Heterogeneous cellular networks with kinds of BSs and cells are attractive methods to provide regional and hotspot capacity and coverage. Regional services are often guaranteed by macro-cells/BSs. And hotspot services are provided by micro-cell/BS, pico-cell/BS or femto-cell/BS [16]. BSs and cells deployed on hotspot with low traffic can be slept when the traffic can be accommodated by macro-cell/BS. But this paper mainly concentrates on macro-cell/BS ESM management for two reasons: 1) Overlap exists among macro-cells/BS makes coverage compensation for sleeping cells possible, 2) energy consumption of macro-cell/BS is much higher than other kinds of cells and BS, so ESM for it is more effective.
Aiming at above problems, this paper proposes a novel ESM mechanism for saving energy in wireless cellular networks with macro-cell/BS, so as to maximize the saving energy and meanwhile guaranteeing regional coverage and service quality. The mechanism adopts centre management manner, gives key method and algorithm for coverage compensation which consider regional coverage, and introduces an integrated ESM assessment model for the given method and algorithm. As a general mechanism, it’s suitable for different types of cellular networks, such as GSM, 3G, LTE and LTE-A.
The paper is organized as followed. Section II proposes a novel regional TP (Trigonal-Pair) compensation method suitable for practical BS deployment. This method contains local TP compensation scheme and regional TP selection algorithm. ES triggering and recovery conditions are still discussed in this section. Based on the method, section III describes intelligent coverage optimization algorithm, which includes the mathematical model and intelligent algorithm for coverage, so as to guarantee regional coverage and minimize energy consumption. Integrated ESM assessment model is analyzed in chapter IV, which includes energy consumption model and efficiency validation for method and algorithm proposed in section II and section III. In chapter V, the regional coverage compensation mechanism is simulated under a WCDMA/HSPA urban scenario for theoretical and practical arrival rates with three different services, energy efficiency and coverage compensation outcomes are discussed as well. Conclusions and future work is given in chapter VI.
II. REGIONAL TRIGONAL-PAIR COMPENSATION METHOD In cellular networks, macro-cell dimension is hexagonal.
One macro-BS (here containing BTS, NodeB, eNodeB, etc.) may serve for one or multiple cells. A Referring to compensation coverage method through adjustment radiuses of neighbor BSs in [13] and [15], this section proposes a regional TP (Trigonal-Pair) compensation method. Based on practical deployment of macro-BS and cells, it contains local TP compensation scheme and TP-based regional BS selection scheme.
Still, in this paper states for network and modes for BSs are specified. States of cellular network mainly contain Normal State (NS) and Sleeping State (SS). Under NS all the cells still keep on Normal Mode (NM). When ESM triggering conditions are satisfied, networks will transfer to SS. When network is under SS, cell modes may be NM, SM (Sleeping Mode) and CM(Compensation Mode) determined by regional TP compensation method.
A. Local TP Compensation Scheme From local perspective, coverage of single BS can be
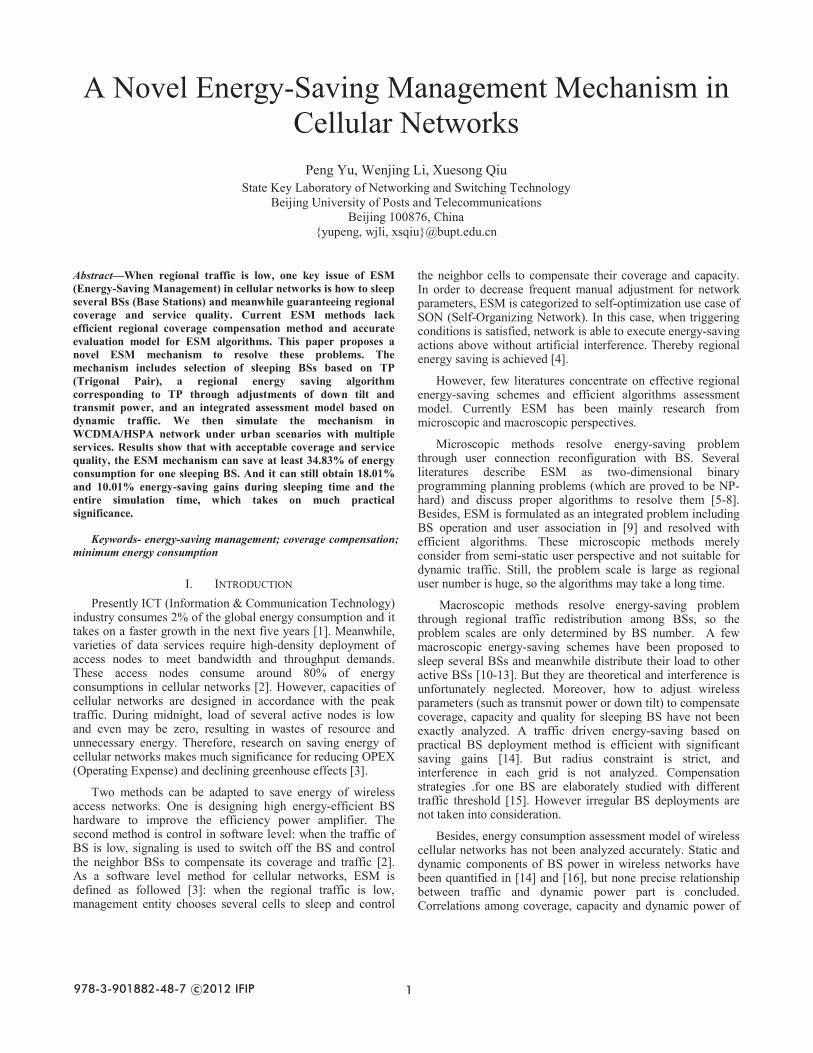
compensated by neighbor BSs. An ideal TP example for BS with steerable antenna (often deployed in urban area) can be seen in Fig 1. BS pair (BS1, BS2, BS3) can be adopted to compensate coverage and capacity for BS0 [15]. Here we call this pair as a TP of BS0. TPs of each BS make up of a set TP.
Figure 1. Ideal TP compensation for BS with steerable antenna
For practical situation with asymmetric deployments and limited resource, a more general TP compensation scheme is proposed in this paper, as shown in Fig. 2. TPs of BS0 are selected as follows:
Step 1: let set NB = and TP = . For each BSj in neighbor list of BS0, if coverage of BSj is overlap with BS0, then NB = NB {BSj}.
Step 2: Select three nonadjacent BSs from NB to make up of a triangle. If every interior angle i satisfies constraints that 450 ≤ i ≤ 750, then the selected BSs constitute a TP for BS0, such as TP = (BS2, BS4, BS6) in Fig. 2. Put TP into set TP of BS0.
Step 3: For other BSs in NB, repeat the operation in step 2 and attempt to find another TP until each trigonal pair are checked.
Figure 2. General TP compensation for BS with steerable antenna
As for ideal TP compensation, it’s easy to find that i = 600 for each angle. In order to homogenize compensation effect, we constraint each angle here. Moreover, because above
2 2012 8th International Conference on Network and Service Management (CNSM 2012)
processes only relate to geographic factor and initial configuration, so TP for each BS can be obtained in advance. That is to say, ESM mechanism in thie paper can be more efficient than methods with real-time analysis.
For BS with omnidirectional antenna, local TP compensation scheme is same as BS with steerable antenna, which is ignored here.
Due to multiple choices exist for local TP compensation of single BS, they will no doubt cause diverse coverage effect for other BSs. So as to optimize regional coverage and energy efficiency, regional TP selection scheme is required to maximize regional coverage effectiveness when energy-saving triggering conditions are satisfied.
B. Regional TP Selection algorithm TP compensation describes methods of single BS
compensation. However, a BS under CM can serve for more than one BS under SM, so a regional compensation method is required in order to guarantee global service provision. Based on local TP compensation scheme, the objective of regional optimal energy-saving algorithm is maximizing the number of BS under SM. Still, traffic of sleeping BSs should be accommodated by active BSs as well. Assume B={bi}, i=1, 2,…, N denotes the set of BSs, S={s1, s2,…, SN} and TR={tr1,tr2,…, trN} denote corresponding mode vector and traffic vector. Algorithm 1 describes the selection process when energy saving trigger conditions are satisfied. Algorithm 1 Regional TP selection algorithm
1: Input: B, S, TR 2: Output: S 3: for each bi B, let Tri = tri 4: while B do 5: for ∀ bi B, let TPBi= 6: if si = 0, then 7: find the set of trigonal pairs TPi for bi 8: while TPi do 9: for ∀ tpij = (bk, bl, bm) TPi, count nij, oij and cij 10: compute Trp = Trmax – p·Tri – Trp, p=k, l, m 11: let 2 2 2
k l mTr Tr Tr TrΔ = + + 12: if oij = 0 and each Trp > 0, then 13: TPBi = TPBi {tpij} 14: end if 15: TPi = TPi – {tpij} 16: end while 17: if TPBi , then 18: stably sort TPBi with decreasing cij 19: for tpij in sorted TPBi with same cij, 20: stably sort these pairs with decreasing Tr 21: end if 22: obtain first tpiJ = (bK, bL, bM) in sorted TPBi 23: let Trp = Trp + p·Tri, p = K, L, M 24: let si = 1, sK = 2, sL = 2, sM = 2 25: end if 26: B = B – {bi} 27: end while 28: for each bi with si = 2, adjust radius to appropriate value
In the algorithm, For BS Modes, 0, 1 and 2 means NM, SM and CM separately. nij, oij and cij denote the number of normal, energy-saving and compensating BSs in tpij. Trmax is upper limit of traffic for each BS. TPBi is TP set for bj which can accommodate its traffic. And Trp denotes remaining capacity of bp. For any TP in TPBi, one the one hand, they should
accommodate traffic of bj, so each Trp must be positive; on the other hand, none BS in each TP should be under SM so as to make sure each one is compensable, so oij must be zero. Because traffic is often proportional to coverage area, here we set 2 2/p ip ipd dλ = . Besides, first sorting TPBi with decreasing cij aims to maximal compensation effect for BS under CM, and then sorting TPBi with decreasing Tr aims to balancing load of BS under CM.
Moreover, we can find that above method only relates to Tri. And its complexity is O(N·max{|TPi|}·max{|TPBi|}). As max{NBi} 6, so max{|TPBi|} max{|TPi|} = C(max{|NBi|}, 3) 20 in practical networks, so complexity of Algorithm 1 can be simplified as O (N).
Let the Normal Ratio , Compensating Ratio , Sleeping Ratio 1 – – are ratios of different cell modes from above algorithm. Settings for triggering and recovery conditions still should be determined in order to obtain nij, oij and cij. Firstly, assume that regional ES triggering and recovery thresholds are equal and both denoted as . When regional peak traffic (monitored by OAM system) during a period is TRmax, then we initially set as = 2 TRmax / 3. For regional traffic is almost periodic, ‘ =TRmax min ( / TRmax, + ) will be taken as a new threshold after a period. Thus thresholds can be adjusted dynamically.
After determining modes for each BS, the radius of each BS under CM should be adjusted so as to satisfy coverage and capacity requirements. As coverage range of a BS is determined by maximal TCH (Traffic Channel) power of special service and antenna down tilt. Adjusting values for down tilt and traffic channel power will be determined by intelligent coverage optimization algorithm. During energy-saving intervals, TCH power and antenna down tilt will keep on the values determined in section III.
III. INTELLIGENT COVERAGE OPTIMIZATION ALGORITHM Adjustments of down tilt and TCH power for BSs under
CM to achieve minimal regional energy and acceptable coverage is a complex combinatorial optimization problem. Mathematical model of regional coverage compensation is discussed in this chapter firstly. Then algorithm adopted to resolve this model is introduced.
A. Mathematical Model Description Assume that N BSs and M users exist in the network, and K
service is provided when energy-saving trigger conditions are satisfied. Maximal TCH (Traffic CHannel) power of service k of BS j is pjk, antenna height of BS j is hj, v-plane half power beamwidth of BS j is Aj, and h-plane half power beamwidth of BS j is Fj. denotes the average horizontal tilt angle. Mechanical tilt and electrical tilt of BS j is j and j separately. Still, assume maximal coverage range of user is ru (by uplink budget). As adjustments for electrical tilt can cause minimal effect for interference, and adjustments for TCH power is necessary to guarantee signal strength, so when network is under SS, in order to compensate coverage for BSs under SM, matrix P = {pjk} and vector W = [ 1, 2, …, N] are considered as optimization variables. Assume initial value of j
2012 8th International Conference on Network and Service Management (CNSM 2012) 3
is wj. Relation between pjk and allowed service coverage radius rjk for BS j as followed [20]:
rjk = g-1(pjk, Ljk |hj, fj, hMS) (1)
Ljk is the maximal downlink path-loss for service k, fj is carrier frequency of BS j, and hMS is average height of users. Function g( ) is determined by adopted path-loss model. The quantities before “|” are continuous variables, while quantities after “|” are parameters take on discrete known values.
Still, relation between Ljk and antenna gain of BS j denoted as Gj is shown in (2):
( ( { ( ) ( ), })k k v hjk j j j j j cL u G u G A G F G = ) = +min (2)
Function uk( ) is determined by downlink budget of service k. Gc is a constant value. v
jG and hjG are vertical and horizontal
antenna gain of BS j as showed following[21]: 2{12( / ) , }h
j j cG F Gψ = min (3)
2{12( / ) , }vj j j j j vG w A SLAϕ ω + −= min (4)
SLAv is still a constant value. From (1) to (4) we can obtain relation between j and pjk. Moreover, coverage determined by down tilt which denoted as Dj for BS j can be estimated as followed [22]:
Dj = hj / tan( j + j – Aj / 2) (5)
Taking above factors into consideration, coverage range of BS j is determined as followed:
rj = min{max{rjk, Dj}, ru} (6)
Initially, ru ≥ rjk ≥ Dj in practical networks. Due to adjustment affect of electrical tilt is lesser than TCH power, so W is considered as a preferential optimization vector to obtain rj. Above three equations is suitable for BSs under NM and CM. For BSs under SM, rj can be set as zero. Assume regional overlap is O(W), then we have:
2 2
1 1O( ) ( ) ( )
N N
l l q ql q l
r w r wπ= = +
=W (7)
And regional coverage gap is shown below:
2
1( ) O( )
H( ) 1min
N
j jj
r w
A
π=
+ = −
WW (8)
A is square of the area. BSs under CM should compensate the regional coverage uniformly, so the average adjustment for
j should be minimal as well, which is shown in (8):
2
1E( ) ( ) /
N
j jj
w Nω=
= − min W (9)
We call above minimal problem as Pro.1. After obtaining a optimal solution for Pro.1, if rjk < Dj, then adjust pjk to make rjk = Dj to guarantee signal strength requirement.
B. Intelligent algorithm to resolve Pro.1 It is easy to find that Pro.1 is a NP-hard problem, so it
should be resolved through an intelligent optimization algorithm. As coverage requirement is a very important requirement, so E(W) can be taken as a constraint for H(W). Besides, in order to avoid pilot pollution or overshooting, O(W) should still satisfy special requirement, so it can be considered as another constraint. As a general random search algorithm, Simulated Annealing (SA) algorithm can effectively resolve NP-hard problems with large quantities of data without tight time sensitivity, which is suitable for ESM use case. So it will be taken to resolve Pro.1. Noticed that SA algorithm is suitable to resolve problem without constraints, so above model should be converted to the following unconstraint model:
2 2( ) | H( ) | | O( ) |mink kT T
ς ϑμ φ = Ε + − + −z W W W (10)
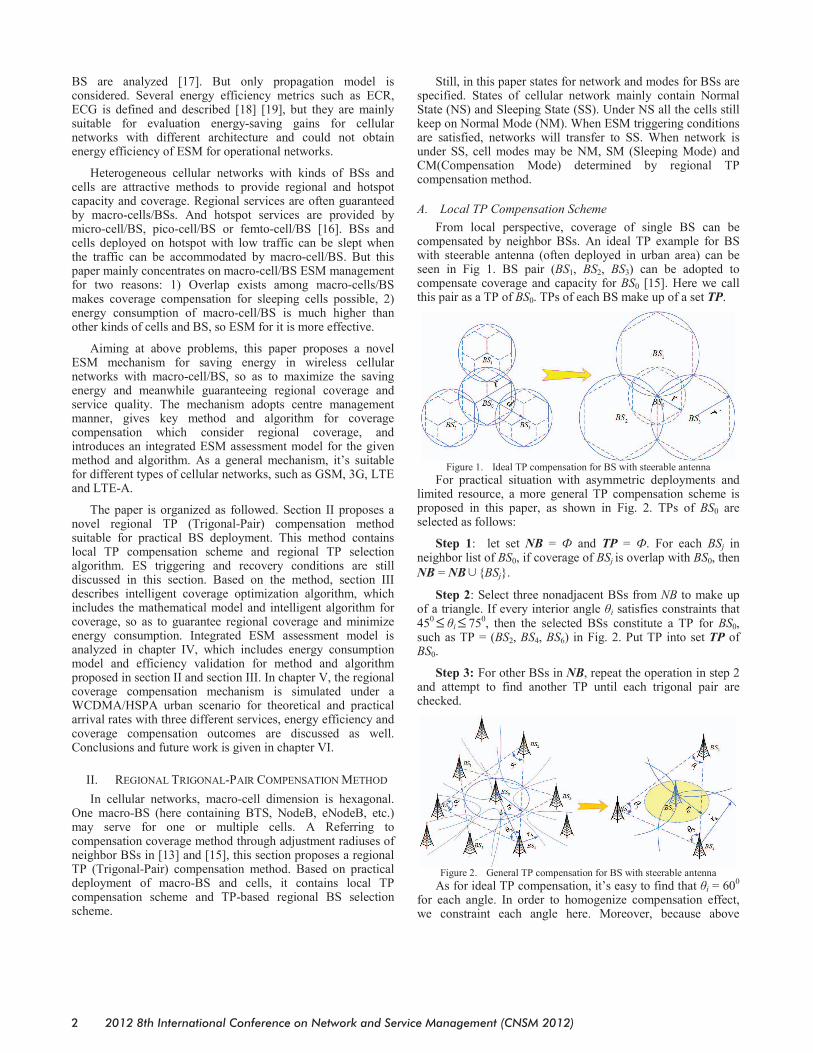
and ϑ are penalty factor for H(W) and O(W). and Tk is temperature of SA at iteration k. and φ are upper limits of H(W) and O(W). Penalty will enlarge along with temperature decrease. Thus in the initial stage global search will be achieved and local search will be obtained in the final stage. Processes of SA algorithm refer to [23]. Assume WT is solution space for W. Processes of SA algorithm is shown in Fig. 3, as described from step1 to step 5.
Figure 3. processes of SA algorithm for coverage compensation
Step 1: Choose an initial solution W ∈ WT, give initial temperature T0 and terminal temperature Tf. Set iterative metrics k = 0, Tk = T0. Specify inner loop time n(Tk) and set inner loop counter n = 0;
4 2012 8th International Conference on Network and Service Management (CNSM 2012)
Step 2: Randomly generate a neighbor solution W’∈N(W) ∈WT. N(W) denotes neighbor solution set of W. W’ can be obtained through change value of a random item in W. Set n = n + 1 and compute increment of objective named z, z = z(W’) - z(W);
Step 3: If z < 0, let W = W’ and go to step 4; else generate = U(0,1), if exp(- z/Tk) > , then let W = W’;
Step 4: If heat balance is achieved, which means n > n(Tk), go to step 5; else go to step 2;
Step 5: Decrease Tk and let k = k + 1. If Tk < Tf, terminate the algorithm, else reset n(Tk) and let n = 0; go to step 2.
However, SA algorithm may accept several bad solutions so the final solution may worse than best solution. Thus, best solutions during the computed process should be saved. And optimized one will be chosen as the best solution.
IV. INTEGRATED MECHANISM ASSESSMENT MODEL In order to accurately evaluate the validity of the methods
and algorithms in above sections, we should firstly evaluate capacity, power, and service constraints for network with and without ESM. Still, we should analyze energy comsuption component of BSs, and confirm power variations for BSs under different modes. Only doing these we can otbain truthful energy efficiency for the proposed ESM mechanism.
A. Effect Validation for algorithm in Section II&III From service quality perspective, effective coverage and
acceptable service should be provided. Assume that at time t, received signal power by user i from BS j which is used to handover and evaluate coverage is ij(t), and corresponding C/I is ij(t). Wireless propagation parameters set affect these two variables is . For network with ESM, when network is under SS, distribution probability of ij(t) and ij(t) should satisfy following requirements [24]:
*
*
( ) min *
( ) min
( ( ) ). . , arg max{ ( )}
( ( ) )ij
ij
t ijij
t ij
F ts t j t
F tρ
κ
ρ ρ νρ
κ κ υ
≥ ≥=
≥ ≥ (11)
min and min denote the lower limits of ij(t) and ij(t) above which service can be supplied. Fx(C) represents cumulative probability function for x when condition C is satisfied.
From capacity perspective, for network with ESM, when network is under SS, most active users should be accepted with a low block probability. Assume boolean variable cijk(t) denotes service state between user i and BS j for service k at time t, the following constraints should be firstly satisfied:
1 1
( )
1 1
, , , ( ) 1. .
, , ( ) (1 )
K N
ijkk j
M tK
ijk k j jk i
i k t c ts t
j t c t τ ι
= =
= =
∀ ≤
∀ ≤ − Γ (12)
j is available resource number of BS j, k is resource number required by service k, and j denotes margin ratio in j for soft handover and inference. Besides, the blocking probability for service k in BS is obtained according to [12].
From transmit power perspective, for network with ESM, this power Pj(t) should below the maximal value output by power amplifier for BSs under NM and CM, which is shown as followed [17]:
( )max
1 1P ( ) ( ) /
M tK
j C ijk jkk i
s.t. t P c t p TL P= =
= + ≤ (13)
TL is target load in the network, PC is control power, and Pmax is upper limit of transmit power.
When the ESM is executed, it effectiveness can be validated through metrics comparisons from above three perspectives.
B. Energy Consumption Model Assume variation cycle of traffic is T, regional normalized
traffic is Tr(t), and traffic of each BS j is trj(t). When network is under SS, assume traffic of BS under SM is zero, and it power is Pj
co (often is 10% of maximal total BS power) to keep normal management functions. Cell under CM is ' ( )jtr t with transmit power 'P ( )j t . In one period, NM intervals and SM intervals of network is alternate. NM intervals are set as [t2i, t2i+1], i = 0, 1,..., Q, and SM intervals is [t2j+1, t2j+2] j = 0, 1, 2, …, Q – 1. Here we can set t0 = 0 and t2Q+1 = T. Firstly, we should determine the ESM triggering point and recovery point. For individual traffic we have the following equations:
1( ) ( )
N
jj
Tr t tr t=
= (14)
From description in [25], relationship among trj(t), cijk(t) and pjk can be approximately denoted as a mapping function x( ) as followed:
( )
1 1( ) ( ( ) )
M tK
j ijk jkk i
tr t x c t p= =
= (15)
Then we can obtain that ESM execute intervals require the conditions: Tr(t2j+1 - te) = Tr(t2j+2 - te) = f( + ), te is the buffering time.
After we determine the ESM intervals, next we should evaluate energy consumption of the network. Denoting total power of BS j as Pj(t), it can been expressed as followed:
( ) ( )dy stj jP t P t P= + (16)
( )dyiP t and Pst dynamic part and static part of Pj(t) separately
which are denoted as (17) and (18):
( ) P ( ) /dyj Se Tx jP t n n t η = (17)
nSe is number of cells in each BS, nTx is number of antenna of each cell and is efficiency of power amplifier.
(stSe Tx Trans Proc Rect micro aircoP n n P P P P P = + + ) + + (18)
PTrans, PProc, PRect, Pmicro and Pairco are power of the transceiver, the digital signal processing, the recti er, the microwave link, and the air conditioning [16]. Notice that (15) to (18) suitable for BSs under NM and CM as well.
2012 8th International Conference on Network and Service Management (CNSM 2012) 5
Regional energy consumption when network is under SS (denoted as PS) is shown in (18):
2 2 2 2
2 1 2 1
2 2
2 1
1 1'
1 1
(1 ) 1
1
( ) ( )i i
i i
i
i
Q QNN t t
S j jt tj i j i
N Q t cojt
j i
P P t dt P t dt
P dt
βα
α β
+ +
+ +
+
+
− −
= = 0 = = 0
− − −
= = 0
= +
+ (19)
When network is under SS, energy-saving ratio denoted as Es is following:
2 2 2 2
2 1 2 1
1 1
1 1 0( ) / ( )i i
i i
Q QN Nt t
s j S jt tj i j i
E P t dt P P t dt+ +
+ +
− −
= = 0 = =
= − (20)
Assume energy-saving ratio on the whole period is Ee, it is shown in (21):
2 2
2 1
1
01 1
( ) / ( )i
i
QN Nt T
e j S jtj i j
E P t dt P P t dt+
+
−
= = 0 =
= − (21)
As for operational networks, Es and Ee are two intuitional indicators to evaluate energy efficiency of ESM methods, so they are still taken here.
From above analysis we can get a more accurate evaluation for the ESM method and saved energy consumption.
V. SIMULATION AND DISCUSSION
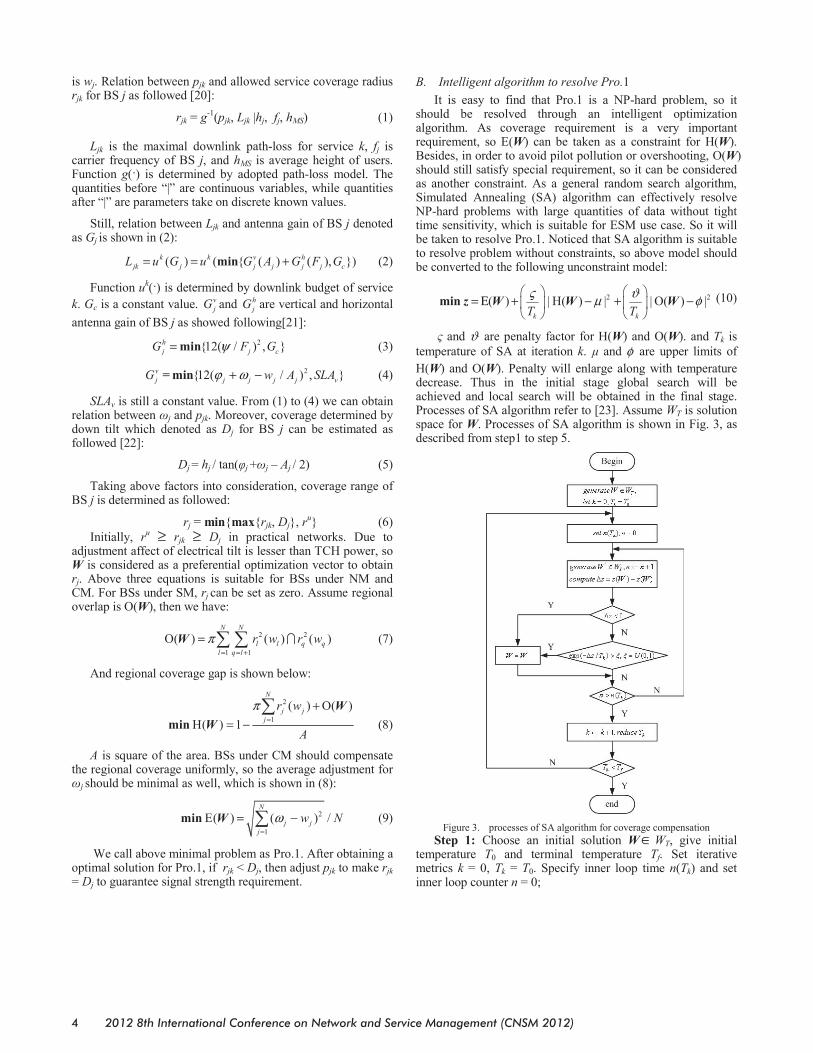
A. Scenario Description The mechanism will be simulated under an urban region of
WCDMA/HSPA in Qualnet. Carrier frequency f is 1.95GHz and 2.13GHz for uplink and downlink. COST231-HATA propagation model is adopted to estimate path-loss. Top view of simulation scenario is shown in Fig. 4.
Cell
NodeB #1
RNCSGSNGGSNHLR
Park
Cell
Cell
NodeB #2
NodeB #3
NodeB #4
NodeB #5
NodeB #6
NodeB #7
NodeB #8
NodeB #9
NodeB #10
NodeB #11
NodeB #12
NodeB #13
NodeB #14
NodeB #15
NodeB #16
NodeB #17 NodeB #18 Figure 4. Top view of simulation scenario
In our simulation, region size A is 3km×2.5km, and street width is 20m. A square shaped garden with size of 200m×200m is located in centre of this region. Heights of all the buildings are between 30m and 40m. 18 NodeBs containing 48 cells with steerable antennas are deployed on top of
buildings. Distances among neighbor Nodes are between 600m and 700m. Each NodeB (Enabling HSPA capacity) is connected to a same RNC and each cell is isomorphic. Initially for all the BSs, Aj = 8degrees, Fj = 65degrees, = 2degrees. And j and wj are 7degrees and 7.8 degrees separately. And hMS is 1.5m. CS AMR 12.2kbps voice service, CS 64kbps video call service, and PS 384kbps HTTP service will be provided in the area. Each cell is deployed with one carrier. Available bandwidth on each carrier is 5M/bps, and k for the three services is dynamic assigned. ES triggering and recovery buffering time can be set as 10 minutes to avoid frequent handovers. Moreover, Initial link budget parameters set can be found in TAB .I according to [16] for the three services.
TABLE I. LINK BUDGET PARAMETERS IN THE SCENARIOS
Parameters Uplink Downlink Unit Total transmitter power 21 43 dBm TX antenna gain 0 17.9 dBi TX cable loss 0 2 dB TX Body loss 2 0 dB Transmitter EIRP 19.0/23/23.5 40.9/45/45.9 dBm RX antenna gain 17.9 0 dBi Receiver noise power -103.2 -100.2 dBm Processing gain 25.0/17.8/10 25.0/17.8/10 dBi Required Eb/No 5.1/2.5 7.2/4.2 dB Interference margin 3 6 dB Required signal power -120/-116/-114 -112/-108/-106 dBm RX cable loss 2 0 dB RX Body loss 0 2 dB Diversity gain 3 0 dB Fast fading margin 3 0 dB Soft handover gain 2 1 dB Shadow Fading Margin 7.5 7.5 dB Indoor penetration loss 4 4 dB
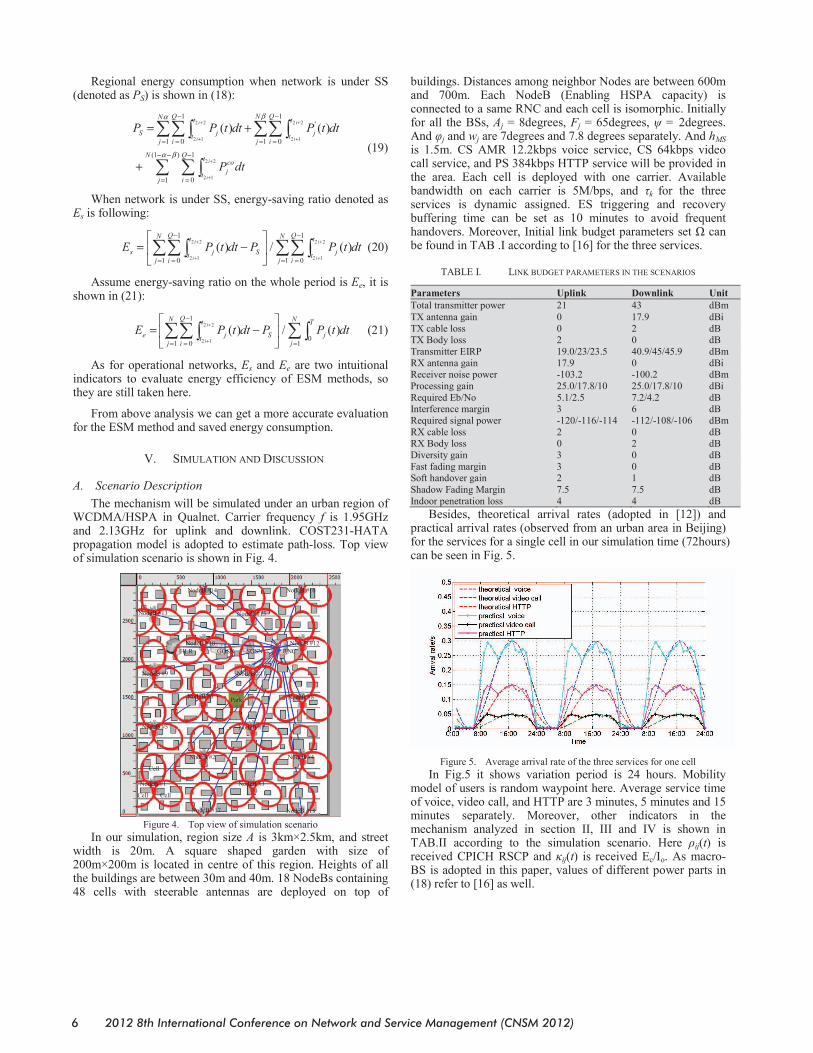
Besides, theoretical arrival rates (adopted in [12]) and practical arrival rates (observed from an urban area in Beijing) for the services for a single cell in our simulation time (72hours) can be seen in Fig. 5.
Figure 5. Average arrival rate of the three services for one cell
In Fig.5 it shows variation period is 24 hours. Mobility model of users is random waypoint here. Average service time of voice, video call, and HTTP are 3 minutes, 5 minutes and 15 minutes separately. Moreover, other indicators in the mechanism analyzed in section II, III and IV is shown in TAB.II according to the simulation scenario. Here ij(t) is received CPICH RSCP and ij(t) is received Ec/Io. As macro-BS is adopted in this paper, values of different power parts in (18) refer to [16] as well.
6 2012 8th International Conference on Network and Service Management (CNSM 2012)
Regional TP compensation method will be execute firstly to determine modes of NodeBs. Then intelligent coverage optimization method will be executed for NodeBs under CM. For SA algorithms in III.B, set T0 = 20, Tf = 1, Tk+1 = Tk 0.9, = 20 and ϑ = 200. In existing network range of pjk is from
25dBm to 32dBm with adjusting step of 0.1 dBm, and range of j is from 5 degree to 10 degree with adjusting step of 0.1
B. Result analysis For the mechanism, best value will be obtained
similarly when H(W) = 0.00156 and O(W) = 0.192 for two kinds of arrival rates for each period. Still, NodeB mode, Values of j after adjustments can be seen in TAB. III. Moreover, items of P still keep on normal mode. During each period, = 0.375 and = 0.375.
TABLE III. RESULT OF MECHANISM NodeB j(degree) Mode NodeB j(degree) Mode
#1 4.8 CM #10 SM #2 SM #11 SM #3 5.8 CM #12 7.8 NM #4 7.8 NM #13 5.3 CM #5 7.8 NM #14 7.8 NM #6 3.4 CM #15 5.8 CM #7 SM #16 7.8 NM #8 4.2 CM #17 7.8 NM #9 7.8 NM #18 7.8 NM
Validation is then executed. From coverage and service quality perspective, for networks without and with ESM, regional cumulative probability of ij(t) and ij(t) for the two kinds of arrival rates during the simulation time can be seen in Fig. 6. Result shows that coverage and service quality is slightly declined with SM but constraint (10) is still satisfied with proposed ESM mechanism (each indicator is varies under the upper limit).
a) CPICH RSCP Comparisons b)CPICH Ec/Io Comparisons Figure 6. Regional cumulative probability for CPICH RSCP and Ec/Io From capacity perspective, firstly resource constraints for
each NodeB in (12) are satisfied. For networks without and with ESM, regional block probability for practical and theoretical arrival rates can be seen in Fig. 7 and Fig. 8
separately for NodeB with highest load. Results show that block probability varies due to load variation for NodeBs under CM. For practical arrival rates, under SS intervals block probabilities are just a little higher(about 0.002) than peak values under NM but still acceptable. For theoretical arrival rates, block probabilities is lower than peak values under NM and keep on accepted levels. So we can conclude that ESM can obtain energy-saving gains with a little sacrifice on performance.
a) Network without ESM b) Network with ESM
Figure 7. Comparisons of regional block probability for practical arrival rates without and with ESM
From transmit power perspective, only W is required to be adjusted, so transmit power will stay keep on ordinary level, which means that power constraint is satisfied. Above analysis denotes that our method is fairly effective.
a) Network without ESM b) Network with ESM
Figure 8. comparisons of regional block probability for theoretical arrival rates without and with ESM
For each day, time intervals when network is under SS changes among 17.3 and 18.3 hours for theoretical arrival rates, and among 10.4 and 10.7 hours for practical arrival rates. That is, for one NodeB with SM, at least 64.88% and 34.83% of energy consumption can be saved for the two kinds of arrival rates, which takes on better efficiency than method in [10].
a) regional power variations b) regional energy consumptions
Figure 9. Comparisons of regional power and energy consumptions
2012 8th International Conference on Network and Service Management (CNSM 2012) 7
Through energy consumption model, for networks without and with ESM, regional power variations and regional accumulated energy consumption during the simulation time for can be seen in Fig. 9. After computation, Ee are 17.09% and 18.11%, and Es are 13.45% and 10.01% separately for theoretical and practical arrival rates, which take on an outstanding significance.
Comparing to other macroscopic methods, from coverage perspective, our determination of BS radius under CM through intelligent algorithm can obtain proper value according to traffic distribution, regional overlap and regional gap. So our mechanism will take on better coverage performance than these with equivalent adjustments for each BS [10-15]. Moreover, our mechanism gives more integral mathematical analysis for adjustment of wireless parameters to get effective coverage.
From capacity perspective, our mechanism give loose constraint for block probability (0.04 for each service) than threshold in [12][13] (where 0.01 is taken). However under the simulation each service can still be provided above acceptable level, which means that performance constraints under current networks have margin to be used for saving energy. We still take resource constraint into consideration to make sure our mechanism more feasible.
From transmit power perspective, our mechanism concerns limit of current power amplifier rather than total power of each BS in [13][14]. So as to make sure adjustment for BS power is reasonable.
For energy saving gains, our mechanism is suitable for BS deployments when maximal radius of one BS cannot cover another BS. So disadvantages of method in [14] can be reparable. Though taking transmit power and resource margins into considerations, our method obtain a little lower regional energy-saving gain than methods in [10] and [13], which are 16.04% and 17% separately. Another reason for this low value is only 18 NodeB exists in our simulation, and 1 – – is just 0.25. For regions with quantities of BS, our methods will be more efficient as number of BS under SM will be large. So our mechanism is still feasible and effective.
VI. RELATED WORK Currently considerable research exists which is related to
different aspects of ESM. Briefly description for these literatures is introduced in this section.
ESM is firstly defined by 3GPP [3], in which ESM concept, use case description, requirements, assessment criteria, function and architecture, and potential OAM based solutions are given. ESM methods then studied based on this SON use case.
One main ESM scenario is sleeping several BSs and control neighbor BS to compensate their coverage and capacity. The most important judgments metric is individual and regional traffic. When regional traffic can be fitted as continuous function, maximal regional energy-saving gains are analyzed in [10] and [11]. And regional traffic is still taken as a trigger condition in my paper.
For compensation for BS under CM, proper neighbor BS selection and its effect under theoretical BS sites have been briefly studied in [11], BS with hexagonal, crossroad, and Manhattan configurations are all take into consideration. Research in [13][15][17] still propose several BS compensation method, for instance, 2-BS acceptor and 3-BS acceptor to accommodate coverage and capacity for BS under CM. Relationship between triggering threshold and regional energy-saving gains are studied as well. Though only taking uniform BS distribution into consideration, our TP ESM method is based on these literatures. A more energy-efficient traffic driven ESM method is given in [14]. Regional is divide into grids to execute energy-saving actions separately. It still denotes that methods with sleeping and compensation are compatible well with current 3GPP standards.
As energy consumption of BS is affected by many factors such as load, temperature, and seasons, relationship among BS power and these factors have been analysis. Results show that in practical networks the correlation is almost linear [14]. Still, general energy consumption model is quantified for BS in different types of networks, such as UMTS, WiMAX, and LTE [16], Radius variation and its effect to transmit power is analyzed as well. It shows that cell breathing can be adapted to compensate BS under CM [17]. Above research supports integrated energy consumption model proposed in this paper.
VII. CONCLUSIONS AND FUTURE WORK This paper proposes a novel regional ESM mechanism for
saving energy in cellular wireless networks while guaranteeing regional coverage and service quality. The mechanism firstly proposes a novel regional TP compensation method for irregular distributions. Then the mechanism adopts an intelligent coverage optimization algorithm to determine adjustments of down tilt and TCH power for BSs under CM, so as to obtain optimal coverage and capacity compensations. Effect validations for the method and energy consumption model are still studied by the mechanism. This mechanism is simulated in WCDMA/HSPA networks under urban scenarios with theoretical and practical arrival rates for three services. Results show that with the proposed mechanism, one BS under SM can save at least 34.83% of energy consumption for one BS under CM, and the network can sget 18.11% and 10.01% enegy-saving gains during sleeping time and the entire simulation time. Acceptable compensations and service quality can be obtained as well.
However, several extensions still exists in the paper, for instance, the efficiency of regional TP compensation method can be optimized, and extended energy-saving method for heterogeneous networks should be considered. Moreover, suitable adjustment which can make the mechanism obtain higher energy-saving gains under more complex environment with quantities of different types of BS are under current research.
ACKNOWLEDGMENT This research is supported by the Funds for Creative
Research Groups of China (61121061), National S&T Major Projects (2011ZX03003-002-01), National Key Technology R&D Program (2012BAH06B02) and NCET-10-0240.
8 2012 8th International Conference on Network and Service Management (CNSM 2012)
REFERENCES [1] C. Lubritto, A. Petraglia, C. Vetromile, S. Curcuruto, M. Logorelli, G.
Marsico,et al., “Energy and environmental aspects of mobile communication systems”, Energy, vol. 36, pp. 1109–1114, November 2010.
[2] J.T. Louhi, “Energy efficiency of modern cellular base stations”, in proceeding of the 29th International Telecommunications Energy
Conference, 2007, pp. 475–476. [3] 3GPP TR 32.826, “Study on Energy Saving Management (ESM)”,
v10.0.0, 2010. [4] E. Mino, E. Torrecilla, L. M. del Apio, and I. Berberana, “SON use case
study energy saving for LTE eNBs”. IEEE Latin America Transactions, vol.8, pp. 184–189, April 2010.
[5] S. Zhou, J. Gong, Z. Yang, et al., “Green mobile access network with dynamic base station energy saving”, in proceeding of the 15th Annual International Conference on Mobile Computing and Networking workshop (Mobicom), 2009, pp.25~29
[6] Z. Niu, Y. Wu, J. Gong, and Z. Yang, “Cell zooming for cost-efficient green cellular networks”, IEEE Communications Magazine, vol. 48, pp. 74–79, November 2010.
[7] J. Lorincz, A. Capone, D. Beguši , “Optimized network management for energy savings of wireless access networks”, Computer Networks, vol. 55, pp. 514–540, October 2010.
[8] K. Dufkova, M. Bjelicaz, B. Moon, L. Kencl, and J. Y. Le Boudec, “Energy savings for cellular network with evaluation of impact on data traf c performance”, in proceeding of 2010 European Wireless Conference, 2010, pp. 916~923.
[9] Kyuho Son, Hongseok Kim, Yung Yi, and B. Krishnamachari, “Base station operation and user association mechanisms for energy-delay tradeoffs in green cellular networks”, IEEE Journal on Selected Area in Communications, vol. 29, pp.1525–1536, September 2011.
[10] E. Oh, and B. Krishnamachari, “Energy savings through dynamic base station switching in cellular wireless access networks”, in proceedings of 2010 IEEE Global Telecommunications Conference (Globecom), 2010, pp. 1–5.
[11] M. A. Marsan, L. Chiaraviglio, D. Ciullo, and M. Meo, “Optimal Energy Savings in Cellular Access Networks”, in proceedings of IEEE 2009 International Conference on Communication Workshops (ICCW), 2009, pp. 1–5.
[12] L. Chiaraviglio, D. Ciullo, M. Meo, and M. A. Marsan, “Energy-efficient management of UMTS access networks”, in proceedings of 21st International Teletraffic Congress, 2009, pp. 1–8.
[13] L. Chiaraviglio, D. Ciullo, M. Meo, and M. A. Marsan, “Energy-aware UMTS access networks”, In proceedings of 11th International Symposium on Wireless Personal Multimedia Communications (WPMC), 2008, pp. 1–5.
[14] C. Peng , S.B. Lee , S. Lu , H. Luo , H. Li, “Traffic-driven power saving in operational 3G cellular networks”, in proceedings of the 17th Annual International Conference on Mobile Computing and Networking (Mobicom), 2011, pp. 121–132.
[15] Md. Farhad Hossain, K. S. Munasinghe, and A. Jamalipour, “An eco-inspired energy efficient access network architecture for next generation cellular systems”, in proceedings of 2011 IEEE Wireless Communications and Networking Conference (WCNC), 2011, pp. 992–997.
[16] M. Deruyck, E. Tanghe, W. Joseph, and L. Martens, “Modeling and optimization of power consumption in wireless access networks”, Computer Communications, vol. 34, pp. 2036–2046, November 2011.
[17] S. Bhaumik, G. Narlikar, S. Chattopadhyay, and S. Kanugovi, “Breathe to stay cool: adjusting cell sizes to reduce energy consumption”, in proceedings of the first ACM SIGCOMM workshop on Green networking, 2010, pp. 41–46.
[18] B. Badic, T. O’ Farrell, P. Loskot, et al., “Energy efficient radio access architectures for green radio: large versus small cell size deployment”, in proceeding of the 70th Vehicular Technology Conference Fall (VTC Fall), 2009, pp. 1–5.
[19] Z. Hasan, H. Boostanimehr, and V. K. Bhargava, “Green Cellular Networks: A Survey, Some Research Issues and Challenges”, IEEE
Communications Surveys and Tutorials, vol. 13, pp. 524–540, November 2011.
[20] J. Hämäläinen, “Cellular Network Planning and Optimization – Part VII: WCDMA Link Budget”, Helsinki University of Technology, 2008.
[21] H. Al Hakim, H. Eckhardt, and S. Valentin, “Decoupling antenna height and tilt adaptation in large cellular networks”, in proceedings of 8th International Symposium on Wireless Communication Systems, 2011, pp. 11–15.
[22] T. Isotalo, J. Niemelä, and J. Lempiäinen, “Electrical antenna downtilt in UMTS network”, in proceedings of 5th European Wireless Conference, 2004, pp. 265–271.
[23] E. Meshkova, J. Riihijarvi, A. Achtzehn, and P. Mahonen, “Exploring Simulated Annealing and Graphical Models for Optimization in Cognitive Wireless Networks”, in proceedings of 2009 IEEE Global Telecommunications Conference (Globecom), 2009, pp. 1–8.
[24] Young-Keum Song, Dongwoo Kim and J. Zander, “Pilot Power Adjustment for Saving Transmit Power in Pilot Channel Assisted DS-CDMA Mobile Systems”, IEEE Transactions on Wireless Communications, vol. 9, pp. 1–6, February 2010.
[25] J. Laiho, A. Wacker, and T. Novosad, Radio Network Planning and Optimisation for UMTS, Second Edition, John Wiley & Sons, Ltd, Chichester, UK. 2007.
2012 8th International Conference on Network and Service Management (CNSM 2012) 9