A GLOBAL COUNTRY REPORT ON BELGIUM Submitted to Gujarat Technological University IN PARTIAL FULFILLMENT OF THE REQUIREMENT OF THE AWARD FOR THE DEGREE OF MASTER OF BUSINESS ADMINISTRATION In Parul Institute of Engineering & Technology MBA Compiled By:- Ms. Iram Ada Khan Assistant Professor Ms. Vidita Sinha Assistant Professor Submitted by Parul Institute of Engineering & Technology MBA Students Batch: 2011-13 MBA SEMESTER III & IV PARUL INSTITUTE OF ENGINEERING & TECHNOLOGY MBA MBA PROGRAMME Affiliated to Gujarat Technological University Ahmedabad 2013
Transcript
A
GLOBAL COUNTRY REPORT
ON
BELGIUM
Submitted to
Gujarat Technological University
IN PARTIAL FULFILLMENT OF THE
REQUIREMENT OF THE AWARD FOR THE DEGREE OF
MASTER OF BUSINESS ADMINISTRATION
In
Parul Institute of Engineering & Technology MBA
Compiled By:-
Ms. Iram Ada Khan
Assistant Professor
Ms. Vidita Sinha
Assistant Professor
Submitted by
Parul Institute of Engineering & Technology MBA Students
Batch: 2011-13
MBA SEMESTER III & IV
PARUL INSTITUTE OF ENGINEERING & TECHNOLOGY MBA
MBA PROGRAMME
Affiliated to Gujarat Technological University
Ahmedabad
2013
NAME AND ENROLLMENT NO. OF GROUPS
GROUP NO 1
PART I: CHAPTER 1 DEMOGRAPHIC PROFILE OF BELGIUM
PART II: SECTOR ANALYSIS OF MACHINERY TOOLS INDUSTRY
ENROLMENT NO. NAME OF STUDENT
117420592001 BHATT NAIMISHKUMAR PRAFULKUMAR
117420592002 KALELE KAUSHIK MADHAV
117420592004 SRIVASTAVA NITESH UMESH
117420592005 SHERASIYA HITESHKUMAR GANESHBHAI
117420592006 BASER SURYA KAILASH
117420592007 GULABANI VINITA RAJMOHAN
GROUP NO 2
PART I: CHAPTER 2 ECONOMIC OVERVIEW OF BELGIUM
PART II: SECTOR ANALYSIS OF GLASS INDUSTRY
ENROLMENT NO. NAME OF STUDENT
117420592008 MAHADIK JANHAVI SHARAD
117420592009 SABNIS SHRUTI UDAY
117420592010 MEHTA MAITREE LAHERCHAND
117420592011 BHATT NIDHI PRAMODKUMAR
117420592012 GOLANI BHAVITA SUNIL
117420592013 PARIKH SAMKIT DEVESH
GROUP NO 3
PART I: CHAPTER 3 OVERVIEW OF INDUSTRIES TRADE AND COMMERCE
PART II: SECTOR ANALYSIS OF PAPER & PACKAGING INDUSTRY
ENROLMENT NO. NAME OF STUDENT
117420592015 THOBHANI NEEL MAHENDRABHAI
117420592016 BHOITE SWAPNILA RAJIVAN
117420592017 NANWANI VIKAS DAYANAND
117420592018 GAYATHRI SHANKAR
117420592019 DIVIYESH GOHEL
117420592020 PALAK JAISWAL
GROUP NO 4
PART I: CHAPTER 4 OVERVIEW OF DIFFERENT ECONOMIC SECTORS OF BELGIUM
PART II: SECTOR ANALYSIS OF TRAVELS & TOURISM INDUSTRY
ENROLMENT NO. NAME OF STUDENT
117420592021 AHUJA PAYAL NARENDRAKUMAR
117420592022 JADEJA DUSHYANT NARPATSINH
117420592023 GAJJAR MANISHKUMAR ARVINDBHAI
117420592024 PUROHIT SAMPADA MILIND
117420592026 GALAGALI AAKASH ANIL
117420592027 GOSAI NIKITA SATISHGIR
GROUP NO 5
PART I: CHAPTER 5 OVERVIEW OF BUSINESS & TRADE AT INTERNATIONAL LEVEL
PART II: SECTOR ANALYSIS OF METAL INDUSTRY
ENROLMENT NO. NAME OF STUDENT
117420592028 PRAJAPATI VANDITKUMAR RAMESHBHAI
117420592029 SHEKH IRSADBHAI ARAHIMBHAI
117420592030 VADHER TEJALBEN ABHUBHAI
117420592031 RATHOD SANDIPKUMAR DHIRUBHAI
117420592032 PARMAR BHAVINI GANPATBHAI
117420592033 KATHIRIYA AJAYKUMAR PRAGJIBHAI
GROUP NO 6
PART I: CHAPTER 6 PRESENT TRADE RELATIONS AND BUSINESS VOLUME OF DIFFERENT PRODUCTS WITH
INDIA/GUJARAT
PART II: SECTOR ANALYSIS OF GEMS & JEWELLERY INDUSTRY
ENROLMENT NO. NAME OF STUDENT
117420592034 PARMAR MANHAR NARSHIBHAI
117420592035 PRAJAPATI HARESHKUMAR VINODBHAI
117420592036 SHAIKH SUMAIYA MOHMMEDHANIF
117420592037 PATEL VIREN BABUBHAI
117420592038 MAKWANA JITENDRAKUMAR MOTIBHAI
117420592039 KATHIRIYA PRATIKKUMAR ANUBHAI
GROUP NO 7
PART I: CHAPTER 7 POLITICAL ANALYSIS
PART II: SECTOR ANALYSIS OF PHARMACEUTICAL INDUSTRY
ENROLMENT NO. NAME OF STUDENT
117420592040 MISTRY CHANDNI RAMESHBHAI
117420592041 SUDAN ROBINA RAJESHBHAI
117420592042 PATEL JUGALKUMAR RAMANBHAI
117420592043 SHEKH SOEB NOORMOHMED
117420592044 CHAUDHARY AKASHKUMAR RAMESHBHAI
117420592045 DHAVAL RAJESHBHAI GANDHI
GROUP NO 8
PART I: CHAPTER 8 ECONOMIC ANALYSIS
PART II: SECTOR ANALYSIS OF AUTOMOBILE INDUSTRY
ENROLMENT NO. NAME OF STUDENT
117420592046 RAULJI SHELU RAJENDRASINGH
117420592047 VIKRAM AWASTHI
117420592048 POOJA SANATKUMAR MEHTA
117420592049 PATEL NISHANTKUMAR RAJENDRAKUMAR
117420592050 SHAH VAIBHAV KAMLESHBHAI
GROUP NO 9
PART I: CHAPTER 9 SOCIAL & TECHNOLOGICAL ANALYSIS
PART II: SECTOR ANALYSIS OF FOOD & BEVERAGES INDUSTRY
ENROLMENT NO. NAME OF STUDENT
117420592051 CHUDASAMA RAJDEEPSINH KISHORSINH
117420592052 CHARVI MANISH PATHAK
117420592053 PATEL GAURAV NATVARBHAI
117420592054 THAKOR DIPYANTIBEN MAHENDRASINH
117420592055 GANDHI SHREENATH RAJESHKUMAR
117420592056 PATEL VARUNKUMAR JASHUBHAI
GROUP NO 10
PART I: CHAPTER 10 ENVIRONMENTAL & LEGAL ANALYSIS
PART II: SECTOR ANALYSIS OF CHEMICAL INDUSTRY
ENROLMENT NO. NAME OF STUDENT
117420592057 MEHTA HETA BIPINBHAI
117420592058 PATEL SHIVALI GIRISHBHAI
117420592059 PATEL CHIRAGKUMAR ARVINDBHAI
117420592060 PARMAR BINAL NAKUSHKUMAR
117420592061 KHER PRAVEEN SHIV NANDAN
DECLARATION We, students of Parul Institute of Engineering & Technology MBA, hereby
declare that the report for Global Country Report on Belgium is a result of
our own work and our indebtedness to other work publication, references, if
any have been duly acknowledged.
Place: Vadodara
Date: _________
Names of the Group Leaders Signature
Group 1: Kaushik Kalele
Group 2: Samkit Parikh
Group 3: Gayathri Shankar
Group 4: Dushyant Jadeja
Group 5: Kathiriya Ajay
Group 6: Prajapati Haresh
Group 7: Robina Sudan
Group 8: Mehta Pooja
Group 9: Gandhi Shreenath
Group 10: Kher Praveen
INSTITUTE’S CERTIFICATE
It is certified that this Global Country Report on Belgium is the bonafide work
of students of Parul Institute of Engineering & Technology MBA who carried
out the research under our supervision. We also certify further, that to the
best of our knowledge the work reported herein does not form part of any
other project report or dissertation on the basis of which a degree or award
was conferred on an earlier occasion on this or any other candidate.
Name of the Faculty Guide Signature
Ms Vidhita Sinha
Ms Iram Khan
PREFACE
The Practical training at MBA level is to develop the students’ experience
about industrial environment of business practice at domestic as well as
international level in order to develop a practical base in them as
supplement to the theoretical studies of the management in general. The
theoretical knowledge and concept ideas are the enough background for
career development but the practical training is also having equal
contribution for the purpose.
It is very true saying that “Without practical exploration no one becomes
expert”. Global Country Report, an opportunity provided by the university
intends to increase the knowledge, attitude and ability of a student to
observe and perceive the business system of another country. As a result of
MBA, it is a part of education that we may be allowed to know about how a
particular industry / sector perform in another country.
Through Global Country Report, we come across some great knowledge of
how a particular industry / sector perform in a country.
ACKNOWLEDGEMENT
This acknowledgement is not only the means of formality, but to us, it is a
way by which we are getting the opportunity to show the deep sense of
gratitude and obligation to all the people who have provided us with
inspiration, guidance and help during the preparation of the project.
At the very outset, we would like to express our gratitude from the bottom of
our hearts to Gujarat Technological University for giving the students the
opportunity to do a Global Country Report so that we can learn about the
business as well as managerial activities regarding another country.
We would also like to express our gratitude to our faculty guide Ms. Aashka Patel- (Asst. Professor), Ms. Iram Khan- (Asst. Professor ), Ms. Vidhita
Sinha–(Asst. Professor ), Parul Institute of Engineering & Technology
MBA, who helped us in carrying our project work, which ultimately resulted
in successful completion of the project. Last but not the least we are thankful
to our parents, friends and all well wishers for blessing us for our success.
EXECUTIVE SUMMARY Gujarat technological university has added Global Country Report in the current syllabus
so that students get practical knowledge of other countries along with India. The objective
of Global Country Report is to enable the students about the socio-economic aspects of a
foreign country, and learn about present and potential area of business with that country.
It also enables the students to learn about how to do business / export / import with /
within that country. Here, we have chosen Belgium for our study. This report includes the
Summary of work done in the Semester III (PART I) and also the summary of work done
in Semester IV (PART II).
Part I focuses on the Demographic profile, General Economic & Industries overview,
General overview of Trade & Commerce, Overview of different economic sectors of
Belgium, Legal aspects of trade in Belgium, Present trade relations of Belgium with India
and specifically Gujarat, the Import Export scenario between the two nations, Business
volume of different products, investments with India and also Gujarat. It also includes the
PESTEL Analysis.
Part II in this report consists of a Specific Study and Analysis of different sectors. It is a
synopsis of Analysis of particular industry/sector/company of Belgium, the present
relationship with Indian trade and commerce, investment, import-export. Further it also
focuses on the identification of possibilities or new opportunities of business which can be
in trade, manufacturing, import, export, investment etc in Belgium. The different sectors
which we have covered under specific study and analysis are Machinery & Tools, Glass,
CH.4:- PRESENT & TREND OF BUSINESS IMPORT – EXPORT WITH
INDIA/ GUJARAT
India’s Glass Industry Contribution To Economy
The types of glass currently manufactured in India are float glass and sheet glass
The Glass Industry in India has the manufacture capacity of around 0.68 million
tons in a year
Manufacture of float glass is about 0.51 million tons, which is nearly 75 % of the
total glass production in India.
Production of sheet glass is about 0.17 million tons, which is almost 25 % of the
total glass production in India.
Float glass can be classified into three types, such as coloured glass, processed
glass, and clear unprocessed glass.
The production sector is the largest consumer of float glass. Around 60 % of the
total production is used by the construction sector.
The other glass customers use 10 % of the total production.
FDI Inflow Yearly To Glass Major Player
The Indian Glass Industry is dominated by the subsidiary of the major foreign glass
manufacturing companies
The overseas players are Saint-Gobain, Asahi Float glass, and Gujarat Guardian
Saint
-Gobain has invested ` 700 corers in establishing a second float glass and automotive
glass-manufacturing unit at Sriperumbudur, in Tamil Nadu.
Asahi Glass is planning to establish a production unit at an estimated cost of ` 50
corers near Chennai.
Belgium Trade Relations with India
Economic And Trade Relations
Belgium has emerged as one of India’s significant trading partners in the EU. Trade in
gems and jewellery constitutes over 75% of the bilateral trade. India’s IT sector is well
representing in Belgium, with all the big IT companies having their establishment.
Several Indian companies in the chemicals sector have also recognized
offices/warehousing facilities in Belgium, particularly close to the port city of Antwerp.
Belgian business interests in India cover energy, ports, dredge, building, banking and
finance, electronics and software, chemicals and fertilizers, astrophysical energy and
biotechnology.
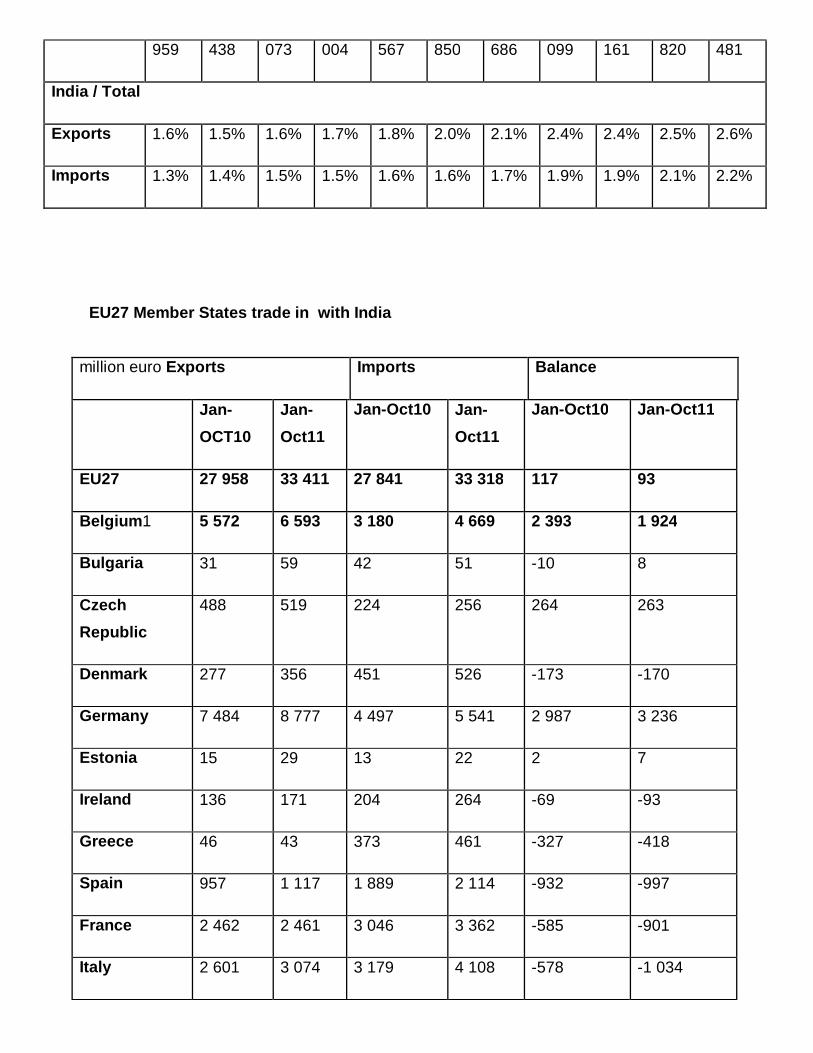
Bilateral Trade
Belgium is the second largest trading partner of India in the European Union with yearly
bilateral trade yield amounting Euro 10.4 billion in 2010. India is the 5th largest exporter
to Belgium (after USA, China, Japan and Russia) and 2nd largest importer of Belgian
merchandise in 2010 (after USA). The major items of Indian exports to Belgium are -
Precious stones; Textiles and clothing; Iron and steel; Chemical products; Mineral
products; Organic chemicals; equipment and Electrical Equipment’s etc. The major items
of Indian imports from Belgium are- Precious gravel; Iron and steel; Machinery and
mechanical appliances; Chemical products; boilers, equipment and mechanical
appliances & parts thereof: untreated chemicals; Plastic and rubber; Plastics and articles
thereof; Pharmaceutical products etc. A MoU on collaboration in railway sector has been
agreed upon and is ready for signature.
Following figures show Trade Relation of Belgium and India:
Table 4.1 Bilateral Trade Of India And Belgium: (Figures in US $ Million)
Year 2009-2010
(1)
2010-2011
(2)
2011-2012
(3)
% variation
(2)/(1)
% variation
(3)/(2)
Export 1981.0 2524.7 3525.2 27.4 39.6
Import 8754.7 11402.4 14219.2 30.2 24.7
Total Trade 10735.7 13927.1 17744.4
Bilateral Investment
Belgium has emerged as the 23rd largest investor in India universal and the 9th largest
within the EU but the total FDI in India from Belgium is still comparatively small. A
cumulative figure of FDI inflows from Belgium into India amount to US $ 327.84 million
from April 2000 to April 2010. In the recent past, Indian outlay in Belgium has exceeded
investment by Belgian firms in India mainly from side to side several takeovers of Belgian
firms by Indian companies. Quite a few Indian companies particularly in the IT and
software sector have established base in Belgium to cater to Belgian as well as the
European market.
Belgium Import-Export with India
Import And Export
The import-export state of affairs is not clear at the moment. The globalization of the
market makes it simpler to transport and sell products everywhere in the world. Countries
such as China, India, North Africa, etc. are now flattering more and more competitive, with
low prices and product quality which is sometimes equal to goods made in European or
western countries.
In Table 2, it is probable to notice that exports have been steady over the last three years,
but not in the same way in all sectors. Their growth, from 2007 to 2008 in particular,
showed a positive trend for flat glass (unchanged and transformed) and “other glass”,
while container glass, crockery/crystal, fibres and special glass registered a heavily
negative trend. Concerning imports the situation is quite perturbing. All sectors, excluding
untransformed flat glass, registered a positive trend between 2007 and 2008, which was
mainly high for container glass (36.8 % in 2006-2007 and 29.2 % in 2007-2008). The
inversion of the leaning for unchanged flat glass was probably due to the heavy slump in
the European market.
Table 4.2 Import-Export In The EU27
Compared to Europe, the Italian state of affairs is rather similar. The performance of the
container glass (bottles & jars) sector was mainly poor. It registered an import increase of
approximately 19 % from 2007 to 2008, compared to an export decrease of about 1 %
during the same period.
Graph 4.1 Destination of EU27 Glass Graph 4.2 Origin of EU27 Glass Imports
Exports (2007) (2007)
Graph 4.3 EU27 Glass Exports By Graph 4.4 Eu27 Glass Imports By
Sub-Sector Sub-Sector
CH.5:- POLICIES & NORMS OF SELECTED COUNTRY FOR INDUSTRY/ COMPANY FOR EXPORT-IMPORT LICENSING PERMISSION TAXATION
BELGIUM- IMPORT/EXPORT REGULATIONS
Belgium is part of the European Union which has developed a common trade policy for all
member countries. The common commercial policy is a pillar for the external relations of the
European Union. It is based on a set of uniform rules under the Customs Union and the
Common Customs Tariff and governs the commercial relations of the Member States with
Non-EU Member Countries. The purpose of the instruments of trade defense and market
access is mainly to protect European businesses from obstacles to trade. The EU has evolved
during the process of globalization by aiming for the harmonious development of world trade
and fostering fairness and sustainability. It actively encourages the opening of the markets
and the development of trade in the multilateral framework of the World Trade Organization
(WTO). At the same time, it supports developing countries and regions through bilateral
relations with a view to involving them in world trade using preferential measures. Many of the
trade issues are standardized across the European Union, and the text below describes briefly
the highlights of the EU trade policy.
Licensing: The EU has a liberal import regime where import licensing is not common. Import
licenses are issued with due consideration for the provisions of relevant European Union trade
agreements and the needs of the specific importing country.
Quality Standards: Under the EU's "New Approach to Technical Harmonization", certain
products are required to meet the specific quality standards including toys, machinery,
telecommunications terminal equipment, medical devices, electrical equipment, appliances,
etc. Qualified products must carry a CE mark to show its compatibility, fixed onto the product
by a manufacturer or importer as self-declaration of compliance.
Import duties: Imports into the EU countries are subject to the respective import tariff
(normally applied on the import c.i.f. value) plus the value-added tax (VAT) varies according to
different importing countries. For Belgium, the most commonly applicable rate is 21% although
the rates of 0%, 6% and 12% also exist.
Packaging: Manufacturers and exporters should minimize the packaging of their products
exporting to the EU.
COMMON RULES FOR IMPORT IN EU
This regulation aims to establish common rules for imports into the European Union (EU)
based on the principle of the freedom of import and to define the procedures enabling the EU
to implement, where necessary, the surveillance and safeguard measures required to protect
its interests.
The regulation lays down the principle of freedom to import products originating in non-
European Union (EU) countries, subject to possible safeguard measures. This regulation
applies to imports into the EU of products originating in non-EU countries except for textile
products covered by special rules for imports and products originating from non-EU countries
which are subject to that country’s own import rules.
Information and consultation procedure
EU countries must inform the Commission if import trends suggest the need for surveillance or
safeguard measures. Consultations may be held either at the request of an EU country or on
the initiative of the Commission. They take place within an advisory committee made up of
representatives of each EU country with a representative of the Commission as chairman.
These consultations primarily examine the conditions of imports, the economic and
commercial situation and the measures, if any, to be taken. Consultations may be conducted
in writing if necessary and the EU countries may express their opinion or request oral
consultations within a period of five to eight working days.
Investigation procedure
Where, after consultations it is apparent that there is sufficient evidence to justify the initiation
of an investigation, the Commission initiates an investigation within one month and publishes
a notice in the Official Journal of the European Union, summarizing the information received.
The investigation seeks to determine whether imports of the product in question are causing
or threatening to cause serious injury to the EU producers concerned. Once the investigation
has been launched, the Commission seeks and verifies all information it considers necessary
for the conduct of the investigation.
Within the framework of the investigation, the Commission examines:
the volume of imports;
the price of imports;
the consequent impact on EU producers;
factors other than trends in imports which are causing or may have caused injury to the
EU producers concerned.
At the end of the investigation, the Commission submits a report to the advisory committee
and, depending on the conclusion of its investigations, either terminates the investigation or
decides to implement surveillance or safeguard measures.
This investigation procedure does not preclude the use, particularly in critical circumstances,
of surveillance or provisional safeguard measures. In this instance, the duration of such
measures must not exceed 200 days.
Surveillance measures
Imports of products may have to undergo EU checks on the basis of a decision by the Council
or the Commission if market trends in this product threaten to cause injury to the EU
producers of like or competing products, and the EU’s interests require such checks.
The decision to introduce surveillance measures is normally taken by the Commission. Such
surveillance may involve retrospective checks of imports (statistical surveillance) or prior
checks. In the latter case, products under prior surveillance may only be put into free
circulation within the EU on production of an import document. This document is issued by the
EU countries, free of charge, for any quantity requested and within a maximum of five days of
receipt of a declaration by the importer, regardless of their place of business in the EU. The
document is valid throughout the EU, regardless of the EU country of issue.
Surveillance measures do not necessarily cover the entire EU. Where imports of a product
have not been made subject to prior EU surveillance within eight working days of the end of
consultations on the possibility of establishing EU surveillance, the Commission may introduce
surveillance confined to imports into one or more regions of the EU.
EU countries must inform the Commission each month of the import documents that were
issued (in cases of prior surveillance) and the imports received (in cases of prior and
retrospective surveillance).
Safeguard measures
Safeguard measures may be applied where products are imported into the EU in such greatly
increased quantities and/or on such terms or conditions as to cause, or threaten to cause,
serious injury to EU producers. As regards members of the World Trade Organization (WTO),
these measures are cumulative.
Where these conditions are fulfilled, the Commission may change the period of validity of the
import documents issued in respect of surveillance or establish an import authorization
procedure and, in particular, a quota system for imports.
When establishing a quota, account is taken of the desirability of maintaining, as far as
possible, traditional trade flows and of the volume of goods exported under contracts
concluded before the entry into force of the measure. In principle, the quota should not be set
lower than the average level of imports over the last three years.
Safeguard measures apply to every product which is put into free circulation after their entry
into force. In exceptional cases, they may be confined to one or more regions of the EU.
However, they do not prevent the release for free circulation of products already on their way
to the EU.
These measures are taken by the Commission or by the Council. Where intervention by the
Commission has been requested by an EU country, the Commission takes a decision within a
maximum of five working days. The Commission’s decision is communicated to the Council
and to the EU countries. Any EU country may, within one month, refer the decision to the
Council. In this case, the Council, acting by a qualified majority, may confirm, amend or
revoke that decision. If, within three months, the Council has not taken a decision, the
decision taken by the Commission is deemed to be revoked.
In any event, where the interests of the EU so require, the Council, acting by qualified majority
and on a proposal from the Commission drawn up in accordance with the conditions set out
above, may adopt safeguard measures.
No safeguard measure may be applied to a product originating in a developing country of the
WTO as long as that country’s share of EU imports of the product concerned does not exceed
3 %, and on the condition that collectively the developing countries of the WTO with less than
a 3 % import share do not account for more than 9 % of total EU imports of the product
concerned.
The duration of safeguard measures may not, in principle, exceed four years, unless they are
extended under the same conditions as the initial measures were adopted. Under no
circumstances may the duration of the measures exceed eight years.
In addition to safeguard measures as such, the regulation stipulates that the Council, on
proposal from the Commission, may adopt appropriate measures to allow the rights and
obligations of the EU or of all its member countries, in particular those relating to trade in
commodities, to be exercised and fulfilled at international level.
This regulation does not preclude the fulfilment of obligations arising from special agreements
concluded between the EU and non-EU countries. Nor does it preclude the adoption or
application by EU countries of measures on grounds of public order, public morality, public
security, the protection of health and life of humans, animals or plants, the protection of
national treasures, the protection of industrial and commercial property, and special formalities
concerning foreign exchange.
COMMON RULES FOR EXPORT IN EU
This regulation establishes common rules for exports from the European Union (EU) based on
the principle of freedom of export and defines the procedures enabling the EU to implement,
where necessary, the surveillance and protective measures required.
This regulation lays down the principle of freedom of export, stating that exports from the
European Union (EU) to non-EU countries are free from quantitative restrictions.
Information and consultation procedures
EU countries may adopt protective measures if they consider it necessary due to unusual
developments on the market. Before implementing these protective measures, the EU country
must inform the Commission accordingly, which will then advise the other EU countries.
Consultations may be held at any time and take place within an advisory committee composed of representatives of each EU country and chaired by a representative
of the Commission. These consultations relate, in particular, to the export conditions and
trends for the product in question as well as the measures, if any, to be adopted.
The Commission may request EU countries to supply statistical data on market trends in a
given product for the purpose of assessing the economic and commercial situation. It may
also ask them to exercise surveillance over given products in accordance with their national
legislation and with the procedure specified by the Commission.
Protective measures
The interests of the EU may require the adoption of appropriate measures to prevent or
remedy a critical situation brought about by a shortage of essential products, or to allow
international commitments entered into by the EU or all the EU countries to be fulfilled, in
particular those relating to trade in primary products. These measures are generally
quantitative restrictions on exports.
The Commission, acting at the request of an EU country or on its own initiative, may make the
export of a product subject to the production of an export authorisation. The granting of an
export authorisation is governed by such provisions and subject to such limits as the
Commission shall lay down pending subsequent action by the Council. The Council and the
EU countries shall be notified of the measures taken which shall take effect immediately.
These protective measures may be limited to exports to certain countries or exports from
certain regions of the EU. They do not affect products already on their way to the EU frontier.
In principle, protective measures are adopted by the Council, acting by a qualified majority on
a proposal from the Commission. The Commission may also implement such measures where
immediate action is required.
During their application, protective measures are the subject of consultation on the advisory
committee with a view to examining their effects and ascertaining whether the conditions for
their application are still satisfied. As a result, they may be amended or revoked if they are no
longer necessary.
This regulation does not prevent EU countries from adopting or applying quantitative
restrictions on exports on grounds of public morality, public policy, public security, the
protection of health and life of humans, animals and plants, the protection of national
treasures possessing artistic, historic or archaeological value, or the protection of industrial
and commercial property.
CORPORATE TAX
Definition
Companies and profit-making organisations with legal personality which have their
registered office, their main business centre or their seat of management in Belgium are
subject to Belgian corporate income tax.
These companies are subject to Belgian corporate income tax on their worldwide profits.
If however the Belgian company derives income from a foreign branch, this income will
be exempt from tax if the branch is located in a country which has a preventive double
taxation treaty with Belgium.
Foreign companies can be subject to corporate income tax if they are carrying out
business activities in Belgium through a branch (permanent establishment).
Rates
The standard Belgian corporate income tax rate is currently 33.99%.
A reduced and progressive rate applies for companies which have a taxable profit not
exceeding 322 500 €. This rate amounts to:
24.98 % in the bracket 0 € to 25 000 €.
31.93 % in the bracket 25 000 € to 90 000 €.
35.54 % in the bracket 90 000 € to 322 500 €.
These reduced rates only apply if the following conditions are met:
The company’s taxable profit does not exceed 322 500 €.
The company is not a “financial institution”.
The shares are not held for 50% or more by one or more other companies.
The company should not distribute dividends for an amount exceeding 13% of the
issued share capital of the income year.
The company pays a salary of at least 36 000 € to at least one manager of its
mangers (income year 2008).
The company is not part of a group which owns a co-ordination centre.
BRUSSELS BUSINESS WELCOME PACKAGE
Contact: Brussels Invest & Export
Fact-finding missions usually take time and money but they are the best way to select a
new location for a company. Brussels Invest & Export allows companies that are
considering Brussels as a possible new location to evaluate all the assets of the Region.
This service is provided free for a three month trial period.
The Welcome Package includes:
Free use of office:
o Fully furnished office space
o 1 to 3 work stations
o Reception services (English, French and Dutch)
o Internet, phone & fax services
o Conference room
Assistance in:
o Legal & tax matters
o Company registration
o Contacts with local authorities
o Searching for a suitable location
o Finding public incentives
o Recruiting staff
o Market information.
And more:
o Preferential rate at a 4-star hotel located five minutes from the office
o Public transport card.
CH.6:- POLICIES AND NORMS OF INDIA FOR IMPORT –EXPORT TO
THE SELECTED COUNTRY & LICENSING, PERMISSION, TAXATION
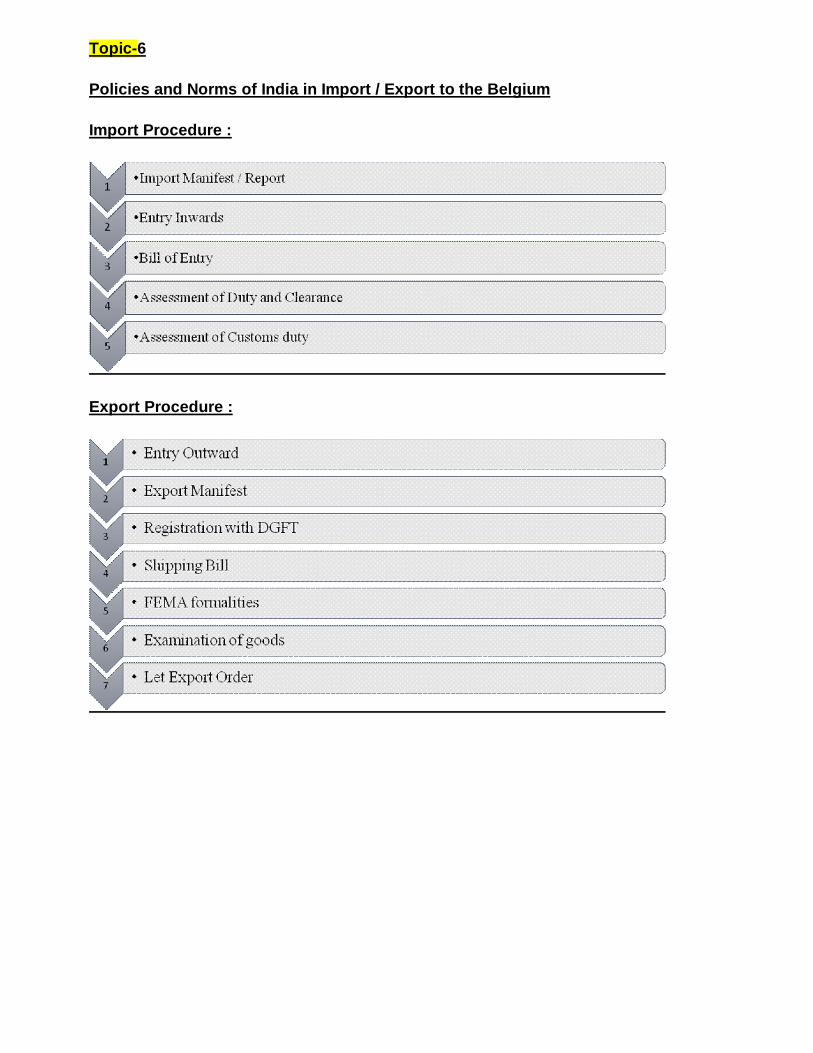
Import Policy
The economic needs of the country, effective use of foreign exchange and industrial as
well as consumer requirements are the basic factors which influence India's import policy.
On the import side the policy has three objectives: to make necessary imported goods
more easily available, including essential capital goods for modernizing and upgrading
technology; to simplify and streamline procedures for import licensing; to promote
efficient import substitution and self-reliance.
There are only 4 prohibited goods: tallow fat, animal rennet, wild animals and
unprocessed ivory. There is a restricted list, but most of the restrictions are on grounds of
security, health and environmental protection or because the goods are reserved for
production by small and tiny enterprises, which are home-based or village-based and
which require low skills and employ a large number of people. But the policy of restricting
import of consumer goods is changing.
The Indian government's clearly laid down policy is to achieve, through a series of
progressive steps, the average tariff levels prevalent in the ASEAN region. The basic
customs tariff rate now ranges from 0 to 40% plus additional duty of 2%; the average rate
is about 30%.
Imports are allowed free of duty for export production under a duty exemption scheme.
Input-output norms have been specified for more than 4200 items. These norms specify
the amount of duty-free import of inputs allowed for specified products to be exported.
There are no quantitative restrictions on imports of capital goods and intermediates.
Import of second-hand capital goods is permitted provided they have a minimum residual
life of 5 years. There is an Export Promotion Capital Goods (EPCG) Scheme under which
exporters are allowed to import capital goods (including computer systems) at
concessionary customs duty, subject to fulfillment of specified export obligations. Service
industries enjoy the facility of zero import duty under the EPCG Scheme. Likewise,
hospitals, air cargo, hotels and other tourism-related industries. Software units can use
data communication network to export their products.
Export Policy
Exports are the major focus of India's trade policy and a thrust area is exports involving
higher value additions. Most items can be freely exported from India. A few items are
subject to export control in order to avoid shortages in the domestic market, to conserve
national resources and to protect the environment.
Export profits are exempt from income tax. Higher royalty payments of 8% (net of taxes)
are permitted on export sales as compared to 5% on domestic sales. Export
commissions up to 10% are also permissible.
Inputs required to be imported for export production are exempted from the basic
customs duty. Export Oriented Units (EOUs) and Export Processing Zones (EPZs) enjoy
special incentives such as duty free import of capital goods and raw materials for the
purpose of export production.
A Brand Equity Fund has been set up to popularize high quality India brands in the world
market. The corpus of the fund of Rs 5 billion (US $156 million) will receive equal
contributions from the government and industry.
Taxation
An entrepreneur willing to expand his/her business abroad must abide by the tax laws of
the home country as well as of the particular foreign country and accordingly pay the
required taxes. Taxes (or duties) are defined as the financial charges levied by the
Government upon an individual or an organisation or property in return for the
government services received by them. These taxes may be broadly classified into direct
and indirect taxes. Direct taxes are those where the tax payer pays the taxes directly to
the imposing authority like income tax and corporate tax. Whereas, indirect taxes are
those which are not paid directly to the imposing authority but paid to someone else who
acts as an intermediary link between the tax payer and the tax levying authority like
customs duty and service tax. In India, the power to levy taxes and duties is distributed
among the three tiers of Government, in accordance with the provisions of the
Constitution.
The most important tax which an entrepreneur is subjected to is the 'customs duty' which
is a type of indirect tax levied on goods imported into India as well as on goods exported
from India. In India, the basic law for levy and collection of customs duty is Customs Act,
1962.
It provides for levy and collection of duty on imports and exports, import/export
procedures, prohibitions on importation and exportation of goods, penalties, offences,
etc. The Central Board of Excise & Customs (CBEC) is the apex body for customs
matters. It is a part of the Department of Revenue under the Ministry of Finance,
Government of India.
But due to different tax laws and rules prevailing in different countries, a businessmen
faces the problem of 'double taxation'. Double taxation refers to a situation where the
same income becomes taxable in the hands of the same company or individual (tax-
payer) in more than one country. This puts unnecessary and prohibitive burden on the
tax-payer. In India, the liability under the Income tax Act arises on the basis of the
residential status of the assessee during the previous year. Hence, if the assessee is
resident in India, he/she has to pay tax not only on the income which is received in India
but also on that income which accrues, arises outside India or received outside India.
Thus he becomes liable to pay double taxes. The relief against such double taxation in
India has been provided through, bilateral relief and unilateral relief.
CH.7:- PRESENT TRADE BARRIERS FOR IMPORT/ EXPORT
There are three very general barriers to international trade that can take a variety of
forms. Normally, "trade barrier" is equivalent to "tariff," yet, non-tariff barriers can be used
as a way to avoid treaties and agreements that limit or eliminate taxes on imports. Non-
tariff barrier are effective as indirect tariffs.Government usually uses to protect domestic
industries from competition by making foreign goods more expensive.Indian customs
duties are 5-40%, depending on the method of entry (land, air or sea) and product type
.There are 3 main trade barriers are:
Tariffs
Tariffs are the most common trade barrier. A tariff is simply a tax on foreign imports,
making them more expensive. The purpose of the tariff is to assist domestic industry
against foreign competition. If domestic industry is just getting off the ground, it might be
destructive to the economy to permit these infant industries to compete with well-
developed foreign firms. Therefore, a constructive tariff is one that protects a new,
domestic industry, permitting it to develop to the level of their foreign competitors.
Non-Tariff Barriers
Some countries use an array of nontariff barriers to control trade. These three often
comprise standards, technical regulations and conformity procedures. Standards are the
basic rules of a country concerning what quality of products are permitted to be imported.
Technical regulations comprise the basic bureaucratic paperwork necessary to inspect
and pass products, while conformity procedures are the measures taken by the importer
to make sure the products being imported measure up to local standards. All of these
delay imports and make trading less convenient and more expensive.
Natural Barriers
Natural barriers refer to the difficulties of transporting. American trade with Canada is
easier than trade with Japan simply because the distances are much shorter. Language
and culture might also be considered another "natural barrier" of a sort. Mountains,
deserts and marshes have traditionally also been barriers to trade, but modern
technology has largely obviated many of these.
Although India has steadily opened up its economy, its tariffs continue to be high when
compared with other countries, and its investment norms are still restrictive. This leads
some to see India as a ‘rapid globalizer’ while others still see it as a ‘highly protectionist’
economy.
Till the early 1990s, India was a closed economy: average tariffs exceeded 200 per
cent, quantitative restrictions on imports were extensive, and there were stringent
restrictions on foreign investment. The country began to cautiously reform in the 1990s,
liberalizing only under conditions of extreme necessity.
The country is among the few in the world that continue to ban foreign investment in retail
trade. Although this policy has been somewhat relaxed recently, it remains considerably
restrictive.
India is now aggressively pushing for a more liberal global trade regime, especially in
services. It has assumed a leadership role among developing nations in global trade
negotiations.India is actively pursuing bilateral/regional Free Trade Agreements. While
Free Trade Agreements would certainly imply a reduction in tariffs, the gains from such
trade would be limited in the presence of non-tariff barriers.
CH.8:- POTENTIAL FOR IMPORT/ EXPORT IN INDIAN MARKET
Glass is one of the most useful materials in our daily lives.There is a special relationship
between glass and buildings. Glass is a magical material which has so many different
properties and uses, that it has presented many new possibilities and designs. The types
of glass presently manufactured in India are float glass and sheet glass.
The glass industry in India is worth around Rs 5,500 crore, which has which has shown
good growth in the past few quarters driven by an uptick in demand from user-industries
such as infrastructure, construction, automobiles, food processing, beverages,
pharmaceuticals and cosmetics, among others.The glass industry is diversifying into
interior decoration, furniture, murals and other value additions to keep the show going.
The growth of the industry is dependent on construction and architecture activities.
However, the automobile sector is still a big user of flat glass. The construction sector is
the largest consumer of float glass. Around 60 % of the total production is used by the
construction sector. The glass sector has been growing at 10-12 per cent a year over the
past five years. Real estate is the biggest consumer of flat glass for windows, doors,
partitions and a host of other applications.
Global demand for flat glass will rise 5.5 percent annually through 2012, spurred by a
healthy building construction environment and rapid growth in newer flat glass
technologies. India’s Imports at a Glance
The nation of India is the seventh largest in the world in land mass, number ten in the
world for the size of their economy by GDP, and the fourth largest international economy
in purchasing power parity. India has the second largest labour force in the world and
abundant natural resources. India’s economy has grown by about 7.5% yearly since
2000, and that rate is predicted to increase. It is also the fifteenth largest nation in imports
and the eighteenth largest in exports worldwide in 2009. This means that India imports
and exports are a huge potential market.
More than 78% of India imports into other countries are manufactured goods, such as
clothing, textiles and jewellery and have low entry duties into most other countries, such
as the US, due to trade agreements. However, a smaller importer might do better to tap
into the small but vital markets for unique Indian products such as spices, certain textiles,
teas, carpets, and handicrafts. There is even a substantial demand for “Bollywood” films,
Indian music, and food products, as the Indian emigrant populations in other countries
increase.
The glass and glazing industry for architectural application in India for the year 200 was
estimated at a minimum of Rs 100 crores. Of this, the glass component would be about
1.2 million square meters. Indian and imported ACP would come to about 1 million
square meters and another 700,000 square meters would constitute residential windows.
In geographical terms, the South Indian region dominated by Bangalore, Chennai,
Hyderabad and parts of Kerala, contributes to 30 percent of the glass consumption. West
India follows with 29 percent. Here Mumbai, Pune and parts of Gujarat are big
consumers. The North Indian market, comprising mainly of Delhi and the National Capital
Region accounts for 20 percent of the total architectural glass and glazing market. East
India currently contributes only 7 percent of the consumption. However, with a renewed
focus on real estate in West Bengal, this is set to change and this regional market is
growing very fast.
The growth of the Indian glazing market is impressive. While it was a Rs 100 crores
market in the year 2000, it is estimated to touch Rs 1000 crores by 2005. Even so, this is
a very small market size compared to other evolving market for the glass industry.India is
at an early stage in terms of market maturity at present, but glass demand is growing
steadily. Aggressive and organized efforts on the part of manufacturers and processors
are expected to achieve higher levels of awareness among glass specifies and users.
In the next five years, the Indian architectural glass market will move to higher maturity
levels. However, policy and regulations including the lack of standards and glass codes
for India are a source of anxiety for manufacturers and processors alike. The industry
also needs increased exposure. Followed the opening up of FDI for the real estate
sector, here appears to be more chance of foreign investors coming in and a greater
demand for international standards in construction.
This, and the ever-growing popularity of glass as a material, will ensure growth. Further,
constant technical innovations by manufacturers are keeping customers constantly
interested in glass and glass products.With stability on the cost side and good outlook on
the demand side, the glass segment has good prospects. Robust growth in automobiles,
infrastructure, liquor & other beverages, boom in building and construction will see the
glass industry at its best in the coming years.
Export Potential of India
Exports have played an increasingly important role in India’s economic growth in the last
two decades. This paper analyses the performance of India’s exports and the various
economic factors which have contributed to its growth. Since manufactured exports
comprise a significant share of India’s aggregate (merchandise) exports, the paper also
provides an overview of the export performance of three important commodities; namely,
gems and jewellery, cotton and electronic goods and concludes with key policy changes
which could have a bearing on the current trends seen in these sectors.
India’s aversion to international trade and reliance on domestic factors to fuel growth
during the fifties meant that exports played a smaller role and this is evident from the
following table, where India’s exports lost its world market share between 1951-1960 and
1961-70.6
Till the mid-seventies, India’s policy was restrictive and focused on developing the
domestic industry, while tightening control on foreign trade (using quantitative restrictions
as a tool). High levels of protection coupled with an overvalued domestic currency
resulted in a growing demand for imports and discouraged exports. Moreover, India’s
exports also suffered because export incentives were only available to a limited number
of manufacturing industries and selected agricultural exports (which were subjected to
export duties at varying rates). The Indian economy has gained considerable momentum
over the last one decade, by achieving and sustaining an annual GDP growth rate of over
7 percent. This high growth rate can be in part attributed to the growing contribution of
the export sector to the economy.
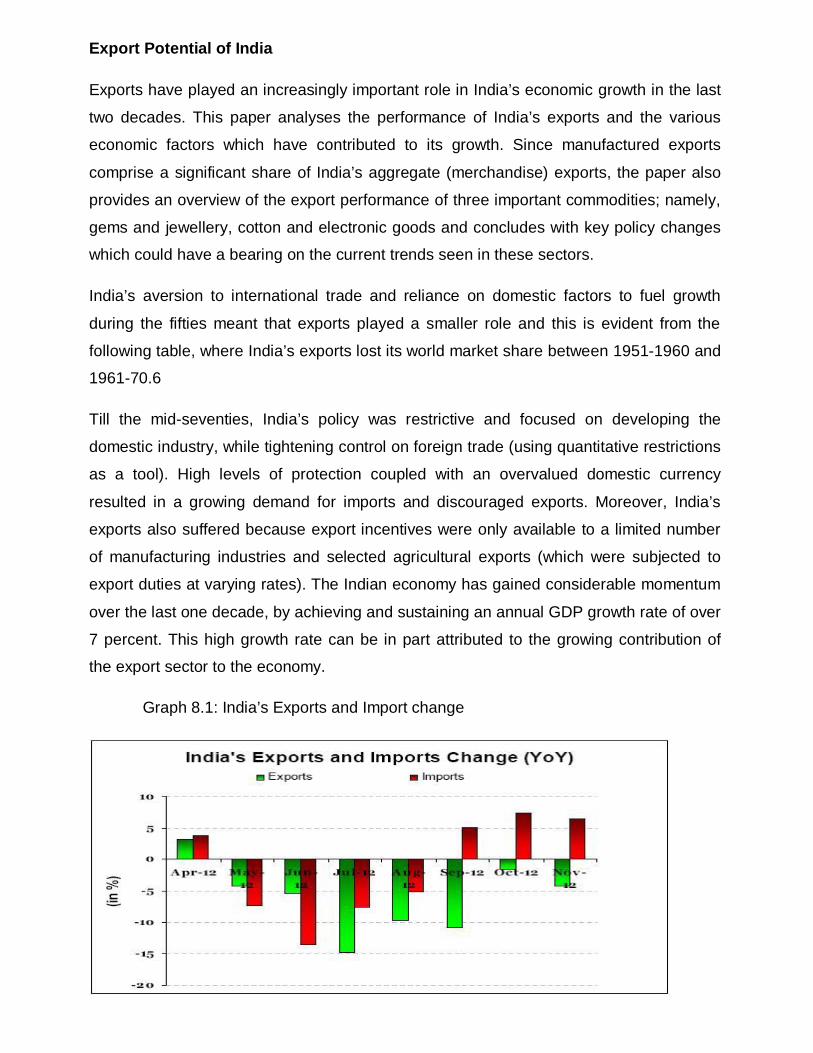
Graph 8.1: India’s Exports and Import change
In recent years, the Indian government has acknowledged the severity of this issue and
taken an important policy initiative in 2011 by approving the New Manufacturing Policy.
This policy is aimed at building the capacity of the sector, strengthening its contribution to
the GDP (from 16 percent to 25 percent) as well as improving the international
competitiveness of the manufacturing sector. The initial industry reactions to the NMP
has been positive and it is expected that a proper execution of the NMP will be beneficial
for the Indian economy as it can generate large-scale employment for nearly a hundred
million workers in the next ten years. The implementation of the policy will involve the
establishment of a number of National Manufacturing Investment Zones (NMIZ) which will
have features such as a progressive exit policy, strong physical infrastructure, investment
incentives and business-friendly approval mechanisms to support the production in these
units. Though the implementation of the NMP may take time, this policy is expected to
provide a strong impetus to India’s manufactured exports in the near future.
CH.9:- BUSINESS OPPURTUNITIES IN FUTURE
Social security agreement between India and Belgium
Deputy Prime Minister And Finance Minister And Minister Of Overseas Indian Affairs
signed an agreement On 1 September 2009, the long
anticipated Social Security Agreement between the Kingdom of Belgium and the Republic of India (the “SSA”) entered into force. The SSA was signed in New Delhi on
3 November 2006 and is considered as a landmark agreement as it was the first treaty of
its kind to be signed by the Indian authorities.
It goes without saying that this SSA will greatly affect Indian companies who are actively
engaged in business in Belgium or who aspire to do so. Moreover, the SSA will
affect Indian individuals who are working or who envisage working in Belgium
(and Belgian individuals working or planning to work in India), with regard to some of
their social security benefit rights.
The SSA covers the main social security insurance schemes in both countries, which are:
(1) The old-age and widows’ pension for employees and the self-employed;
(2) The Belgian invalidity insurance and the Indian Total Disability benefit; and
(3)The social security regulations for employees
The SSA applies to all individuals who are, or were, subject to
the social security legislation of Belgium or India and hence both the countries are
involved.
This means the SSA’s scope extends to third-country nationals who are, or were, subject
to Indian or Belgian social security legislation, as well as to Indian and Belgian citizens,
all of whom can rely on the rights granted under the SSA.
Due to the SSA, social security benefits will no longer be restricted by the claimant’s
place of residence, i.e. social security benefits will be paid to Indian nationals living
in Belgium and to the Belgian nationals living or residing in India.
For example, Indian nationals who have paid or who will be paying
Belgian social security contributions will receive a Belgian old-age pension upon their
retirement, also even if they have returned back to their home town to India.
An Indian national seconded by his employer to Belgium can live and work
in Belgium without paying Belgian social security contributions (but still
paying Indian social security contributions) for up to five years, or more.
Notwithstanding the provisions on second amendment set out in the SSA an Indian
employer can nevertheless opt to apply the general rule instead, hence subjecting his
employee to the social security scheme of Belgium, and vice versa.
This bilateral SSA led to the Indian government introducing the concept of international
workers into its social security scheme, which in turn led to an increase of contributions
for international workers to approximately 12% of basic pay for both
employees and employers.
DOUBLE TAXATION AVOIDANCE AGREEMENT
Agreement between The Government of the Republic of India And The Government Of
The Kingdom Of Belgium for the avoidance of double taxation and the prevention of fiscal
evasion with respect to taxes on income
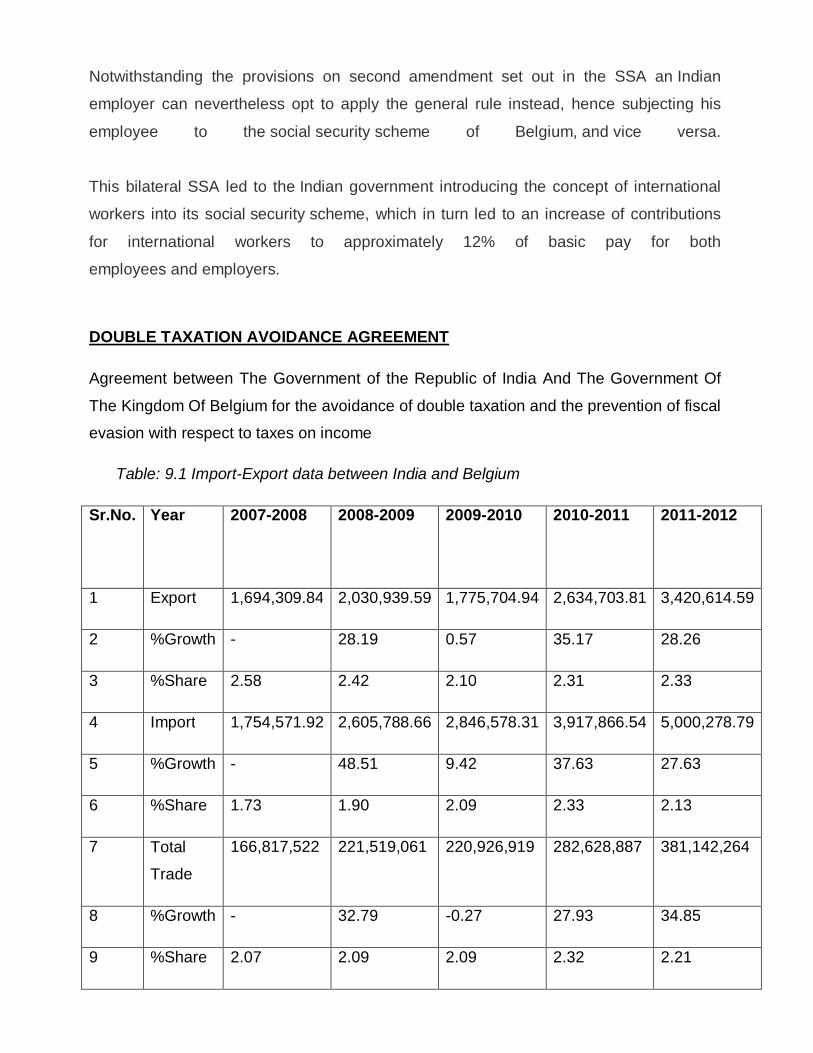
Table: 9.1 Import-Export data between India and Belgium
Sr.No. Year 2007-2008 2008-2009 2009-2010 2010-2011 2011-2012
Source: Export-Import Databank, Ministry of Commerce
From above table, it is evident that India’s exports have multiplied in the past five years,
while the share of imports is equally remarkable.
Clearly, the two nations complement each other in a number of areas. Trade meetings
and delegation level talks could do more to promote better trade, and government to
government contact would reassure the business community of both countries.
For the future, the glass industry will need to be able to provide superior products with
unique properties that are more desirable than the products made from other materials
and developing countries.
This will require the development of new process technologies that reduce production
costs and enhance desirable characteristics. Innovations in glass composition and glass
properties will be necessary to support the expansion of glass into completely new
markets.
The area where the industry has to focus its techno logical efforts are the following:
Production Efficiency: development of melting, refining and forming processes with higher product yield and reduction of energy and other production costs.
Campaigns for
1) increasing the life of a furnace;
2) Energy Efficiency: development of more energy-efficient manufacturing
processes and technologies to achieve significant energy saving;
3) Environmental Performance: reduction of emissions and waste in the glass
industry through more stream-lined, cleaner processing.
4) Increased use of natural resources and solid waste reduction.
5) Increased recycling within the industry;
6) Innovative Uses of Glass: Broadening the use of glass in existing markets and
supporting research to create completely new and innovative uses for glass by
investigating new glass compositions,
7) Developing a better understanding of glass properties and interactions, and
modifying and improving essential glassmaking processes.
The industry has to be able to respond to rapidly changing market needs with sufficient
volumes.
In many markets, customers’ demand for lighter, stronger glass products is increasing
rapidly.
In Europe, there are different public and private research centers specialized in glass
that can support the glass industry as it faces these challenges. The most important
centers are the following: SSV (Stazione Sperimentale del Vetro, Italy), TNO (the
Netherlands), CRITT (France), IKATES (Czech Republic), INSTITUT DU VERRE
(France), GLAFO (Sweden), BRITISH GLASS/GLASS TECHNOLOGY SERVICES (UK),
ISTITUTO DE CERAMICA Y VIDRIO (Spain), HVG (Germany).
For the future, a stronger connection between these main players will be crucial in order
to support the whole European glass industry on a global market and to act for the
common good of the sector.
CH.10:- CONCLUSION AND RECOMMENDATIONS
In the 19th century Belgium was the largest exporter of glass in the world and one of the
main producers of polished glass.
Belgium produces 12.3% of Glass of total production of EU and about 4% of worlds
Glass production.
Also Belgium Produces 84% of World’s Recycled Glass.
The international crisis of the last six to ten months is also affecting the glass industry.
Some sectors are suffering more (tableware, flat glass and fibre glass) than others
(container glass).
As packaging, glass containers assure the preservation, safe delivery and attractive
presentation of a vast array of consumer products, supplied to European and world
markets. Whether used for drinks, food, cosmetics, perfumes or pharmaceuticals, glass
plays a vital role in supporting European trade and commerce. Glass is 100 percent
recyclable, virtually inert and preserves the original taste of the products it contains.
Baby food products– like milk – need the protection of its container to preserve its
purity and its vitamins. Because health is not only in the ingredients but also in the
packaging that preserves these ingredients.
Despite encouraging results, the impact of the long-winded financial crisis on the glass
industry continues to weigh heavily on the competitiveness of the EU industry. Increasing
energy prices, unilateral CO2 costs, fluctuating and unfavorable exchange rates, and
high labour costs hamper the cost competitiveness at global level of the container glass
sector. Combined, these challenges delay long-term investment decisions and rather
become incentives for delocalization of production sites and R&D investments outside
EU to more industry friendly environment with lower costs.
However, considering the trend of the last year, it is possible to identify some general
trends: the growth of the glass industry is slowing down and sometimes, in specific
sectors, there is stagnation or even decline.
This problem is mainly due to international competition, especially from the Far East
(China, India) the increase in production costs within the EU (labour costs, energy, raw
materials, etc.) and the legislative burden, particularly in terms of environmental
protection (IPPC, ETS, REACH, etc.);
Relocation of the industry is becoming more and more evident.
The number of plants in Europe is decreasing and it is very rare to see the construction of
new plants; the import of glass articles is on the rise, especially for flat glass and
container glass.
Countries such as China, India, and North Africa are now more competitive on the
market, with low prices and product quality which sometimes is as good as that of the
European or western countries.
For the future, the glass industry will have to be able to provide superior products with
unique properties that are more desirable than those made with competing materials and
by developing countries.
This will also require the development of new process technologies that reduce
production costs and polluting emissions and enhance the characteristics desired by the
customer. Innovations in glass composition and glass properties will be necessary to
support the expansion of glass into completely new markets.
ANALYSIS
OF
PAPER & PACKAGING INDUSTRY
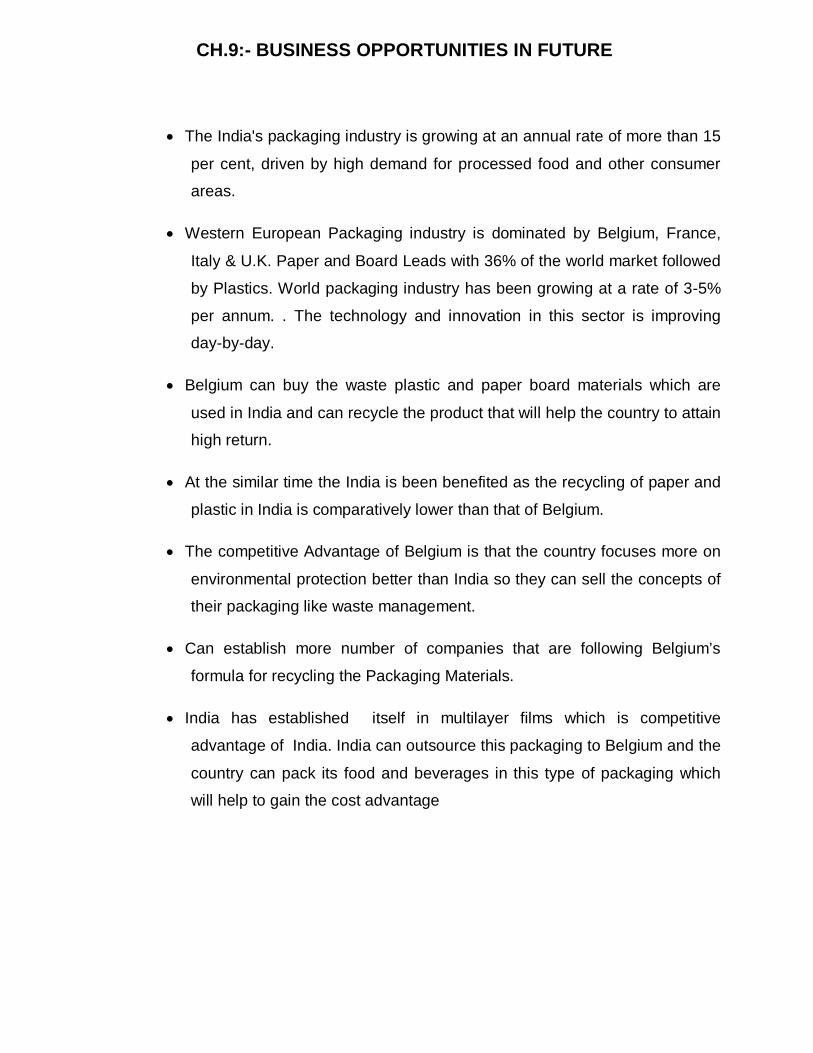
CH.1:- INTRODUCTION OF PACKAGING INDUSTRY AND ITS ROLE IN
BELGIUM
PACKAGING INDUSTRY GLOBALLY
Packaging is vital for the safeguarding and movement of retail, institutional and
manufacturing goods. With dynamic lifestyles and increased consumerism, packaging
has gained superior importance. It performs 4 basic functions: safety, restraint, spreading
of information and utility of product. Packaging Industry is a important sector, adds value
to the various mechanized sectors including agriculture and FMCG segments Size of
packaging Industry Globally (est.): $ 600Bn. (excluding Machinery). US packaging market
accounts for 24 percent. Western European Packaging industry is influenced by Belgium,
France, Italy & U.K. Paper and Board Leads with 36% of the world market followed by
Polymer.
World packaging industry has been mounting at a rate of 3-5 percent per annum.
The technology and innovation in this sector is humanizing gradually. The global
packaging industry is currently valued at $433 billion and is expected to further go up to
US $820 billion by 2016.
INTRODUCTION
With the exception of radioactive waste, in Belgium waste policies are exclusive
competencies of the three Belgian regions since 1994. It was during this year that country
was constituted as a federal state compiled by communities (The Flemish, French and
German communities) and regions (Flanders, Wallonia and Brussels-Capital).
Before the European Union (EU) Directive 94/62/EC on packaging waste (PPW) the
Belgian government had already put into action of fiscal instruments to encourage to the
eco-design of products. The PPW Directive was transposed into Belgian legislation
through an Agreement established in 30th June 1997 among the 3 regions. It is called the
Interregional Cooperation Agreement. This agreement introduced the “shared
responsibility of Producer” principle in Belgium. Order to comply with the ambitious
targets of recycling and recovery, it imposed “take-back” obligations to all economic
operators who place packaging and packaged products on the national market.
The packaging industry in increasingly becoming technology-oriented with
innovations driving the market; this is expected to lead to packaging that increases shelf
life, reduces cost and is light weight.
Market Overview
The worldwide market for packaging materials is highly competitive, composed of
mostly large and medium-sized companied. Potential industry modernization is likely to
come from overall renovation and consolidation. A growing move away from immensity
formats in the food industry in favor of single-supply products also calls for more
packaging. Packaging for medical and pharmaceutical products will also spur growth in
the packaging industry.
The Current state
The growth is primarily driven by factors like growing urbanization, investment in
housing and construction, a burgeoning healthcare sector and quick development in the
emerging economies like Brazil, Russia, India, China and few other East European
Economies. The consumer market influences the global packaging industry and accounts
for an estimated 65 % of the sales, while trade submission accounting for rest 35 %
CH.2:- FUNCTION/STRUCTURE OF PACKAGING INDUSTRY
FUNCTIONS OF PACKAGING INDUSTRY
Following are the functions:
Protection Convenience
Promotion Unitization
Information Handling
Waste reduction and recycling and reuse of by-products
ROLE OF PACKAGING SECTOR
Packaging is not an end product but a mode of transport and protection for the product.
The aim of the packaging sector is to make the transport cost to minimum to remote their
goods with minimal damage. As per the UK based packaging federation there has been
fall in mass of bottles and steel at 50%.
Packaging is not only confined to protection and transportation of the product it also
plays a role in attracting customers through aesthetic attractive display. Packaging also
fills the function of labeling and branding products.
LIFE CYCLE OF PACKAGING
CH.3:- COMPARATIVE STUDY POSITION OF PACKAGING WITH INDIA
TOP POLYMER PACKAGING COMPANIES IN INDIA
1. Excel Polymers, Mumbai
Annual Turnover: 600 cr INR
Activities:
Excel Polymers is a emerging global supplier of performance elastomer solutions,
offering a wide portfolio of compounded polymer materials, performance additives and
technical know-how, mainly sold to rubber parts manufacturers.
2. Supreme Industries
Annual Turnover: 450 Cr INR
Activities:
Supreme Industries Limited is india's leading plastic processing company with seven
business divisions. The company has forayed into different types of plastic processing in
Accordingly, specific policy initiative for these sectors has been announced.
For the gems and jewellery sector:-
Permission for duty free import of consumables for metals other than gold
and platinum up to 2 per cent of Free On Board (f.o.b) value of exports;
Duty free re-import entitlement for rejected jewellery allowed up to 2 per
cent of f.o.b value of exports;
Increase in duty free import of commercial samples of jewellery to Rs. 1
lakh; and Permission to import of gold of 18 carat and above under the
replenishment scheme.
Gem and Jewellery Export Promotion Council (GJEPC)
The Gem and Jewellery Export Promotion Council is a representative body of trade. The
following initiatives have been taken by the council in order to enhance competitiveness
such as:
Preparation of a medium term exports strategy for various sectors including gems
and jewellery by the Ministry of Commerce.
Exploring the possibility of direct procurement of rough diamonds from mining
countries.
Promotion of Indian diamonds and jewellery abroad through advertisements,
publicity and participation in international fairs, buyer-seller meets and direct
approach to market retailers.
Market study through experts in the field to identify new markets.
Promotion of export of 'hallmark' jewellery from India to assure foreign customers of
quality and purity of jewellery made in India.
CH.8:- POTENTIAL FOR IMPORT-EXPORT IN INDIA/GUJARAT
MARKET
Traditionally the focus of the gems and jewellery manufacturers has been on the large
global markets. Indeed for years, these international markets have given large and
growing business to Indian exporters and have contributed in creation of significant jobs
in the country. The Indian players, duly supported by the Government of India are placed
highly competitively in the market.
During the last few years, the Indian domestic market has shown very promising signs,
evident from the stupendous growth and increase in penetration of the brands and
organized retail across the categories namely FMCG, Durables, Apparels, and Home
Improvement etc.
MARKET STRUCTURE AND POTENTIAL
Gems &Jewellery exports are the back-bone of the sector and also of our overall exports.
The current slowdown had hit the sector badly and in 2008 some months showed
negative growth.
However the sector is expected to grow at a CAGR of 15% to reach a size of US $ 58
billion by 2015 from the current US $ 25 billion. The government has taken significant
steps for the Gems &Jewellery exports in terms of duties and taxes, infrastructure (SEZ,
EPZ’s etc) and policy (EXIM Policy for 2002-07) but this is not the time to get complacent
for the government or the industry as the recent global economic crisis has shown. We
need to keep working at making the sector more resilient and competitive especially in
the wake of rising competition from countries such as China.
The domestic market of gems and jewellery is estimated to be in the US $ 18-20 billion
range and is expected to grow by about 13% per annum to reach US $ 35-40 billion by
2015. Given the fragmented nature of the business it is very difficult to estimate the exact
range. With per capita consumption almost 1/10th that of any matured market India
presents a very large potential market. If some of the recommendations suggested by us
in this report are acted upon appropriately, the industry market size could potentially
reach to US$27- 35 billion. More importantly there is a significant opportunity to create
additional value through higher margins possible through differentiation and branding.
Currently however the market is fragmented across the value chain. There are more than
300,000 Gems &Jewellery players are there in the country.Modern retail players have
only 4%-6% share, which is perhaps one of the lowest when compared to Apparel (20%),
Footwear (35%), Books and Music (11%) and CDIT (7%). The industry has also lagged
behind relatively to attract the capital; professionals and process/technology know-how to
scale up the operations and take the industry into a different orbit. The good part is that
India is now beginning to move towards branded jewellery and the consumers have
accepted the modern retail formats.
CH.9:- BUSINESS OPPORTUNITY IN FUTURE
Indian hand-made jewellery has a large ethnic demand in various countries with
sizeable Indian immigrant population such as the Middle East, South-East Asian
countries, USA, Canada, Belgium and so on.
In jewellery, exports are only 1-2% of the total world market; hence there is good scope
for jewellery exports. Evidently, the exports have increased to US $ 1,087 million in 1999
- 2000, registering a growth of 24% over the previous year. For ensuring the growth,
Indian industry will have to gear up for developing quality that suits the western states in
design, polish and finish of the jewellery.
India opportunities
The future growth of Indian jewelry industry lies in finding new markets and in adding
value. Worldwide, jewelry is a big business, which is extremely lucrative as margins are
high compared to diamonds, as branding can demand high premiums.
India was a late entrant to the global jewelry market and its industry took off after
establishment of the export processing zones in 1990, especially the special economic
zone in Mumbai that accounts for 40 % of India's exports
Opportunities for Gujarat therefore, include:
Manufacturing and marketing gold jewellery and diamond studded Jewellery Manufacturing and marketing of branded jewellery through franchisee outlets Setting up a training institute for Jewellery manufacturing.
Gujarat Economic Snapshot
Gross Sate Domestic Product USD 45.3 Billion
Industrial Growth Rate 12.9% (2008 – 2012)
Exports 19.2 % of India
Inflation 10.3% apox
Per Capita Income USD 722
Urbanization 37.36%
Gujarat has exhibited a 12.9% high industrial growth rate from 2008 to 2012. In India’s
11th Five Year Plan and has achieved a GDP growth of 10.2% as per the set target,
which was the highest amongst all States in India.
Gujarat in diamonds industry
Investment in Gujarat; a world class Business destination
Gujarat accounts for almost 80 % of the diamonds processed in India. Of this, 90 % are
processed by about 10,000 diamond units located in and around Surat alone. Rest of the
diamond units are located in Ahmedabad, Palanpur, Bhavnagar, Valsad and Navsari.
The advantages of investing in diamond processing in Gujarat are:
1. Low cost, economic and skilled labor 2. Availability of large number of skilled labor 3. Easy availability of institutional and Bank finance 4. Relaxed government rules and regulations
5. Other competitive world centers like Hongkong, Thailand, Taiwan, Korea, U.S.A.,
Italy, etc. are becoming costlier with decreasing availability of skilled labor.
CH.10:- CONCLUSION, SUGGESTION
In the gems and Jewellery industry in India and Belgium, what I have observed is in the
form of certain initiatives by the entrepreneurs in various domains of operations to
strengthen their competitiveness in domestic as well as the global market. India is largest
consumer of gold – jewellery and 2nd largest producer of gold – jewellery in the world.
India’s gems and jewellery export are expected to growth at 15-20 % in coming year. Import
and exports regulations are friendly for registered diamond dealers and foreign countries.
KP certificate is considered must if you want to have trade in rough diamonds and gems
with Belgium (and all EU countries).
Previously, trade policy was based on the objectives of self-reliance and self-sufficiency.
Now a day it’s driven by factors like export led growth, improving efficiency and
competitiveness of the Indian industries. Duty free import of consumables for metals other
than gold and platinum up to 2% of Free On Board (F.O.B) value of exports and re-import
entitlement for rejected jewellery as well. There is increase in duty free import of commercial
samples of jewellery to Rs. 1 lakh. 18 carat and above import gold is permitted. Personal
carriage of gold up to 10 kg is allowed.
The importance and attraction of the Industry can be judged by the fact that over 1
million people are employed in the industry and it is still growing at the rate of approximately
15 % every year. The biggest advantage that Indian Jewellery has is its low cost. Exports
are only 1-2% of the total world market; hence there is good scope for jewellery exports. Gujarat accounts for almost 80 % of the diamonds processed in India.
ANALYSIS OF PHARMACEUTICAL
INDUSTRY
CH.1:- OVERVIEW, BUSINESS ACTIVITIES AND STRUCTURE OF THE PHARMACEUTICAL SECTOR
The Pharmaceutical Value Chain is separated into two specific phases: Research &
Development and
Supply Chain, with each phase consisting of four sub-activities:
According to Deutsche Bank, the globalmarket for pharmaceutical products is ~$800mm.
The industry has recorded 10% of annual sales growth in the last 30 years, and
underlying volume growth has remained strong . Mix of pharma business activities: scale & scope Large Scale
Pfizer Manufacturing N.V.:
1. 2nd largest production site of Pfizer worldwide (Pfizer’sbiggest site in Europe)
2. 200 million units of sterile therapeutics, are produced and packaged ever year
3. Over 1,400 workforce in Puurs, Flanders
4. Production distributed to 170 countries worldwide
Start-Up
Movetis:
1. Movetis was founded in November 2006 as a spin-off from Johnson & Johnson
2. Movetis NV focuses on the finding, improvement, and commercialization of drugs
for the treatment of diseases in the gastrointestinal (GI) area
3. Went public in 2009 with an IPO of €98mm on revenues of €1.2mm
4. Moventis has 35 employees and its headquarter in Turnhout, Belgium
Production
Federa S.A
1. Independent contract manufacturer that covers pre-formulation to commercial
manufacturing
2. Specialized in manufacturing, filling and packaging of injectables in syringes,
ampoules
Operates as a subsidiary of Catalent Pharma Solutions which is headquartered in
Somerset, NJ.
1)Pfizer Leadership and Structure
Pfizer's Executive Leadership Team is the company's senior-most leadership and
decision-making management body. It brings jointly our top leaders to spotlight on major
financial, strategic and equipped decisions for the company.
Universal Research and Development at Pfizer combines research and technology units
that have deep disease area expertise and cutting-edge science and platforms with an
efficient R&D operating model, to discover and develop innovative therapeutic programs
in small molecules and biotherapeutics, including vaccines.
We manage our operations through five operating segments - Primary Care; Specialty
Care and Oncology; Established Products and Emerging Markets; Animal Health; and
customer Healthcare. Each of these segments is led by an executive with clear
accountability for results - from product development following proof of concept to
providing access to patients and through to the end of the product's life cycle. These
segments are provided with the assets to pursue attractive growth opportunities and to
deliver benefits to all who rely on us around the world
Biopharmaceutical R&D Organization
. We continue to build the world's premier biopharmaceutical R&D organization.
Our aspirations are to carry unmatched innovation, the best inside and outside
science, and business leading productivity within a lively, diverse culture.
Pfizer now has broader and deeper syndrome area knowledge in our Research
Units, increased modality and technology capabilities in our Biotechnology Units,
and an approach that harnesses our strengths to find the newest, most innovative
and valuable medical solutions.
Company Background
Jubilant Organosys Ltd., headquartered at Noida, near New Delhi in India, was set
up as Vam Organic Chemicals Ltd. in 1978. Jubilant Organosys is a part of the
group, Jubilant Corporation, which operates in four business areas – life science
products and specialty chemicals, oil and gas (exploration and production), food,
and services. As the company made its transition from a bulk and specialty
chemicals company to an integrated pharmaceutical company, it changed its
corporate identity by renaming itself as Jubilant Organosys in 2001, to reflect the
company’s changed business profile.
Jubilant Organosys is one of India’s largest Custom Research and Manufacturing
Services (CRAMS) companies.The company is a drug discovery and development
services provider along with being a leading active pharmaceutical ingredients
(API) company in India. It operates in three business lines – pharmaceuticals and
life science products, Industrial products, and recital polymers.
The company’s product offerings include APIs, such as ‘carbamazepine’,
‘oxcarbazepine’ and ‘citalopram’, ‘pyridine’ and its derivatives, a range of fine
An Import License is required to be provided when the goods are presented for import
clearance. the designated agency the European Union licenses, national licenses, and
surveillance forms based on the type of commodities imported .
QUOTAS
Bilateral agreement quotas or "quantitative limits of import" have been assigned to
specific countries for specific products to allow the controlled importation of specific
products.
DANGEROUS GOODS CERTIFICATION
Some goods may require DG certification. Examples of some commodities that may
require dangerous goods certification are perfumes, liquor, chemicals, etc.
PREFERENTIAL CERTIFICATE OF ORIGIN DOCUMENTS
Belgium is a participating member in many trade groups and has some bilateral and
multilateral preferential agreements, which offer duty rates for qualifying goods imported
directly from nations, which are granted these preferences
IMPORT DUTIES
All merchandise coming into Belgium must clear Customs and is subject to customs duty
assessment unless the goods are duty or tax exempt by law. Customs duties are,
generally a percentage, which is applied to the transaction value (euro) of the imported
goods based on the cost of the goods, insurance, and freight charges a specific rate of
duty (so much per piece, liter, kilo, etc.) and others at a compound
EXCISE DUTIES
Excise taxes are accessed against certain commodities, which are normally identified as
"luxury" goods. The excise tax is normally assessed against tobacco products, perfumes
and alcohol products but can also be accessed against other goods as deemed by
Belgium regulations.
WATCH DUTY RATE
Watches imported into Belgium are subject to classification and duty assessment based
on a per item basis. The actual duty and the final rate of duty are determined based on
the classification of the watch at the time of entry processing with customs.
BELGIUM IMPORT PROHIBITIONS
The importation of certain classes of merchandise may be prohibited or restricted to
protect the economy and security of Belgium and other EU member states, to safeguard
consumer health, well-being, and to preserve domestic plant and animal life. Some
commodities are also subject to an import quota or a restraint under bilateral trade
agreements and arrangements.
These requirements apply to all importation types, including shipments made by mail.
The exporter should make certain that the Belgium importer has provided proper
information to
(1) Permit the submission of necessary information concerning packing, labeling, etc.
(2) ensure that necessary arrangements have been made by the importer for entry of the
merchandise into Belgium.
BELGIUM EXPORT PROHIBITIONS
Export controls form of export licensing and permit requirements for controlled
commodities. Export controls may be product specific, technology specific or country
specific.
The following is a listing of commodities prohibited or restricted for export from Belgium
Goods subject to the Dual-Use and Related Goods, (Military equipment) (Export Control)
Regulations 1995 (DUEC)
Certain cultural goods, antiques and works of art
•Counterfeit coins and bank notes
•Goods bearing false origin statement
•Counterfeit or pirated goods
•All CITES goods
•Wild animals Weapons
•Explosives
•Some agriculture products
•Some medicines & drugs Euratom goods
•Precursors, CFC's
•Some Phytosanitary goods
•Waste products
•Meat, cheese, milk products
•Some drugs
TAXATION OF BELGIUM
Value-added tax (VAT) is due on any supply of goods or services made in Belgium,
where it is a taxable supply made by a taxable person in the course of a business carried
on by said person.The standard VAT rate is 21 percent., social housing reduced to 6
percent
margarine pay television and as from 1 August 2005 services rendered by operators
providing access to radio and television programs by means of a decoding device
installed at the customers’ premises.
.meals as from 1 January 2010 (beverages: 21 percent). There is a reduced rate of 6
percent for certain goods and services social housing
1 food and drinks
2 books
3 drugs and medicine
4 admission to cultural, sporting, and entertainment events
5 hotel and camping accommodation
6 Funeral services. Services of composers and authors
7 distribution of water Agricultural services People Transport
THE LIST OF GOODS SUBJECT TO A ZERO-RATE INCLUDES
Newspapers and periodicals
Waste products (metal scrap).
The list of exemptions with right to deduct input VAT includes amongst others
•export of goods
•intra-Community supply of goods
•supplies with respect to aircrafts and sea-going vessels; and
•Supplies to embassies, consulates, and international institutions.
The list of exemptions without right to deduct input VAT includes amongst others
•financial services
•letting of immovable property
•hospital services
•medical care
•educational services
If your business makes taxable supplies or provides services within the scope of VAT in
Belgium you will be required to register and in principle account for Belgian VAT. No VAT
registration threshold exists in Belgium.
All group members are jointly and severally liable for the debts of the other VAT group
members for the time of their membership and a group member must remain in the VAT
group for a minimum of three years. However, if the group conditions are no longer met,
a premature exit is possible or mandatory.
VAT grouping is not applicable on cross-border transactions.
Most registered businesses are required to submit VAT returns on a monthly basis. if
your annual turnover is less than EUR1,000,000, you may opt to submit quarterly VAT
returns. When filing quarterly VAT returns, your business has to make advance payments
at the latest on the 20th of each second and third month of the quarter.
Businesses in the following sectors need to submit a monthly VAT return when the
taxable annual turnover exceeds the hold of EUR200,000
•mineral oils
•mobile phones, computers, peripheral equipment, and accessories; and
•motorized vehicles subjected to the regulation regarding registration.
On 1 January 2010 a new hold was added. VAT taxable persons are also obliged to file
monthly VAT returns when they exceed the limit of EUR 400,000 for intra-Community
supplies of goods on a yearly basis. Monthly VAT returns have to be filed following the
quarter where in the hold of EUR 400,000 is reached.
An annual listing must be completed each year (at the latest on 31 March) showing the
supplies for an amount of more than EUR250 exclusive of VAT to customers registered
for VAT in Belgium. Failure to submit the listing may result in a penalty of up to
EUR2,500. Penalties for any mistakes in the listing are between EUR25 and EUR1,250
If you sell goods to a customer who is registered for VAT in another EU Member State
and the sale involves the removal of those goods from Belgium (either by you or your
customer) to that Member State, then you do not need to charge VAT and you may
exempt the supply as an intra-Community dispatch. You must obtain your customer’s
VAT number and quote it together with the reference “Exempt from Belgian VAT - article
39bis of the Belgian VAT Code” on your invoice. You should also obtain evidence of the
goods’ removal from Belgium.
If you sell goods to a customer who is not registered for VAT in another EU Member
State, you will have to charge Belgian VAT. If your sales exceed a certain threshold for
that Member State you may have to register in the Member State under what is known as
the Distance Selling Scheme.
Topic-6
Policies and Norms of India in Import / Export to the Belgium
Import Procedure :
Export Procedure :
CH.7:- PRESENT TRADE BARRIERS FOR IMPORT/EXPORT GOODS
There are several types of tariffs and barriers that a government can employ:
Specific tariffs
Ad valorem tariffs
Licenses
Import quotas
Voluntary export restraints
Local content requirement
Legal and Illegal Trade Barriers
Illegal - it violates international agreements and rules; or
Legal - it does not violate rules and agreements
Customs duties
Customs procedures:
Technical regulations & standard
The total all food and drink market* in Belgium and Luxembourg was worth Euro 29.4
billion in 2011, made up of Euro 29.4 billion in retail (100.0%) and Euro 0.0 billion (0.0%)
in foodservice.
Since the 1930s, many developed countries have reduced tariffs and trade barriers,
which has improved global integration and brought about globalization.
Free trade benefits consumers through increased choice and reduced prices, but
because the global economy brings with it uncertainty, many governments impose tariffs
and other trade barriers to protect industry.
CH.8:- POTENTIAL FOR IMPORT/EXPORT IN INDIA
Economic liberalization and rising income of middle class population have had a positive
impact on consumer spending and consumption in both rural and urban areas. Indian
consumer now spends a significant proportion of disposable income on food and other
essential commodities.
The Indian fast food market is growing at an annual rate of 25-30 per cent, according to a
report published by market research firm RNCOS in September 2010, titled ‘Indian Fast
Food Market Analysis’.
Our new research report “Indian Food and Drinks Market: Emerging Opportunities” has
projected that the Indian food, beverages and tobacco market will grow at a CAGR of
around 7.5% during 2009-2013 to around US$ 330 Billion by 2013. All the segments
registered uptrend in terms of consumption and sales between 2005 and 2009, but the
alcoholic segment outperformed other segments.
Food Processing Sector In India - August 2012
The proportionate expenditure on staples (cereal, grams, pulses) decline from 45 per
cent to 44 per cent in the rural India while the figure settled at 32 per cent of the total
expenditure on food in urban India.
A large part of this shift in consumption is driven by the processed food market, which
accounts fro 32 per cent of the total food market. It accounts for US$ 29.4 billion, in total
estimated market of US$ 91.66 billion.
Business Opportunities Food And Drinks Sector 2012
The Indian food services industry is expected to grow at a compound annual growth rate
(CAGR) of around 12 per cent during 2012-2015, according to a RNCOS research report,
'Indian Food Services Market Forecast to 2015'.
According to another report, the industry is estimated to be nearly worth US$ 13.56 billion
and is growing at a healthy CAGR of 17 per cent. The food services sector in India is
expected to reach US$ 24.77 billion by 2015, according to a Franchise India report
released at the Indian Restaurant Congress.
As per RNCOS research report titled, ‘Indian Organic Food Market Analysis’. The report
further expects that the sector will post significant growth during 2011-2013, growing at a
CAGR of 15 per cent.
Food Industry Sector Report - December 2010
Report published by market research firm RNCOS in April 2010, titled ‘Indian Food and
Drinks Market: Emerging Opportunities’ the Indian food and beverages market is
expanding rapidly and is projected to grow at a compound annual growth rate (CAGR) of
about 7.5 per cent during 2009-13 and would touch US$ 330 billion by 2013.
The food retail industry, currently at US$ 70 billion is predicted to grow more than double
to US$ 150 billion by 2025.
CH.9:- BUSINESS OPPORTUNITIES IN FUTURE
Highlights
The Belgian alcoholic drinks market generated total revenues of $11.2 billion in
2009, representing a compound annual rate of change (CARC) of -0.8% for the
period spanning 2005-2009.
The Belgian beer market generated total revenues of $5.6 billion in 2009,
representing a compound annual rate of change (CARC) of -2.6% for the period
spanning 2005-2009.
The Belgian confectionery market generated total revenues of $1.6 billion in 2009,
representing a compound annual growth rate (CAGR) of 5.5% for the period
spanning 2005-2009.
The Belgian dairy market generated total revenues of $5.6 billion in 2009,
representing a compound annual growth rate (CAGR) of 1.6% for the period
spanning 2005-2009.
The Belgian frozen food market generated total revenues of $1.6 billion in 2009,
this representing a compound annual growth rate (CAGR) of 3.4% for the period
spanning 2005-2009.
The Belgian juices market generated total revenues of $607.3 million in 2009,
representing a compound annual growth rate (CAGR) of 1.9% for the period
spanning 2005-2009.
The Belgian milk market generated total revenues of $2.8 billion in 2009,
representing a compound annual growth rate (CAGR) of 1.9% for the period
spanning 2005-2009.
The Belgian savory snacks market generated total revenues of $364.6 million in
2009, representing a compound annual growth rate (CAGR) of 2.5% for the period
spanning 2005-2009.
The Belgian soft drinks market generated total revenues of $4.9 billion in 2009,
representing a compound annual growth rate (CAGR) of 2.9% for the period
spanning 2005-2009.
The Belgian spirits market generated total revenues of $1,140.4 million in 2009,
representing a compound annual rate of change (CARC) of -0.3% for the period
spanning 2005-2009.
The Belgian wine market generated total revenues of $4.2 billion in 2009,
representing a compound annual growth rate (CAGR) of 0.6% for the period
spanning 2005-2009.
The Department of Foreign Affairs and International Trade (DFAIT) highlights the following opportunities in the Belgium market for exporters: health and
organic foods, energy foods and sport drinks, snacks, ethnic foods, ready-made
and microwaveable products, frozen and fresh fruit and vegetables, dried fruits
and nuts, wine, specialty meat and non-meat products, and seafood.
Belgium's significant food processing industry also creates demand for
international bulk and intermediate goods for distribution both within Belgium and
the EU.
The fish market in Belgium has seen the greatest growth in the past decade, and
there is growing demand for frozen fish and crustaceans as there is already high
consumption of mussels and oysters. Fish farming is still beginning to be adapted
in the EU, and due to ecological issues and quotas, growing demand for fish and
seafood may need to be sourced from imports.
Belgians are expressing boredom with their traditional foodservice and retail
offerings, and possess a tradition of gastronomy, cultural diversity, and willingness
to try new foods, which makes Belgium a popular test market for food products,
and ideal for Canadian exporters.
CH.10:- CONCLUSION
As the demand of foods there are more opportunity in the Belgium market for
exporters in to following areas health and organic foods, energy foods and sport
drinks, snacks, ethnic foods, ready-made and microwaveable products, frozen and
fresh fruit and vegetables, dried fruits and nuts, wine, specialty meat and non-meat
products, and seafood.
Fish market is also more demanding in Belgium market so there is good
opportunity is there in that business in Belgium.
The Belgium: Food and Beverages Industry Guide is an essential resource for top-
level data and analysis covering the Belgium Food and Beverages industry.
This incisive report provides expert analysis with distinct chapters for Alcoholic
and agriculture. Our faculty and students work both locally and internationally, with recent
projects in Brazil, Bhutan, Costa Rica, and India.
►The CEPB team includes an actively engaged group Graduate students come from
diverse backgrounds including "natural and social sciences" and are enrolled through the
Graduate Group in Ecology. Recent graduates have gone on to become academics,
researchers, or policy analysts in universities and governmental agencies.
CORPORATE TAXATION POLICIES OF BELGIUM
►Companies from the chemical and life sciences industry contribute significantly to the
budget of national, regional and local authorities through the payment of various taxes.
This is a financing source for social, environmental and economic policies.
► At the same time, the chemical and life sciences sector benefits from subsidies and
tax incentives which are often related to longer-term projects with a focus on the
sustainable development of chemical and life sciences activities in Belgium
.►In 2009, companies and employees from the chemical and life sciences industry
contributed around €4 billion to the state budget after deduction of subsidies and tax
incentives.
This represents about 40% of the sector’s value added.
LEGAL POLICIES OF SAFTEY IN BELGIUM
►disturbing the sum total contribute chain. accomplish requires all companies
manufacturing or importing chemical substances into the European Union in quantities of
one tone or more per year to register these substances
.► Registrations are submitted to the European Chemicals Agency (ECHA) and contain
information on the substance's properties, uses and risk management measures.
►This information must be passed along the supply chain to downstream users so they
knowhow to use substances safely. Arrive at also restricts the manufacture, import,
placing on the market and/rouse of certain dangerous substance and use precise
approval is required for ‘substances of very high concern’.
CHARECTRISTIC FOLLOWED BY MCCOY SOUDAL MANUFACTURING
●Plastics offer light weight solutions
● Lightweight plastics can play an important role
●Plastics are the basis for high-performance building components.
● The annual energy consumption of a passive house is already exceeded
International and European quality standards governing Norms:
●Quality is the key to international markets
. Commercial class standards are used as a common trading language for buyers and
sellers and as a reference for quality control.
Quality requires the setting of the necessary quality standards:
To build trust and open market opportunities
To encourage high quality production
To improve the profitability of producers
To protect consumer interests
Commercial quality covers
● A range of parameters describing the internal and external
Characteristics of the product
That is necessary to ensure transparency in trade and obtain good levels of flavor. It lies
between essential qualities such as food or nutritional safety and marketing claims.
International standards
●The UNICCO’s Committee on Trade (CT) works to develop closer economic relations
Among Member States, as well as to better integrate their cost-cutting measure into the
world
Economy. It makes policy recommendations, develops standards for use in trade and
Assist portion country in implement them. It also suggest traditions and wealth of
Creating legal and administrative frameworks for fostering trade, investment and
business
Growth.
Quality standards according to the following standard layout making chemical product:
1. Definition of products
2. General provisions concerning quality: these are general requirements relating to
Physical condition, hygiene appearance, damp absence of overseas smell and/or
Tang, development and /or maturity the condition of the create must be such
As to enable them to withstand handling and transport and arrive in a satisfactory
Circumstance at the leave of target they also contain requirements on
Classification in defined
According to their excellence individuality and the extent of in no doubt defect.
3. Provisions concerning sizing
4. Provisions concerning tolerances
5. Provisions concerning presentation
6. Provisions concerning marking (labeling)
7. Annex I: supplementary provisions
8. Annex II: note on the interpretation to be given to the provisions concerning
Presentation and packaging of the produce
►POLICIES OF CONSUMER PROTECTION MCCOY OF BELGIUM
Principal and consumer protection
●The Code Alimentary system presents a unique opportunity for all countries to
Join the international community in formulating and harmonizing food standards
And ensuring their global implementation.
● It is also allows them a role in the development of codes governing hygienic processing
practices and recommendations relating to compliance with those standards.
● The significance of the food code for consumer health protection was underscored in
1985 by the United Nations Resolution 39/248 whereby guidelines were adopted for use
in the elaboration and reinforcement of consumer protection policies. The Guidelines
advise, “When formulating national policies and plans with regard to Governments should
take into account the need of all consumers for food Security and should support and, as
far as possible, adopt
Principles from the Codex Alimentary or, in their absence, other generally accepted
international
Values.”
Promoting Controversy Of chemical sector in India:
●National award for Technology Innovation
A scheme of national awards for technology innovation in various fields such as dyes,
pesticides, it is to be formulate under this scheme, the Government would institutionalize
awards for terrific contributions ended in technology innovations. The collection for
awards would be made by a Committee Of eminent persons.
● Traffic fair and exhibition the Government would actively
Facilitate and support the marketing and organization of major exhibitions and events in
order to provide a platform to the Indian chemical manufactures to show case their
strengths
.
●Market Development
The Government would travel around new avenues of export of chemical from India to
Latin American, African and Middle East countries through our embassies and missions
overseas
CH.6:- Policies and norms of export and import in India to chemical sector.
Import policies.
The liberalization of Indian economy started with the external sector. The Rupee was
devalue in two stages in July 1991. This was immediately followed by closure of direct
export subsidy. Import licensing was abolished for many items, including capital goods. A
new type of import licence called Exim Scrip was introduced. Exim Scrip was available
against export of goods and it was freely transferable in the market. The licence was valid
for import of a broad range of goods. So, importers wanted Exim Scrips but only
exporters could earn them. The premium on sale of the Exim Scrip was an incentive for
the exporters.
The List of Restricted Items consisted of 11 categories as under:
(a) Consumer Goods (11 entries)
(b) Precious, Semi-precious and other shingle (5 entries)
(c) Safety, Security and related items (6 entries)
(d) seed, Plants and Animals (4 entries)
(e) Insecticides and pesticide (2 entries)
(f) Electronic Items (9 entries)
(g) Drugs and Pharmaceuticals (9 entries)
(h) Chemicals and related Items (2 entries)
(i) Items Relating to Small Scale Sector (16 entries)
(j) Miscellaneous Items (15 entries)
(k) Special Categories (2 entries)
The Exim Policy abolished Actual User condition for freely importable goods. Such a
condition was applicable only for goods imported under a license or when notified so
through a Public Notice. Imports by travelers were governed by luggage Rules, notified
by the Customs.
Export policies.
▪The Govt. Policy, essentially, has been to allow the export of manufactured products
quite freely but restrict export of goods of plant origin, animal source and sandstone
origin. The restrictions are essential in public interest.
▪ For example, free exports of agricultural produce might create scarcity within the
country something no Govt. wants. There are other restrictions too which, because of
international commitments under multilateral and two-sided treaties, are to be respected.
For example, export of textiles to developed countries was restricted through quotas
under the erstwhile Multi Fiber Agreement (MFA) which no longer exists. Export of ozone
depleting substances is restricted under the Montreal Protocol. Exports of perilous
substances are subject to restrictions under the Basel Convention.
▪The Exim Policy specified that all exports contracts shall be denominated in foreign
currency. Contracts for which payments are received through Asian Clearing Union may
be denominated in the currency of the exporter, importer or in any freely adaptable
▪Currency and all such payments shall be deem to have been received in convertible
currency.
Norms of Belgium chemical company:
▪NEW DELHI: With the emergence of Asia as a prominent player in the international
chemical industry, India is also ornamental its position as a required after purpose for the
global chemical players. The problem of the Indian chemical industry is that its present
share stands in the global industry stands at just 3%.
▪It is where the importance of better infrastructure and sustainability assumes
significance for ornamental industrial growth of chemicals. Centre has also said that as
per the present trends, the Indian chemical industry could grow at 11% to touch the size
of $224 billion by 2017.
▪While talking to SME News about the growth prospects of Indian chemical industry, Ravi
Kapoor, MD, Hibachi Color Pvt Ltd and Chairman – Gujarat Chapter of Indian Chemical
committee, said, “This shape is attainable if the current issues of communications, land
availability and investment are addressed. This sector enjoys good growth forecast
although its present share in the global industry is fairly low.”
▪Analysts are of the belief that investment on research and development (R&D) has
potential to enhance India’s global competitiveness in the chemical sector. Even though,
presently India spends just 0.5% but by 2017, the R&D spending needs to touch 4%.
▪It is believed that setting up of a chemical sector committee for novelty can act as a key
raised area to address the efficiency issue. Promotion of development of local cluster
along with modernism centers in universities meant for the chemical industry can also
establish helpful in the long run.
▪Moreover, India should eye for inking global partnerships with nations such as Germany
to learn about the recent innovations in the sector.
Ch.7:- PRESENT TRADE BARRIERS FOR IMPORT/EXPORT OF CHEMICAL INDUSTRY
India’s present share in Global Trade is 0.6%, i.e., US$ 45 Billion & it has been
envisaged by our planners to increase the same to 1% I .e US$ 80 Billion.World is
becoming increasingly competitive & only the best & the most competitive will survive.
Incentives should be made available to the industry where larger MNCs have made
inroads. Chemical Industry is the most important Foreign Exchange earner with major
value additions throughout the value chain. The value is added using knowledge,energy
and Capital.
Current Status
Chemical Industry is an important constituent of the Indian economy having approx. US $
28 billion turnover which is approx. 7% of India’s GDP.In terms of volume, it is 12th
largest in the world, and 3rd largest in Asia. Within India, it constitutes about 15% of
manufacturing capacity and20% of the Excise revenue to the Government of
India.Chemical industry has weightage of about 13% in the index of industrial production.
The global chemical industry is valued at about US $ 1.7 trillion, of which, India’s
chemical sector accounts for just 2%.
Market Development Assistance
The current financial assistance to exporters for participation in International Trade Fair is
upto Rs.1.10 lacs annually.
Suggestion:In view of the dynamic global scenario, the cost of participation in
International Trade Fairs is considerably high. Therefore, the financial assistance to
exporters should be increased to Rs.5.00 lacs or USD 10000, for status holders This
assistance would encourage manufacturer exporters to participate & enhance country’s
image and manufacturing capabilities in the international arena
Reimbursement of Registration Charges
Under Market Access Initiative, Financial assistance shall be available under the scheme
to the Export promotional Councils etc, for reimbursement of Registration charges for
product registration abroad for chemicals, biotechnology and agro chemicals and testing
charges for engineering products.
Suggestion:The Organic and Inorganic sector which is the backbone for Chemicals,
biotechnology sector is deprived from above assistance.
Therefore it is suggested to include Organic and Inorganic sector also under the preview
of above said initiative.
EU REACH Proposal
EU REACH (Registration, Evaluation and Authorization of Chemicals) is a nonTariff
barrier imposed by the European Union. This shall increase burden on the industry and
reduce the competitiveness.
Suggestions:Govt. should create an infrastructure & a cell for assistance (Technical &
financial) so that country’s export and competitiveness of the industry is not hit.Govt.
should establish centers for toxicology and statistical modeling (QSAR) expertise.Testing
laboratories approved by EU should be set up within India.These laboratories should
adhere to various International standards. As there are going to be myriad of chemicals
needing testing, this would result in saving testing cost and most importantly valuable
time.
Duty Free Import of Fuel
Organic and Inorganic chemical sectors are allowed only 4% FOB value of export to
import duty free fuel for captive power plants only. In the Chemical Sector, Energy is
required in two forms i.e. Electrical & Thermal. Substantial energy is utilized in the form of
thermal energy i.e.steam, which is very critical utility in various reaction process as well
as distillation.This utilization of steam cannot be substituted by power, as technology
would not permit for the same. The fuels used for steam generation are Coal, R.F.O,
Furnace Oil, L.D.O. and HSD etc. After considering steam i.e. thermal energy also in the
utility, the cost of utility of chemical industry varies between 10% and 15% of the FOB
value of the product exported. Therefore, it is suggested for upward revision for the duty
free import of fuel for atleast 10% after considering the fuel required via steam for
chemical industry.Duty free Entitlement for Status Holders for incremental growth more
than 25% in FOB value.
Suggestion:The condition of incremental growth for big exporters is very high.For
company’s having high turnover, incremental growth percentage wise may be less but
value wise is high. Therefore, it is suggested that incremental growth limit should be
brought down to 10% for Trading house & above.
Transferability of Advance License
Currently advance license is issued on Actual user condition. It can be converted into
Transferable, once the export obligations are fulfilled with no import of any item allowed
taken place. However, if some of the inputs included in the license have been imported,
the license can’t be converted into transferable for balance of the inputs even after the
export obligations are fulfilled.
Suggestion: There are few imports which are hazardous, difficult to handle & store and
the quantities are uneconomical to import by the license holder. They can be imported by
only those who can combine such licenses and have the requisite infrastructure.
Therefore, in such cases Advance License should be made transferable after fulfillment
of export obligations.
Transpacific Economic Partnership Agreement
ACC also calls for the swift conclusion of negotiations on the Trans Pacific Economic
Partnership (TPP) negotiations. The chemical sector strongly supports the TPP, and
views it as an opportunity to build consensus around new, high-standard trade disciplines
that address current and emerging trade issues. ACC analysis shows that the TPP agreement has the potential of generating $1.2 billion in export growth.In addition to
the TPP, the INDIA.government must explore options for free trade agreements with key
APEC economies not already part of the TPP.
Integrated Risk Information System (IRIS)
EPA’s Integrated Risk Information System is not a regulatory program, but it drives many
other important EPA regulatory and policy decisions that can have a major impact on jobs
and the economy. IRIS is a leading source of health risk information for domestic and
international regulatory bodies, including other EPA program offices. However, IRIS relies
on outdated methods for assessing the safety of chemicals, and lacks the transparency
needed by risk managers who use these assessments. Reforms to IRIS to ensure it
employs a more transparent, rigorous, and science-based approach in its assessments,
are essential to ensuring that our nation’s chemical management system delivers sound
public health decisions, while at the same time encouraging innovation, competitiveness,
and export growth.
Regulatory
Today, Indian chemical manufacturers comply with a massive amount of data collection,
reporting and other regulatory requirements, many of which are vital to ensuring the
health and safety of our products. However, regulations not grounded in science or
lacking a methodology for calculating risk typically impose massive, unnecessary costs
for Indian manufacturers with little or no public benefit. The Indian chemical industry
needs cost effective, science-based regulations that achieve both economic and social
policy objectives.
Innovation through regulation
Innovation, including science and technological progress, is an important source of
enhanced competitiveness for Indian chemical manufacturers, and a driver of economic
and export growth. In the chemical sector, innovation and chemistry are inextricably
linked. From applied technology in medical devices, aerospace, energy efficiency,
computing, cars, fuels and more, chemistry enables technological advancements that
drive further innovation, create jobs and enhance safety in our everyday lives. The Indian
chemical sector’s growth and competitiveness depend on its capacity to innovate and
commercialize new chemical products and applications.
Toxic Substances Control Act (TSCA)
The current regulatory regime under the core Indian chemical management law the Toxic
Substances Control Act – is in need of modernization. TSCA is more than 35 years old,
and needs updating to reflect advances in science and technology, to provide for greater
business certainty, to continue to promote innovation within the industry, and provide
customers confidence that chemicals are safe for their intended uses. Domestic and
foreign consumers should be confident that the Indian employs a regulatory framework
that bases decisions on chemical safety science and state-of the- art testing and
assessment methods. A more efficient and effective chemicals management system can
serve as a catalyst for enhancing the industry’s export performance, while also protecting
human health and the environment.
CH.-8 & 9:- POTENTIAL FOR IMPORT AND EXPORT AND BUSINESS
OPPORTUNITY
▪General Provisions
Goods are imported in India or exported from India through sea, air or land. Goods
can come through post parcel or as baggage with passengers. Potentials naturally
vary depending on mode of import or export. Potentials discussed in this Chapter
are applicable for imports by sea, air or land, but not as baggage or postal dispatch.
▪COMPUTERISATION OF CUSTOMS WORK - Work of customs at Delhi airport
has been computerized. Work at Mumbai port is also computerized. Whenever the
work is computerized, documents like IGM and Bill of Entry have to be filed
electronically. Potential in computerized environment has been specified in CC, New
Delhi PN 22/98 dated 8.5.1998. Guidelines for preparing data file for Bill of Entry and
shipping bills for Mumbai Customs House has been prescribed vide PN 108/99 dated
30-9-1999 and PN 10/2001 dated
30.1.2001.
▪ENTRY – ‘Entry’ in relation to goods means an entry made in a Bill of Entry,
Shipping Bill or Bill of Export. It includes (a) label or declaration accompanying the
goods which contains description, quantity and value of the goods, in case of postal
articles u/s 82 (b) Entry to be made in case of goods to be exported (c) Entry in
respect of goods imported which are not accompanied by label or declaration made
as per provisions of section 84. [section 2(16)].
▪AMENDMENT TO DOCUMENTS - Importer, exporter or 'Person In charge' have to
submit various documents to customs authorities like Bill of Entry, Import Manifest,
Export Manifest etc. Some times, it may become necessary to amend the document
due to various reasons like change in classification, clerical mistake in document,
change in unloading / loading plan of vessel etc. In such case, permission to amend
these documents have to be obtained from customs authorities. [section 149]. Such
permission can be given if there are no fraudulent intentions
Import Potentials
Potentials have to be followed by ‘person-in-charge of conveyance’ as well as the
importer.
WHO IS 'PERSON IN CHARGE' - As per section 2(31), 'person in charge' means (a) In
case of vessel - its master (b) In case of aircraft - its commander or pilot-in-charge (c)
In case of train - its conductor or guard and (d) In case of vehicle or other conveyance -
its driver or other person in charge.
Documents to be submitted by Importer - Documents required by customs
authorities are required to be submitted to enable them to
(a) check the goods
(b) decide value and classification of goods and
(c) to ensure that the import is legally permitted. The documents that are
essentially required are :
(i) Invoice
(ii) Packing List
(iii) Bill of Lading / Delivery Order
(iv) GATT declaration form duly filled in
(v) Importers / CHAs
declaration duly signed
(vi) Import Licence or attested photocopy when clearance is under licence
(vii) Letter of Credit / Bank Draft wherever necessary
(vii) Insurance memo or insurance policy
(viii) Industrial License if required
(ix) Certificate of country of origin, if preferential rate is claimed.
(x) Technical literature.
(xi) Test report in case of chemicals
(xii) Advance License / DEPB in original, where applicable
(xiii) Split up of value of spares, components and machinery
(xiv) No commission declaration. – A declaration in prescribed form about
correctness of information should be submitted. – Chapter 3 Para 6 and 7 of
CBE&C’s Customs Manual,
2001.
Assessment of Duty and Clearance
▪The documents submitted by importer are checked and assessed by Customs
authorities and then goods are cleared. Section 2(2) defines ‘assessment’ as
follows – ‘Assessment’ includes provisional assessment, reassessment and any
order of assessment in which the duty assessed is Nil. Thus, ‘assessment’ includes
●Noting of Bill of Entry: –
▪ Bill of Entry submitted by importer or Customs House Agent is cross-checked with
‘Import Manifest’ submitted by person in charge of vessel / carrier. It is noted if the
description tallies. ‘Noting’ really means taking on record by customs officer. This
date is relevant for determining rate of customs duty. Thoka number (serial number)
is given in the import section. Otherwise, it is returned for clarifications. In case of
EDI system, noting is done by the system itself which also generates bill of entry
number.
▪Date of presentation of bill of entry is highly relevant and the rate of duty as
applicable on this date will be considered for calculating the duty payable. Bill of Entry
is accepted only after proper scrutiny vis-a-vis import manifest and various
declarations given in bill of entry and attached documents like invoice, bill of lading
etc. If such documents are not attached, the authorities can refuse to accept the Bill
of Entry, and hence submission of such incomplete Bill of Entry cannot be taken as
date of presentation of Bill of Entry - Simla Agencies v. CC -
1993 (63) ELT 248 (CEGAT).
●Prior Entry of Bill of Entry: -
▪After the goods are unloaded, these have to be cleared within stipulated time -
usually three working days. If these are not so removed, demurrage is charged by
port trust/airport authorities, which is very high. Hence, importer wants to complete
as many formalities as possible before ship arrives. Proviso to Section 46(3) of
Customs Act allows importer to present bill of entry upto 30 days before expected
date of arrival of vessel. In such case, duty will be payable at the rate applicable on
the date on which ‘Entry Inward’ is granted to vessel and not the date of
presentation of Bill of Entry, but rate of exchange will be as prevalent on date of
submission of bill of entry. - confirmed in CC, New Delhi circular No 64/96 dated
10.12.1996 and CBE&C circular No 22/97-Cus dated 4.7.1997.
●Assessment of Customs duty: -
▪Section 17 provides that assessment of goods will be made after Bill of Entry is
filed. Date stamp of receipt is put on the ‘Bill of Entry’ and then it is sent to
appraising department either manually or electronically
●APPRAISING THE GOODS –
▪Appraiser has to (a) correctly classify the goods (b) decide the Value for purpose of
Customs duty (c) find out rate of duty applicable as per any exemption notification
and (d) verify that goods are not imported in violation of any law. He can call for any
further documents that may be required for assessment. If he is of the opinion that
goods have to be examined for appraisal, he will issue an examination order, usually
on the reverse of Bill of Entry. If such order is issued, the Bill of Entry is presented to
appraising staff at docks / air cargo complexes, where the goods are examined in
presence of importer’s representative. Assessment is finalised after getting the report
of examination. – Chapter 3 Para 11 and 12 of CBE&C’s Customs Manual, 2001.
●VALUATION OF GOODS: -
▪ As per rule 10 of Customs Valuation Rules, the importer has to file declaration
about full 'value' of goods. If the assessing officer has doubts about the truth and
accuracy of 'value' as declared, he can ask importer to submit further information,
details and documents. If the doubt persists, the assessing officer can reject the
value declared by importer. [rule 10A(1) of Customs Valuation Rules]. If the importer
requests, the assessing officer has to give reasons for doubting the value declared
by importer. [rule 10A(2)].
▪ If the value declared by importer is rejected, the assessing officer can value
imported goods on other basis e.g. value of identical goods, value of similar goods
etc. as provided in Customs Valuation Rules. [This amendment has been made w.e.f.
19.2.98, as per WTO agreement. However, it has been held that burden of proof of
under valuation is on department]. - - Assessing Officer should not arbitrarily reject
the declared value and increase
the assessable value. He should follow due process of law and issue appealable
order. – MF(DR) circular No.
16/2003-Cus dated 17-3-2003.
●APPROVAL OF ASSESSMENT: -
▪ The assessment has to be approved by Assistant Commissioner, if the value is
more than Rs one lakh. (in cases covered under ‘fast track clearance for imports’,
appraiser is also authorised to approve valuation). After the approval, duty payable is
typed by a “pin-point typewriter” so that it cannot be tampered with. As per CBE&C
circular No. 10/98-Cus dated 11-2-1998, Assessing Officer should sign in full in Bill of
Entry followed by his name, preferably by rubber stamp.
EDI ASSESSMENT – In the EDI system, the cargo declaration is transferred to
assessing officer in the groups electronically. Processing is done on the screen itself.
All calculations are done by the system itself. If assessing officer needs clarification,
he can raise a query. The query is printed at service centre and importer replies
through service centre. Facility of tele-enquiry about status of documents is provided
in major customs stations. Under EDI, normally, documents are inspected only after
assessment. After assessment, copy of Bill of Entry is printed at service centre. Final
Bill of Entry is printed only after ‘Out of Charge’ order is given by customs officer. –
Chapter 3 Para 18 to 22 of CBE&C’s Customs Manual, 2001.
●PAYMENT OF CUSTOMS DUTY: -
▪After assessment of duty, necessary duty is paid. Regular importers and Custom
House Agents keep current account with Customs department. The duty can be
debited to such current account, or it can be paid in cash/DD through TR-6 challan in
designated banks.
▪After payment of duty, if goods were already examined, delivery of goods can be
taken from custodians (port trust) after paying their dues. If goods were not
examined before assessment, these have to be submitted for examination in import
shed to the examining staff. After shed appraiser gives ‘out of charge’ order, delivery
of goods can be taken from custodian.
●EXAMINATION OF GOODS: -
▪Examiners carry out physical examination and quantitative checking like
weighing, measuring etc. Selected packages are opened and examined on
sample basis in ‘Customs Examination Yard’. Examination report is prepared by
the examiner.
▪Accelerated Clearance of Imports and Exports Scheme (ACS) – Finance Minister, in
his budget speech on 28-2-
2003, had announced a ‘self assessment scheme’ for importers and exporters. As
per the scheme, importer will himself determine classification of goods including claim
for exemption benefits. Computer System will calculate the duty based on his
declaration. Physical inspection of imported goods will be done by risk- assessment
and management techniques on a computer based system and not on the orders of
customs examining staff. Audit of import documents will not be by existing system of
concurrent audit but will be done by post-clearance audit, as prevalent in developed
countries.
▪Subsequently, a Accelerated Clearance of Import and Export Scheme (ACS) has
been announced vide MF(DR)
circular No. 30/2003-Cus dated 4-4-2003. The scheme is announced through
administrative instructions, without making any change in statutory provisions. Hence,
the scheme is not same as ‘self removal’ under Central Excise. Presently, the scheme
is introduced on trial basis at Air Customs, Sahar (Mumbai), ICD, New Delhi and
Chennai Sea Customs.In case of imports, the scheme will be open to all status
holders under EXIM policy, Central and State Government PSUs and other importers
who have been importing for at least two years and have filed at least 25.
●Bills of Entry in preceding year :. –
▪ In case of exports, the scheme will be open to all status holders under EXIM
policy, EOU/STP/EHTP units whose goods have been sealed in presence of
customs/excise officers, Central and State Government PSUs, manufacturer-
exporters who have been exporting for at least two years and have filed at least 25
Shipping Bills in preceding year and bulk exporters.
▪ Certain sensitive items have been excluded from the provisions. Importer/exporter
intending to avail this facility has to make application to Commissioner. The
clearances will be subject to post clearance audit.
▪Provisional Assessment - Section 18 of Customs Act, 1962 provide that provisional
assessment can be done in following cases
(a) when Customs Officer is satisfied that importer or exporter is unable to produce
document or furnish information required for assessment
(b) it is deemed necessary to carry out chemical or other tests of goods
(c) when importer/exporter has produced all documents, but Customs Officer still
deems it necessary to make further enquiry. In such cases, assessment is done
on provisional basis.
▪The importer/exporter has to furnish guarantee/security as required by Customs
Officer for payment of difference if any. Goods can be cleared after payment of duty
provisionally assessed and after providing the security. After final assessment,
difference is paid by importer or refunded to him as the case may be. If the imported
goods were warehoused after provisional assessment, the Customs Officer may
require importer to execute a bond for twice the difference in duty, if duty finally
assessed is higher [section 18(2)(a)]. The bond is called as 'P D Bond' (Provisional
Duty Bond). The bond is with security or surety. Bank guarantee can also be given
as a security.
▪Checking of duty drawback / license documents - Documents in respect of Duty
Entitlement Pass Book
(DEPB), advance license, duty drawback etc. will be checked.
●Execution of bond and payment of duty: -
Once the duty is assessed, the bill of entry is returned to importer. The Bill of Entry
should be presented to comptist for calculation and pinpointing of the duty. If bond
has to be executed, it will be taken in bond section.
●Payment of duty: -
▪ If goods are to be removed to a warehouse, duty payment is not required. The
goods can be taken to a warehouse under bond, without payment of duty. However,
if goods are to be removed for home consumption, payment of customs duty is
required. CHA or the importer can take it for payment of customs duty. Large
importers and CHA have P.D. accounts with customs. Duty can be paid either in cash
or through P.D. account. P. D. account means provisional duty account. This is a
current account, similar to PLA in central excise. The importer or CHA pays lump
sum amount in the account and gets credit on the amount paid. He can pay customs
duty by debiting the amount in P.D. (Provisional Duty) account. If the importer does
not have an account, he can pay duty by cash using TR-6 challan. Of course,
payment through PD account is very convenient and quick
Export Potentials
▪Potentials have to be followed by (a) ‘person-in-charge of conveyance’ and (b) the
exporter. The potentials are similar to potentials for import, of course, in reverse
direction.
●NO STOPPAGE OF EXPORT CONSIGNMENT: -
▪ Exports are vital for our economy. Any stoppage in export consignment means loss
of export orders to the exporter and loss of foreign exchange to the country. Hence,
it has been provided that movement of export consignment will not be interrupted
and no export consignment shall be withheld for any reason whatsoever. In case of
any doubt, customs authorities may ask for an undertaking that the export is on sole
responsibility of the exporter. [Highlights of EXIM policy 1997-2002 as amended on
13.4.1998].
▪Potentials by person in charge of conveyance – Any new airline, shipping line,
steamer agent should be registered in Customs Systems for electronic
processing of shipping bills etc.
▪The ‘person in charge of conveyance’ has to follow prescribed potentials.
●Entry Outward: -
▪The vessel should be granted ‘Entry Outward’. Loading can start only after entry
outward is granted. (section 39 of Customs Act). Steamer Agents can file
‘application for entry outwards’ 14 days in advance so that intending exporters can
start submitting ‘Shipping Bills’. This ensures that formalities are completed as
quickly as possible and loading in ship starts quickly.
●LOADING WITH PERMISSION: -
▪ Export goods can be loaded only after Shipping Bill or Bill of Export, duly passed by
Customs Officer is handed over by Exporter to the person-in-charge of conveyance.
In case of baggage and mail bags, shipping bill is not necessary, but permission of
Customs Officer is required (section
40).
▪Export Manifest - As per section 41, an Export Manifest/Export Report in prescribed
form should be submitted before departure. [The report is popularly called as ‘Export
General Manifest’ - EGM]. The details required are similar to import manifest. Such
manifest/report can be amended or supplemented with permission, if there was no
fraudulent intention. Such report should be declared as true by the person-in-charge
signing the export manifest. This report is not required if the conveyance is carrying
only luggage of occupants.
▪Potentials to be followed by Exporter – Export potentials have been summarized in
Chapter 3 Part II of
CBE&C’s Customs Manual, 2001.
Every exporter should take following initial steps -–
▪Obtain BIN (Business Identification Number) from DGFT. It is a PAN based
numberOpen current account with designated bank for credit of duty drawback claims
Register licenses / advance license / DEPB etc. at the customs station, if exports are
under Export
▪Promotion Schemes
Exporter has to submit ‘shipping bill’ for export by sea or air and ‘bill of export’ for
export by road. Goods have to be assessed for duty; even if no duty is payable for
most of exports, as ‘Nil Duty’ assessment is also an assessment.
▪Shipping Bill to be submitted by Exporter - Shipping Bill and Bill of Export
Regulations prescribe form of shipping bills. It should be submitted in quadruplicate.
If drawback claim is to be made, one additional copy should be submitted.
▪There are five forms:
(a) Shipping Bill for export of goods under claim for duty drawback
- These should be in Green colour
(b)Shipping Bill for export of dutiable goods - this should be yellow colour
(c) Shipping bill for export of duty free goods - it should be white colour
(d) shipping bill for export of duty free goods ex-bond - i.e. from bonded store room
- it should be pink colour
(e) Shipping Bill for export under DEPB scheme - Blue colour.
▪The shipping bill form requires details like name of exporter, consignee, Invoice
Number, details of packing, description of goods, quantity, FOB Value etc.
Appropriate form of shipping bill should be used.
▪Relevant documents i.e. copies of packing list, invoices, export contract, letter of
credit etc. are also to be submitted. In case of excisable goods, from ARE-1
prepared at the time of clearance from factory should also be submitted.
▪Customs authorities give serial number (called 'Thoka Number') to shipping bill,
when it is presented. Excise formalities at the time of Export - If the goods are
cleared by manufacturer for export, the goods are accompanied by ARE-1 (earlier
AR-4). This form should be submitted to customs authorities. The Customs Officer
certifies that the goods under this form have indeed been exported. This form has
then to be submitted to Maritime Commissioner for obtaining ‘proof of export’. The
bond executed by Manufacturer-exporter with excise authorities is released only
when ‘proof of export’ is accepted by Maritime Commissioner or Assistant
Commissioner, where bond was executed.
●Duty drawback formalities: -
▪ If the exporter intends to claim duty drawback on his exports, he has to follow
prescribed potentials and submit necessary papers. The potentials are discussed in
the chapter on ‘Export Incentives'. He has to make endorsement of shipping bill that
claim for duty drawback is being made. If he fails to do so due to genuine reasons,
Commissioner of Customs can grant exemption from this provision. [proviso to rule
12(1)(a) of Duty Drawback Rules].
●G R / SDF / SOFTEX Form under FEMA :-
▪Reserve Bank of India has prescribed GR / SDF form under FEMA. “G R” stands for
‘Guaranteed Receipt’ form, while SDF stands for 'Statutory Declaration Form’). SDF
form is to be used where shipping bills are processed electronically in customs
house, while GR form is used when shipping bills are processed manually in
customs house.
●Other documents required for export: -
▪Exporter also has to prepare other documents like (a) Four copies of Commercial
Invoice (b) Four copies of Packing List (c) Certificate of Origin or pre-shipment
inspection where required (d) Insurance policy. (e) Letter of Credit (f) Declaration
of Value (g) Excise ARE-1/ARE-2 form as applicable (h) GR / SDF form prescribed
by RBI in duplicate (i) Letter showing BIN Number.
●RCMC certificate from Export Promotion Council: -
▪Various Export Promotion Councils have been set up to promote and develop
▪Goods to be transhipped must be specified in Import Manifest or Import report
and a ‘Bill of Transhipment’ should be submitted to Customs Officer. In case of
goods being transhipped under an international treaty or bilateral agreement
between Government of India and Government of a foreign country, a
Declaration of Transhipment shall be submitted instead of Bill of Transhipment.
[section 54(1)]. [India has such bilateral agreement with Nepal].
▪Such goods should not be ‘prohibited goods’ under section 11 of Customs Act.
The goods should be sealed during transhipment by customs officer. A bond has
to be executed for the purpose. After execution of bond, a certificate from customs
officer has to be submitted within one month that goods have been properly
transferred. [Goods Imported (Conditions of Transshipments) Regulations, 1995].
On arrival at customs station, they will be liable to customs duty as if it is first
importation in India. - section 55.
●TRANSIT AND TRANSHIP: -
▪ Distinction between transit and transshipment is that in 'transit' goods continue to
be on same vessel, while in transshipment, goods are transferred to another vessel
/ vehicle. Hence, potentials are also different.
▪Coastal goods - Coastal goods means goods transported from one port in India to
another port in India, but do not include imported goods. Thus, coastal goods mean
goods taken by ship from one Indian port to another. No export or import is involved,
but control is necessary to ensure that coastal goods are not diverted illegally for
export.
●LOADING OF COASTAL GOODS: -
▪The Consignor should submit bill of coastal goods to Customs Officer (section
93). Form of the bill has been prescribed. These will be loaded by master of vessel
only after ‘bill of coastal goods’ is passed (section 93). Master of Vessel will carry
an ‘Advice Book’ where entries will be made by Customs Officer. This ‘Advice
Book’ has to be presented for inspection of Customs Officers, if called for. After
loading, the vessel can leave only after obtaining written order from Customs
Officer. As per notification No 15/98-NT dated 27.2.1998, exemption has been
granted for delivery of 'Advice Book' at each port of call. However, the 'Advice
Book' will have to be submitted for inspection on board of vessel, when called for.
●UNLOADING OF COASTAL GOODS: -
▪Unloading of coastal goods should be done only at Customs Port or coastal port
appointed by CBEC under section 7 of Customs Act. On arrival, all bills relating to
goods which are to be unloaded will be delivered to Customs Officer. Unloading can
be done only after obtaining permission from Customs Officer. Customs Officer can
inspect goods and ask for questions and documents relating to goods. Goods will be
unloaded at approved place under supervision of Customs Officer.
●IMPORT MANIFEST IS REQUIRED TO BE SUBMITTED BEFORE ARRIVAL OF
AIRCRAFT OR VESSEL:
▪ Section 30(1) of Customs Act provides that Import Manifest should be filed before
arrival of ship or aircraft. Normally, the Agents submit the Import Manifest before
arrival, so that maximum possible formalities are completed before vessel or aircraft
arrives. This also enables importers to file ‘Bill of Entry’ in advance.
▪Grant of Entry Inwards by Customs Officer - Unloading of cargo can start only after
Customs Officer grant
‘Entry Inwards’. Such entry inwards can be granted only when berthing
accommodation is granted to a vessel. If there is heavy congestion at port,
shipping berth may not be available and in such case, ‘Entry Inwards’ cannot be
granted. This date is highly relevant for determining rate of customs duty
applicable.
▪Carrier responsible for shortages during unloading - If the goods are short landed,
the carrier is liable to pay penalty upto twice the amount of duty payable on such
short landed goods. It has been held that tally sheet prepared by Port Trust
authorities on unloading of goods is a statutory document and should be accepted
in preference to steamer survey - Scindia Steam Navigation v. CC - 1988 (33) ELT
(CEGAT) followed in re India Steamship Co. Ltd. - 1992 (57) ELT 510 (GOI).
▪Potential by Importer - The importer importing the goods has to follow prescribed
potentials for import by ship/air/road. (There is separate potential for goods
imported as a baggage or by post.)
▪Bill of Entry - This is a very vital and important document which every importer has
to submit under section 46. The Bill of Entry should be in prescribed form. The
standard size of Bill of Entry is 16" × 13". However, for computerization purposes,
15" × 12" size is permitted. (Mumbai Customs Public Notice No. 142/93 dated 3-11-
93).
▪Bill of Entry should be submitted in quadruplicate – original and duplicate for
customs, triplicate for the importer and fourth copy is meant for bank for
making remittances.
Under EDI system, Bill of Entry is actually printed on computer in triplicate only
after ‘out of charge’ order is given. Duplicate copy is given to importer.
Types of Bill of Entry - Bills of Entry should be of one of three types. Out of these,
two types are for clearance from customs while third is for clearance from
warehouse.
●BILL OF ENTRY FOR HOME CONSUMPTION –
▪This form, called ‘Bill of Entry for Home Consumption’, is used when the imported
goods are to be cleared on payment of full duty. Home consumption means use
within India. It is white colored and hence often called ‘white bill of entry’.
●BILL OF ENTRY FOR:
▪when required on payment of duty. This will enable him to defer payment of
customs duty till goods are actually required by him. This Bill of Entry is printed on
yellow paper and often called ‘Yellow Bill of Entry’. It is also called ‘Into Bond Bill of
Entry’ as bond is executed for transfer of goods in warehouse without payment of
duty.
●BILL OF ENTRY FOR EX-BOND CLEARANCE: -
▪ The third type is for Ex-Bond clearance. This is used for clearance from the
warehouse on payment of duty and is printed on green paper. The goods are
classified and value is assessed at the time of clearance from customs port. Thus,
value and classification is not required to be determined in this bill of entry. The
columns in this bill of entry are similar to other bills of entry. However, declaration
by importer is not required as the goods are already assessed.
●RATE OF DUTY FOR CLEARANCE FROM WAREHOUSE: -
▪ It may be noted that rate of duty applicable is as prevalent on date of removal from
warehouse. Thus, if rate has changed after goods are cleared from customs port,
customs duty as assessed on yellow bill of entry and as paid on green bill of entry
will not be same.
●Mention of BIN on Bill of Entry: –
▪A BIN (Business Identification Number) is allotted to each importer and exporter
w.e.f. 1.4.2001. It is a 15 digit code based on PAN of Income Tax (PAN is a 10 digit
code). [Earlier an EC (Import Export code) number issued by DGFT was required to
be mentioned on Bill of Entry].
▪Filing of Bill of Entry - Normally, Bill of Entry is filed by CHA on behalf of the
importer. Customs work at some ports has been computerized. In that case, the Bill
of Entry has to be filed electronically, i.e. through Customs EDI system through
computerization of work. Potential for the same has been prescribed vide Bill of
Entry (Electronic Declaration) Regulations, 1995.
CH.10:- CONCLUSION
A robust export-led growth strategy must address both domestic and international
policies that systematically disadvantage Indian manufacturing competitiveness. The
purpose of ACC’s “Keys to Export Growth” is to provide insights and actionable
recommendations that will lead to stronger export growth for the Indian chemical sector,
and the Indian economy as a whole. ACC and its members support a broad and
comprehensive policy approach that addresses a range of policy issues.
From energy and tax to trade and regulations, ACC’s “Keys to Export Growth “presents
clear recommendations on public policy issues that can make a positive contribution to
the chemical industry’s efforts to drive innovation, increase productivity, and encourage
investment.
▪Promoting resource efficiency is a policy objective of the Federal Government of
Belgium, but also of the regions, with many cross‐cutting linkages to various policy
fields. Therefore, resource efficiency policies are formulated and introduced by various
Federal Departments, covering different issues and aspects of the resource efficiency
agenda.
▪The development of the Belgium's environmental policy is characterized by a
separation of responsibilities between the national and the regional level.
The Environmental federal level is responsible for:
the establishment of an integrated product policy
the chemical policy
the transit of wastes
the protection against ionizing radiation and radioactive waste management
▪On the Federal level, a mainly horizontal approach is contributed to resource efficiency
with cross-cutting linkages between various governmental bodies and policy fields, such
as:
Federal Public Service (FPS) for Economy, SMEs and Energy
Federal Public Service for Foreign Affairs, Foreign Trade and Development
Federal Department for Sustainable Development
Federal Department for Sciences
These FPS are, for instance, in charge of the general building policy, the financial and
fiscal policy, the energy policy etc. 2011 survey of resource efficiency policies in EEA
member and cooperating countries - BELGIUM
BIBLIOGRAPHY
http://ib.fgov.be/en/important_industries http://commerce.nic.in/trade/international_ta_current_details http://www.nationsencyclopedia.com ec.europa.eu/trade/creating-opportunities/bilateral-relations/countries/india/ www.economywatch.com/world_economy/belgium/export-import.html www.agoria.be www.flaunders .be www.oecd.eu www.un.com www.moft.in www.wallonialogistics.be National Bank of Belgium RBI Ministry of Corporate Taxation, India Department of taxation, Belgium www.Bloomberg.com Government of Belgium , website Government of Gujarat , Portal http://www.fedex.com/us/international/irc/profiles/irc_be_profile.html http://www.indiapackagingshow.com/industry.htm http://www.indiapackagingshow.com/industry.htm http://www.flexfilm.com/index.php?option=com_content&view=article&id=22&Itemid=
http://www.austrade.gov.au/Doing-business-in-Belgium/default.aspx http://www.academia.edu/477809/Non-tariff_Barriers_affecting_Indias_Export http://www.worldpackaging.org/publications/documents/market-statistics.pdf LEGISLATION ON PACKAGING AND THE ENVIDONMENT - Europen Green Dot &Packaging Waste Directive Compliance in Europe http://agriexchange.apeda.gov.in/countrysearchnew/expfrmindia.aspx?ctryid=13033&ctr
Powered by WordPress.com Meeting with Belgium Consul General.pdf Source: Joki Gauthier for Oxfam 2012. For more information on this figure, and to see it
You may re-use this information (not including logos) free of charge in any format or medium,
under the terms of the Open Government Licence. To view this licence, visit www.nationalarchives.gov.uk/doc/open-government-licence/ or write to the Information
Policy Animal Health and Veterinary Laboratories Agency (AHVLA) : http://www.nationsencyclopedia.com/Europe/Belgium-FOREIGN-
devices/ucm050521.htm Meininger Wine Business International (German) - www.wine-business-interational.com http://www.tradingeconomics.com/belgium/exports http://www.thefoodworld.com/food-exporters-importers/all/india/ http://agriexchange.apeda.gov.in/countrysearchnew/expfrmindia.aspx?ctryid=13033&ctr
yn=BELGIUM&menuid=15 http://www.infodriveindia.com/india-import-data/packed-food-import-data.aspx Meeting with Belgium Consul General.pdf Source: Joki Gauthier for Oxfam 2012. For more information on this figure, and to see it
online, visit http://www.behindthebrands.org AF_Processing_Intro.pdf You may re-use this information (not including logos) free of charge in any format or
medium, under the terms of the Open Government Licence. To view this licence, visit www.nationalarchives.gov.uk/doc/open-government-licence/ or write to the Information
Policy Animal Health and Veterinary Laboratories Agency (AHVLA) http://www.nationsencyclopedia.com/Europe/Belgium-FOREIGN-
TRADE.html#ixzz2NcCpe54o SIGNUP TO: EXPORT DATA| GET FORECAST https://www.awdc.be www.gjepc.org http://www.belgium.be/en/ http://www.oecd.org/belgium/governmentofbelgiumusefullinks.htm https://en.wikipedia.org/wiki/Belgium https://en.wikipedia.org/wiki/Belgium#Geography https://en.wikipedia.org/wiki/Belgium#Economy http://www.diamondland.be/antwerp-diamonds www.dnb.co.in/IndianGemsandJewellerySector/Overview.asp www.nsdcindia.org/pdf/gems-jewellery http://www.indiainbusiness.nic.in/industry-infrastructure/industrial-sectors/gems-jewellery.htm http://technicalsonline.blogspot.in/2011/07/indian-gems-and-jewellery-industry.html http://www.gjepc.org/updates/9039/gem-jewellery-industry
Aksoy, A.(1991), ‘The Indian Trade Regime’, Policy Research Working Paper # 989, The World Bank, Washington DC. Aksoy. A. and F.M. Ettori (1992), ‘Protection and Industrial Structure in India’ Policy Research Working Paper # 990, The World Bank, Washington DC Alexander, P.C. (1977), Report on the Committee on Import-Export Policies and Procedures, Ministry of Commerce, Government of India. Bhagwati, J.N. (1965), ‘On the Equivalence of Tariffs and Quotas’ in Baldwin, R (ed.) (1989), Trade, Growth and The Balance of Payments’ North Holland, Amsterdam ( Rand McNally and Corporation, Chicago). Bhagwati, J.N. and T.N.Srinivasan (1975), Foreign Trade Regimes and Economic Development: India, NBER, NewYork. Chadha, R. (2000), ‘The Decade of India’s Economic Transformation: Impact Analysis of Unilateral and Global Changes in Trade Policy,’ Paper presented at the Conference to Honour Professor K.L.Krishna, Centre for Development Economics, Delhi School of Economics, Dec20-22. Chelliah, R.J. (1992), Tax Reforms Committee: Final Report, Parts 1 & 2, Government of
India. Corden, W. M. (1974), Trade Policy and Economic Welfare, Clarendon Press, Oxford. Deardorff, A. (1987), ‘Why do Governments Prefer Non-tariff Barrier?’, Carnegie- Rochester Conference Series on Public Policy, 26, 191-216. Deardorff, A. and R. Stern (1999), Measurement of Non-tariff Barriers, University of Michigan Press, Ann Arbor. Gang, I.and M.Pandey (1998), ‘What was Protected? Measuring India’s Tariff Barriers 1968-1997,’ Indian Economic Review, Vol. xxxiii, No.2, 119-152. Greenaway, D. (1988), ‘Evaluating the Structure of Production in Less Developed Countries in D.Greenway (ed.) Economic Development and International
Trade, Macmillan, London. Greenaway, D. and C. Milner (1993), Trade and Industrial Policy in Developing Countries- A Manual for Policy Analysis, Macmillan, London. Goldar, B.N., A.V.L.Narayana and S.N.Hasheem (1992), ‘Structure of Nominal Tariff Rates in India’ , Studies in Industrial Development, Office of the Economic Advisor, Ministry of Industry, Government of India. Goldar,B.N. and S.N.Hasheem (1992), ‘India’s Tariff Structure: Effective Rates of Protection of Indian Industries,’ Studies in Industrial Development, Office of the Economic Advisor, Ministry of Industry, Government of India. Goldar,B.N. and S.N.Hasheem (1994), ‘Study of India’s Tariff Structure: Effect of Tariff Protection on Domestic Industries,’ Studies in Industrial Development, Office of the Economic Advisor, Ministry of Industry, Government of India. Goldar, B.N. and V.S. Renganathan (1990), ‘Economic Reforms and R&D Expenditure in Industrial Firms in India,’ Indian Economic Review, Vol.46, No.2, 60-75. Hasheem, S.N. (2001), Protection in Indian Manufacturing: An Empirical Study, Macmillan India Ltd, Delhi. Hussain, Abid (1984), Report of the Committee on Trade Policies, Ministry of Commerce, Government of India. Johnson,H.G. (1960), ‘The Costs of Protection and Scientific Tariff,’ Journal of Political Economy, 68,327-345. Joshi, V. and I.M.D. Little (1994), India’s Economic Reforms 1991-2001, Oxford University Press, Delhi. Krueger, A. O. (1981), ‘Interactions between Inflation and Trade Objectives in Stabilization Programs ‘in Cline, W. and S. Weintraub (ed), Economic Stabilization in Developing Countries, Brookings Institution, Washington DC. Krueger, A.O. (1984), ‘Trade Policies in Developing Countries’ in Jones, R.W and P.B.Kennen (ed.) Handbook of International Economics, Vol-1, Elsevier Science Publishers. Meade, J. (1951), The Theory of Commercial Policy, Vol-1: The Balance of Payments, Oxford University Press, Oxford. Mehta, R. (1997), ‘Trade Policy Reforms, 1991-92 to 1995-96: Their Impact on External Trade’, Economic and Political Weekly, April 12, 779-784. Mehta, R. and S.K Mohanty (1999), WTO and Industrial Tariffs: An Empirical Analysis for India, Research and Information System for the Non-Aligned and