203
I CENSUS OF INDIA 1971 KERALA A PORTRAIT OF POPULATION K. NARAYANAN OF THE INDIAN ADMINISTRATIVE SERVICE DIRECTOR OF CENSUS OPERATIONS KERALA
I CENSUS OF INDIA 1971
KERALA
A
PORTRAIT OF
POPULATION
K. NARAYANAN OF THE INDIAN ADMINISTRATIVE SERVICE
DIRECTOR OF CENSUS OPERATIONS
KERALA


Foreword
This attempt to produce a popular vCl"sian of the large census data for the gencral reader is an important innovation of the EI71 Indian census. Census publications concerninp; even
a state run into a numh:.:r of volumes. It is not possible for those who are not specialists to go through them all. At the samc time the basic information contained in the hundreds of
census tables is rich and of significance to a much larger number of the publie than is likely to consult the census series. It is >Ilith a view to catt:y for this group of readers grown up as also
those who are now in high schools and colleges that Ihis Portrait
of Population relating to every state has beer, produced. It seeks
to present in a brief compass all that may be of interest to the general reader and that too in a non-technical language.
I trust this venture will be welcomed and will help to introduce every responsible citizen to the scope and variety of
information that is contained in our decennial census reports.
NEW DELHI, A. CHANDRA SEKHAR
17th OCTOBER 1973. REGISTRAR GENERAL, INDIA


Preface
The Population Census conducted periodically is an operation that involves the entire population of the country but the Census report rarely attracts the attention of the
public. This is mainly because ,the report is tied on to a multiplicity of tables which cater to the needs of the administrators, research workers and specialists in various fields but
are of little interest to the general reader. An attempt is made in this book to present a simple picture of the I?opulation of Kerala as it emerged from the 1971 Census. If, in spite 01 shortcomings, in the choice and the presentation of details, I
haye been able to aroilse in the reader an interest in the demographic situation in the State, I shall consider myself as
having succeeded in this endeayour.
I am deeply indebted to Shri A. Chandra Sekhar, Registrar General and ex officio Census Commissioner of India for the inspiring guidance he gave ine in this as well as other projects connected with the 1971 Census. I am also thankful to Shri R. 'B. Chari, Deputy Registrar General, India for his useful suggestions and also for his warm co,operation.
It is with genuine pleasure that I acknowledge the valuable contributions made by Shri M. A. Kosh)" Deputy Director, who a%isted me at eyer)' stage in the preparation of this volume with a sense of pei'sonal responsibility. I am also
thankful to Shri B. T. Pillai, Deputy Director, for all the assistance he rendered in bringing out this volume in time.

The selection and arrangement ot the statistics required
for this volume from the. ma% of ceusus data were done by Shri S. JayashankcT, SClliOl lUH:'>tigatcr and Smt. P. :\1. Rugmani Amll1a, Tabulation Ollicn willI th:: assistance of Kumari S. Radhamoni, Assi,lant Compiler. The maps, charts and
illustrations 'were prepared with il1cticulous care by Shri
K. Krishna PilIai, Draftsman. .\ll matters conllected with the layout and printing of the \OlUlllC ',cre handled by Shri
S. J ayashanker ably assiste"cl hy San dshri =". Ra\'indranathan Thampi, Printing Impecu>l' and ::;. Aravindan and X. ~Iadhavan, Proof Rcad('n. The eniire dictation of the first
draft of the report was taken by my Stenographer. Shri S. Gopalakrishna Pillai. To all of them I feel happy to offer my sincere thanks.
The printing of this l)ook was ulldertaken by the Government of India Press, CoilllbaLorc. I am very grateful to Shri V. R. Sivaram, :\1' ,mager, Sa~,\"l,lH; K.. Gopalakrishnan and
P. K. Subramanian, Assistant ~Lmagen" and their diligent staff
for doing the job with lttmust care ;end effic~ency.
Trivandrum, K. ~ARAYANA1'<
~(lLh October 1973.

FOREWORD
PREFACE
In troduction
Chapter
Chapter
Chaptu
Chapter
Chapter
Chapter
Chapter
Chapter
Chapter
Contents
I How many arc 1Nt'? How are we distributed and by how much arc, our numbers growing?
II Village dwellers and tov.m d'wellers
III Are the number of men and women balanced? How old arc we?
IV How many of us can read and write?
V Our mother tongue
VI The religions ,,'e follow
vn Scheduled castes and tribes
VIII Om main activitie~
IX Summing up
Basic Facts and Figures
11
35
81
93
107
117
127
139
155
165


Introduction Every covntyy takes a census of its population at
regular intervals. In India, a population census is taken everv ten vears. The 1971 Census ,vas the latest in the seri'es in 'India with a tradition of. a centurv of . )
organized decennial census. Every census provides an instahtaneous picture of the population as at the reference date and a series of censuses taken at regular intervals provide, so to say, a motion picture of the population, from ",Thich broad characteristics and general trends of the community can be assessed. After every census, a comprehensive picture of the population is presented in a General Report in which an elaborate and exhaustive analysis of the mass of data collected at the census is undertaken. More often than not, this results in a long delay in its publicatiori and the picture itself assumes the nature of an X-ray photograph useful to the experts but not popular with the public. As a landmark in the long tradition of Indian census, a popular version of the General Report-A POTtrait of Population-containing the basic characteristics of the population of Kerala State gathered through the 1971 Census is presented in this volume, leaving the more ambitious coverage of minute details to the General Report to be published after careful appraisal and analysis of the data.
In the United Nation's Handbook of PojJUlation Census 1\Jethods, a census of population is defined as 'the total process of collecting, compiling and publishing demographic, economic and social data pertaining, at a specified time or times, to all persons in a country or delim'itecl territory'. As such, census is the primary source of basic data for administration and
1

social and economic planning. The fixing of electoral representation depends on census results. The census questionnaire is so designed as to meet the ' demands for information on the part of governments, the general public and research organizations dealing with business, labour, industry, social security an( education. Basic data for study and research in th. field' of composition, distribution and growth of pOpl' lation are supplied by the census. Apart from the~ direct applications, it can be used as a frame for d. veloping other data collecting procedures and ched ing the accuracy and comparability of data collecte from other sources.
The word 'Census' is derived from 'Censere' Latin ,vord meaning 'to rate'. In this sense, censn..., is as old as human civilization itself. No society, ho," ever primitive, can be organized without assessing (' rating its resources in terms of men and materials. The number of workers ;:md taxpayers, and the number of persons liable to render compulsory military ser vice were matters of importance even in a primitive society. A kind of census, in some such sense, wa~ prevalent among the ancient Babylonians, Egyptian! and Chinese. The Greeks and the Romans had certainly made estimates of citizens, aliens, labourers or taxpayers lvhenever required. Census could not have been unknown to ancient India, which had a highly developed civilization as far back as the third or fourth millennium B.C. as revealed by the excavations' of Harappa and Mohenjo Daro. However, it was left to Kautilya (third century B.C.~ th' celebrated author of Artha Sasthra to deal with systematically as a matter of state policy.
The history of census in modern India begil with the estimates taken by the East India Compau from time to time of the population in its settlement{
2

,ifferent parts. of India in the seventeenth century. ~ purpose of th¢~e estimates was limited to defence uirements and the collection of revenue and taxes.
{tematic censuses were carried out from the begin'g of the 19th century, leading to the first Imperial jsus of 1871. The first census of the population a uniform basis throughout the country, providing valuable demographic record, was conducted in I and thereafter census. is being regularly taken ndia every ten years.
The census history of Kerala State coincides with of the erstwhile Madras, Travancore and Cochin
es. In ~f adras, census history is said to begin with ~stimate of population ot Fort St. George and
~JillageS aroun~l it taken if.l 1687. Th~reafter census~s
conducted 111 1802, 1826 etc. nIl the all-IndIa us of 1 tl71 known as the first lmperiat Census.
The Afernoir of the Survey of the TravancOTe Cochin States (1816-1820) by Lieutenants Ward Cenner may be considered as the first census re
F of Travancore and Cochin. After this, censuses _e conducted in both the States on several occa\s until the censuses of those two princely states also ::hronised with the Indian Census from the Imperial
'lSUS of 1881. The 1971 Census is the 11th decent census of India, the third after independence and second after the formation of Kerala State.
The Indian census has marched ''lith the times. las taken on its stride new and novel fields of entry, 'without losing its continuity and comparabir with the past censuses. A Population Data Com~tee was set up in 1944 to advise the Government of pia on the data relating to the growth of population. ;ie Bhore Committee set up for planning post-war .velopment in the field of health, recommended :lOng other thin~s, that 'the : population problem
3

should 'be the subject of continuous study'. The Census Act passed in 1948 has cast definite obligations on the public and the census officials and has given legal sanctity to the census operations in the country. From 1949 steps were taken to establish a permanent organization at the centre to deal with vital statistics and census under the Registrar General and ex ufficio Census Commissioner for India. vVith the Indian nation embarking on a new era of planned dcyelopmem, the organization expanded considerably during the 1951 Census. In the 1961 Census, a new feature was introduced in the form of ancillary studies relating to rural life, craft, fairs and festivals, socio-economic survey of villages and ethnographic surveys of selected communities. In 1971 tbe census questionnaire was modified to collecl more meful data on fertility, internal migration and economic activity. Ancillary studies now include an intensive study of about ~OO towns in the country, the re-study o{ a few selected villages and continuation of the ethnographic mrveys.
The system of census enumeration up to 1941 'was more or less on an ad ·/zoc basis. Yeatts, the famous Census Commissioner of India in 1941 compared the Indian CenSllS with a 'comet appearing once in ten years in the statistical firmament, attracting much attention at its culmination but passing away eventually unnoticed'. However, the Census Department has since then come to stay on a permanent basis. The Registrar General of Vital Statistics is appointed as the ex officio Census Commissioner for India. In the States, Superintendents of Census Operations (now designated as Directors of Census Operations) are appointed for conducting census operations.
It is in the interest of census organization to adopt as the smallest unit of territory for which statistical clata are to be presented, the smallest unit for
4-
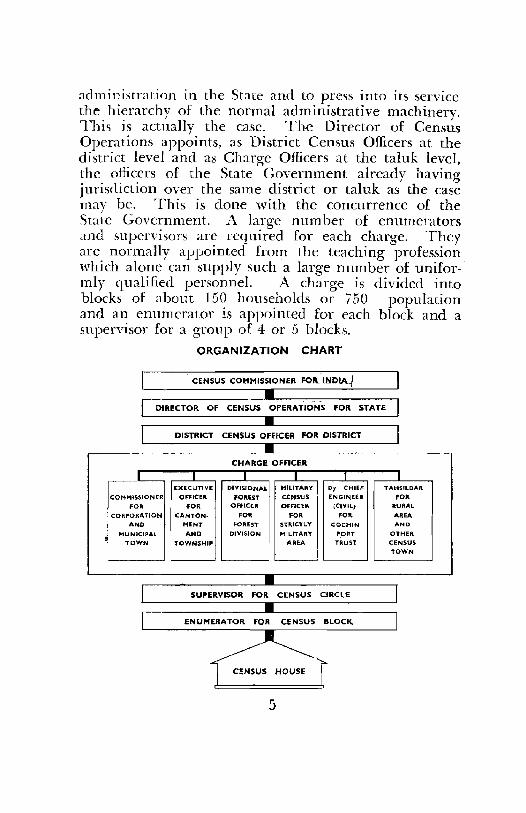
admini~tration in the State and to pre~s into its service the hierarchy of the normal administrative machinery. This is actually the case. The Director of Census Operations appoints, as District Census Officers at the district level and as Charge Officers at the taluk level, the officers of the State Government already having jurisdiction over the same district or taluk as the case may be. This is done with the concurrence of the State Government. A large number of enumerators and supervisors are required for each charge. They are normally appointed from the teaching profession which alone can supply such a large number of uniformly qualified personnel. A charge is divided into blocks of about 150 households or 750 population and an enumerator is appointed for each block and a supervisor for a group of 4 or 5 blocks.
ORGANIZATION CHART
. CENSUS COMMISSIONER FOR INOIA~
DIRECTOR OF CENSUS OPERATIONS fOR STATE
DISTRICT CENSUS OFFICER FOR DISTRICT
CHARGE OFFICER
I J I -EXECUTIVE DIVISIONAL H:lLITARV 0, CHIEF TAHSILDAR
COMH~SSIONfR OFfiCE'" .Oll15T C'E:NSUS ENGINEER FOk FOil fOR OFFICER OF-FIC'ER {CIVIL} RURAL
CORPORA.TION CANTON· FOR FOk FOk AREA
AND HENT FOREST STRICTt.Y COCHIN AND
MUNICIPAL AND DIVIS~ON MJLlTARY P_ORT Ol"HER
TOWN TOWNSHIP AREA TRUST CENSUS
TOWN
SUPERVISOR FOR CENSUS CIRCLE
ENUMERATOR FOR CENSUS BLOCK.
CENSUS HOUSE
5

There are two fundamental methods of enumeration called the canvasser method and the householder method. In the canvasser method which IS
followed in India, the canvasser or enumerator appointed for a specified area collects the information relating to each individual in the area by interviewing the head or any other responsihle member of the household to "which the individual belongs, and fills the census questionnaire himself. In the householder method, the questionnaire and instructions for filling them are distributed in advance to each household and the filled-in schedules are collected after the reference date of the census. In this method, though the census officials can be of some help, the primary responsibility rests with the householder and much depends on his level of education and civic responsibility. The level of literacy in India is still very low and hence the householder method cannot be introduced in the Indian Census in the near future. In India, the canvassers are selected carefully and given intensive training before they are sent out for actual enumeration.
In order to determine the distribution of population, every individual has to be enumerated either at the place where he is actually present on the census date, de facto) or at his usual place of residence, de jure. Variations of these hila methods are necessary in practice. A combination of both these methods is adopted in India. The duration of enumeration is two to three vieeks, though a particular date is fixed as the reference date. In order to ensure complete coverage and to avoid duplication, an indi"vidual who is away from his usual place of residence during the entire period of enumeration is left out and a visitor who is present during the entire period of enumeration at a particular place is enumerated at that place. Provision is also made to review the cases during the time
6

given for the revisional round, ·when information collected is revised to coincide with the position as on the reference date fixed for the census. Elaborate arrangements are also made to enumerate houseless persons, pilgrims, residents of hotels and rest houses and ·in· mates of hospitals, jails etc.
The enumerators, who have to visit every house allotted to them at least twice during the short period. of enumeration and revisional roun~ and the general public ·who co-operate with them by giving correct information, play the crucial roles in this national endeavour. Even with the best of administrative arrangements for collection, tabulation and publication of data, the quality of the statistics depends mainly on the response of the public. The success of the recent census operations is indeed a tribute to the willing co-operation of the public and the army of honorary census workers ·who performed their arduous duties with a rare sense of devotion and dedication. It is hoped that the long tradition of fruitful co-operation between the citizens and the census officials will be maintained and strengthened and that the statistics collected through the census will prove more and more useful to the administration and social and economic planning in our country.
The preparation of the census questionnaire, its exact ·wording and arrangement merit the most careful consideration. No amount of effort at the tabulation stage can make up for a poorly designed questionnaire. The questions should be free from ambiguity and should not in the least be offensive. Even minute details like the format, spacing, colour, type and quality of paper cannot be overlooked as they have far-reaching effect on enumeration and tabulation, whether manual or mechanical. In India, the responses to the questions have to be edited and coded and the Individual Slip is
7

also used as a sorting document. Hence the arrangement of questions, and the size and the durability of the slip are of great importance.
As for the questions themselves, the requirements of the crovernment and other users of census data have
'" to be taken into consideration. The 19'71 Census questionnaire ,vas framed after consulting the interested organizations and after several discussions with experts and pre-tests in the field from 1967. It must be admitted that it was not possible to accommodate the demands for information to the full extent from all quarters. The scope of the census operations had to be limited having regard to the size of the operation, the type of the enumeration agency and the response that could reasonably be expected from the public.
As a result of consultations at various levels and practical tests the follmving schedules were finalised and canv~ssed in the 1971 Census.
(i) Houselist
(ii) Establishment Schedule
(iii) Individual Slip
The canvassing of the Houselist was preceded by a systematic numbering of all census houses. The notional maps and layout sketches prepared in connection 'Ilith it gave a geographical frame for the smallest census unit. The information gathered through the Houselist also gave an advance estimate of the population from which the jurisdiction of an enumerator could be defined and the quantity of census forms required for the actual enumeration assessed. Most important of all, valuable data on housing, like the materials of the roof and wall of census houses,

the purposes for which census houses ,vere used, ,vhether the census households lived in owned or rented houses, the number of members in each household, and the number of living rooms in a census house, 'were gathered through this schedule. In addition, it was also ascertained and recorded whether the head of the household belonged to the Scheduled Caste or Scheduled Tribe. Special note was also made of households engaged in cultivation so that this information could form the basis of any future agricultura 1 survey.
Realising the importance of establishments,;l separate Establishment Schedule was canvassed in the 1971 Census to cover all kinds of estahlishments. The enquiry into the establishments covered such particulars as (1) ownership, whether government, quasigovernment, private or co-operative (2) the number of workers engaged (3) the nature of industry, whether household, registered or unregistered (4) the description of products, processing, or servicing (5) description of trade, 'ivhether wholesale or retail (6) the type of fuel or power used and (7) kind of service rendered in case of establishments like government offices, schools, hospitals etc.
The Individual Slip was the basic schedule canvassed universally for every individual in the 1971 Census. As much demographic, social and economic characteristics as possible of every individual '\lere attempted to be collected through this schedule. It contained seventeen questions. The main points on which information was collected were, name, sex, age, marital status, fertility, place of birth, short-term migration, mother tongue, literacy and level of education, religion, ethnic characteristics and economic activity.
The enumerator also prepared a Population Record for each household by grouping together
9

the members of the same household and copying the relevant particulars about them in a separate form from their individual slips. This could form the basis for studies and researches into the size and composition o£ households in the country.
The data collected in the 1971 Census will be tabulated, analysed and presented in a number of volumes to be published shortly by the Census Department. In this book only some of the basic characteris-
/
tics of the population of Kerala are presented in a simple manner. In the follGwing chapters, it is proposed to deal ,\·ith the size, distribution, gro'wth rate, sex ratio, mother tongue, level of literacy, ethnic characteristics and economic activity of the population of Kerala as reyealed by the 1971 Census.
10
CHAPTER I
How many are we ? How are we distributed
and by how much are our numbers growing?
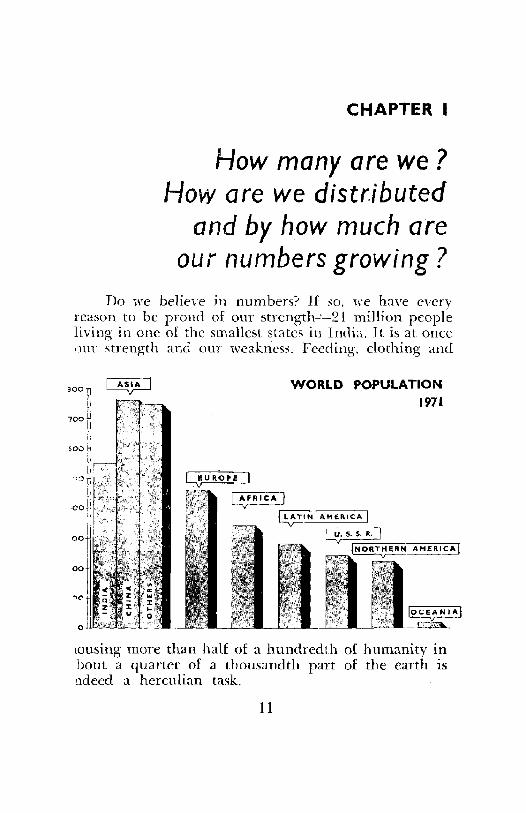
Do we believe in numbers? If so, ,';e have every reason to be proud of our strength-' 21 million people living in one of the smallest states in India. 1t is at once our strength and our weakness. Feeding, clothing and
BOO
700
WORLD POPULATION 1971
lousing more than half of a hundredth of humanity in bont a qnarter of a thousandth part of the earth is ndeed a herculian task.
11

i I'
KERALA ADMINISTRATIVE DIVISIONS
1971 .. .I' ~c :) 0) ~o .0
~:3-~-_~_:;:- _? r~ c ,0 '0 K "_~"'En.~
--_._ DI5TFi~C:T ElOu"OAPY
T"LUI< 8OLlN()AR'T'
ARAB!AN
SEA
.t,,,,
~,,--,-o,-,-,,-,,-.,,-"--~------------------_j"""--------------------~7'~"~----------~ . ,
II'
.0"
I 'I
r"~ 7f~J;!rC-"!AL 'U'f'S U ~[lU..J;"HJ<;l ' .. 'Q TH ~O. 10 ~ "JSU~~E '" T~l<f 'N..,L'IU\. 1oIIU!$ -.t:.~~~'~ H;O .. THE A ....... O~ ...... E B.HE LI~E ~ 4/.
12

Let us see where 1ye stand by comparison. India, by its size, population and position has the characteris· tics of a subcontinent. Out of some 3,710 million people in the ""orId, 548 million live in India. There is no country in the world except China which is more populous than our country. The population of U.S.A.,
90----
::1= 60
55
50
45
6 j ~,
i :z ; 30 o ;:: :l ~s '" .. o ..
• 0
15
10
o
o
" ..
13
POPULATION OF KERALA
COMPARED TO
OTHER STATES
AND
UN(ON TERRITORIES
1111 ••• -

U.S.S.R. and Japan has to be put together to equ~ that of India. One out of every seven people in th world is an Indian. One in 26 Indians is a Keralite.
Then, is our number so staggering as we arc led to believe? It is indeed so, when 'iNe consider the size of OLlr state. Even otherwise, ,ve are more numerous than the citizens of many independent countries in the world. Sri Lanka has only half our population, and S,A'itzerland, just one third. In fact, we stand on a par with Canada, Yugosbvia and Columbia in population. Among the staLes in India, Orissa with all extent of four times that of Kerala has almost only the same population. Uttar Pradesh, the most populous state. India, with more than seven times the area of Ken has only a little more than four times our populati.
\Vhy are 'we so overcrowded? Both history and geL graphy have played their part in the making of modern Kerala. Our territory is a narrow strip of land along the south-western coast of India between the \Yestern Ghats and the A.r3bian Sea. Its width varies from about 11 kilometres to 120 kilometres. While the mountains almost isolated it from the rest of Lndia, the sea proved a "\vindow on distant countries and cultures from ancient times. Though the width is small, we have a fairly long coastal line of about 580 km.
There is a colourful tradition about the ong] Kerala. Parasllrama, the legendary hero of many , is said to haye thrown his battle axe across the sea made the water recede up to the spot where it Ie tract of land thus rose from the sea from Gokarna' Kanyakumari in the south. A beautiful and pr+, gift of the sea! Only we wish our hero were str;;-and claimed more land for us! It seems that tht ... is trying to snatch the gift back by invading the \rVe are heroically resisting the attempt by bnilcl mighty granite 'walls at vulnerable places, Nowadays

, ;:,1 dy gives much thought to the unscientific ') mrama tradition. But it certainly supports the ''; :s that the sea once reached the foot of the ""'estern
;,ats and that Kerala was formed due to some seis".J~logical upheaval in the distant past.
1.5

Ancient Kcrab had cultural and trade contacts with the civilized countries of the world. Kerala was famous for it~ spices like pepper, cardamom and cinnamon and also for ivorv and sandalwood. I t is said that the shi ps of Assyria{ls, Babylonians and of King Solomon frequented Kerala coast for trade in spices. Adventurous travellers and learned philosophers of the 'world could meet their equals in onr land. It is believed that St. Thomas, the apostle of Christ, landed at Muziris (modern Kodungallm) in 52 A.D. and faun· ded seven churches in the Malabar coast. The Jews and Muslims too had their early settlements in Kerala. The landing of Vasco da Gama at Calicut in 1498, marked the beginning of a chain of historical events which led to the domination of different parts of Kerala by foreign powers. The princely states of Travancore and Cochin, managed to keep their identity by treaties \\"ith the East India Company while .i\hlabar became a part of the British province of Madras. After India became i nclependent Travancore ann Cochin State~ -were integrated into a single state in 1949. As a result of the reorganization of States in India on linguistic basis, a new SLate, Kerab was formed on ] st :Kovember 1956, by integrating the -Malabar district and Kasaragod taluk of the erstwhile 1\hdras State ,,·iih Travancmf'-Cochin State (excluding Tho· yala, Ag;astheeswaram, Kalkulam. Vilavancode and ShencoLtah taluh). The Slate thus formed has an area of 38,864 sq. km. and is bounded by :.\Jysore State on the north and north-east, Tamil Nadu on the east and south and by the Arabian Sea on the ,vest.
The land presents a picturesque variety of phy· sical features. The territorY falls into three natura] divisions, the highland, the midland and the lowland. The mountain ranges on the east varies in altitude from 900 to 2,400 metres and is covered for the most part
16
with dense forests. The hilly areas close to the mountain is called the highland. It is rich in plantations like tea, coffee, rubber and cardamom for which Kerala is juslly famous. The coastal fringe called the lowland is luxuriously covered by coconut palms and paddy cultivation. Stretching west,vard in gentle slopes, between the highland and the lmdand is the midland, rich in paddy, tapioca and spices.
The variety of climate is only matched by the variety of physi~al features. The c~ol bracing clImate of the highlands is in sharp contrast to the hot humid climate of the plains. But ,ve do not have unbearable extremes, thanks to the sea on the one side and the mountain-l,\Tall on the other side and rainfall spread
--
10<>
.. ::> '" "
... "
1: z '" " ..
"' '" '" 0:
t; '" .. :r 0:
:! s: .. i: I 0
~ J: " >- .. z ,.. ., > ::> 1: .. :r
17 2-1 Census/Kerala/73
:r :;!: '" "
DENSITY OF POPULATION
BY STATES 1971
~ w
" ~ Z " '" =<.
.. .. :I '" ~ ,. J: ~ l- v .. I '" <> .. " Z J: .. :< :r .. '" :r i
IU a: I: :r
<> z ~ .. ~
" z

almost evenly throughout the year. It is comparatively dry only from January to April. The forest-clad hills and the plains covered by coconuts and paddy cultivation giye the State the appearance of a Garden of Eden.
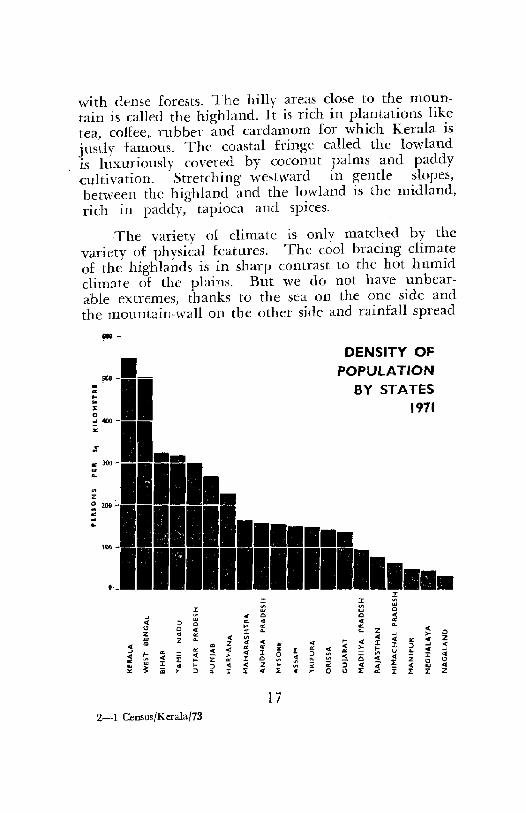
The problem of overcrowding can be appreciated better by finding the average number of persons per sq. kilometre of territory, the density of population. The area of our State is only 1.18 per cent of the area of the country but it has to support 3.90 per cent of the population of India. The density of population in India is 178 persons per sq. km. 'whereas in Kerala it is 549. There are 317 persons per sq. km. in Tamil Nadu and 153 in Mysore. ""Vest Bengal is our nearest rival with a density of 504. People in developed countries of the ,vorld have generally more living space. The density of population of the world is only 27. The U. S. A. and the C. S. S. R. have still less. Canada is so thinly populated that the density works out at 2 persons per sq. km.
\Ve know that all parts of the world are not equally habitable. There arc deserts, rocky regions, dense forests and regions "with severe climatic conditions that man cannot withstand. So it is only natural that all parts are not equally populated. Some areas can sustain a large population in reasonable comfort while in some other areas even a small population has to undergo severe hardships. Settlements in some parts of the earth are comparatively new. :\10re areas remain to be opened for habitation, "while some areas have reached a point of saturation. Ours is an ancient civilization. \Ve feel the pinch because our economic 'Progress has not kept pace with our increase in num .. bers over the decades. Still we should not think that ours is the only place in the world ,vhere so many have to live in so small an area.. There are some
18

areas-but they are only small pockets-which are more thickly populated than our state. Hongkong and Singapore are far more congested, with densities of 3,955 and 3,528 respectively.
"Ve have seen that the population is not uniformly distributed among the various countries of the world. In India also, this disparity is significant among the states. Kerala is about l~ times more densely populated than Nagaland. Even in such a small state as ours, the distribution of population is not uniform. Indeed it is not possible, as physical features and natural resources are not everywhere the same.
DISTRIBUTION OF POPULATION
BY DISTRICTS, 1971
PERCENTAGE
19

At the time of the 1971 Census, there were 10 districts in the State. The average population of a district in our state is 21.3 lakhs. In the whole country, the population-size of a district is much less at 15.4 lakhs. In Bihar, Tamil Nadu and ,"Vest Bengal the districts are more populous than in Kerala. IJ? Nagaland the average population of a district is as small as 1.7 lakhs. In a state like ours the area and the size of population of a district do not go together.
DISTRIBUTION OF AREA
BY DISTRICTS, 1971 PERI;ENTAGE
Equitable distribution of both area and population among the districts at the same time is an impossible ideal. Population is more or less balanced but inevitably there is a greater disparity in area among the
20
districts. In nine out of ten districts, the population is within a range of 20 per cent above or below the average population of a district. The solitary exception-Palghat district-is below this range in population size. The average area of a district is 3,886 sq, km. Only fIve districts fall \vithin the range of normal variation of 20 per cent. Two are above and three below this range in extent. The smaller districts are, as pointed out earlier, not necessarily less populous. Qnilon, the 1110St populous district, and Palghat, the least populous district are among the districts of more or less average extent. However population and extent are not the only factors considered in the formation of districts. Backward :1reas. or areas requiring special attention due to any reason, may stake· the claim for the creation of a new district. After the 1971 Census, the hilly areas of Kottavam and Ernakulam districts were 'constituted into' a new district called Idikki. This could have further narrowed down the disparity in extent and population among the districts of the State. It cannot be presumed that the last word has been said about creation of new districts, as administrative or developmental needs may favour the formation of still ~maller districts in future.
There were 56 taluks at the time of the 1971 Census. Four to eight taluks constitute a district. The average population of a taluk is 3.8 lakhs. Departure from the a\'erage is the rule rather than the exception. At the extremes, Kozhikocle taluk has a population of 9.4 lakhs and Koclungallur 1.1 lakhs. There are 9 taluks with a population of 5.5 lakhs and over and 10 taluks with a population of less than 2.5 lakhs each. The remaining 37 taluks have population ranging between 2.5 and 5.5 lakhs. Physical features of the State, age of settlements and potential for development are the main reasons for the uneven distribution of
21

population. The coastal areas of the State were colonized at an early date. Fishing, coil' industry, paddy cultivation and trade provided the settlers ,,:ith employment. But the habitable land is very limited. Backwaters, canals and paddy fields have to be left out and the remaining areas have almost reached a point of saturation. 'l'he fortunes of persons engaged in coir industr" fluctuate with uncertain demands from the foreign' markets. The midland which -was colonized later presents a picture of fast development in agricultural produce, mostly cash crops and spices. The hilly regions ",",'ere the last to be colonized. The pressure of population in the lowland and midland and opportunities of employment in rubber, tea and cardamom plantations in the hilly areas, induced the people to settle down in the high ranges. The taluks in the highest population size class are Tellicherry, Kozhikode, Ernad, Tirur, Trichur, ~'1ukundapuram, Quilon, Trivandrum and Neyyattinkara. Most of them are in the coastal and midland regions with early settlements. Kozhikode, Trichur, Quilon and Trivandrum are headquarters-taluks of the districts of the same name and well known centres of administration, trade and commerce. They are also in general highly urbanized. Three out of five cities in the State are in those taluks. The taluks in the least populous size class are North vVynad, Ponnani, Mannarghat, Kodungallur, Thodupuzha, Devicolam, Peermade, Kanjirappally, Kuttanad and Chengannur. Some of the taluks in this group are in the high ranges of comparatively recent colonization. On the other extreme, taluks like Kuttanad in the Imdand have also smaller population because backwaters, canals and paddy fields limit the habitable area.
vVe have alreadv seen that while 9 out of 10 districts in the State ~re within the medium range in population, only 5 districts are within the normal range
22

o II
o 10
I o!
9 '
MVSORE
ARABIAN
SEA
NUM8ER OF PERSONS
PER SQUARE ~ILOMETRE
F:)'-:;j 200,- U9
~ 350- 499
53 500-~49 _ 650-799
KERALA DENSITY OF
POPULATION,1971
: _ 800 AND ABOVE
~'_A_G_E,_5_4_9 ________ 4-__________________ L-~ ________ ~ 7S
c EAST OF GREENWICH 76°
o 10
R'\SED UPON SURVEY 0" IKDIA !lAP. THE TERRITORIAL WATERS OF INDIA EXTENT ;NTO THB ~ <l'O A DIHANCE OF 'TWELVE NAUTICAL MIL~ .. IEASURED FROM THE APFROPRIATE BASE UNE.
23
of variation in area. Hence a better idea of the settlement pattern in our state can be obtained by considering population densities of the districts and taluks. The density of population of the State, 549, !s the average of densities ranging from 326 to 1,128 III the districts. Using the same ~yardstick for comparing population and area and taking' a 20 per cent variation from the average as normal, ·we have only just three districts in the State in this group. They are Kozhikode, Malappuram and Quilon. The 'low density' districts also number three, they are Cannanore, Palghat and Kottayam. There are four 'high density' districts, Trichur, Ernakulam, Alleppey and Tri\·andrum.
Any further explanation is hardly necessary for the vanZltlOn in densities of population among the districts of the State. The physical features, history' or settlement and other factors which affect the concentration of population have already been discussed. Kottayam district which included the high range taIuks of Devicolam, U dumbanchola and Peermade at the reference date of the 1971 Census, has naturally the lowest density of population in the State. Alleppey district, constituted of the highly developed taluks in the lowland and the midbnd and with no hilly or forest areas. is the most densely populated district i~ the State. N~ wonder that Ernakulam and Trivandrum districts are also in the high density group, the former being in the forefront of industrialization and the latter holding its OIvn as the district with the capital city and institutions of regional importance.
Some districts at least are formed of taluks of high and low densilies. Hence ~variations in densities wlli be more pronounced if ,Ne consider taluks individually. Some taluks aloe wholly within the sparcely populated hilly regions and some within the thickly populated lowlands and midlands. Cochin on the
24

one extreme has a density of population of 2,817 persons per sq. km. and Devicolam on the other extreme has only 76 persons per sq. km. There are 5 taluks with less than 200 persons per sq. km. and 7 taluks with a density of more than 1,500.
Perhaps a more realistic picture of the pressure of population can be obtained by considering the population in relation to the cultivated area. Only about 56 per cent of the area of our state has been brought under cultivation, and chances of more areas being brought under cultivation are remote, as practically no cultivable land is kept idle. The density of population is 983 persons per sq. km. of cultivated land. Districts show wiele variation in density ranging bet- . ween 593 in Palghat and 1,535 in Trichur. Jammed into a narrow coastal strip, hemmed in on one side bv the vVestern Ghats and on the other side bv the Arabian Sea, our state is crowded by more th~n 21 million of us, living in less than two-thirds of the area of the State. However our visitors do not think so, as ,ve do not live huddled together in crO'wded streets. \Ve live as far as possible in isolated houses 'with their own compounds, at the cost of valuable agricultural land fragmented into house sites, Still are we living in reasonable comfort? Hardly so, when we consider the housing shortage. Next to food and clothing, a roof over the head is the least that a man should haye, as a matter of right. Preliminary to the 1971 Census, all the houses in the State were numbered and listed in 1970. Thus we are in a position to knmv the housing conditions in the State. A house, in the census terminology, is a building or part of a building having a separate main entrance from the road or common courtyard and used or recognized as a separate unit. It can be used for residential or any other purpose. Schools, offices, temples, factories, jails and hospitals are all census houses.
25

1Ve are no,,>' interested in knowing about the living Iditions of our people. Let us see whether the lSUS can throw any light on this aspect of our enirv. It can, as separate listing of residential and [1-~esidential houses was done. In an occupied resi-1tial house one or more households may live. A ~lsehold is a group of persons who commonly live toher and take their meals from a common ki tchen less the exigencies of work prevented any of them m doing so. Normally there will be only one houseld living in a hOllse. If many households share a LIse, it is indicative of a housing shortage. l\iem-s of a household are often related by blood. But Te can be households of unrelated persons. Inmates boarding hOllses, hostels, orphanages and ashrams . examples. They are called institutional houseJcJs.
According to the census, t)lere <lre :1,418,2·1-4 occu~d residential houses in our state accommodating 43,129 households. In other words for every 100 :upied houses there are 104 households. A census use can be just a one-roomed hut or a palatial bunga{. The vast majority of our houses lack in modern enities. Even bath-rooms and latrines are luxuries (ond the means of an ordinary household in Kcrala. le strength of an average household in our state is '3 but each house has to accommodate on an average '5 persons. In 1921, the number of persons per :upied census house was only 5.37. Evidently there more congestion now. There are slight variations the strength of households among the districts, from 6 in Palghat to 6.40 in Cannanore. The strength the household is generally higher in the urban areas III in the rural areas. The urban areas of.Kozhikode triet has on an average 7.10 persons per household, the ~hest in the State.
26

27
million 111 1986. During the corresponding years, the population of Kerala would be 27 million and 29 million respectively. Nobody claims accuracy in such predictions but even a rough estimate is very useful. According to the Expert Commi ttee' s projection, the population of India in 1971 was 561 million. But the actual population was found to be only 548 million. In the same way the projected population of Kerala was also higher than Lhe actual by about 5 lakhs. Three reasons can be given for the gap betv\Teen the projection and the actual count. Firstly the projections were too high because mortality rates did not fall down to the very low level (14 per thousand in 1968) assumed in preparing them. Secondly the assumption of a constant general fertility ratio through 1966 and a fa 11 of 5 per cent during the period 1966-70 did not prove to be correct. On the other hand the actual drop ",vas more than 5 per cent. A third factor may be the extent of under count in 1971 Census. The Post Enumeration Check conducted soon after the 1971 Census has revealed that for every 1,000 persons actually enumerated in the country the true number lies between 1,014 to 1,019. The Southern States show the lowest net under count, the actual number of persons per 1,000 censused individuals varying between 1,009 and LOI5.
The trends in the population growth of India and Kerala can be understood by considering the decennial population figures from 1901 to 1971.
It 'NiH not be correct to presume that the population of the world has been steadily increasing all the time. Census figures tell a different story. There has been set backs due to wars, revolutions, and epIdemics. In India between 1911 and 1921 there was actually a decrease in population and during the
30
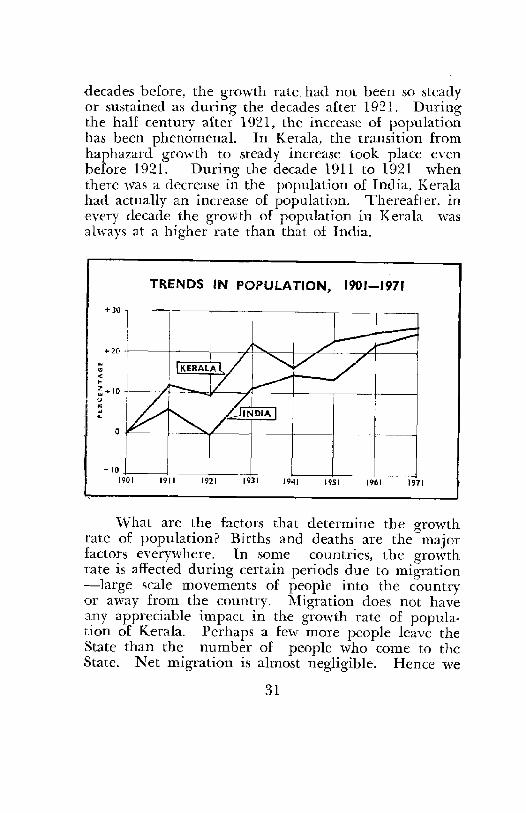
decades before, the growth rale. had not been so steady or sustained as during the decades after 1921. During the half century after 1921, the increase of population has been phenomenal. In Kerala, the transition from haphazard growth to steady increase took place even before 1921. During the decade 1911 to 1921 ,,,,hen there was a decrease in the population of India, Kerala had actually an increase of population. Thereafter, in every decade the growth of population in Kerala ,;vas alv{ays at a higher rate than that of India.
"' ..
TRENDS IN POPULATION, 1901-1971
+30 I
-IO~ __ ~ ____ ~ ____ ~ ____ ~ __ -+ ____ ~ __ ~ 1901 1911 1921 1931 1941 1951 1961 1971
"What are the factors that determine the growth rate of population? Births and deaths are the major factors everywhere. In some countries, the growth rate is affected during certain periods due to migration --large scale movements of people into the country or away from the country. Migration does not have any appreciable impact in the growth rate of population of Kerala. Perhaps a few more people leave the State than the number of people ''''ho come to the State. Net migration is almost negligible. Hence we
31

may consider the growth rate merely as a function of births and deaths. There can be several possible combinations of these two, which can be high, low or moderate. In India both birth and death rates were high
GROWTH OF POPULATION
IN KERALA, 1901-1971
1901 ttttttt 1911 tltttt" 1921 tllttltt 1931 tttttttttl 1941 tlltttttttt 1951 tttttttttttttt 1961 ttttttttttttttttt 1971 ttttttttttttttttttttt,
EACH ''' .... BOl REPRESENTS ONE MILLION PERSONS
and they continue to be so but for a slight reduction in mort~lity rate. As "Ire know medical knowledge is more freely and universally shared than technical
32

knowledge. Hence we have taken long strides in the eradication of epidemics which used to take a large toll of life from time to time. Hence eluring recent times, especially after 1921 large scale deaths due to plague, malaria and other epidemics have been averted or controlled. This, more than anything else accounts for the steady gro'wth of population since 1921. In the Travancore and Cochin areas of Kerala State, effective public health measures were introduced even earlier than in other parts of India. Hence the accelerated growth rate began in Kerala even before 1921. lNe have already seen that the projected population of lndia and Kerala 'was higher than the actual population in 1971. This is because the death rates due to normal causes did not come down to the extent anticipated by the Expert Committee.
In the absence of migration, the increase of population is the difference between the births and deaths. There are arrangements for registering births and deaths in the country. Therefore· it is theoretically possible to assess the growth rate from registrations and it should agree with the figures revealed at the decennial censuses. However, due to imperfections in the registrations these figures seldom agree. There is considerable under registration of both births and deaths. This has been detected through the Sample Registration Scheme introduced in selected urban and rural areas. Though the absolute figures may not be quite reliable the natural increase of population, as the difference between registered birth rates and death rates from 1921 onwards shows certain si~nificant trends.
The birth rate is fluctuating but there is a tendency for declining though not very appreciably. But the death rate is slowly but surely declining. The net result is a high growth rate in population.
33 3-1 Census/Keralaj73

Census has revealed, as could be expected, a still higher growth rate of population. Its impact on the economy is obvious. The density of population of Kerala was only 165 persons per sq. km. in 1901. By 1971 it has gone up to 549.
Our ancestors in 1901 had a share of 0.61 hectare of land per head. Today, each one of us has only one-third of that share.
During the seven decades from 1901 to 1971 all the districts in Kerala registered sustained increase of population. The constituent parts of the present Kerala were not affected much even during the decade 1911-21 when there was actually a decrease of population in India. In Travancore and Cochin areas the set back 'ivent off unnoticed while in Malabar area the growth rate was small. During the decade 1961-71, all the districts maintained a high rate of increase of population, Malappuram reaching a record of 33.S per cent. Alleppey district 'ivhich has the highest density of population in the State may almost be said to have reached the saturation point. The rate of growth "las lowest in Alleppey. It is possible that more people migrate from coastal areas like Alleppey to the midlands and highlands.
34

CHAPTER II
Villa~e dwellers and tov{n dwellers
How close are we to nature? It depends on where we live, in a remote village or a busy town. They are in certain respects totally opposed to each other. In the urban world man made environment predominates over the natural. Instead of the sweet music of the early birds one may hear the shrill noise of a siren performing its duty with monotonous regularity. In the rural areas people generally lead a simple well ordered life 'far from the madding crowds ignoble strife'. They are satisfied to follow the well-trodden path of their forefathers in earning their livelihood and fulfilling their social obligations. They are proud of their traditional calling and jealously guard the secrets of their trade. There is no fierce competition among them. They share their joys and sorrows with their neighbours. Life is more adventurous and more compli(:ated in a town.
Physical differences between rural and urban areas may become less sharp but social customs die hard. Most of the people in rural areas are cultivators whose families are also content to follow the same occupation. In the urban areas occupations are mainly non-agricultural and members of the same family may follow different types of non-agricultural occupations. Rural communities are small, scattered but
35

homogeneous. Urban communities are large, heterogeneous and quick to adopt new and noval ideas. Mobility, both occupational and terrestrial, is an integral part of urbanization. Contacts of urban population are frequent, but impersonal, casual and shortlived. Among the rural population contacts are less frequent but more personal and lasting.
Are there places which may be termed strictly rural? Are they not becoming urbanized? "Then we speak of a rural area, the picture that comes to our mind is a cluster of houses surrounded bv vast areas of arable or barren land and having poor -communica· tions with the next settlement. In other words, a small communitv, isolated from other commumtles,
J
and more or less self-sufficient in its day to day needs, is an ideal rural society. There is little interference from outsiders provided they pay their taxes. Even disputes and offences of a minor nature are disposed of locally by the elders who have the moral authority to carry out their decisions.
;
Kerala villages have little resemblance to the villages in other parts of the country and the world. Our settlement pattern admits of no isolation. The boundaries of village administration are not apparent to the people and even if they are, they seldom act as barriers to human relationship. In our rural areas, there is no necessity for the people to huddle together in tight, squalid settlements. Neither the fear of man nor of nature has forced the i\.falayalees to live in rows of houses in a street or build fortIfications round their settlements. \Ve feel that this is the most natural way of living. But listen to the remarks of our visitor~. One scholar has this to say. 'Their villages are the most open in the world, with, the possible exception of Malayan Kamponge; the dwellings are scattered wherever there are trees to give them shade, and with
36

37
- ~. --<A~ TOWN •
<DWE~LERS :

so little sense of the need to concentrate around a focal point, that the stranger is at a loss to know where one community ends and the next begins, in the broad ribbon of settlement that runs, broken only by a few stretches of stony "wasteland, almost all the three hundred miles from Cannanore to Trivandrum'
Due to the peculiar settlement pattern, the difference bet\-Ileen the rural and urban areas in our state is not so pronounced as in other states in the country. Except for a few highland villages, l\'ith poor communication facilities, the villages in general are not very backward and the Wwns still preserve something of their natural beauty.
Rural areas are being urbanized and the urban centres are expanding their jurisdiction. It is no doubt, a sign of progress. The positive influences of urban areas cannot be over emphasized. They playa dynamic role in the social, political and economic life of the State. Social movements to fight against evils of certain traditional social practices, and political movements for independence and self-government had their origin in the towns. Industries located in towns contribute to the economic progress.
Urbanization in Kerala has not followed the same pattern as in the developed countries. In those countries industrialization preceded urbanization ","ith the result that the basis of economy became predominantly non-agricultural before urbanization. But here industrial growth has not kept pace with urbanization. Many of our towns cannot be called industrial or commercial. Concentration of educational and other institutions and administrative offices has contributed more tmvards urbanization than industrialization
/
In many cases.
38

The tendencv all over the world is that the urban population is in~reasing at a faster rate, than rural population. This is understandable as migration to the towns is always taking place due to various reasons. People who retire to the countryside in search of peace and quiet are comparatively few. Modern amenities of life, better educational and medical facilities and a greater variety of employment opportunities are but a few of the attractions that drmv people to the tmvns. In ,many of the developed countries the proportion of rural population is actually dwindling. I t is estimated that 'between 1920 and the year 2000, the ,vorld's total population 'would grow more than three-fold, its urban population nearly nine-fold, and its rural population would double'.
It is customary to divide the people into rural and urban at every population census. The definitions of the terms 'rural' and 'urban' change from period to period and from country to country. In simple terms urbanization is a 'process of population conc(.ntration' but the transitional stage from rural to urban is hard to recognize. Hence some places get the administrative status of towns only long afteT they cease to be rural. From the beginning of the present century the Indian census recognized as urban areas, every municipality, all civil lines outside municipal limits, every cantonment and other places with a population of not less than 5,000 and possessing urban characteristics. Places having special status as municipality or cantonment presented no problem_ But many places which claimed the status of a town on the basis of population did not have predominant urban characteristics because they were essentially agTicultural areas. This concept of the town was more or less followed up to the 1951 Census. The recognition of municipalities, cantonments and civil lines as urban areas, was upheld in the 1961 Census also but further
39

tests 'were introduced in the case of other places with a population of more than 5,000. They were, that the density of population should be at least 400 persons per sq. km. and that at least 75 per cent of the male working population should follow non-agricultural occupations. Under these conditions also, the Director of Census Operations in each state could use his discretion in declaring a place as a census town in consultation "\\-ith the State Government concerned depending on the degree of urbanization of the place. This concept of a town was adopted in the 1971 Census also.
RURAL. URBAN UNI-TS
There is no universally accepted definition of a town. It changes from country to country but urbanization as a process of population concentration is accepted by all. In the United Kingdom, the area classified as urban for local government purposes is considered as town in the population census also. In France, communes containing an agglomeration of more than 2,000 inhabitants living in contiguous
40

houses or with not more than 200 metres between them and communes of which the majority part of the population is part of a multi-communal agglomeration of this nature, are taken as urban. Cities and urban type localities officially designated as such by each of the constituent republics, usually according to the criteria of number of inhabitants and predominance of agricultural or non-agricultural worktTs and their families are recognized as urban in the U.S.S.R. Sri Lanka leaves no discretion to the census organization. The areas statutorily declared as coming under the purview· of municipal, urban, or to"wn councils alone are recognized as urban.
According to the 1971 Census only ~\.47 million people in Kerala live in towns. They form only 16.24 per cent of the population of the State. In the whole country town d"\\'ellers form 1 ~1. 91 per cent of the population i.e. a little less than one-fifth of the total population. Compared with the developed countries of the world, urbanization is rather slow in India. According to the latest estimates 78 per cent of the population in United Kingdom in 1970 was urban. The urban population (as per the 1960 Census) of United States ,vas about 70 per cent. U.S.S.R. and Japan are also far ahead with 56 per cent and 68 per cent of urban population in 1970 and 1965 respectively. 19 per cent of the population of Sri Lanka was urban in 1963. Among the various states in India, Kerala does not occupy an enviable position in urbanization. Maharashtra, Tamil Nadu, Gujarat, ,,,-rest Bengal and 1\Iysore are far ahead of our state. In ylaharashtra 31 per cent of the population li've in urban centres. There are of course less urbanized states, in Orissa, only 8.4 per cent of the population are town dwellers. vVhat is the, reason for our backwardness? It is not that the density of population is low but the basis of economy in many thickly populated areas is
41
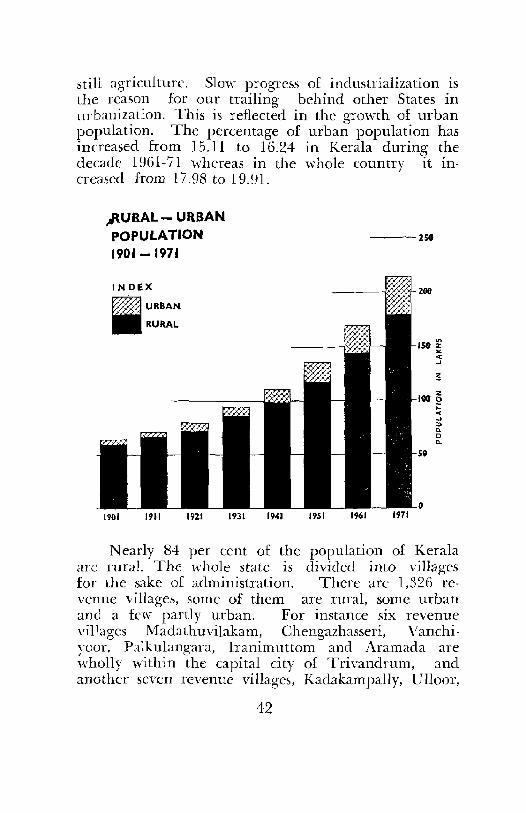
still agriculture. Slow progress of industrialization is the reason for our trailing behind other States in urbanization. This is reflected in the growth of urban population. The percentage of urban population has increased from 15.11 to 16.24 in Kerala during the decade 1961-71 whereas in the whole country it increased from 17.98 to 19.91.
,.RURAL - URBAN POPULATION 1901 - 1971
INDEX
I, URBAN
RURAL
1901 1911 1921
---250
1931 1941 1951 1961 1971
Nearly 84 per cent of the population of Kerala are rural. The whole state is divided into villages for the sake of administration. There are 1,326 revenue villages, some of them are rural, some urban and a few partly urban. For instance six revenue villages Madathuvilakam, Chengazhasseri, Vanchiyoar, Palkulangara, Iranimuttom and Aramada are wholly within the capital city of Trivandrum, and another seven revenue villages, Kadakampally, Ulloor,
42
Chettivilakam, Randamada, Anchamada, Cheruvakkal and Muttathura are partly within its limits. Of the 1,326 revenue villages in the State 58 villages lie wholly and 136 villages lie partly in the urban areas. J\lore revenue villages are becoming parts of towns such as municipalities and. corporations. The rural areas, though certain pockets have been declared as census towns in view of their predominant urban characteristics, are within the jurisdiction of Panchayats. The rural areas present a continuous expanse of isolated houses. Each family likes to live within its own ancestral holding, separated by an earthen "wall or at least a fence. The villages are usually very large compared 'with villages in other parts of the country. They have subdivisions known as 'kara' in Travancore, 'muri' in Cochin and 'desom' in Malabar areas of the State.
Because of the diversity in the physical features of the State and due to other reasons, there is no uniformity in the size of the villages. There is still greater disparity in the distribution of population even among the rural villages. Even a comparison i~ only of doubtful value because some revenue villages remain wholly rural 'while some others are urbanized to various extents. The population of Poonkunnam, a village in Trichur district is only 13, whereas the population of Kalkoonthal village in Udumbanchola tal uk is 63,466. The average population size of a village is 14,102. The population size of a village is below the State average in Trichur, Palghat and Cannanore districts, not because they have less rural population but because they are divided into a larger number of villages than in many other districts. Quilon has the largest rural population, 22.2 lakhs living in 98 villages. ::--Jext comes Cannanore with a rural population of 20A lakhs living in 178 villages. Though the rural population of Trichur is less at 18.8 lakhs they live 111 229 villages. Hence the
43

average population of a village is Imvest in Trichur district. Kottayam has a rural population of 18.7 lakhs spread out in 101 villages. Due to a greater degree of urbanization, Ernakulam, Kozhikode and Trivandrum districts have smaller proportion of rural population than the other districts.
At the luwest level, the participation of the representatives of the people in administration is ensured through the panchayats. In our state, in many cases, the revenue villages and panchayats are not co-terminus. However in the 1971 Census a special effort ,,,as made to give census data panchayat-'Nise as well. At the time of the census there were 951 panchayats in the State. Panchayats, being mainly concerned with rural areas their set up should give us a better picture of rural life.
There is 110 uniformity in the population size of the panchayats in the State. :\1unnar Panchayat in Devicolam taluk has a population of 65,570 \'lhile Vattavada in the same taink has only a population of 3,038. The number of panchayats in a district is not proportional to the rural population of the district. Quilon has the highest rural population but it is Cannanore 'which is having the highest number of panchayats. The average population of a panchayat in the State is 19,872. It differs widely from district to district. Quilon has the highest average population per panchayat, ,vith over twenty-three thousand_ In the State there are two small panchayats "Tith less than 5,000 population and 81 huge panchayats with over 30,000 population. Between these extremes there are 32 panchayats with a population between .? and I 0 thousand, 509 in the 10 to 20 thousand range, and 327 in the 20 to 30 thousand range. The larger panchayats are distributed in all the districts, Quilon having 17 and Palghat having 3 of them. As panchayat administration is strengthened a reorganization
44
with a more equitable distribution of population among the panchayats is bound to take place.
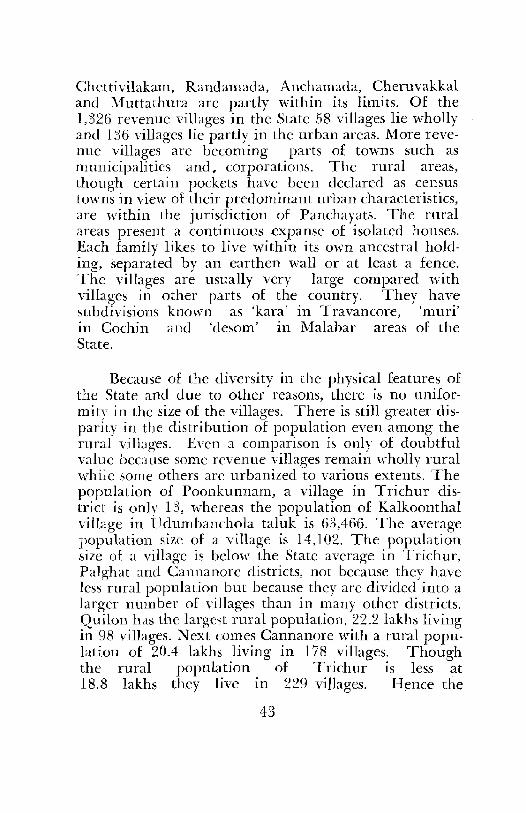
Let us now turn our attention to the urban population. Though they are in a minority forming only 16.24 per cent of the population of the State, they are more vociferous and influential and supply most of the leaders in politics and administration. The recognized urban areas of the State consist of three corporations, 27 municipal towns, one cantonment,
URBAN POPULATION
BY OISTRICTS, [971 PERCENTAGE
one to"\n1ship and 56 other census towns. The corporations, municipal towns, cantonment and township are it)so facto urban areas. But the other census towns, 56 in number, are recognized as urban only on the
45

KERALA CENSUS TOWNS
1971
ARABIAN
SEA
@ CORPORATION I MUNICIPAL TOWN
a CANTONMENT ITOWNSHIP
• OTHER CENStiS TOWN
46

basis of the concept of a tmm adopted in the census and they are parts of rural areas under the jurisdiction of the T ahsildars. However some of them have been constituted as municipal towns after the census. \Ve can presume that most of these census towns are potential municipal towns awaiting ad· ministrative recognition and already possessing urban characteristics. Of the urban population, about 11.8 lakhs live in the 3 corporations, 12.5 lakhs in the municipal towns and 10.2 lakhs in the other census towns. The population of the cantonment and the township together is only 20,613.
India, as we have already seen, lags behind the more developed countries in urbanization. Among the states in India Kerala is less urbanized than manv others. The reason is that the industrial growth ha's been slow and halting. There is wide disparity in urbanization among the districts. "'While 27.56 per cent of the population of Ernakulam district is urban, only 6.73 per cent of the population of Malappuram is urban. Urbanization is closelv linked with industrialization. Ernakulam is in a~ enviable position. The presence of many of the"' largest industrial undertakings in Kerala at Alwaye and Kalamassery areas of the district and the availability of excellent import and export facilities in Cochin port, have made it the most industrialized district in Kerala. In Trivandrum district 26 per cent of the population are town dwellers. The special advantage of Trivandrum district is that it has the capital city, with a large number of administrative offices and educational institutions affording opportunities for employment in non-agricultural occupations. Kozhikode, Alleppey and Cannanore districts have also got fairly large urban population due to a higher degree of industrialization and concentration of government offices and commerce and trade. Non-agricultural employments in coir industry
47

in Alleppey and handloom industries in Cannanore hilve contributed towards the urbanization of these districts, though these traditional industries are often in difficulties. Quilon, Kottayam, Trichur and Palghat districts are predominantly agricultural and hence the urban population is comparatively small.
A district consists of 4 to 8 taIuks, of varying degrees of urbanization. The taluks, themselves, being smaller units present a better picture of urbanization. Some taluks are in the forefront ,,,,hile some others are untouched by the process of urbanization. Cochin and Trivandrum taluks have 60 per cent of their population urban, and Kanavannur and Kozhikode are also not far behind with more than 50 per cent of their population urban. Cochin and Kanayannur are part of the Cochin Corporation, the most populous city in Kerala. Trivandrum, the capital of the State and Calicut, the district headquarters, are "well known centres of administration and trade respectively. Rapid urbanization is taking place in these taluks. It is strange but true that 11 taluks in the State are still entirely rural. They are North \\'ynacl, South vVynad, Alathur, Kodungallur, Udumbanchola, Peermade, Kuttanacl, Karunagapally, Kunnathur, Pathanamthitta and Kottarakara. These represent the two extremes in the physical features of the State. Some are in the forest-clad hilly regions, sparcely populated and having poor communication facilities. Others are in the luwlands lvith more paddy lands and backwaters than habitable areas. Both these regions are therefore bound to be slow in urbanization.
The urban population of Kerala is distributed among 88 towns of which 56 are 'census towns', without separate administrative set up. The population of the least populated town is 4,382 and the most populated citv is 439,066. Hence a classification of towns according to the size of population is necessary. In the census,
48

to\H1S with a population of 1 lakh and above are taken as Class 1, those between 50,000 and 1 lakh are taken as Class II, between 20 and 50 thousand are taken as
u.. o
TOWNS BY SIZE OF POPULATION, 1971
CLASSIFICATION OF TOWNS
PROPORTION OF POPULATION
TO TOTAL URBAN POPULATION
= - ::; > >= '" VI '" <II III :::! '" .., ... <II III <I[ :5 :5 « « <I[ ... ... .... ..... u u u u u u
Class III, and between 10 and 20 thousand are in Class IV. In addition, small tovvns 'with a population between 5 and 10 thousand are included in Class V and those 'with belmr S,OOO are included in Class VI. In Kerala there are :=; Class I tmms, 7 Class II towns, 40 Class III
49 4-1 CensusiKeralaJ73
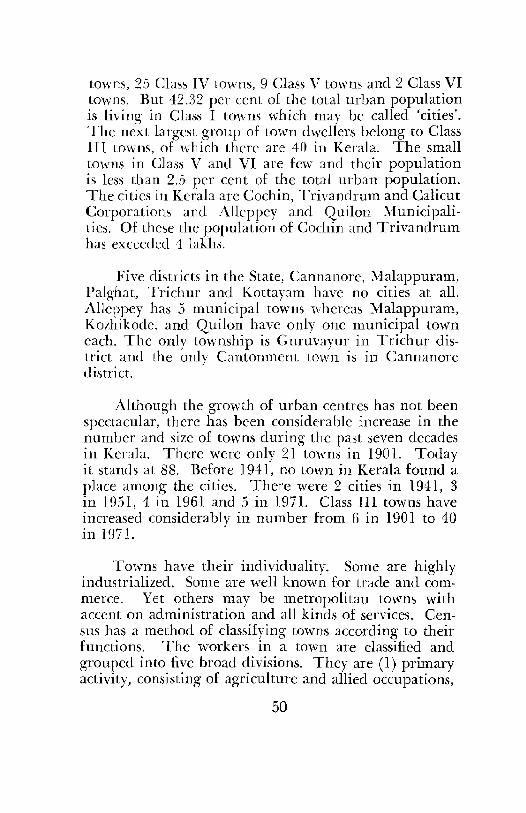
towns, 25 Class IV towns, 9 Class V towns and 2 Class VI tuwns. But 42.32 per cent of the total urban population is living in Class I towns which may be called 'cities'. The next largest group of town dwellers belong to Class III towns, of which there are 40 in Kerala. The small towns in Class V and VI are feiv and their population is less than 2.5 per cent of the total urban population. The cities in Kerala are Cochin, Trivandrum and Calicut Corporations and Alleppey and Quilon :\lunicipalities. Of these the population of Cochin and Trivandrum has exceeded 4 lakhs.
Five districts in the State, Cannanore, :\hlappuram, Palghat, Trichur and Kottayam have no cities at all. Alleppey has :5 municipal towns whereas Malappuram, Kozhikode, and Quilon have only one municipal town each. The only township is Guruvayur in Trichur district and the only Cantonment town is in Cannanore district. '
Although the growth of urban centres has not been spectacular, there has been considerable increase in the number and size of towns during the past seven decades in Kerala. There were only 21 towns in 1901. Today it stands at 88. Before 1941, no town in Kerala found a place among the cities. There were 2 cities in 1941, 3 in 1951, 4 in 1961 and 5 in 1971. Class III towns have increased considerably in number from 6 in 1901 to 40 in 1971. '
Tovms have their individuality. Some are highly industrialized. Some are well known for trade and commerce. Yet others may be metropolitan towns with accent on administration and all kinds of services. Census has a method of classifying towns according to their functions. The workers in a town are classified and grouped into five broad divisions. They are (1) primary activity, consisting of agriculture and allied occupations,
50

(2) industries, (3) commerce, (4) transport and (5) services. Of course no town can have workers of one group alone. But one or a combination of two or more groups will predominate and that will decide the primary function of t,he tGwn. If one group of 'workers forms 40 per cent or more of the total number of workers, then the town ,vill be designated with the function to which that group of \\'orkers is associated. Thus the functional category of a town can be primary activity, industrial, commercial or service depending on which of these groups of workers form 40 per cent or more of the total workers. But one group alone may not be able to muster sufficient strength to form 40 per cent, in which case the next predominant group is also added. If together they form atleast 60 per cent of the 'workers, then the town will be knnwn by both functions such as service-cumindustrial. pJ:ima;y activity-cum-commercial and so on.
There is only one city in the State which can be described by one 'function' alone. This is T rivandrum city under 'the functional category 'service', In other words more than 40 per cent of the workers in Trivandrum city are engaged in 'other services' which consist mainly of white collar jobs. This is typical of a metropolitan city which is not noted for large scale industries, trade or commerce.
In the case of both Calicut and Cochin, industry and commerce have to be clubbed with services to describe their functional category and they are classified as 'service-cum-industrial-cum-commercial'. Alleppey and Quilon belong to another category 'industrial-cumservice-cum-commercial' . Among the small towns some are in the functional category of 'primary activity' and a few are 'industrial'. But 'primary activity' is also one of the constituents of multiple functions of many more towns.
51

The CItIes of our state deserve special study. In the population censlb they assllmed importance only because the~~ arc tml"l1S wilh a population of above one lakh. But their importance does not rest on numbers alone. These tuwns hayc played decisive roles in the historv of the State. They are all maritime cities ,d1ich' had oll1lact \\'ith th~ outside 'world hom "cry ancient times and they ha\ e profoundly affected the destillY 01 the ,dlOle slate. Hence 'we may examine their gt,O',,·th and de\'elopment in greater detail.
COCHIN
Cochin i~ the most populous and the most extensi \ e city in Kerala. It has stolen a march over T ri valldrum, the capital of the State, W11ich was until recently the largest city in the State. In the 1961 Census, the
CUCl[[]\"-A VIEW FROY[ TH£ BACKWATERS
52

main cOllstituclllS of the pre,em Cochin Corporation, namelv, ErnakuLtm, ",Iatlancherry and Fort Cochin -were s'~par<ltc municipal tm015. A~eording to the 1971 Census, Cochi n Corporal iOll has a population of over four bklis.
It i~ strange thal Cochin the most important port of moderll Kerala, is not mentioned by ancient tr<lyellers and writers like Pliny, Ptolenl\, ~larco Polo and Ibn Batura. ~\ pLlUsible c,,-!;lanarion is that Cochin Port was formecl onh ill 1:;·11 A.D. \\'hen clue to heay)' Rood in the Pcriy:n', [he ancient port of "rUliri~ (Kodurlgallur) got silled up. \\Tilh the :tlTi\al o~ the Portuguese the port came into prominellce. TIley first came to Cochin in ];")00 A.D. and the ruler of Cochin received them 'with open arms and allowed them trading rights. The Portuguese ill rum helped the ruler to defend Cochin against lbe frequent attacks of the Zamorin. TOIrards the close of the 17th century the Dweh ousted the
CHIXESE F!SHI?;G XETS
53

Portugnese from Cochin. 'rhe kings of Cochin extended their friendship to the new power also and remained steadfast in the alliance until the English drove the Dutch away in 1,96.
The port of Cochin known as the 'Queen of the Arabian Sea' is one of the most important major ports on the -western coast of India. By the siele of the port, is \Yillingdon Island, a man-made island reclaimed by the soil dredged for deepening the port. The harbour is connecteel \\ ith the mainland by rail, road and backwaters.
Fort Cochin was the oldest European settlement in India. The Portuguese built a fore there and it was destroyed by Lhe Dutch. Vasco da Gama ,';as buried in the St. Francis Church here, the olcle~t European Church in India.
The ~ratlanchern Bazaar is one of the most uuwded commercial centres in the State. Trade in pepper, ginger, cardamom, copra, coir, tea, coffee, rubber and other produces of Kerala is carried on here. :\1attanchcrry is one of the oldest Jewish settlements in Indi3. The 'jei\' TOim' lies to the south of :Mattancherrr Boat Jetty, The Jews are said to hai'e migrated from Cranganorc to M attancherry, to esc3pe the persecution at the hand~ of the Portuguese. The white Jews' Synagogue is a major tourist attraction, enriched by historical associations. The floor of the Synagogue 'is paved 'with porcelain tiles brought from China. Col. :\Iacaulav presented the silver lamps and the Maharaja of Travancore, a g'olden crmvn to the Synagogue. In the Snlagogue, is preserved the 'Copper plate grant' of Bhaskara Ravi Varma conferring certain rights and privileges on the Jewish Prince Joseph Rabben and his heirs 'till earth and the moon last'. The Dutch palace at Mattancherry was built by the
54
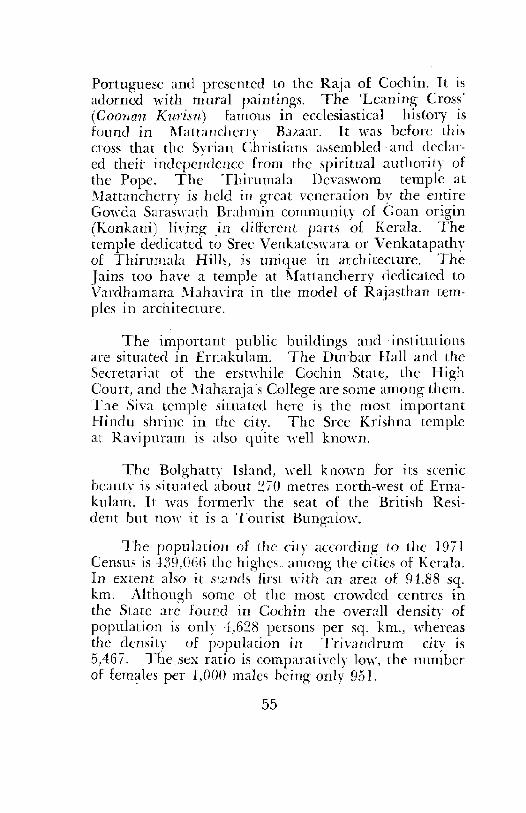
Portuguese and presented to the Raja of Cochin. It is adorned ,vith mural paintings. The 'Leaning Cross' (Coonan Kurisn) famous in ecclesiastical history is found in Mattancherry Bazaar. It was before this cross that the Syrian Christians a~sembled and declared theit- independence from the spiritual authority of the Pope. The Thirumala Devaswom temple at .\lattancherry is held in great veneration bv the entire Gmrda Saras\rath Brahmin community of Goan origin (Konkani) living .in different parts of Kerala. The temple dedicated to Sree Venkates,fara or VenkatapatllY of Thirumala Hills, is unique in architecture. The Jains too have a temple at Mattancherry dedicated to Vardhamana Maha\'ira in the model of Rajasthan temples in architecture.
The important public buildings and institutions are situated in Ernakulam. The Durbar Hall and the Secretariat of the erstwhile Cochin State. the High Court, and the 2\1aharaja's College are some among them. The Siva temple situated here is the most important Hindu shrine in the city. The Sree Krishna temple at Ravipuram is also quite \\'ell known,
The Bolghatty Island, well knmm for its scenic beauty is situated about ~70 metres north-west of Ernakulan1:. It "was formerly the seat of the British Resident but nOl\' it is a Tourist Bungalow.
The population of the city according to the 1971 Census is -139,066 the highest among the cities of Kerala. In extent also it stands first with an area of 9·1.88 sq. km, Although some of the most crowded centres in the State are found in Cochin the overall density of population is only 4,628 persons per sq. km., whereas the density of population in Trivandrum city is 5,467. The sex ratio is comparatively 10l\', the number of females per 1,000 males being only 951.
55

BOLG1LHTY PALACE~A TOuRIST RESORT
All roads lead to Cochin. It is the most important centre oE trade and commerce in the State with facilities for export and import throughout the year. The city IS connected by metre gauge raihvay line from regions in the south and by broad gauge line from north. But Cochin harbour itself is served by both broad gauge and metre gauge. The work on the conversion of the existing metre gauge line connecting Ernaknlam with TTivandrum into broad gauge is now in progress. Extensive navigation facilities by backwaters arc available to and from Cochin. The Port itself dominates all transportation facilities. Several improvements ·were made to the Port from tiIne to time. The rort of Cochin plays an important role in the economy of the State and its improvement is included as an item in the successive Five Year
56

Plans. Cochin is also served by daily air service from Bombay and the impOltmt cities in South India, Its contact 'with the other parts of the world has made it a truly cosmopolitan city.
The distribution of population according to religions in the city folluws more or less the same pattern as the rest of the State, 'with the difference that the perccntag'e of Hindus is· less and that of Christians more. As a '-city, subject to a great deal of foreign influence, it has also smaller religious groups not founel ehewhere, The Hindus account for 42.4G rer cent, the Christians 39.76 per cent and the ~[uslims 17.21 per cent of the population, whereas the percentage of Hindus in the State is 59.41 and the Christians 21.(1,). There are I ,22,~ jains, 294 Buddhists and 670 Sikhs in the city.
The population of the city m3.Y be divided into three broad age groups, 37.34 per cent of the population belongs to the age group 0-14 consisting of inhnts and children of school-going age, 57.51 per cent to the age group 15-59 comprising the 'wrking force a nel :) .15 per cen t to the age group of 60 years 3. nd above consisting of dependents and retired persons. Out of a total population of 439,066 only 121,:?93 persons are gainfully employed. The workers form only 27.6 per cent of the total population or 48 per cent of the population in the age group 15-59.
The distribution of workers among the various types of employment shows that the highest percentage of workers is engaged in 'white collar jobs. HO'we\"er, there is a greater diveTSification of employment than in other cities, industries, trade, commerce and transport absorb a sizable number of workers. 32.4 per cent of the Korkers are engaged in services, 22,7 per
57

cent in industries, 19.8 per cent in trade and commerce and 16 per cent in transport.
The housing conditions in Cochin do not show am marked ditlerence from those in Trivandrum. In C~chin. the strength of an average household is 6.44 as against 6.06 in Trivandrum. The number of persons per room is 1.99 in Cochin as against 2.05 in Trivandrum. About 67.1 per cent of the households own the houses they live in.
Cochin has a high percentage of literacy. It has ahl'ays been a seat of learning and culture. Institutions for education are numerous both in the citv and suburbs. Considering the industrial importance of the region, a new Cniversity, the University of Cochin, has been established with the emphasis on technological and managerial studies and research.
The suburbs of Cochin have become the centre for large scale industries in Kerala State. Some of the important large scale industries concentrated here are the Indian Aluminium Company, Fertilizers and Chemicals Travancore Ltd. (FACT), Travancore Cochin Chemicals (TCC), the Indian Rare Earths, the Tra\'ancore Ra,ons Facton, Tata Oil Mills and Premier Tyres. Th~ inter-firm' utilization of products and byproducts is bound to make the concentra6on stronger. The rapid industrialization of the suburbs of Cochin, and the establishment of heavy industries like Shipbuilding Yard, Oil Refinery at Cochin and Hindustan i\'1achinc Tools Limited at Kalamassery will go a long I'lray in a5suring Cochin an important place amongst the cities in India.
TRIVA:'-iDRUyI
Trivandrum, the capital of Kerala State, has an unbroken tradition of having been the metropolis of
58

the erstwhile Travancore and Travancore-Cochin States.
The city is said to derive its name from Sree AnanthapLlra;n or Thiru Ananthapuram which means the domain of Sree Padmanabha, the deity of the most famous temple in the city. Sree Padmanabhaswami temple, situated inside the Fort is of great antiquity and many stories are told about the, founding of this temple. Though the management of the temple ,vas nominally vested in a council, the rulers of Travancore exercised supreme authority in the affairs of the temple and held it in profound adoration, it, being their
SREE PADMAKABHASWAMI TEMPLE
household deity. Marthanda Varma, regarded as the Maker of Modern Travancore, dedicated his kingdom to Sree Padmanabha and he and his successors assumed the title of STee Padrnanabhadasa and ruled the State as a sacred trust in the name of Lord Padmanabha. The temple with its seven-storeyed Gopumm IS a
59
remarkable speCimen of South Indian :Irchiteeture of lhe Dravidian style. The corridors of the temple are 1 inco bv 3~ 1 c:lrveo beautiful gnnite pillars.
I n the filst cenSllS report oE \ he State it is des.cribed as a '\ en opulent and extcnsiye town situated on risi ng groulld bet\\-cen ,alleys of \\-ct cuI ti vation ~1l1d shaded by grm es of coconut and other trees'. The ci l;' ILlS prcscn ccl mnch of its ,ccnie beaut\' il1~pilC of the numerous strnctures of brick and concrete 'wh icll kt\ c replaced natural yeg-eLatioll to some extent. I r is still It-inged by paddY fields :md dotted hy a large number of coconut trees.
Though a coastal city, ib ground IC\el varies [rom (J to 7(1 melres abO\c the mean sea-Ieyel. Trivandrum shares the hospitable climate of the rest of Kerala. the special features bei ng, a comparati \ ely 10\\- incidence of rainfall, uniform temperature moderated by the sea. :mcl a high percentage of humidity.
Tri,andrum c10cs nor occupy a geographically central place in the State. It is the headquarters of the southern-most district of the State. But it is "1Nithin ea'>, reach of the northern houndary of the State by road, 'raihny and ,raterwav. It is also connected to the other illiportant cities i;l Inelia by raih\'a, and airlsay. Prior to the development of tl~e faster' modes of road transport the lagoons and hackH-aters formed the main cIl:lnnel of communication in Kerab. Triyandrum i~ connected to Hosclrug in CJ.ll11anOre district by a system of back\\-atcrs, connecting canals and na, igable rivers and it is still the cheapcH mode of good~ transporl though by no means the quickest. There i~ a pier at Valiathllra in Triv;llldrum cily with facilities for sh ipping operation for the export and import of goods only. The major roads connecting the city to
the important places outside, are the Trivanclrum-
60
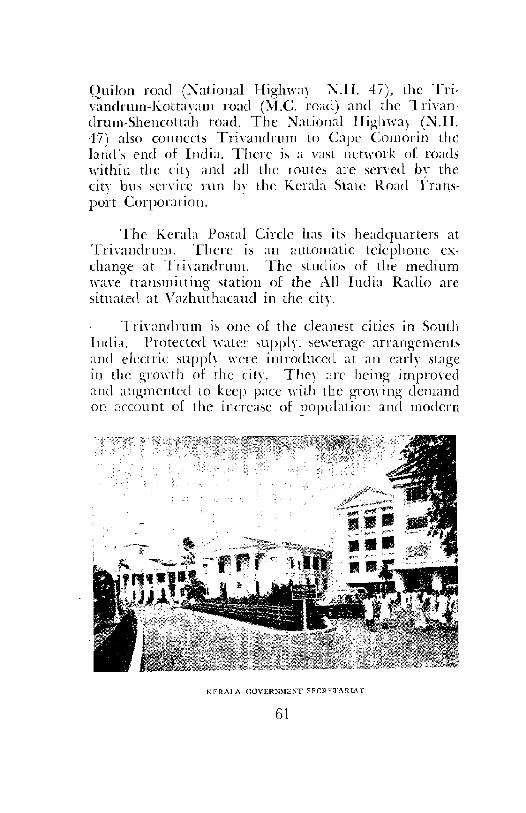
Quilon road (Xational HighwJy-i\.H. 47), the Trivandrum-Kottayam road (M.e. road) and the Trivanclrum-Shencottah road, The National Higlrway (N.H. 47) also connects Trivandrum to Cape Comorill the bnd's end of India. There j~ a vast network of roads ,\"ithill the city and all the routes are served b,' the city bus ser\"ic~ run by the Kcrala State Road "1\an5-pO~'t Corporation. . '
The Kerala Po~tal Circle has its headquarters at TrivandrullI. There is an automatic telephone exchange at Tli,"andrul1l. The stlldim of the medium 'wave trallsmiaing station of the All India Radio are situated at Vazhuthacaucl in the city,
Tri,'andrum i~ olle of the cleanest Cltles in South IndiZl.. Protected watn supply, se,,"el'agc arrangemenb and electric supph ,,"ere introduced at an early stage in the grOl\"th of (he city, They are being improved ;111<1 augmellted to keep pace ,,"ith the gTO\\-ing demand on account of the increase of population and modern
Kr-,RAl.A nOVER:-;~IENT ~FCHE:rARI,\ r
61

style of living. Medical facilities here are the best that could be obtained in the State and perhaps any,where else in India. But the bed strength of the large number of hospitals is still inadequate largely due to the influx of patients from outside the capital.
The educational institutions in the city and its outskirts serve not merely the local requirements but also the regional requirements to a Im-ge extent. Of the institutions of regional importance, the ~Iedical and the Dental Colleges and the Ayurveda College are ,vithin the city, and the Kerala University Centre at Kariavattom and the Engineering College at Kulathoor are at the outskirts.
Trivandrum is not merely the political capital of the State but also its educational and cultural capital. 69.16 per cent of the population of the city are literate. There are a good number of libraries in the city. The Trivandrum Public Library founded in 1829 and the more recent University Library deserve special mention. There are facilities for holding conferences and cultural programmes at the Senate Hall, the Tagore Centenary Theatre, the V.J.T. Hall, the Kanakakunnu Palace, Karthika Thirunal Theatre, Vivekananda Centenary building etc. There are a good number of recreational, cultural and service organizations functioning in the city, like the Trivandrum Ttnnis Club, Sree l\Ioolam Club, the Boat Club, the Golf Club, the Rifle Club, the vVomen's Club~ the Flying Club, the Lions Club and the Rotary Club.
The population of the city according to the 1971 Census is 409,627. This represents an increase of 608 per cent over the population of 57,882 in 1901. There has been a steady increase of population during all the decades from 190 I to 1971; the higher rates in certain decades being attributable mainly to the extension of
62

the city limits. Two events of great importance to the city were the integration of the Travancore and Cochin States in 1949 and the formation of Kerala State in 1956. The city has met the demands of the capital of the successive larger states 'without much strain. The present extent of the city is 74.93 sq. km. and the density' of population is 5,467 persons per sq. km.
The sex ratio in the State i.e., the number of females per 1,000 males is 1,016. In Trivandrum district the ratio is slightly less at 1,008, and still less in the urban areas of the district at 996. In the citv it is only 988, the difference being not very appreciabl~ ih view of the presence of a floating population and the housing shortage.
The predominant religions in the city are, just as in the State, Hinduism, Christianity and Islam. The Hindus form 73.53 per cent, the Christians 15.97 per cent and the :VI uslims 10.45 per cent of the total population in the city. The percentage of Hindus in the city is higher than that in the State and that of Christians and Muslims slightly less.
36.28 per cent of the city's population is in the age group 0-14, comprising mainly of the infants and the school-going population. 5.56 per cent of the population is in the age group 60 and above. The working force is drawn from 58.16 per cent of the population in the age group 15-59. Actually, the number of workers in the city is only 114,258 or 27.89 per cent of the total population or 47.96 per cent of the population in the age group of 12>-59.
The employment pattern is typically that of a metropolitan city' without many industrial undertakings or large establishments of commerce and trade. Persons engaged in clerical, administrative and personal
63

services account tor as mucb a.'> 4c1.6 per cent of the loral number of workers.
Among the cities of Kcrala, the average size of the household j" smallest at Trivandrum 'with 6.06 as agJ.iost G_4·t at Cochin and 7.20 at Calicut. The housing conditions in the city are more or less the same as in the other cities. "the number of persons per room is 2.0.) at Trivandrum, l.99 at Cochin and 2.67 at Calicut. 64.3 per cent of the households own the hOllses they liYe in as against 67.1 per cent at Cochin and 66.5 per cent at Calicut. This slight difference may mainly be clue to the fact that a good percentage of the employees in the city are liable to be transferred to other places and many of them cannot therefore afford to put up theiT own houses for the brief period during 'which they may stJ.}, in the city.
NAPIER M"CSEtJM
Trivandrum city is a tourist paradise. Magnificent structures built after both the ancient and modern styles of architecture will not fail to catch the eyes of the most casual yisitor. Ancient temples, palaces,
64

churches, mosques, statues and memorials stand side by side lvith the new and imposing public offices, colleges, theatres and hospitals. The Trivandrum zoo, the museum, the Sri Chithralayam, the acquarium, and the Sanghumughom beach are but a few of the numerous tourist attractions. Kovalam, the world famous tourist resort is only about 13 km. away from the city. One visitor, who voices the opinion of many. says, 'Trivandrum built on a cluster of hills between "'ivhich the breeze blows up from the sea, three miles away, is one of the most visually pleasing towns in Asia and one of the cleanest'.
CALICUT
Cali cut was the headquarters of the "Malabar district when it formed part of the erstwhile Madras State. It continued as such in Kerala State also until 1st January 1957 when Malabar district ,;vas trifurcated into smaller revenue districts. Since then it is the headquarters of Kozhikode. one of the districts so formed: It stands second in extent and third in population among the cities of Kerala.
The town came into prominence by about the 12th centur\, A.D., since when it attracted travellers and traders from all over the world. I t has a colourful tradition as a trading centre and glowing accounts of it are left in the writings of travellers from ancient China and Persia, not to speak of the missionaries and administrators of a not too distant past from the "Vest, the Portuguese, the English and the French who enjoyed trading rights there at some time or other.
Calicut, according to "\Villiam Logan 'was in ancient days, when the Zamorin's influence \vas supreme on the Malabar coast, a place of great trade. The nations of the 'Vest came here for spices, pepper and
65
cloth (calico); the Chinese even came from the East in their gigantic floating hulks. It probably rose into importance about the eleventh or H.·elfth century A.D. In the first half of the fourteenth century, "",hen Shaik Ibn Batuta visited it, it was certainly a place of great trade, and so it continued till the arrival of the Portuguese in the end of the fifteenth century'.
In 1498 Vasco da Gama landed at Kappad, near Calicut. The Portuguese established a fort in Calicut in 1513. The English, the French and the Danes followed suit and the struggle for trade ended with the supremacy of the English. Calicut is still an important mmmercial centre and is second only to Cochin among the ports in Kerala State. The lighthouse there, was built in 1847.
Calicut is on the \Vest Coast Highway connecting Cochin to l\1angalore. It is situated almost in the middle of the northern half of the coast line of Kerala State. By its very position it commands a rich hinterland. The climate of the city is characterised by fairly high temperature, high humidity and heavy rainfall from June to October.
The port of Calicut is an open roadstead. It is about 145 km. north of Cochin. The steamers have to anchor beyond a limit of 3 km. from the shore as the "Sea is shallow near the coast. The port is open to foreign trade almost throughout the year with interruption during heavy rain. The railway as well as the \Alest Coast Road go across the city. A small telephone exchange 1vas opened at Calicut in 1925 and improvements were effected periodically. The telephone .exchange was automatised in 1960. The All India Radio has a medium wave transmitting station at Calicut which 'went on the air in l\Jay 1950.
66

· The Calicut 1\'1 unicipality was established in 1866. 1t was raised to the status of a municipal corporation in 1962. The population according to the 1971 Census is 333,979 representing an increase of 334 per cent within a period of seven decades. The density of population is 4,040 persons per sq. km. It is ,vorth mentioning that the density of population in 1961 was 6,289 persons per sq. km. and the fall is only due to the extension of city limits from 30.61 sq. km. to 82.67 sq. km. since then to include some rural al:eas. The fact remains that areas which form the heart of the to,vn are very overcrowded. The sex ratio is 988 as against 951 in Cochin. Trivandrum has the same sex ratio of 988.
In the city 62.10 per cent of the population are Hindus, 33.32 per cent l\luslims and 4.39 per cent Christians. This is a marked deviation from the State figures in that the percentage of Muslims is greater and that of Christians much less. In the city there are a large number of temples, mosques and churches. The Sreekanteswapm temple, the Tali temple, the Thiruvannur temple are the most well known among the temples. The two Jamat mosques on the banks of Kuttichira .and the Pazhaya PaW are famous. The Catholic church dedicated to ]\Jadre de Deos (~10ther of God) was built in the early part of 'the 18th century and the Protestant churches towards the middle of the 19th century.
~ 38 .. 27 per cent of the population in the city belongs to the age group 0-14, showing a larger percentage of inf~nts and children of school-going ages than in the other Cities of the State. In T rivandrum, die population in this age group form 36.28 per cent and in Cochin 37.34 per cent of the total population. It is also seen that the percentage 'of dependants or retired persons of sixty yeats or above is highest in Calicut, ,>vith 5.93 per cent compared to Cochin with 5.15 per cent and Trivandrum with 5.56 per cent.
67

The total number of ,mrkers in the citv is 82,66~ which is only 2'1.75 per cent of the total population or 44A per cent of the population in the age group 15-59. 'Other Services' which consist mainh- of white collar jo bs absorb 29.1 per cent of the I\-o;kers. Two other important avenues of employment are trade and commerce and industries which absorb 23_7 per cent and 23.2 per cent of the workers respectively. There are a fe,ll major Government owned factories at Calicut, the Kerala Soap Factory, the Government Hydrogenation Factory and the Government Oil Factory. Calicut has also th'e second largest timber yard in th~ world located at Kallai.
KALLAl Tl\{BER YARD .
The size of an average household in Calicut city is 7.20 as against 6.44 in Cochin and 6.06 in Trivandrum
68

The Dumber of persons per room is 2.67 in Calicut as against 1.99 in Cochin and 2.05 in Trivandrum. The above figures show that living conditions in the city are poor. 66.5 per cent of the households own the houses they live in. This compares favourably. 1,\'ith the other cities, the figures being 67.1 per cent for Cochin and 6+.3 per cent for Trivandrum.
The rate of literacy in the city is 65.38 which is the low!=st among the citie~ of Keral;. The percentage of literacy among females is only 58.89 ·which is much lmq:r than the corresponding figures for the other cities. The other cities in the State, are in the erstwhile Travancore and Cochin States which had a good lead in literac~from very early days.
ALLEPPEY
The tmvn has lent its name to a new district constituted on 17th August 1957 in Kerala State. Alleppey district was carved out of Ouilon and Kottayam districts anel it is the :o.mallest dish-ict in the Stat~. It stands foremost ill literacy and density of population. This is the only district in the State which lies entirel'1 within the 1m/land and the midland regions without ~my area in the highlands. 'Virh hardly any hilly area or forest land, . practicall y every part of the district is thickly populated.
The presence of the Arabian Sea on one side, the Vemoonad ,lake, and a net work of intersecting canals has ,yon for the town the appellation of the 'Venice of the East'. Till about the close of the 18th century, this place was a mere jungle. The town was founded by Raja Kesava Das, Dewan of Travancore in 1762. He built warehouses, constructed canals, and invited merchants from Bombay and Sind to settle clown there. The climate of -the citv is hot and moist, and there is an abundance of rainfall for more than half the year round.
69

Alleppey continued to be the chief commercial port of T ravancore, 'its greatest advantage as an emporium arising from its singularly natural backwater formed in the open roadstead and the long and wide mud bank "which helps large vessels to anchor safely even in the stormiest of weather'. It has a pier 30:) m. long and a lighthouse lNhose light is visible to a distance of about 25 km. sea"ward.
The port is only about 60 kill. south of Cochin. ,\Vith the integration of Travancore and Cochin States and the formation of the Kerab State, Alleppey has lost its place as the first sea port to Cochin. Still it is famous as a trading centre for coir yarn, coir matting and coconut oil. The steamers anchor about 3 to 5 km. a,,'ay from the shore and cargo boats ply bet\yeen the pier and the steamers for loading and unloading.
Road and \~.'ater transport are the chief means of communication within the city and to places outside. There is no Tail 01' air link to the town. The shipping operations for the transport of goods are carried out mostly from September to May. The National Highway (N.H. 47) connects the city to Quilon and Cochin. Alleppey is enroute the "Vest Coast Canal which connects Trivandnun ,vith Hosdrug. Canals fit for navigation of small boats and country boats connect the citv to Kottayam, Changanacher~y and the other important towns. Alleppey is the headquarters of the Kerala State 'Yater Transport Department. An enchanting water carnival and regatta is conducted at the nearby Punnamada Kayal (Vatta Kayol) every year as part of the Independ-" ance Day Celebrations. The Rolling TTOphy made of silver "was presented by Pandit Jawaharlal Nehru, the first Prime Minister of India. The trophy is awarded to the winner of the snake boat (Chunda·n) race, every year.
70

SNAKE BOAT RACE
Alleppey became a conservancy town m 1893-94 and it was upgraded as a municipal to'>\'o in 1919-20. The population of the town in 1901 was 24,918 and in seven decades it has gone up to 160,166 representing an increase of 543 per cent. The extent of the city is 46.77 sq. km. and the density of population is 3,425 persons per sq. km. This hapi>ens to be the lowest compared with the other cities of Kerala, inspite of the fact that Alleppey district, 1vith Alleppey as its headquarters, is the most thickly populated district in the State. The sex ratio is 994 as against 986 in the Qnilon Municipal tov,rn.
In the town 50.02 per cent of the population are Hindus, 27.29 per cent Christians and 22.60 per cent Muslims. There are 117 Jains in the city.
Infants and school-going children in the age group 0-14 account for 37.1 per cent of the total population of the city. 5.8 per cent of the population is in the age group
71

of 60 and above conSIStmg mainly of retired persons and dependents. 57.1 per cent of the population belongs to the age group 15-59 which mainly supplies the 'working force. However the actual number of 'workers in the city is 41,189 which is 25.7 per cent of the total population or only 45 per cent of the population in the age group 15-59.
Allcppey, ~,;ith a rate of 70.04 per cent stands foremost in literacy among the cities of Kerala.
Homehold and other industries, trade and commerce, administrative, clerical and personal services are the chief avenues of employment in the city. 28.8 per cent of the workers are engaged in household and other industries, 24.9 per cent in clerical, administrative and personal services and 20.9 per cent in trade and commerce.
COIR IN )fAKING
72

Among the cities in Kerala, the percentage of households o\vning the houses in which they live, is highest in Alleppey ·with 78.6 per cent as against 65.9 per cent in Qllilon, 64.3 per cent in Trivandrum, 67.1 per cent in Cochin and 66.5 per cent in Calicut. The avenge size of a household is 6.36. The average number of persons per room is 2.35 in Alleppey as against 2.00 in Ouilon . ...
Alleppey, "'[he Venice of the East', has seen some hard times. Its traditional industries and exports like coir yarn, coir mattings, coconut oli are liable to violent set-backs due to the fluctuating price and unsteady demand in the world market. It cannot compete with Cochin, a natural all-,\-eather harbour, on the same coast in shipping operJ.tions. Ho-wever; attempts are being made to revive traditional industries and to start new industries on modern lines.
OCILO~ ... 'If vou sa,\, Ouilon, YOU would need no house any
more' i; a time-honoured saving. Ouilon, it is said, in its days of glory. had so m'uch to ~ffer to its visitors that overwhelmed by its enchantment and splendour, they became oblivious of the homes they left behind and settled dmvn there ·with no regrets.
The term 'Quilon' is an anglicized form of the Malayalam word 'Kallam'. But the origin of the name has not been fixed beyond doubt. Early 'Hiters refer to it by different names 'Kaulam', 'Coloen', 'Colam' etc. The' nao!e of the town is associated "with 'Kollam Era' which began iq 825 A.D. commemorating probably a great event connected with the town.
73

According to K. P. Padmanabha "Menon, Quilon "was at one time a great political and commercial centr~. The Nestorian Christians found here an asylum on theIr arrival on the coast. I t was the seat of the first Roman Catholic Bishopric in India. It enjoyed a large trade "with China and Arabia and had also political relations with Kublai Khan, the great :Mongol Emperor of China. It) port has been described by early travellers as one of the largest in the "world, and its markets the first in India". It is even believed by some that 'Chinnakada' 1shich in the present form means 'Small Bazaar' lNas once dcrually a Chinese pocket in the tuwn and that the name is deri\'ed from 'Cheenakada' which means 'Chinese Bazaar'. According to the tradition cherished by the Christians of Kerala, one of the seven churches founded b\' St. Thomas (52 A.D.) was located at Quilon. It is certain that Quilon Port ,,'ith its plentiful supply of spices from the surrounding places ,ras well known in the ancient world of trade.
VeIu Thampi Dalawa who organized a heroic rebellion against the British did much to bring Quilon into prominence, both politically and commercially. He constructed the Huzur Cutcherr)" a palace and a temple. He revived the commercial activity by inviting merchants from Tirunelveli and Madurai to settle down there. C nder his care, Quilon became a great centre of trade al1d administration.
The Portuguese established a trading settlement at Quilon in 1502 A.D. It passed into the hands of the Dutch in 1661. The English captured it in 1795 and as a result of the treaty between the English East India Com pany and Travancore, an English force was stationed at Quilon.
Lieutenants "lard and Conner in their AfemoiT of the Survey of the Tmuancore and Cochin States (1820
74

A.D.) describe the town as follow~:-"Kolum is remarkable in the legends of )\falabar for fixing the chronological era of Travancore calculated from the foundation of the city now 995 years ago. It is a populous tm",n, in magnitude perhaps superceded by none in the province. It arose on the site of a small Nair village on the coast, it has since it became a :Military Post or Cantonment, acquired vast improvements, and to it ,owes its present importai1ce. Previous to it, Tungumslwry (presem Tangasseri) a Portuguese settlement. was the station of the British troops".
Quilon is a coastal city, situated 67 km. north of Trivandrum and 152 km. south of Cochin. It is washed by the Arabian Sea on the \\'est and south ancl has the Ashtamndi lake on tbe north. Unlike Trivanclrum, Quilon is almost flat, slanting only slightly towards the sea. The temperature is high but is moderated by seabreeze. There is heavy rainfall clue to the south-west monsoon and north-east monsoon.
Quilon is connected to Trivandrum, the capital of the State by rail, road and backwaters. It is a major junction in the Southern Railway. The Tiruneh eli Quilon Railway was opened in 1904. The railway ';I-as extended to Trivandrnm in 1918, and Ouilon-Ernakulam raihvay 'was opened for traffic in 1958 ..... The National High\\'ay (I\. H.47) connects the tOlm to Trivandrum and Cochin.
The importance of Quilon port began to decline with the rise of Cochin and Calicut. It is an open roadstead 011 the Arabian Sea. Usually steamers anchor about 800 to 1,600 metres off the shore. A lighthouse was established at Tangasseri in 1902. Its light is visible to a distance of about 29 km. )Jo passenger traffic is handled by the port. The export is mainly cashew kernels and the import, cashew nuts from Africa,
75
In 1864, the first post office under the British Indian Postal system was opened at Quilon. Already, the indigenous postal system known as the Anchel was func-o ' tioning in the district and it continued to do so until its merger with the Indian Postal Department in 1951. A.n automatic telephone exchange was established in 1950 at Quilon.
Quilon \\'as raised to the status of a Municipal town in 1921. According to the 1971 Census it has attained the status of a census city, a town 'with a population of I lakh or above. It is the smallest City in Kerala both in extent and population. The area of the city is 18.48 sq. km. and the population is 124,208. ,\Vith 6,'721 persons per sq. km. it leads the other cities in Kerala in the density of population. Seven decades ago the population was only 15,691. It has registered an increase of 692 per cent in 70 years. The'sex ratio is 986 as against 994 in Alleppey and 988 in Trivandrum.
There are very ancient temples, mosques and churches in the city. The Anandavalliswaram and Asramam temples, the Chinnakada Palli and the churches of the Syrian Christians and Latin Catholics are of historical i~1ponance. As Lieutenants ,\Varo and Conner noted' Quilon was originally a Nair "illage. But Christians and l\luslims settled down there from very early days. At present Hindus account for 58.06 per cent, Christians 25.57 per cent and Muslims 16.24 per cent of the total population of the to"wn.
The distribution of the population by broad age groups indicates some of the pressures on the economy of the town. 38.25 per cent of the population belongs to the age group 0-14. This is fairly high and it indicates the need for a large number of educational institutions to absorb all the children of the school-going age.
76

The working force is supplied from 56.86 per cent of the population in the age group 15-59. The balance 4.89 per cent of the population is in the age group 60 years and above.
The occupational distribution of the gainfully employed will give us an insight into the economic structure of the tmnl. Only ~6.72 per cent of the total population of the tm"'!1 is gainfully employed. I t is seen that the rate of participation in' work is comparatively lOIN .. The working population form 47 per cent of the population in the age group 15-59, from which the "workers are mostly drawn. The major avenues of employment are in the field of household and other industries, other services and trade and commerce. 27.1 per cent of the workers are engaged in household and other industries, 26.5 per cent in other services and 19.6 per cent in trade and commerce.
The size of an average household in the city is 6.39 as against 6.36 in Alleppey and 6.06 in Trivandrum. There are two persons per room which compares favourably with the position in the other cities. 65.9 per cent of the households o"wn the houses in which they live. The percentage of ownership is more than in Trivandrum but less than in Alleppey.
Quilon is the headquarters of the district of the same name and the main centre in the district for education, health services, industries and commerce and trade. The rate of literacy in the city is 68.22 per cent. The city can boast of a good number of big high schools and three Arts and Science colleges. The first Engineering College in the private sector in the State was started at Kilikolloor in the suburb of the city. The Municipality maintains its own library and gives grant-in-aid to a number of libraries and reading rooms in the city.
77

The economic prosperity of the city is dependent on its industries, commerce and trade for which it was famous. The major industries located at Quilon are
PROCESSING 01' CASHEW
cashewnut and textile factories, saw mills, oil mills, and brick and tile factories.
The growth of towns is a fascinating study. \Ve kno,v that some of the larger towns of today will expand their jurisdictions in course of time. The adjoining areas will get merged in the town. This gave rise to the ne,v concept of 'Standard Urban Area' in the 1971 Census. The Standard Urban Area may be defined as the projected growth area of a city or a tmvn as it would be in 1991 taking into account not only the towns and villages which will get merged into it but also the intervening areas 'ivhich are potentially urban. The demarcation
78

of Standard Urban Areas was done \\~ith the assistance of the Town Planning Depal'tment of the State and the Central Town and Country Planning Organization. All the municipal towns 'with an estimated population of 50,000 or more by 1971 had qualified to be treated as Standard Urban Areas. There are 13 Standard Crb::m Areas in the State 'which include the five cities and eight other municipal towns viz. Palghat, Trichur, Tellicherry, Kottayam, Cannanore, Badagara, Kayamkulam and Changanacherry.
79


CHAPTER UI
Are the number of men and women balanced?
How old·are we ? vVe no longer argue whether one sex is superior to
the other. It is altogether an outmoded question. But are the males and females equal in number? It is a vital question. \Ye expect that the number of men and women are balanced at all times and at all places. Serious imbalance would no doubt cause certain social problems. If men are in excess, at least a fe\~T will not be aale to get partners and in certain societies the 'bride price' will go up. If the reverse is the case there 'NiH be a keener chase after eligible men and yet a few women will have to remain lonely spinsters. In normal times, we do not anticipate such an eventualitv. Actuallv, the equality in number of males and fe~ales in all countries and at all times is an ideal seldom attained. It depends on various factors over which we have little control. Even if an equal number of male and female babies are born, their chances of survival at various periods of life are very unequal. They face different types of hazards during different periods of life. Sex selectivity in certain types of mortality like maternal mortality is but one among them. 'Ve are more uncertain about selectivity of sexes in abnormal deaths. \Var usually takes a heavier toll of men than women. Migration aiso brings about imbalance in the numbers of males and females. Our assumption that male and
81 6-1 Census/Kerala,l73
female babies are born in equal numbers, is itself "·Hong. Then balance if achieved, is the result of unequal male births and female births, modified by unequal incidence of normal and abnormal deaths. It is a wonder that the balance is not often seriously disturbed.
'Sex ratio' gives in realistic terms a comparison between the number of males and females in the population. In the Indian census, following the practice in the United Kingdom, the number of females per 1,000 males is taken as the sex ra6o. In the United States of America, the number of males per 100 females is calculated for the sake of comparison.
The sex ratio, in India, is 930 females per 1,000 males according to the 1971 Census. There are large variations between different parts of the \Norld in sex ratio. There is an excess of females in the United Kingdom, U.S.A. and Japan. In Canada, Sri Lanka and Pakistan males are in excess. In every census, sex ratio in India ,vas 10\v. Before this pattern' was confirmed in .successive censuses, various arguments used to be put forward to explain the chronic deficiency of females in India. The low status accorded to women in Indian society, the tendency to conceal the existence of unmarried young females, and a higher mortality rate among females were some of the reasons given for the low sex ratio. Now ,ve have no difficulty in accepting it as a pattern found in many other parts of the world also.
The population census of Kerala tells a different story about the pattern of sex ratio. In 1971, there are 1,016 females per 1,000 males in Kerala. No other state except the Union Territory of Dadra and Nagar Haveli has a predominance of the fair sex. In Punjab the sex ratio is 865 but our neighbouring states of Tamil Nadu and Mysore have higher sex ratios at 978 and 957 respectively but there also the males are in excess.
82
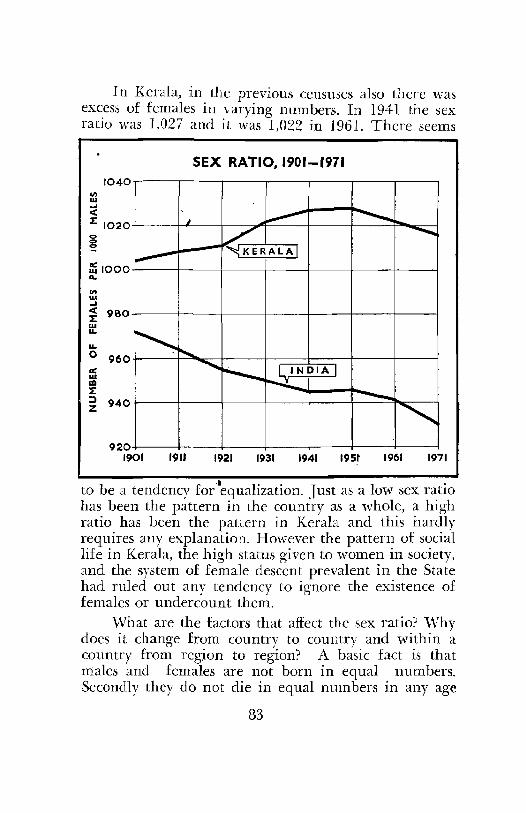
In Kerala, in the previous censuses also there v,'as excess of females in varying numbers. In 1941 the sex ratio was 1,027 and it was 1,022 in 1961. There seems
SEX RATIO, 1901-1971
'" w ..... <I:
1040
1: 1020 <:> g
ffi 1000 Do
III W ..... <I: 980 1: w II.
II.
o 960 t.:: w ED 1: ::) 940 Z
J
~
~ ......
920 1901 1911
"..,....-- .............. -~RAlAI
........... -
........... ............... L,INDIAJ
~ ---'" 1921 1931 1941 195t 1961 1971
to be a tendency for'·equalization. Just as a low sex ratio has been the pattern in the country as a whole, a high ratio has been the pattern in Kerala and this hardly requires any explanation. However the pattern of social life in Kerala, the high status given to women in society, and the system of female descent prevalent in the State had ruled out any tendency to ignore the existence of females or undercount them.
vVhat are the factors that affect the sex ratio? 'Why does it change from country to country and within a country from region to region? A basic fact is that males and females are not born in equal numbers. Secondly they do not die in equal numbers in any age
83

group. A third factor is that among migrant population, males and females I\'ill not be equal as a rule. :\'1en go in search of jobs or means of livelihood and bring their 'ivomanfolk to their new place of settlement after they feel reasonably secure in the new surroundings. In kerala, the imbalance due to emigration or immigration is negligible. As a matter of fact there is said to be a male excess at birth. As if to compensate for this natural deficiency in females, male infants die in larger numbers than female infants during the first year of their life. Thereafter the proportion between males and females goes on changing due to dilference in mortality rates. There seems to be no uniformity in the rate of mortality of the males and females either in different places il~ the same country or in the same place in different age groups. 'We ma~y assume that the strain and stress of life tells upon males more heavily at some period and on females at some other periods of thei1' life. :\Juch had been done to prevent maternal mortality and perhaps better health services in the State and a much higher literacy rate among ,ramen than any"",here else in the country would have contributed to~wards the longer life and better health of the females in Kerala.
There was an excess of females in Kerala according to all the censuses from 1901 to 1971. But in the districts there ,,"as no uniformity and in some districts actually males were in excess. In the areas which formed the present districts of Cannan ore, Malappuram, Palghat, and Trichur the sex ratio was in favour of females but in all the other six districts males outnumbered females in 1901. The position has since then unde1'gone a change in fayour of females. According to the 1971 Census, only in three districts Kozhikode, Ernakulam and Kottayam males outnumber females. In Quilon the number is almost balanced, the sex ratio being 1,00 1. In all the other districts, the sex ratio is in
84

favour of ths.£air sex. Cannanore, I\Ialappuram, Palghat and Trichnr maintained the excess of the females during the seven decades from 190 I more or less steadily. Only one clistrict, Kottayam maintained a steady predominance of the male sex during the same period. In the case of the other districts there were deficiencies and excesses of either sex during the period in question. Trichur has the highest sex ratio 'i",ith. 1,081 and Kottayam the la-west ,,-ith 976. Quilon is having the most balanced sex ratio with 1,001.
IlOO~~-
SEX RATIO BY DISTRICTS
1971
The sex ratios differ widely in the taluks in the State. It ranges between 913 in South "\Vynad and 1,162 in Chayakkad taluk. There are 20 taluks where males outnumber females and 36 taluks where females outnumber males. In five taluks, the ratio is less than 9S0 and in t,\;O, more than 1,100. There are no ta1uks in ~la1appuram, Palghat, Trichur and Alleppey districts where the sex ratio is in favour of the males.
As is to be expected the sex ratio is generally lower in the urban areas. In the urban areas non-agricultural occupations predominate. Hence there is very little
85

scope for members of the family to partICIpate 111 the occupation of the head of the household. Moreover people go to the urban areas in search of employment and thev take their families ·with them only after their position' is secure. "\Vith the exception of Kozhikode and Kottayam districts the sex ratio is smaller in the urban areas than in the rural areas of the same district. The deficiency of the females is more notable in the urban areas of the more industrialized district like Ernakulam. Sex ratios of the two important industrial centres in Ernakulam district, Eloar and Kalamassery are only 852 and 889 respectively.
Out of the cities in the State, Cochin has the lo-west sex ratio, 951. There seems to be no relationship bet\,,~een the functional classification and sex ratio of the cities in OUT state. The Teason appears to be that no city could be described as predominantly unifunctional except T rivandrum which specialises in 'services'. Among the cities the highest sex ratio is in Alleppey. It is an industrial-cum-service-cum-commercial town. Its main industry is making of coil' products. In this industry WOomen are perhaps more adept than men and so deficiency of females is not likely to arise.
According to physical features the State can be divided into three regions. the highland, the midland and the lmvland. The sex ratios of these regions are 970, 1,024 and 1,027 respectively. The sex ratio of the highland is the lowest and the lowland the highest. A tendency towards equalization is noticed when we compare the sex ratios in 1961 and 1971, of the same regions. vVhile in the highland the ratio increased from 963 to 970, in the midland and lowland it decreased from 1,030 to 1,024 and from 1,033 to 1,027 respectively.
Why are the sex ratios different in the three natural divisions of the State: V/hat is the reason for the narrow-
86

ing down of the difference during the last decade? The explanation may perhaps be found in the history of the settlement pattern in the State. Our coastal areas had sizable settlements from very early days. Our trade and contact 1vith foreign countries were through the sea ports which were well known all over the civilized world. But the goods exported were the products of the midland and even the highland which were of course not thickly populated at that time. The midland was colonized earlier than the' highland. It is the acute pressure of population on land both in the lowland and the plains that forced people to colonize the highland where they had to face greater hazards. It is true that certain isolated areas in the highland were opened up for plantations by adventurous persons even earlier. But the hilly regions ,,,,ere only sparcely populated until recentl~7 when planned colonization took place. As it usually happens, the migrants do not take their families with them for quite some time and so a deficiency of females is to be expected in the ne'l.' settlements. Migration took place gradually from the coastal areas to the plains and then to the hills and the sex ratio is therefore highest in the lmv-land and lowest in the highland. However the matter is not so simple as that. Modifications in the pattern do take place due to other forces also at work such as industrialization and urbaniz~tion of the area within the natural divisions to unequal extents.
There seems to be no appreciable difference in the sex- ratios among the followers of the major religions in the State. Among the Hindus and the Muslims women outnumber men, the sex ratios being 1,025 and 1,009 respectively. The number of men and 'Nomen are well balanced among Christians with a sex ratio of 999. The smaller religious groups have a low sex ratio of 570. This is understandable because they are migrants, mostly in temporary or transferable employments and have no
87

idea of settling down permanently in the State. They form only 0.04 per cent of the population and hence the very low sex ratio of this group does not make any impression on the high sex ratio in the State.
In the planning of economic and social develop· ment, due consideration has to be given to the size of the population as "\'ell as its age structure. Persons in each age group have their O"wn special requirements and rights. The children require educational facilitie~, the young people want employment, and the old are in need of special medical attention. Planning has there· fore to lay emphasis on one or the other aspect according to the age structure of the population.
The age structure of the population is not everywhere the same. It is estimated that in 1965, 37 per cent of the "mrld population was made up of children under 14 years of age. During the same year, whereas children under 14 years of age constituted only 28 per cent of the total population in the more developed countries, they formed about 42 per cent of the population in the less developed countries. The problems created by this striking contrast in ag'e structure are too serious to be ignored. In the other age groups also the contrast was noticeable. The more developed countries had a higher percentage of 'working force and also old people in their population. In the more developed countries aging of population is perhaps a more serious problem than giving education to the children and employment to the young. The contrast between the age structures of the more developed and less developed countries is likely to continue especially in the lower age groups.
Let us divide the population into three functional age groups (i) children belo'w 15 years of age (ii) workers between 15 and 59 years of age and (iii) elderly persons of 60 years and above. The first group consists of infants
88

between 0 and 4 years of age and school-going children between 5 and 1 + years of age. The workers in a country are drawn from the age group of 15 to 59 years. Some of them may still be studying and many of them may not be engaged in any occupation. However they are the potential ~workers on ~whom the rest of the population depends. The elderly persons ,viII be mostly retired persons and those who are unable to work any longer. The comparative strength of each group has serious implications on the social and economic conditions in the country.
POPULATION BY AGE GROUPS
AGE GROUP
70+
65-69
60-64
55-59
SO-54
45-49
40-44
35-39
30-34
25-29
20-24
15-19
10-14
5-9
0-4
o 4 8
POPULATION IN LAKHS (ESTIMATED -Inl)
12
Accon;iing to the 1971 Census 40.26 per cent of the population of Kerala were children under 15 years of age, 53.51 per cent were in the working age group and
89
I~

6.~2 per cent were elderly persons. The comparative strengths of functional age groups are more or less the same in the whole countrv and in the other states in India. In Tamil Nadu th~ percentage of children was slightly less and in Assam and Haryana much higher.
Are the potential citizens of the country getting sufficient attention from their parents and the State? Hardly so, since the burden is too heavy and the resources very limited. '''lhile infants and children of 8choolgoing age form 40.26 per cent of the population of Kerala, they form only 22.96, 25.61 and 31.11 per cent respectively of the population of United Kingdom, Japan and U.S.A. 'Vith a higher percentage of children in the population and limited resources, it is no wonder that children are not getting the attention they deserve. There are of course other countries in the world also in the same predicament. Pakistan and many African countries cannot also afford to give a square deal to the children.
The change, if any, in the age structure of the population is also signifiCant in making plans for the future. In 1961, the children formed 42.63 per cent, those in the v,,-orking age groups 51.52 per cent and elderly persons 5.84 per cent of the population of Kerala. By 1971, while the percentage of children came down, the percentage of 'workers and elderly persons increased slightly. This is a v,relcome trend but still our state is far behind the developed countries in having a proper balance in the functional age groups. Among the males 41.04 per cent are children, 52.99 per cent are in the working age group and 5.97 per cent are elderly persons. Among females 39.5 per cent are children, 54.03 per cent in ' the working age group and 6.47 per cent in the age group of sixty years and above.
The population can be divided into workers and non-'vwrkers based on the functional age groups.
90

Children under 15 years and elderly persons of sixty years and above are grouped as non-,\Torkers. All the persons in the age group of 15 to 59 years are classified as workers. It does not mean that all of them are actually engaged in economically productive work but they are potential ,rorkers or they form the Ivorking force of a country. "!ith a classification based on functional age groups, we can calculate in mathematical terms the share of the economic burden on the workers in a country. How many nOlFworkers are they supporting? If they are supporting too many non-workers, they have to bear a heavy burden and thev may not be able to maintain their' dependents in re~~onable comfort. The ratio of the economically inactive population to the number of workers is called the dependency ratio and it is a useful index to measure the economic condition of the population.
In India the dependency ratio is 0.92 and in our state 0.S7. As a rule the ratio is high in less developed countries and lo\\' in the more developed countries. In Japan it is 0.55 whereas in Pakistan it is 1.02. In U.K., U.S.S.R. and C.S.A. the dependency ratio is much less than that of India.
The figures given as the dependency ratios do not speak the "whole truth. It is calculated on the assumption that the persons included in the working age group of 15 to 59 are actually workers. This is more or less true in the case of the cleveloped countries and far from true in the case of less developed countries like India \vhere unemployment is rampant. If the dependency ratio is calculated based on the actual number of workers, the position of Kerala will be much worse than what is represemed by the functional age groups.
91

CHAPTER IV
How many of us can read and write?
"A high degree of education 'without the ability to fulfil the e~pectations that education nurtures is one of the most explosive factors in Kerab today". The above observation by a keen student of Kerala history and culture 1muld give the impression that Kerala sutlers from too much of education or atleast education in the wrong direction rather than the lack of it. There is no doubt that Kerala stands head and shoulders above the rest of India in the matter of literacv and the craze for education continues unabated. The 'long procession of children going to school in every part of the State in the morning is an unforgettable sight even to a casual visitor to the State. But has the enthusiasm for literacy penetrated the masses? Is our impression superficial and perhaps prejllCliced by the large scale unemployment among the educated? \re shall soon see.
In the population census conducted every ten years, certain basic information about each individual is gathered. \,,7herher the individual is literate or not is an important question at e"ery census. The population can therefore be divided into literate and illiterate everv 10 years and the progress of literacy properly assessed. A person irho can read and write is considered a literate. In the actual application, this definition of 'literacy' is capable of various interpretations. In the earlier censuses the assessment of the degree of proficiency in readin~
93

and writing "was left to the discretion and even idiosyncrasies of the census officials. Some of them insisted on a minimum educational standard to consider an individual as literate. Some others were of the view that the ability to "write a letter to a friend and read his reply "vas a good test of literacy. Hence the figures of literates in different regions of the country and at different censuses, ,vere not st~:ictly comparable. In the recent censuses, the tefm 'literacy' has been more precisely defined. A person who could both read and write with understanding was considered a 'literate' in the 1971 Census. No minimum educational standard or attendance in school was insisted upon. ChilQ~~~ and bel~}w 'were tre,~~ed as illiterates even iLtll.e_Y_lfne able to read __ ?_l_!d write-a few words and ~\'ere attending sch-ools. Iiithe 1971 Census, the highest level of education attained by a literate was also ascertained through the Individual Slip. In the case of persons having both general and technical qualifications of the same level, the technical qualification was given preference and that alone ,vas recorded. An attempt was also made to collect detailed information about graduates, post graduates and holders of technical diploma by getting the "Degree holder and Technical Personnel cards" filled up by them.
According to the 1971 Census, the rate of literacy in our state is 60.42 as against 29..15 per cent in the 'INhale country. Kerala has a literacy rate more than double that of the country, and has no close rival in the field. The creditable achievement in this field is a tribute to the enlightened policy followed by those in power in the State. Tamil N adu stands a poor second 'with a literacy rate of only 39.46. Other states are far behind Kerala in literacy. Less than one-fifth of the people of Bihar, Jammu and Kashmir and Rajasthan can read and ,vrite. Some of the Union Territories have fairly high rates of literacy, notably Chandigarh and Delhi with 61.56 and 56.61 per cent respectively. Dadra and :Nagar Haveli and Arunachal Pradesh are exceptions with very
94

,
low literacy rates of 14.97 and 11.29 respectively. However the population of the Union Territories is too small to have an appreciable impact on the general literacy rate.
PERCENTAGE
OF JAMMU & I<A.SHMIR
LITERACY RAJASTHAN BY BIHAR
UTTAR PRADESH STATES
1971 MADHYA PRADESH
ANDHRA PkADESH INDEX ORIS5A f~ HARYANA
ALL INDIA_
I~:I NAGALAND
ASSAM
MEGHALAYA
TRIPURA
MYSOR!:
HIMACHA~ PRADESH
MANIPUR
WEST BENGAL
PUNJM
GLJ}ARAT
MAHARASHTRA
TAMI~ NADU
J(ERALA
19 2iI 3~ 40 PERCENTAGE OF LiTERACY
50 60
The cultural progress of a country can be judged by the status accorded to "women in society. \Nomen can occupy positions 'of responsibility in social and public life only if they have the same opportunities as men for
95

education. Our state can justly be proud of the high rate of literacy of "women and the lead it has given to the other states in India in this fIeld. In all the states in India, the rate of literacy is higher among males and in many states it is nvice or thrice that of the females. In the whole country the males are twice as
PERCENTAGE OF LITERATES IN EACH SEX BY STATES, 1971
PtRcENrAGE INDEX P~RCHITAGE
LITERATE L..II!IJLLlTeRATE
literate as females. In Bihar, Jammu and Kashmir and Rajasthan about 90 per cent of the females cannot read and write. In Tamil Nadu, which stands second both in male and female literacy, only 26.86 per cent of the
96

females are literate whereas 51.78 per cent of the males are literate. In Kerala 54.31 per cent of the females are literate while fi6.62 per cent of the males are literate. The difference in percentage of literacy in Kerala is only 12 ,vhereas in Tamil Nadu it is 25. :More than an}:thing else it is this near equality in literacy between males and females that reflects the progressive outlook of the State. It is likely that even this slight inequality will be 'wiped out in the near future. But not so in the case of the other states in India. They have to go a long way before they can achieve a high rate of literacy anel remove the wiele disparity between the rates of literacy of males and females.
As is to be expected, the literacy rate is higher in the urban areas of the State than in the rural areas. It is 66.31 per cent in the urban areas and 59.28 per cent in the rural areas. The difference in percentage is only about 7, negligible when compared with the wide disparity between the urban and rural literacy rates in the other states. The difference between the percentage of urban and rural literacy is nearly 29 for the whole of India. around 25 in the neighbouring states of Mysore and Tamil Nadu and more than 30 in Madhva Pradesh and many other states. In Alleppey district O'f our state the literacy rate is actually higher in the rural areas than in the urban areas of the district. Perhaps in no other place in the 'world, the rural areas will be ahead of urban areas in literacy. Incidentally Alleppey is the most literate district in Kerala and it shows that in order to come to the lead in literacy, our village dwellers 'who form the vast majority of the population should not be neglected. There are two special features which have contributed to the unchallenged leadership of Kerala in literacy. The women are not faT behind the men in education. Secondly education is not the monopoly of the urban population. The rural population is close behind the urban population in the ability to
)
97
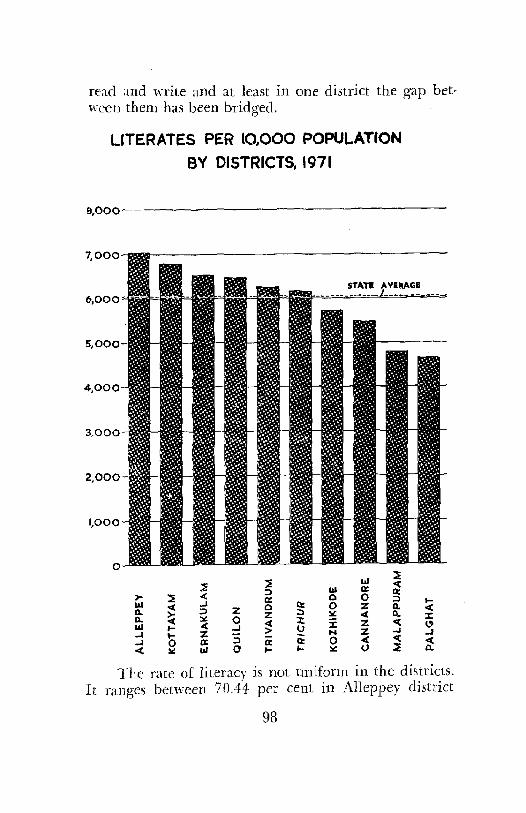
read and write and at least in one district the gap between them has been bridged.
LITERATES PER 10,000 POPULATION
BV DISTRICTS, 1971
8,000--------------------
'l 11.1 :::t ~
<{ ::> III a: D:
)" ~ « a: Q 0 ::> 1&.1 ..J ....
oe( Q a: 0 % Q. 0« 0-~
::> z z ;:, ~ .« Cl.. 0- ::.:: 0 J: IIJ .« <t :t: :J: % <{ I-' .... ..J > I,J .... to- % N % ..J ..J .... 0 0: ;:, a: ii: 0 .« <{ <t 4; ::.:: w (} .... ,_ ::.:: 0 ~ 0..
The rate of literacy is not uniform in the districts. It ranges between 70.44- per cent in Alleppey district
98
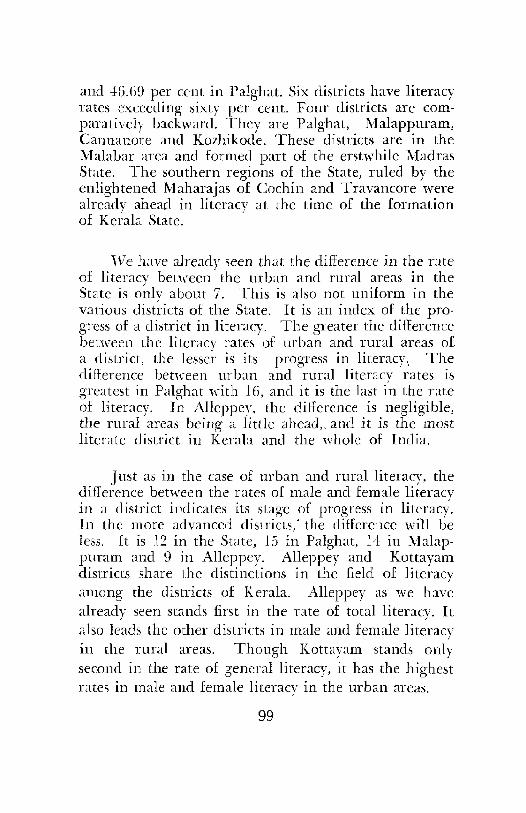
and 46.69 per cent in Palghat. Six districts have literacy rates exceeding sixty per cent. Four districts are comparatively backward. They are Palghat, rVlalappuram, Cannanore and Kozhikode. These districts are in the ,\falabar area and formed part of the erstwhile Madras State. The southern regions of the State, ruled by the enlightened Maharajas of Cochin and Travancore were already ahead in literacy at the time of the formation of Kerala State.
,\Ve have alreadv seen that the difference in the rate of literacy between" the urban and rural areas in the State is only about 7. This is also not uniform in the various districts of the State. It is an index of the progress of a district in literacy. The greater the difference between the literacy rates of urban and rural areas of. a district, the lesser is its progress in literacy.. The difference bet,,-een urban and rural literacy rates is greatest in Palghat with 16, and it is the last in the rate of literacy. In Alleppey, the difference is negligible, the rural areas being a little ahead" and it is the most literate district in Kerala and the whole of India.
Just as in the case of urban and rural literacy, the difference between the rates of male and female literacy in a district indicates its stage of progress in literacy. In the more advanced districts,' the difference will be less. It is 12 in the State, 15 in Palghat, 14 in :\Jlalappuram and 9 in Alleppey. Alleppey and Kottayam districts share the distinctions in the field of literacy among the districts of Kerala. Alleppey as we have already seen stands first in the Tate of total literacy. It also leads the other districts in male and female literacy in the rural areas. Though Kottayam stands only second in the rate of general literacy, it has the highest rates in male and female literacy in the urban areas.
99

."
.. II
15' 16·
MYSORE
ARABIAN
SEA
PERCENTAGE OF RURAl..
LITERATES TO TOTAL
RURAL POPULATION
[<j BELOW SO 00
~ 5000-59'99
~ 60'00 -69'99
~ 70 00 AND ABOVE
STATE AVERAGE 59·28
~ 75' EAST OF GREENWICH 76·
n'
KERALA RURAL LITERACY
BY DISTRICTS, 1971
lO I. • ,. .. MILES
t 'l1i i3'];;;;;; .. 12" 20 'I) 1QI '"
STATE BOUNDARV-'-' DISTRICT BOUt'IOART _._
TAMIL NADU II·
BASED UPOx ~URVEY .OF IKDIA .MAP. THE 'IERRlTORIAL WATERS OF Ir.;PIA EXTEKD uno TflE SEA TO A D1STAl\TCE OF Tl'"El'"E NALiTlCAL I.Ul..ES MEA.srRED rRQJ.1 THE A)?PROPRIATE BASE LlNE.
100
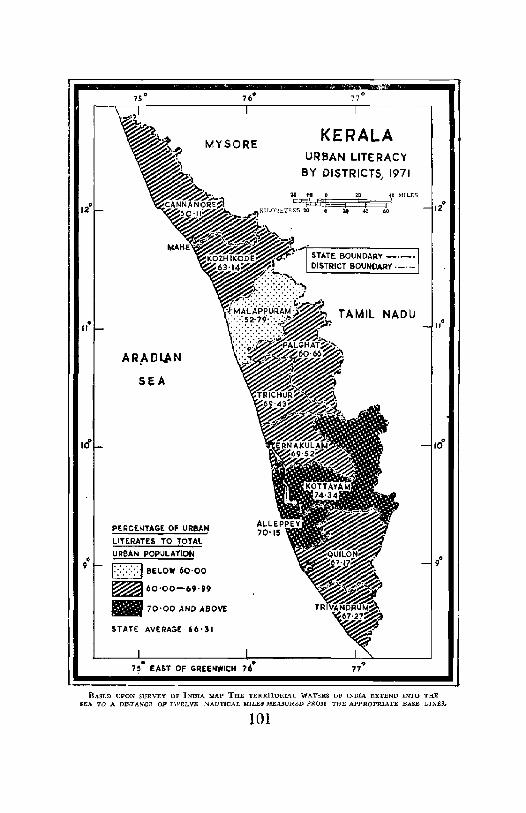
• II
• 9
ARADl,I.N
SEA
MYSORE
PERCEIfYAGE OF URBAN
LITERATES TO TOTAL
URBAN POPULATION
1::::::::'.1 BELOW 60'00
~ 60'00-69'99
l1li70'00 AND ABOVE
STATE AVERAGE 66'31
,,0 EAST OF GREENWICH .,6·
KERALA URBAN LITERACY
BY DISTRICTS, 1971
20 olD MILES
i '" .0
STATE BOUNDARY _._.
DISTRICT BOUNDAAY·_·_
TAMIL NAOU
BASED UPON SURVEY OF lSDIA :!t.l.~P THE TERRlTOR[AL WATERS OF I~DlA EXTEND INTO THE SEA TO A DISTANCE OF n'r~.ELVE NAU'rlCAL MILES MEASURED FRO}! THE APPROPRIATE BASE LJ:N£S..
101

According to the rate of literacy, the taluks in the State may be divided into four groups. There are 12 tainks with a literacy rate of less than 50 per cent and seven "'lith a rate of above 70 per cent. The largest number, 27, are in the range 60 to 70 per cent and the remaining 10 taluks are in the range of 50 to 60 per cent literacy rate. All the taluks except Devicolam, which are lagging behind in literacy are in the Malabar area. The seven taluks in the lead are all in the Central Travancore area, in Kottayam, Alleppey and Quilon districts. These taluks are Meenachil, Kottayam, Changanacherry, Thiruvalla, Kuttanad, Chengannur and Pathanamthitta. Thiruvalla stands first with a rate of literacy of 78.29 per cent. No taluk in MaIappuram and Palghat districts has reached a literacy rate of 60 per cent while there is no taiuk in Alleppey, QuiIon and Ernakulam districts with a literacy rate of less than 60 per cent. Ernakulam has the greatest uniEormity, all taluks are in the same range of literacy of 60 to 70 per ceht. South \"ynad, Kasaragod, Hosdrug, North \Vynad, Ernad, Tirur, Ponnani, Mannarghat, Palghat, Chittur, Alathur and Devicolam are in the Imvest range of literacy rate in the State. Among them I\1annarghat ranks last with a literacy rate of 38.4 7 per cent. These taluks require special attention in the drive for cent per cent literacy in the State.
Among the cities in India Alleppey has the pride of place of being the most literate city in the country. Naturally the five cities in the State have comparatively high literacy rates. There is only one city with a literacy rate of above 70 per cent while there are seven taluks in the State sharing that honour. The literacy rates in the cities range from 65.38 per cent in Calicut Corporation to 70.04 per cent in Alleppey municipal town. \\Then the smaller municipal towns are also considered Thiruvalla stands first 'with a hig'h literacy rate of 79.31 per cent. Kasaragod municipal town is the last with 56.04 per cent.
102

vVe can get a more realistic rate of literacy if children below .5 years of age are excluded from the calculation, as they are in any case, considered as illiterates_ The number of illiterates in the State excluding children below 5 years of age was 6 L4 lakhs in 195 L It rose to 64.6 lakhs in 1961. According to the estimate now available, the number of illiterates has gone down to 55.9 lakhs in 1971. There is an unmistakable trend towards the wiping out of illiteracy.
The rate of literacy, got by excluding children below 5 years of age may be called 'effective rate' of literacy. In 1901, the effective rate of literacy in Kerala was only 12.85 per cent. By 1961 it rose to 55.08 and in the present census the rate went up to 69.75. The increase is su1:Jstantial and is perhaps indicative of the fact that there is effective enrolment of all the children of the age of 5 to 9 years in the schools.
The enviable position that our state occupies in literacy rate was not achieved in a day. It is due to a happy combination of tradition and deliberate planning. Being a coastal region with several ports, the State .vas subject to foreign influence from very early days. Christian missionaries from abroad and various religious organizations in general have contributed in no small measure wwards the spread of Ii teracy among the masses. Their efforts ,vere encouraged and sustained by those in power. From very early days, the women in this part of the country enjoyed almost equal status with men and their education was not neglected. Howeyer there were comparatively backward regions and communities. As a matter of state policy, backward communities are given special incentives like financial aid in addition to free education and preferential treatment in recruitment to Government service. Regional disparities, '\Nhich are also being removed, are due to historic reasons. Travancore and Cochin were ruled by enlightened rulers, many
103

of them liberal patrons of art and literature. Christian missionaries from abroad opened educational institutions in many parts of the State but central Travancore benefited most from their enterprise. Even before independence, steps were introduced in Travancore State to make primary education free and compulsory. Malabar area, under the erstwhile Madras State did not enjoy these benefits to the same extent.
The educational statIstlcs of the State and the expenditure on education from the state budget are highly impressive. There are 1,393 high schools and 9,437 primary schools in the State. Of these fi,154 schools are managed by private agencies which works out to 62.36 per cent. Except for 120 un-aided recognized schools, the responsibility for payment of the staff of even private schools rests with the Government. There were 49.8 lakh of pupils attending schools during 1971-72, the bulk of them 42.3 lakh 'were in primary schools. As much as 47 per cent of the pupils were girls. The percentage of enrolment in schools has increased from 1'7.5 per cent of the population in 1956-57 to 22.5 per cent, in 1971-72. It is cIaimed that there is cent per cent enrolment of the population in the age group:) to 9 in schools. It is estimated that 37.9 per cent of the budgetary expenditure is spent on education. The expenditure on school education was Rs. 51.41 crores in 1970-71. The per capita Government expenditure on education has increased from Rs. 6.30 in 1960-61 to Rs. 27.45 in 1970-71.
Every effort is being made to establish schools within easy reach of the children even in the remote areas. There are 44 primary schools and 6 high schools per lakh of population. In 1960-61 there was one school per 2.~J7 sq. km. and in 1970-71 one school per 2.62 sq. km.
104

Still the ideal of cent per cent effective literacy has not been reached. 'While there has been commendable progress in the enrolment of children in schools, it appears that solution of adult illiteracy has been left to time.
105


CHAPTER V
OUf
mother tongue Language is the chief means of communicatioL
among human beings. ~'Iaking various kinds of noises and movements of the body as methods of communication are shared by the rest of the animal world. But speech is a uniqu~ gift of the human race. \\7e never pause to think of this ,vonderful facility to give expression to our ideas in words, ,vell understood by others, until 'we see somebody who is denied that gift. In a sense the uttered 'word' is not so universal as the 'gesture', the meaning of which is understood by alL There are in the "world many linguistic groups. 'Vhile a common language makes people more intimate, diversity in language can cause misunderstandings. In our country there are many languages and dialects. Actually they are too numerous to identify and list out properly. But the common man's sphere of activity is so limited that he may not be troubled by the ignorance of languages other than his own mother tongue. Knowledge of several languages is certainly an asset. It helps one to understand and appreciate the art and culture of orhers.
The chapter on language in the 190 I Census Report of India was contributed by an eminent linguist G. A. Grierson. He was overwhelmed bv the rich variety of languages and dialects he came ~cross in the In(lian subcontinent. He says "There are parts of India that
107

recall the plain in the land of Shinar where the tower of old was built, and in which almost each of the rpany mountains has its own languages, and there are great plains, thousands and tens of thousands of miles in area, over 'which one languag'e is spoken from end to end. And over all there broods the glamour of eastern mystery. Through all of them we hear the inarticulate murmur of past ages, of ages 'when the Aryans 'wandered with their herds across the steppes of Central Asia, Ivhen the Indo-Chinese had not vet issued from their home on the Yang-tse-kiang, and p~rhaps 'ivhen there existed the Lemurian continent where now sweep the restless Kaves of Lhe Indian Ocean". Now also the linguistic situation in the country is not verv different. In the plains, as Grierson noticed, large 'numbers of people speak the same language. But in hilly areas and isolated pockets, different ethnic groups speak different languages and dialects bev{ildering in their variety. No ,\-onder, 548 million people spread out over more than 3 million sq. km. of nneven territory, speak a variety of tongues. As many as 1,652 mother tongues 'were re-corded in the 1961 Census of India.
Collection of data on languages 'was considered important from the beginning of Census in India, and from 1881, the mother tongue of every person enumerated was recorded. In 1881 'mother tongue' was defined as 'the language ordinarily spoken in the household of each person's parent', In the 1891 Census the question was 'parent tongue' in the place of 'mother tongue'. In the 1901 Census 'the language which each person ordinarily used in his own home' ,,,,'as recorded. This gave rise to confusion as some persons gave the languages they ordinarily used for communication instead of the~r native t~ngues. Instructions were therefore revised in the next decennial census and the language that <1 person 'ordinarily spoke in the household' was entered. In the case of infants and deaf-mutes language
108

of the mother W,IS recorded. In subsequent censuses, this definition remained almost unchanged. In the 1921 Census the question ·was 'language onlinarily used'. From 1951 onwards tbe question was again 'mother longue'. An additional question 'other language in common use', 'any other language' or 'bilingualism' was also asked in later censuses. In 1961 'mother tongue' was defined as the language spoken in the childhood by the person's mother to the person or mainly spoken in the household. There ·was no change in 1971 but elaborate instructions ,,,,,ere given to the enumerators to record the mother tongue in full whatever be the name of the language as returned by the respondent. The definition of mother tongue has changed only slightly since the data on languages were begun to be collected. Hence the data collected through the censuses are comparable and capable of yielding useful conclusions.
India has a tradition of linguistic study and research comparable with that of many advanced countries in the world, It is due to the fruitful co-operation of the census organization and the Linguistic Survey of India that a svsrematic analYsis and classification of Indian languag'~s were made possible. Eminent scholars who attended the Oriental Congress of Vienna in 1886 urged upon the Government of India to undertake a systematic survey of Indian langu:lges. The Government of India appointed Sir George A. Grierson as the Superintendent of Linguistic Survey Operations. He was also associated with the decennial census of 1901 and he analysed the language data and "wrote a chapter on language in the 1901 Census Report of India. His contribution is acclaimed as a landmark in the ",,-orId of linguistics. The Linguistic Survey drew heavily upon the language clata collected through decennial censuses of 1911 and 1921. In the same way it Ivas possible to analyse language data in a scientific and coherent manner in the 1931 Census making ll~e of the
109

great Linguistic Survey completed in 1927. There were no language reports in 19·1} and 1951. In the 1961 Census, the broad framework of Grierson's classification of languages was adopted, supplemented by the later researches in the field of linguistics.
Sir George Grierson was a civil servant turned linguist. In 1898 he became the Superintendent of the Linguistic Survey of India. His own interest in languages began much earlier. The Linguistic Survey of Indiaconsisting of XI octavo volumes of which 5 were in 14 parts-was finally published in 1927. He classified languages mainly based on grammatical or structural wnsiderations. The smallest unit was called a 'sub-dialect' and the broadest was known as 'family'. The large population of this subcontinent is composed of people of diverse social elements and cultures. The languages are classified mainly into four distinct families -the Austric, the Tibeto-Chinese, the Dravidian and the Indo-Eur~pean. The Dravidian languages are T elugu, Tamil, Kannac1a and Malayalam. Of these languages Tamil has preserved the Dravidian character best as the others were influenced by Sanskrit to a large extent.
Innumerable languages and dialects are returned as mother tongues in the census. It is an arduous task to identify and classify them. In some cases further field investigation is found necessarv to establish their identity. This was the pTOcedure follow'ed in the 1971 Census als~. The order brought about in the presentation of linguistic picture owes much to the pioneering ,vork done in this field bv Grierson.
I
There are 15 languages specified in the Eighth Schedule to the Constitution of India. They are Assamese,
110

Bengali, Gujarati, Hindi, Kannada, Kashmiri, Malayalam, Marathi, Orip, Punjabi, Sanskrit, Sindhi, Tamil, Telugu and Urdu. Hindi is the mother tongue of about 163 million people making up nearly 30 per cent of the population of India. 0J"ext comes Bengali with 45 million speakers. But they represent only 8 per cent of the total population. People speaking the Dravidian family of languages number over 126 million which is 23 per cent of the population of the country. Among the Dravidian languages, Telugu has the largest number of speakers, about 44.8 million, Tamil speakers number 37.7 million, Malayalam 21.9 million and Kannada 21.7 million. Only 4 per cent of the people of India have IVlalayalam as their mother tongue.
Before the reorganization of the States in India on a linguistic basis the Malayalees ,vere distributed in the two princely states of Travancore and Cochin and the Malabar district of .vfadras State. Though they were under three different administrative ul1its~ the ~ultural unity of the people was never in doubt. The formation of Kerala State. with Malayalam as the State language or 'Aikya Keralam' was a long-standing demand of the Malavalees. On 1st Kovember 1956, Kerala State was form~d bringing together the Malayalees under one political unit.
"1\Ialayalam ranks third among the four South Indian languages' belonging to the Dra~idian family. According to Grierson "its name is derived from mala, the local word for 'mountain', with a termination ",rhich some explain as meaning 'district', and others as meaning 'sudden slope'. It is a modern offshoot from Tamil, dating from, say, the 9th centurv. In the 17th century it became ~ubject to Brahm~nical influence, receive'd a large infusion oJ Sanskrit words, and adopted the Grantha instead of the Vatteluttu character for its alphabet". During the period from 9th to ) 2th centuries a new
III

literary language knO'wn as 'l\lanipravalam' a mixture of Tamil and Sanskrit came to be used. ~falayalam was originally the language of the masses and Sanskrit the schO'larly tongue of the higher castes.
A ne"lY form of poetic expression, came to be practised from the 14th century, known as 'Champu' in \\'hich prose and verse were mixed. Almost during the same period long epistles in \-erse called 'Sandesa Kavyas' were also in fashion. Krishna Catha of Cherusseri ~ambO'othiri composed in the 15th century is the earliest artistic work in .:\1alayalam of outstandll1g merit.
The most significant contribution to' Malayalam literature during the latter half of the 17th century 'I'as made by Tunchath Ramanujan Ezhuthachar{. ,\"illiam Logan observes that "it was no less than a rnolution 'when in the seventeenth century one Tunch::tth Ezhuthachan, a man O'f the Sudra (Napr) Caste, boldly made an alphabet the existing ~lalayalam one --derived chiefly from the Grantha-the Sanskrit alphabet of the Tamils, which permitted of the free use of Sanskrit in writing-and boldly set to work to render the chief Sanskrit poems into l\Ialayalam". His Adhyotma Rarnoyona, ivlahabharata and Aloha Bhagavatha afe the greatest classics in J\Jalayalam literature. He is known as the 'Father of the Malayalam Language'.
In the second half of the ] 7th century 'Attakatha' ,,'as introduced as a new branch of literature. ,Vhile actors played their parts on the Kathakali stage, these verses were sung by singers in the background. The 'j\alacharitam' bv Unnai "ranier is the best known among the Kathakali works. In the 18th century Kundun l\;ambiar introduced a ne'w literary type of dancedrama called 'Thullal'. As a scholar observes "there is
ll2

a strong indivirluality about his '\Torks. From any collection of quotations, his lines could be easily picked out. The cadences of the verses are perfect. His verses flow with a grace and elegance that are charming indeed, now and then, they are spirited, at other times they rise to an indignant and dignified eloquence; here and there are passages of keen sarcasm. His works are strewn with jewels that 'will sparkle forever". It 'was noteq. for its local colour, satirical criticism of contemporary society and a keen sense of humollL During the 18th and 19th centuries the language was further enriched by contribution from an altogether different source, namely Christian missionaries .\'ho took seriously to the stllcl), of .Malayalam language and literature. 'The ~lalayalam-English Dictionary by Dr. Hermann Gundert (1872) deserves special mention.
In the 19th and 20th centuries the growth of M alayalam literature was phenomenal. Contact ,v-ith western literature, new social and political theories, and the concern of writers 'with the social and political problems \vidcned the horizon of I\Jalayalam literature. l\Ialayalam poetry found its full expression in the ,yorks of Vallathol Narayana Menon, Kumaran Asan and UUur S. Parameswara Iyer. Simultaneously other branches of literature like novels, short stories, elrama, literary criticism, essay and scientific literature, travelogue, and biography also flourished. Some of the Malayalam writers can be compared with the best in India and abroad. IVlahakavi G. Sankara Kurup was selected for the Bharatiya Gnanapeetam a'ward in 1966.
How many people speak Malayalam? The 1971 Census reveals that there are 2 I 9 1akh of IVfalayalees in India and that out of them 205 1akh live in Kerala. Out of 14 lakh of fVIalayalees who live in the other States and Union Territories in India, about 5.6 1akh are in Tamil Nadu and 4.2 lakh in the other neighbouring
l13 8-1 Census Kerala/73

state of l\fysore. But the adventurous Malayalees are found not only in every part of India but also in the cities and remote areas all over the ·world. \Ve do not know how many ~hlayalees live abroad. Malayalees are a very adaptable people. No l'vfalayalee could go to the moon yet but probably he will be among the first to settle down there!
In the 1971 Census, 132 mother tongues 'were recorded in Kerala. The first 10 numerically strong languages are :\hlayalam, Tamil, Tulu, Kannada, Konkani, Telugu, Marathi, Urdu, Hindi and Gujarati. 96.01 per cent of the people speak iVIalayalam and 2.37 per cent, Tamil. There are 5 lakh of Tamils but the other linguistic minorities number less than I lakh each.
The linguistic picture is more or less the same in the districts. Malayalam is the most predominant language of all the districts. The percentage of Malayalam speakers varies from 88.06 per cent in Palghat to 99.82 per cent in Malappuram district. Tamil minority is sizable in certain areas. It is smallest in Malappuram with 0.09 per cent and largest in Palghat district with 10.12 per cent. Tamil is another Dravidian language and the state language of the neighbouring state. Its influence on Malaya1am is recognized by all. According to Grierson 'Tamil is the oldest, richest, and most highly organized of the Dravidian languages; plentiful in vocabulary, and cultivated from a remote period'. The Tamils are found in large numbers in three districts, Palghat, Kottayam and Trivandrum. They had settled down in these districts long before the reorganization of the states in India on a linguistic basis. Palghat was part of the erstwhile Madras State and Tamils had settled down there as cultivators and traders. Trivandrum district, before the formation of Kerala State, extended up to Cape Camorin and the southern parr of the district had a majority of Tamil speakers. The region
114

with a Tamil majority, now called Kanyakumari district, was separated from Trivandrum district and added to Tamil Nadu. In the remaining part of Trivandrum district bordering Tamil Nadu and in the capital city of Trivandrum, Tamils are found in fairly large numbers. Devicolam, Peermade and Udnmbanchola, the hilly. regions of Kottayam district ·were opened up for tea and <:ardamom plantations mostly by foreign companies before Indian independence and they brought labourers from the adjoining State to ·work in these estates. Kottayam district has a sizable Tamil population due to the presence of Tamil labourers in the estates in the high ranges.
There is only a slight difference between the linguistic compositions of the population of rural and urban areas. Naturally in the rural areas, except in the high ranges and near the State boundaries linguistic minorities are found only in small numbers. In the urban areas, in business and employments, there is a larger proportion of linguistic minorities. Even in urban areas, however, they make up less than 10 per cent of the population. l\Jalayalees form 96.73 per cent of the rural population and 92.33 per cent of the urban population. Speakers of the South Indian languages are found both in urban areas and rural areas. Tamils form 2 per cent of the rural population and 4 per cent of the urban population. Speakers of the North Indian languages are scattered mostly in the towns.
The cities of the State present a greater diversity of languages. Cochin Corporation is the most cosmopolitan among them. There are speakers of 89 different mother tongues in the city. Only 45 mother tongues are represented in Trivandrum city, and 3 I in Calicut city. Cochin has the lowest percentage of Malayalees and the largest variety of languages. Only 88. I 7 per cent of the population are Malayalees. 'VhiIe Tamil ranks
115

second in all the other cities in the State, in Cochin this place is occupied by Konkani. 96.39 per cent of the population of Calicut city are Malayalam-speaking. This is the highest among the cities. The language second in rank is TamiL But Tamils make up only 1.56 per cent of the population of Calient Corporation. In Alleppey there are only 26 muther tongues. The third linguislic group in the city is Konkani speakers. They form 2.54 per cent of the population. Quilon has a greater percentage of Tamils than Alleppey. 7.35 per cent of the population are Tamils. There are 774 persons in Quilon city who speak English as their mother tongue. In the capital city 87.57 per cent of the population are :Malayalees. Tamils constitute 10.15 per cent of population of the city. No other city in the State has such a high percentage of Tamil linguistic minority. Though there arc 43 other mother tongues represented in the capital city, the speakers of all these languages hardly make up even 2.5 per cent of the population.
116

CHAPTER VI
The religions we follow
The Indian civilization is characterised by its deeply religious outlook. Religion affects the lives of the people in several ways. Food habits, concepts of health and hygiene, ceremonies connected ,vith birth, death and marriage differ from one religious community to the other. Some of these factors affect even the economic conditions of the people. As such the religious affiliations of the people is an important question in the census enquiry.
India has the legacy of a civilization dating back to several centuries before the Christian Era. The excavations of Harappa and Mohenjo Daro have brought to light religious symbols evolved by a very ancient civilization of 3000 B.C. or perhaps earlier. This means that the people of India had practised forms of ,vorship long before the Aryan immigration. The Aryans did not altogether abandon the earlier practices. T t has been said that the Vedic Aryans partly assimilated and partly destroyed the earlier culture.
Hinduism is the predominant religion in the country. Out of 548 million people in India, 453 million (82.72 per cent) are Hindus. Hinduism is noted for its receptivity and all·comprehensiveness. 'Within its ever widening fold there are people of diverse faiths. People
117

of all intellectual levels find solace in it. The mystic as well as the common man finds food for thought in its philosophy or satisfaction in the splendour of its ceremonies. Because of its infinite adaptability it was enriched rather than \\'eakenecl by the impact of other religious philosophies. The Vedic and Epic periods are milestones in the history of Indian philosophy. The system of religions teachings em bodied in the Vedas and epics survived the impact of Buddhism anel other religiom. in India. The proportion of Hindus exceeds 50 per cent of the population in all the States and Cnion Territories except Punjab, }'unmu ;mcl Kashmir, ~teghalaya, Nagaland, Arunachal Pradesh and L.IVL and A. Islands.
Islam. the second of the major religions in India was brought to India by Arab traders. Later conquests bv the Muslims swelled the followers of Islam. The Delhi Sultanate was established in 1~06 A.D. Only a small proportion of the 1\1 uslims are the descendants~ of the immigrants. The vast majority are converts from other religions. There ,,"ere concentrations of M nslims in many parts of the Indian subcontinent. The partition of India resulting in the establishment of Pakistan with 1\luslim majority, reduced the proportion of Muslims in India. Still they have retained their place as the second in numerical strength. They number a little over 61 million and make up 11.21 per cent of the population. These are the only two religions in India ~d1ich claim a following of m.ore than 10 per cent of the population. The Union Territory of L..M. 8.: A. Islands has 94.~)7 per cent of its population returned as ~luslims. The only other state which has more than ;")0 per cent of its population belonging to Muslim comm.unity is Jammu and Kashmir.
The third, Christianity has only 14 million follo-wers, making up 2.6 per cent of the population. Nagaland
118

is the only state in I nelia where the Christian population exceeds more than fifty per cent.
In all there are only six religions in Indi3. which have more than 1 million followers e3.ch. They are Hinduism, Islam, Chri~tianity, Sikhism, Buddhisn~ and Jainism in the order of numerical strength. There are 10.4 million Sikhs, B.8 million Buddhists, and 2.6 million JaillS in the country. .
During the decade 1961-71 Christianity registered the highest growth rate and Buddhism the luwest. In 1961 Hindus maele up 8:1..11 per cent, l\I uslims 10.70 per cent and Christians 2.4-1: per cem of the population of the country. '\,hile the proportion of Hindus to the total population has gone dO\\'l1 slightly the percentages of the other t,,·o communities have increased slightly.
The three maJor religions of India are represented in our state. According to the 1971 Census in the State the Hindus number 12.7 million, Christians 4.5 million and l\Iuslims 4.2 million. Just as in the whole country, Hinduism is the predominant religion. 'Vhile :\Iuslims are the second lar.2;e~t comlTlunity in Inelia, in Kerala, the second place is occupied by Christians. l\f nslims are the third largest community in Kerala and they arc not far behind the Christians in numerical strength. The Hindus account for .19.4] per cent, Christians 21.0:) per cent and .Muslims 19.50 per cent of the population of Kerala. These three major religious communities together make up 99.96 per cent of the population of Kerala whereas in the whole country they constitute 96.53 per cent of the population.
The introduction of the major religions into Kerala and their impact on social life are a fascinating study.
119

The Dravidians of Kerala had their own religious rites and practices before the religions of the north entered Kerala. The\ ·worshipped the deities ·which guarded the borders of their villages, the demons that caused diseases and the spirits that inhabited hills and trees. There is evidence to show that they also believed in ancestor worship. The Dravidian practices continued even after the advent of Jainism and Buddhism but gradually declined in course of time mainly due to the impact of Vaishnavite and Saivite movements. It is believed that Buddhism came to Kerala about the third century B.C., during the reign of Asoka. It started to decline from the 8th century A.D. and disappeared by the 12th century but nor without leaving a lasting impression on Kerala society. The Aryan influence is said to have started in the 3rd century B.G. with the ani val of the first batch of immigrants. 'Their influence was slow, steady and lasting. They adopted certain Dravidian practices and introduced their own ideas of diet and caste system 'ivithout provoking any serious obiection from the natives. The Hindu religion was a svntllesis of the Dravidian ideas of the south and the Ar)'an ideas of the north and the Aryanisation of Kerala was effected in a subtle manner by a gradual process rather than by the force of arms. Ultimately Buddhism which wielded much influence was also absorbed into the eyer widening fold of Hinduism.
The Christians of Kerala are the second largest religious community in the State. It is believed that Christianity was brought to Ke1-ala in the 1st century A.D. by St. Thomas, one of the twelve apostles of Christ. According to the tradition cherished by the Christians of Kerala St. Thomas landed at Ivlali:mkara near Ivluziris (Kodungallur) in 52 A.D. converted several Brahmins and others to Christianity and founded seven churches on the :Malabar coast. Contacts between the Malabar coast and the ports of the Roman Empire were frequent
120

eyen pnor to the Christian Era and there is nothing inherently impossible in the popular tradition. St. Thomas could have reached .Malabar, if he so desired ami he had every chance of hearing about the land which supplied the spices to the civilized countries. During the course of a £e-w centuries Christianity made rapid progress. But the .Malabar Christians 'were subjected to the conflicting influence of the foreign missionaries who visited Kerala during 'various periods. Originally Christians of Kerala used the Syrian liturgL But the Latin Christian missionaries, on their arrival, introduced the Latin rites which gained permanency during the Portuguese period. During the 19th century, the Anglican missionaries 'who came to 'work in the SHian church broke off from the Syrian church and e~tablished their ovm churches. Qr;ite a number of other Protestant organizations from the western coun· tries extended their work to Kerala during the same period.
Muslims are the third in numerical strength in Kerala. As there had been considerable trade between Kerala and Arab countries even before the time of Mohammed, the Prophet, Islam ",vas also introduced into Kerala at an early date, in 8th centurY A.D. Like the Christians and th~ .J e'ws the Arab trad~rs also sett· led down near Kodungallur. Islam made rapid progress in course. of time. It is said that the last of the Chera emperors Cheraman Perumal embraced Islam and went on a pilgrimage to Mecca. The Zamorin's navy 'was manned by Muslims. There was a greater concentration of Muslims in the northern districts of Kerala than in the other parts of the State.
All the three major religions have follmvers in all the districts of the .State. But the distribution does not follow the state pattern everywhere. In seven out of 10 districts in the State, Hindus make up more than 50 per
121

cent of the population of the respectiYe districts. In Kottayam and Eranakulam, they are less than 50 per cent, Malappuram is the only district in the State ",here Hindus take tile second place in numerical strength. In ;,\1 alappuram ().).9:) per cent of the population are Muslims whereas only SL08 per cent are Hindus. There is no district in the State where Christians are the largest community. 111 Kottayam and Ernakulam districts they account for 46.9.') and 41.7)4 per cent of the population respectively. Only l.99 per cent of the population of
KERAL"
KOZHIKODE
MALAPPURAM
PALGHAT
TRICHUR
fllNAKULAM
KOTTAYAM
ALLEPPE~
QUILON
PERCENTAGE DISTRIBUTION OF POPULATION BY
MAJOR RELIGIONS, 1971
ilillillill • II • HINDUS CHRI5TIAN5 MUSLIMS OTHERS
~""",,"iii::: i,l!.ii!
l\blappuram are Christians. In addition to Malappuram district 1\1 uslims are also well represented in Kozhikoele, Cannanore and Palghat districts with a strength of more than 20 per cent of the total population. The
122

followers of the other religions are yery small in number. ]n the whole state there are only 3,~36 .1ains, 1,284 Sikhs and 605 Buddhists. The Jains are found mostly in Kozhikode and Ernakulam districts. the Sikhs in Ernakulam district and the Buddhists in Trichur and Ernakulam districts .
.T ews came to the Kerala coast after the destruction of the Second Temple at Jerusalem by the Romans in 70 A.D. There are two classes of je1\'s viz. 'White Jews and Black Jews. 'Yhite Je,\'s are said to be the migrants from Spain, Italy and other European countries while the Black Je,\'s claim to haye come from Yemen and Babylon. The Jews led a 'very peaceful life till the arriyal of Portuguese in 1498. The Portuguese adopted a policy of persecution against the Jewish settlers in Kodungallur and they had to shift their residence from there to T\Jaltancherry, Chennamangalam and other places. The birth of the state of Israel in May 1948 had brought great enthusiasm in the minds of Jews and most of them migrated to Israel. Now their number has dwindled and the latest census showed that there were only 112 .J e,,'5 in Kerala.
111 all the cities of the Slate the H inclus form more than :,)0 per cent of the population except in Cochin Corporation where only 42.46 per cent of the population are Hindus. In Triv:lnclrum, their proportion is highest with a percentage of 7:l.5:1 of the population of the city. Christians are a sizable minority in Cochin, Alleppey and Quilon towns. 1 n Cochin they account for ~ID.76 per cent of the population. But in Calicut Corporation they form only 4.39 per cent of the population. The Muslim population ranges from 10.45 per cent in Trivandrum to 33.3? per cent in Calicut Corporation. Except in Cali cut they form the third largest religious group in the cities of Kerala. Hindus are the largest religious group in all cities and Christians
123

are the second largest group except in Calicut. In all the cities there is a sprinkling of Jains, Cochin and Calicut having the larger groups. There are also some Sikhs in the cities notably in Cochin and Quilon. A very small number of Bllddh ists are found ~in Cochin and Quilon.
There are some interesting trends in the proportion of the major communities to the total population during the past seyen decades. The Hindus formed 68.36 per cent of the population in 1901. Their proportion is
~-----------------------------------------~ GROWTH OF MAJOR RELIGIONS
1901-1971
~~----~----T-----~----------~----~--~
l&+-----+-----+-----+_----+-----+_----+--~ #4. l
I CHRISTIANS /1\ I MUSLIMS ~/ lO+-----+-----+-~./~·-+-'1·---+----_+----_+~·~~--~
/
f I o+-~--+_----+_----+_----+_----+_----+_--~
1901 lUI 19lf 19~1 1951 1961 1971
124-

gradually falling. It has come down to 59.41 per cent in 1971. In 1961, it 'was 60.83 per cent. The proportion of Christians on the other hand is slowly but steadily increasing. From 1931, the rate of increase has slowed down considerably. In 1961 it ,vas 2l.22 per cent and in 1971, it has actually come dnwn slightly to 21.05 per cent. In the case of :Muslim population, the proportion remained almost steady from 1901 to 1961 but showed a sudden spurt during the last decade from 17.91 to 19.50 per cent.' The followers of other religions are too small in number to show any ~ignificant trend in the rate of growth.
The cultural unity of the Malayalees who follow the three major religio~s of the world is emphasized by K. P. S. Menon in his book 1Vlany tV orids. "A narrow strip of land stretching along the j\Jalabar coast in the south-west corner of India, 'with the Arabian Sea to the west and the -Western Ghats to the east, Kerala had developed its OIfn way of life. Not that it remained immune from alien influences but it assimilated them and absorbed them into its own peculiar pattern. The population consisted of Hindus, Christians and Muslims. Sankaracharya, the greatest Indian philosopher since Gautama Buddha, was a native of Kerala. The first Indian converts to Christianitv were made in Kerala by 5t. Thomas, the apostle of Christ, in the first century A.D. and their descendants formed a flourishing Syrian Christian cOIllIIlunity_ Similarly, the first Indian .Muslims 'were the Moplahs of J\falabar, derived from Arab traders who married local women and settled down in the country. Some of the earliest Jews in the ,-\TorId ,vere also in Kerala. Inspite of this religious medley, the people had a homogeneous character. They spoke the same language, ivore the same white dress, gloried in the same traditions and followed the same customs and manners".
125


CHAPTER VII
Scheduled castes Q nd tri bes
'''ie have seen that the Indian culture is characterised by its deeply religious outlook and that all the major religions of the world have followers in this country. Another factor 'which has influenced Indian society is the caste system. Hinduism, the religion of the ~'ast majority of the people. has a tradition of preserving caste system for seyeral centuries. Other religions are also not immune from its impact. Though religions like Islam and Christianity may not officially recognize divisions based on caste, they also could not escape from its influence.
'Ye are familiar with the 'word 'Chaturvarnya' the system of four great castes, consisting of Brahmin; Kshatriya, Vaisya and Sudra. Each caste is supposed to specialise in one occupation or other essential to the society. Priesthood and administration and military duties are reserved for the first tKO castes. The occupations of the other two are agriculture and menial jobs. The essence of the caste system is the orderly arrangements of the various groups in a hierarchy 'with Brahmins at the top and Sudras at the bottom. It gave a place to each man in society. The saddest thing appears to be that no man was allowed to move out of the place arbitrarily fixed for him. Early Brah~in writers used all their wit and learning to discuss and define the rights and duties of
127

c3ch caste. No wonder that something like a divinely ordered system emerged, the violation of which was yisited with punishment. It was even said that the four castes originated from four parts of the body of the creator.
The association of a caste 'with a particular occupation has gi\Oen rise to the conclusion that the origin of caste is merely occupational differentiation. To begin ,\-jth, all castes were said to be equal. It was only later on that certain occupations were looked down as inferior. Some castes have even today a monopoly of certain occupations. Rut every memher of a caste does not practise a single occupation exclusively. To associate a caste im ariably with a single occupation seems to be an over simplification of the origin of the caste system.
'Vhatever be the origin of the caste system, its impact on Indian society ,>vas far-reaching. Caste 'was not a mere label. It was a 'say of life, rigid in the extreme. Every individual lived in a hierarchical ·world. Both high castes and low castes 'were fettered by rules and conventions. Thev had hardly any choice in the type of ornaments and / dress they ~yore: the food they ate, and the rites and ceremonies they practised. The high caste man had to keep his distance from the low caste man. The former could not accept cooked food from the latter. The concept of pollution kept the castes apart from each other. There "'were prescribed distances to be kept by different castes and violations invariably resulted in punishment. In course of time various privileges became the birth right of the higher castes and disabilities piled upon the 100\"er castes.
Not that there was no reaction against the rigidity of the caste system. Buddhism is said to have questioned it. The Bhakthi movement almost ignored its existence.
128

It recognized saints from all castes including the Hari jans. Of course it took years before anything like a mass protest against caste system could be organized.
It is said that Kerala had a casteless society before the Aryan immigration. Caste system was foisted on Kerala society by the immigrants by subtle methods. They assigned to the Dravidian chieftains and merchants comparatively high positions in the hierarchy of 'Chaturvarnya' and encouraged them to follow the way of life of the higher castes. The chieftains and rulers were made to believe that it was their sacred duty to protect the Brahmins. Though borrowed, the system took deep root in Kerala and became a means of oppression of the lower castes. Kerala was not behind North India in rigidly enforcing the laws of pollution and keeping the castes away from each other.
The people of Kerala were not slow to realise the injustices perpetrated in the name of the caste system. All sections of the people protested against its evils. Politicians and poets joined hands in educating the public and bringing pressure on the Government in mitigating the suffering of the depressed classes. Vaikom Satyagraha and Guruvayur Satyagraha were milestones in the struggle for the upliftment of the backward classes. The Temple Entry Proclamation in 1936 issued by the :rvlaharaja of Travancore was a great historical document, the first of its kind in the country. Mahatma Gandhi hailed it 'as a smriti which is the people's charter of spiritual emancipation'. One of the evils of the caste system was the lowering of the literacy rate of the lower castes. Government took special steps in extending free education to them and preferential treatment in recruitment to Government service.
129 9-1 Census/Kerala/73
"VIth the country gall1lDg freedom from foreign rule, steps taken to uplift the lower castes l'liere accelerated and given sanctity under the provisions of the Indian Constitution.
V nder the Directive Principles of State policy in Part 4 of the Constitution under Article 46, it has been laid down that "the State shall pTOmote with' special care the educational and economic interests of the weaker sections of the people, and, in particular, of the Scheduled Castes and the Scheduled Tribes, and shall protect them from social injustice and all forms of exploitation".
The special protection offered by the Constitution, naturally, should go only to the castes and tribes which are genuinely bacb\"ard and deserve special consideration. Articles 341 and 342 of the Constitution provide that the "President of India may by public notification specify such castes and tribes which shall for the purposes of the Conslitution be deemed to be Scheduled Castes and Scheduled Tribes in each state". The lists of Scheduled Castes and Scheduled Tribes are made out for each state and even in respect of a state with reference to each district.
According to the Constitution (Scheduled Castes) Order, 1950, the President, after consultation with the Governors and Raipramukh~ of the States concerned was pleased to list out the castes and tribes considered as Scheduled Castes and Scheduled Tribes. The list 'was further modified as per the "Scheduled Castes and Scheduled Tribes (lvlodification) Order, 1956" issued by the President of the Indian L'nion. No person who proEessed a religion different from the Hindu or the Sikh religion could be deemed to be a member oE the Scheduled Caste.
It is necessary to find the exact number of persons belonging to the Scheduled Castes and Trihes and also
130

to assess their economic and social conditions compared to the Inore advanced communities from time to time. One of the directive principles of the Indian Constitution is to pay special attention to their welfare. In the Presidential Order these communities are listed out with reference to the localities where they live. A community 'which is recognized as Scheduled Caste in one area may not be accepted as such in another area according to the lisL. Hence enquiries about Scheduled Castes and Trines have to be conducted very carefullv. In Kerala some persons belonging originally 'to Sched~lled Castes have embraced Christianity. According to the definition of the Scheduled Castes a convert from Scheduled Caste to Christianity cannot be treated as belonging to Scheduled Caste. Hmvever lhere is no such restriction on Scheduled Tribes. Hence enumerators had to be given instructions to put searching guestions to those who claimed to belong to the Scheduled Castes or Tribes and verify their claim with reference to the list applicable to that area.
Eighty million people in India, according to the 1971 Census, belong to Scheduled Castes_ They make up 14.6 per cent of the population of the country. As many communities in different srates have been declared as Scheduled Castes, their numbers differ from state to state. In KeTala State the persons belonging to the Scheduled Castes number about 1.8 million and account for 8.3 per cent of the population. In the other states in South India, the proportion of Scheduled Casle population' to the total population is slightly higher. In Punjab, it is highest, 24.7 per cent of the population of the State belong to the Scheduled Castes. Of the total Scheduled Caste population in India only 2.22 per cent live in Kerala whereas 23.19 per cent belong to Uttar Pradesh and 11.02 per cel?t to vVest Bengal.
131

The Scheduled Caste population of Kerala as revealed by the 1971 Census is 1,772,168. They are fonnd in all the districts of Kera1a in varying numbers. As much as 15.84 per cent of the total number live in Quilon district. In Cannanore and Kozhikode districts only 3.26 per cent and 4.31 per cent of the total Scheduled Caste population are found. The southern districts of the State have a higher percentage of persons belonging to those communities than the northern districts.
PALLAN
PANAN
VETTUVAN
VELAN
THANDAN
KANAKKAN OR fADANNA
PARAIYAN. PARAYAN (SAM.BAVAR)
KURAVAN, SIDHANAR'
CHERUMAN
PULAYAN OR ~HERAMAR
TEN NUMERICALLY STRONG
SCHEDULED CASTES
1971
a 80 160 240 320 400 480 560 640 POP U L_.All 0 Ii IN f~U S~NE:S
They prefer to live in the rural areas in all the districts. The reason is obvious. lVlost of them are engaged in agTiculture and other occupations which are typically ruraL As much as 90.32 per cent of the total population live in the rural areas of the State. In Malappuram 96.07 per cent and in Quilon 95.13 per
132

cent of the Scheduled Caste population live in the rural areas of the respective districts. In Kozhikode, Trivandrum and Ernakulam districts their distribution between rural and urLan areas is more or less in the pattern of the other communities.
In larger cities, their proportion to the total population is still less. In Cochin. Trivandrum and Calicut Corporations they make up 3~46, 6.62 and 2.56 per cent of the population of the cities respectively, whereas 8.3 per cent of the total population of the State belong to the Scheduled Castes. .
The growth rate of the Scheduled Caste population during the decade 1961-71 shows no appreciable deviation from the general gro'wth rate of the population of the country. The Scheduled Caste population increased by 24. J 2 per cent against a general increase of 24.80 pel' cent. In Kerala State, the Scheduled Caste population registered a growth rate of 23.51 per cent whereas the total population increased by 26.29 per cent during the same period. Their growth rate in the districts showed wide variation ranging from 15.76 per cent in Kottayam to 32.67 per cent in Cannanore. There was also notable increase in Trivandrum and Ernakulam districts 'which recorded a growth rate of 31.95 and 27.67 per cent respectively.
One of the main items in the census enquiry is the literacy of the population. This is more important in the case of Scheduled Castes "which are comparatively backward. The literacy index is undoubtedly a measure of the progress achieved by any community. The literacy rate of the Scheduled Castes in Kerala State according to the latest Census is 40.21 per cent as against the general literacy rate of 60.42 per cent in the State. This is of course not satisfactory. The Scheduled Castes are far bchina the other communities in the rate of
133

literacy. The fact that the literacy rate of the Scheduled Castes' in our state is higher th~n the general literacy rate in manv other states in India is no reason for complacency. there has been substantial progTess in their literacy rate during the last decade. It has increased from 35.94 to 50.72 per cent in the urban areas and from 23.37 to 39.09 per cent in the rural areas. This shows that the various measures taken bv the Government to spread literacy among the backw'~rd communities have begun to bear fruit.
The district-'wise literacy rate of the Scheduled Castes is in the same pattern as the other communities, though they are behind the other communities in literacy. In districts where the general literacy rate is Io-w, the rate of literacy of the Scheduled Castes is also low. In the highly literate districts, the Scheduled Castes are not so backward as in the other districts, though in both regions they have not Teached paTity with the more advanced communities. In Palghat, Cannanore and Malappuram their liteTacy Tate is belmN 26 per cent whereas in all other districts it is above 39 per cent. In Alleppey, where the rate of literacy is highest in the State, the literacy rate of the Scheduled Castes is also comparatively high. It is 54.40 per cent.
Several bacb,'arcl communities are listed as Scheduled Castes. Their literacy rates differ ,videlv. In 1961, there were seven castes among them {"ith a literacy rate of below 1 0 per cent. At the same time there were 4 castes with literacy rates ranging from 50 to 59 per cent. No caste had reached a literacy rate of 60 per cent or more. Tremendous improvement took place during the last decade. Still there are two castes 'Gavara' and 'Maila' with a literacy rate of below 10 per cent. But there are also five castes in the range of 50 to 59 per cent literacy rate and eight castes have moved up to a rate of 60 per cent or more. The
134

Scheduled Castes in the highest range of literacy are Bharatar, Kakkalan, Mannan, Paravan, Pathiyan, Perumannan, Vannan and Velan. This shows that all castes among the Scheduled Castes in the State are going steadily up in the rate of literacy.
Scheduled Tribes in the country have also been singled out for special consideration. Due to long isolation from the other communities, the Scheduled Tribes have been able to preserve in tact their own way of life. They still observe taboos and conventions unknown to modern society. Their settlements are mostly in hilly areas and they have little contact with the outside world. In Kerala their settlements are in the 'Vestern Ghats and the low lying hills near the boundary of the State with Tamil .:\' adu and M ysore State. They were once known as 'Kattujathi' in Travancore and Cochin areas and 'Kattn Kuruman' in the .Malabar area. These names indicate that they are people of the forest.
In the Scheduled Castes and Scheduled Tribes Lists (l\Iodification) Order, 1956 mention was made of 38 tribes in Kerala State. But in 1961 Census only 34 tribes were actually enumerated. In the 1971 Census two tribes out of them 'Kota' and 'Palliyan' did not find a place but two other tribes 'Konda Kapus' and 'Maha IV1 allesar' were newly located. As a result the number of tribes remains at 34.'
The tribal population of India according to the 197 I Census was 38 million accounting for 6.94 per cent of the total population. It is a little less than half the Scheduled Caste population of the country. The pro-. portion of the tribal population to the total population varies from' state to state. Only 0.2 per cent. of the population of Uttar Pradesh is tribal whereas they make up 88.6 per cent and 80.5 per cent of the poplllation
135
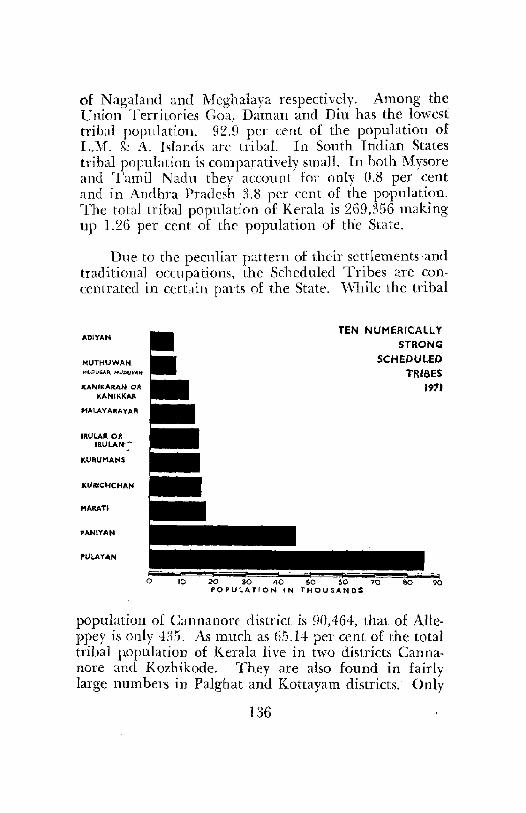
of Nagaland and 1feghalaya respectively. Among the Union Territories Goa, Daman and Diu has the lowest triLal population. 92.9 per cent of the population of L:Vr. &:: A. Islands are tribal. In South Indian States tribal population is comparatively small. In both l\fysore and Tamil Nadu they account for only 0.8 per cent and in Andhra Pradesh .'1.8 per cent of the population. The total tribal population of Kerala is 269,356 making up 1.26 per cent of the population of the State.
Due to the peculiar pattern of their settlements ·and traditional occupations, the Scheduled Tribes are concentrated in certain parts of the State. 'While the tribal
ADIYAN
MUTHUWAN, MI,!-DVGAR, ,.,.l)l:IUVAN'
KANIKARAN OR KANIKKAR
M,AUYARAYAR
IRULAJI. OR IIlULAN--
KURUMANS
lClIRlCIiCHAf'I
MARATI
PANIYAN
PULA., .. N
TEN NUMERICALLY STRONG
SCHEDULED TRIBES
1911
population of Cannanore district is 90,464, that of Alleppey is only 435. As much as 65.14 per cent of the total tribal p.opulation of Kerala live in two districts Cannanore and Kozhikode. They are also found in fairly large numbers in Palghat and Kottayam districts. Only
136

a few of them live in the other districts. In Alleppey district which has no hilly regions, the tribal population makes up only 0.16 per cent of the tribal population of the State.
They prefer to live in the rural areas. Only 4.04 per cent of the tribal population live in urban areas. In Kottayam and Quilon districts not even one per cent of the tribal population of the districts are found in the urban areas. In the major towns they are just a handful and go unnoticed. In a population of over 4 lakhs in Cochin and Trivandrum Corporations, the tribal population is only] 96 and 122 respectively. The position is not very diiferent in Calicut Corporation .\There they number 395.
While the population of Kerala increased by 26.29 per cent, during the decade 1961-71 the tribal population registered a growth rate of 26.60 per cent. Their rate of increase was higher than that of the Scheduled Castes during the same period. They make up only 0.71 per cent of the total tribal population of the country and 1.26 per cent of the total population of Kerala.
The literacy rate of Scheduled Tribes is only 25.72 per cent as against 40.21 per cent in the case of Scheduled Castes. It so happens that a larger section of Scheduled Tribe population is found in districts which are generally backward in the rate of literacy. In Palghat district their rate of literacy is only 7.13 per cent. In Ernakulam, Kottayam, Alleppey and Trivandrum districts their literacy rates are much higher. The highest rate is of course in Alleppey district with 60 per cent. But the Scheduled Tribe population in Alleppey district is so small that it does not improve much the position of the community in general.
137

In 1961 there ·were 10 tribes 'ivith a literacy rate of below 10 per cent and there was only one tribal community having a literacy rate between 50 to 59 per cent. There was none in the higher ranges of literacy rate. Now also there are 9 tribes with a literacy rate of below 10 per cent. But there are also two tribes· with a literacy rate of 60 per cent or above. They are Malai Arayan and Malayarayar. Malai Arayan moved up from 40 to 49 per cent literacy Tange and Ma1ayarayar from 50 to 59 per cent range to the highest range of 60 per cent or above during the last decade.
Small tribes and castes .vith a population of less than 100 each have not been taken into account in assessing the progress in literacy.
138

CHAPTER VIII
Our main activities
The economic' activity of the people of a country depends on many factors. One among them is the demographic situation in the country. Very young children and old persons are unable to take part actively in work. In India 4~.02 per cent of the population are children below 15 years of age.
Mall''' children continue their studies beyond the age of 15' years and many more leave school b~fore that age in order to earn a living. People normally retire from active 'work by the age of sixty but some continue to work beyond that age. The working force of a country is understood to be made up of people between 15 and 60 years of age. But many people in the working age group are not actually workers due to various reasons. In our country the problem of unemployment and under-employment is very acute. Many are willing to work but only a few get the opportunity to '\\·ork.
One of the purposes of a population census is to collect data on the economic activity of the people. l\hny countries use the statistics collected through the census for social and economic planning. The classification of the population into economically active and inactive can be done based either on 'the production of goods
139

and services approach' or 'the dependency approach'. In the former case it is ascertained whether the person enumerated is engaged in any economically productive activity or not. In the latter case it is assessed whether or not'the cost of maintenance of the individual is wholly or partly met by the person's own income as distinct from any economic activity in which he is engaged. According to the 'dependency approach' the population can be classified into groups such as (1) self-supporting persons (2) earning dependents and (3) non-earning dependents. The main difference bet\veen these two approaches is seen in the classification of persons who support themselves wholly or partly through the receipt of pensions, dividends, rents etc. According to one concept they are not economically active but according to the other they are classified as self-supporting or earning dependents. 'The production of goods and services approach' seems to be a better basis to describe the economic activity of the individual.
A worker, in the 1971 Census, 'was defined as a person whose main activity ,vas participation in any economically productive v.ork by his physical or mental activity. The classification of the population into workers and non-workers was based on the 'main activity' of the individuals, as recorded in their Individual Slips. Persons who returned themselves as housewives, students, or retired persons for their main activity ivere classified as non-workers. Any marginal contributionmade by them in the field of economic activity was considered as their secondary activity. It seems that the basis of classifications was not so rigid in 1961 and that even students who participated in some 1Nork during their spare time were treated as economically active. Due to the emphasis placed on main activity, a house,Ilife 'who engaged herself in some household industry during her spare time to augment her family income \vas treated as a non-worker in the 1971 Census. Hence
140

the classification of the population into workers and non-workers in 1961 and 1971 is not strictly comparable.
In the nlOre developed countries of the "world the proportion of economically active population is comparatively high. It means that large sections of the population contribute actively to the prosperity of those coqntries. According to censuses conducted after 1960, the economically active population of U.K., U.S.A., U.S.S.R., Australi~, France, and Japan were 46.7, 40.9, 47.8, 42.0, 41.1 and 49.8 per cent of the population of the respective countries. But in India, the percentage of workers to total population "was only 32.92 according to the 1971 Census.
In the various states in India, the rate of participation in work differs widely. It depends on many factors like the natural resources of the State, kinds of occupations available, whether labour-intensive or not, and the degree of unemployment and under-employment prevailing in the State. 'Vhere occupations are such that men and women take part, the degree of participation is naturally high. In Kagaland 50.75 per cent of the population are economically active 'whereas in Haryana only 26.44 per cent of the population are returned as workers. In Maharashtra and Tamil N adu, 36.48 and 35.78 per cent of the population of the respective states are "workers. In Kerala, the participation in work is comparatively 101v at 29.12 per cent. Among the Union Territories, 57.65 per cent of the population of Arunachal Pradesh are "workers "whereas only 26.15 per cent of the population of L.:\1. and A. Islands are economically active.
According to the'1971 Census, out of a population of 213 lakhs only 62 lakhs are workers in Kerala. Not even one-third of the population is economically active. This low rate of participation in work is due to various reasons. There is a natural limitation to the rate of participation in 1vork due to the presence of a comparatively -large percentage of children of school-going age
141

in the population. The large scale unemployment among persons in the Ivorking age group is a serious problem facing the State. During the last seven decades for which figures are available the employment position in the State has been steadily deteriorating. In 1901, the rate of participation in work was 44.50 per cent. By 1951, it came down to 32.27. It slightly improved to 33.31 in ]961. It has gone down to 29.12 per cent in 1971, the lowest since 1901. Of course the change of
50
40
... 30 <:l <{ ... :z ... o 20 Q: ... a.
'0
o
WORKING FORCE PARTtCIPATION IN KERALA~ 1901-1971
~ ._ ./ ~ ..... ............ /' .......
NA .. ..... ........ -......
~ ~
1901 I~" 1921 1~31 1941 1951 1961 1971
definition of the term 'worker' from cenSllS to censlls, has affected the rates to some extent. In 1971, the classification was based strictly on 'main activity' and so many persons who made marginal contribution to i",ork 'were classified as non-workers. But this explains only in part the steep fall in the rate of economically active population. The fact seems to be that opportunities
142

for work have not increased at the same rate as the increase of population during the past several decades.
According to the definition of "worker adopted in the Census, men are economicallv more active than women in all the countries of the wo{ld. A housewife doing her O'wn household duties is considered a non-"worker whereas her maid servant who may actually do much less work is considered as a worker. There a~e also certain types of occupations in which the rate of participation by women is comparatively lo\v. A lower rate of literacy, a much lower proportion of technically qualified hands and social conventions preventing women from taking up certain types of occupations are some of the other reasons for the poor rate of participation of women in economically productive activities. However there is no reason to think that "women are comparatively lazy because manv of them who are considered as non-"\vorkers are actually busy with their own household duties. According to the latest figures available, in IJ.K., U.S.A., U.S.S_R. and Japan, 29.3,28.6,41.5 and 38.6 per cent of the female population in the respective countries are economically active whereas in India only 11.85 per cent of the female population are workers.
In our country atleast, it is wrong to presume that the rate of participation in work by women depends on their rate of literacy. In some of the states in India 1Nhere the rate of literacy among females is very low, their rate of participation in work is comparatively very high. In K agaland, Meghalaya and Andhra Pradesh, 45.24, 34.57 and 24.16 per cent respectively of the females are workers "\'lhereas in Kerala, where the rate of literacy is highest, only 13.49 per cent of the females are workers. It is trlle that in Kerala women are fairlv vrell represented in white collar jobs whereas in othe~ states they are almost shut out of such jobs due to lack of education. 'Vomen's participation in work is governed more by the types of occupations available and
143

social conventions than by their rate of literacy. There are certain occupations like agTiculture and household industry which employ a large proportion of "\,"omen. In Kerala agriculture and cashew and coir industries absorb a large number of uneducated women workers.
In the more developed countries of the world, the number of male workers is about double that of the female workers. In India, it is about five times. But [he conditions in the various states in India do not stand comparison. In Nagaland and Meghalaya, the number of male workers is less than double that of female workers whereas in Punjab it is nearly fifty times. In Kerala, it is more than three times.
In our country, between 1961 and 1971, there has been a sharp fall in the percentage of workers to total population in spite of the efforts made to tackle the unemployment problem. The percentage of workers came down from 42.96 to 32.92 at the all-India level and from 33.:)1 to 29.12 in Kerala during the decade. It appears that women suffered more than men from lack of employment opportunities during this period. In the country, 'while the percentage of male workers came (lawn from 57.08 to 52.50 that of the female workers came down from 27.94 to 11.85. In other words, the percentage of female workers to female population was reduced to half during the last decade. In Kerala, while the percentage of male workers came down from 47.20 to 45, that of the female ,vorkers came down from 19.71 to 13.49. Perhaps, quite a large number of women, making a marginal contribution to work during their spare time but mainly engaged in their own household duties would have lost their status as 'workers due to the strict classification of workers and non-workers based on main activity adopted in 1971.
Let us find out the types of economic activities in which our workers are engaged. There is no doubt
144

that agriculture and allied occupations absorb a large percentage of "workers. 'Ve are familiar \vith the slogan 'industrialize or perish'. There is a limit to the number of ,\'orkcrs who can be employed in the agricultural sector and the future depends on the di"versification of employment opportunities especially in fields like industry and commerce in "which there is greater scope for dnelopment. I n the census of 1971 the workers "were grouped into 9 industrial categories. They were:-
I Cultivators II Agricultural labourers
II I Live-stock, forestry, fi,hing, hunting and plantations, orchards and allied activities
IV Mining and quarrying
V :Manufacturing, processing, servicing and repa.irs,
(a) Household industry (b 1 Other than household industry , , .
VI Construction
VII Trade and commerce
VIII Transport, storage and communications
IX Other services
A classification of non-\\'orkers also into yarious groups is useful. Some are not working because they are full-time students or doing their own household duties. Howeyer there are persons among the non-workers \vho are looking for job~ and are prepared to 'fork if they are gi\"en the opportunity. They ha,~e to be provided "'ith jobs. The non-workers are classified as (1) those attending to household duties (2) students, (3) retired persons, rentiers and persons of independent means, (4) infants and dependents, (5) beggars and vagrants, (6) inmates of institutions like jails, mental hospitals etc. and (7) others. The actual number of non,workers in each group is not known at present. Hence the extent of unemployment in the State cannot be assessed now.
145 10-1 Census/Kcralai73
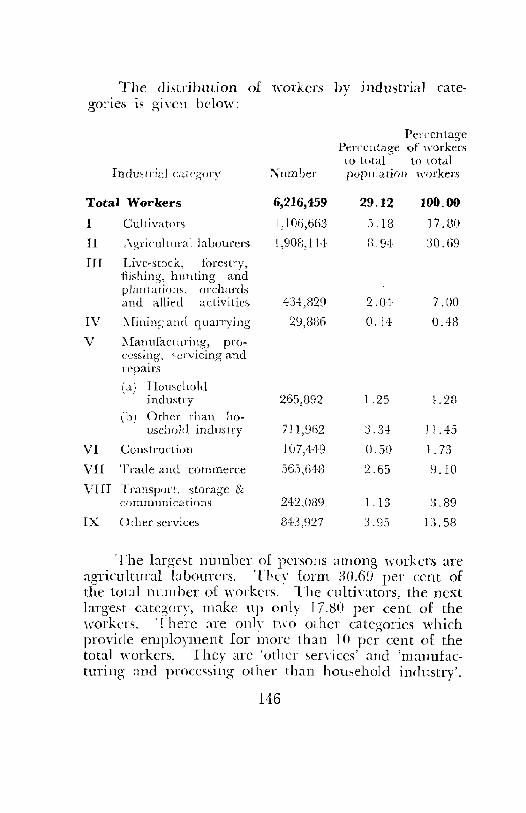
The distribution of workers by industrial ('ate-
Percentacre to
PercclLlage of workers to tOlal to total
Industrial ca[{'gory ~l!mber pOPlllation workers
Total Workers 6,216,459 29.12 100.00
I Cultivators 1,106,663 :'i. 18 17.80
II ,\gricultural labourers 1,908,114 B.9'} 30.69
III Live-stock, forestry, fiishing, hunting and plantations. orchards and allied activities 434,829 2.04 7.00
IV .\lining and quarrvincr . '" 29,886 a.H 0.48
V i-.lan Ilfacllll'ing, pro-CeSs.n_l,g, 'el'vicing and repairs
(a) Household industry 265,892 1.25 4.28
(b) Other than 110-uscllflld indus1 ry 711,962 3.34 J 1.45
VI COllstrun ion 107.449 0.50 1. 73
VII Trade and comlnerce ,)65,643 2.65 9.10
VIII Transpon. storage & communications 242,089 1.13 3.89
IX Other scrviccs 1343,927 3.95 13.58
The largest number of persons among workers are agTicultural labourers. The\' form .10.69 per cent of the total nnmber of workers. The c:ultiYators, the next largest categ'ory, make up only 17.1'\0 per cent of the workers. There are onl y t~\ a other categories w'hich provide employment for morc than 10 per cent of the total workers. 'They are 'other sen'ices' and 'manufacturing and processing 01 her than household industry'.
146

DISTRIBUTION OF
WORKERS, 1971 . PERCENTAGE
CULTIVATORS
AGRICULTURAL LABOURERS
LIVESTOCK, FORESTRY, fiSHING. HUNTING etc.
MINING AND QUARRYING
HOUSEHOLD INDUSTRY
INDEX
147
OTHER THAN HOUSE. HOLD INDUSTRY
CONSTRUCTION
TRADE AND COMMERCE
TRANSPORT, STORACE AND COMMUNICATIONS
OTHER SERVICES

Though the broad pattern in employment is the same: ail over the country, there are significant diH'erenccs ,dlich highlight, the special conditions prevailing in Kerala. In India, the cultivators and agricultural labourerb are the predominant categories of 'workers but the order of strength is ju~t the reverse of that in Kerala. \Vhile in India, the largest category, is culti,ators, in Kerala, the largest category, is agricultural labourers and cultivators come only second. These two categories put together absorb 69.67 per cent of the total ,vorkers in India 'while in Kerala. the\' account for only 48.50 per cent of the 'workers. No other industrial category accounts for even 10 per cent of the workers in T nelia. But in Kerala, other services and industries, other than household industries, both employ more than 10 per cent each of the total workers in the, State. The very high man-land ratio in Kerala necessarily limits the scope for expansion of the employment potential in the agricultural sector. The shortfall in this sector has not been effectively made up by tbe expanslOn 111 other fields of employment, particularly in industries.
In 1961 also 'workers were grouped into 9 industrial categories and only minor modifications were made in 197 I. The last decade has not brought about any revolutionary changes in the employment pattern. There was no notable expansion of the employment opportunities and but for certain regroupings due to changes in the concept of worken, the economy presents a picture of stagnation. The total number of ·workers lncreased from 5G.3 lakhs to 62.2 lakhs, a mere 10.4] per cent whereas the population increased by 26.29 per cent eluring the same period. In certain individual categories like 'manufacturing other than household industries', 'trade and commerce' and 'transport, storage and communications', there was a steady increase of ·workers.
148

The numbET of cultiyators decreasccl from 11.8 lakllS to 11 lakhs, and agricultural labourers registered an abnormal increase from 9.8 lakhs to 19.0 lakhs. The changes can be explained by reproducillg the definitions of cultivators and agricultural labourers and the possibility of one category gaining strength at the expense of other either due to mistake in classification or due to actual changes brought about by economic forces. A cultiyator is one who is ellgaged in the cultivation of land in his capacity· as tbe nwner or lessee of land held from Government or as tenant of the land held from private persons or institutions for payment of money, kind or share. An agricultural labourer is a person who works in another person's land for \\-ages in cash or in kind. He could have no right of lease or contract on land on which he works. The decrease in the number of cllltivalor.~ can be due 1.0 I,H} reasons, one, an actual change of status from cultivator to agricultural labourer and the other a stricter classification based on main activity by which a person who cultivates his own small holding but works most of the time as an agricultural labourer is included in the industrial category of agricultural labourers and not c'l1ltivators. As a matter of fact the fragmentation of agricultural land into uneconomic holdings has force<llllany cultivators to become labourers in the agTicultural sector. Though there has been a drastic reduction in the number of cultivators and an abnormal increase in the nUlnber of agricultural labourers, when these tw'o allied categories are clubbed together, there is only an increase from 21.6 lakhs to BO.llakhs.
There was a large scale reduction in the number of persons engaged in household industries during the decade 1961-71. Their nmnber came dmvn from 4.9 lakbs to 2.7 lakhs. Although household industries have not been doing very well during this period, it is not correct to presume that so many ,\'ere thrown out of
149

employment from bOllsehold industrr during the past decade. A honse,,·ife "who does her own household uuties and engages herself in some household industry eluring her spare time is classifiecl as a non-worker according to the 1971 Censm. It is possible that she was considered as a "'orker i 11 the illd llStrial category of household industry ill the earlier census due to her marginal contribution to "work. Hence the reduction of ,\"orkers in this category does not seem to speak of any disaster that has befallen to th is branch of economic activity in the State though it indicates a state of ~tagnation.
In the category of 'other services' also there was an abnormal reduction in the number of ,,-orkers from 14.2 lakhs to 8.4 lakhs during 19G1-71. This is merely due to the inclusion of all workers ,\']1ose actiyities were unspecified or inadequately described, in this category cl uring 1961. By and large, the pattern of employment remaills the same. The expected increase in opportunities for employment did not materialisc.
Though the rate of participation in work is comparatively less among females, thcre is hardly any industrial category in "'hich they are not represented. In Kerala H.4S per cent of those employed in household industry are women. This is the highest rate of participation in any catcg'ory of work by ,yarnell. It may also be mentioned that :37.;1:1 per cent of agricultural labourers, 29.27 per celll of those engaged in other services and 25.09 per cent of those employed in industries excluding household industries are ·women. In other categories of work their representation is often nominal. In absolute numbers agricultural labourers numbering abollt 7.1 lakhs is the strongest ,,'orking force among ,mmen. Household industries absorb 1.2 lakhs, other industries 1.8 lakhs and other services 2.:) lakhs of female workers. The high rate of literacy among women
150
has earned for them better representation in clerical and administrative services than in the other states in India. In industries, ,vomen, mostly uneducated, are employed in large numbers because tIle coir and cashe,,industries in Kerab are labour-intensive and women are particularly adept ill them. Categories like CUllS
truction, trade and commerce, transport and communications, mining and quarrying are still the strongholds of male workers who account for more than !)() per cent of the employment in each of them. vVomen cultivators make up only (i.08 per cent of the total number of cultivators ,d1ereas "romen agricultural labourers account for g7.3)) per cent of the total number of agricultllrallabourcrs.
Among the workers H4.9.:J per cent 1i\'c in rural areas and 1 f).05 per cent in the urban are3S of the State. Apparently there is a slightly higher rate of workers in rural areas as only 8:).76 per cent of the tOlal population is rural. But there i~ marc undcr employm.ent in rural areas as rural occupations like agricultural operations are mostly seasonal. Rural occupations absorb a comparatively higher proportion 01' female ,,'orkers than urban occupations. In thc rural areas the rate of participation in "'ork by males is a little more than three timcs that of females whel'eas in urban areas it is more dun four times.
\"orken in the primary sector, composed of 3griculture and allicd occupations, 3re concentrated in the rural arC3S of tile Statc. ,rhile houschold industry is typically rural, manufacturing other than household industry is a predominantly urban occupation. Construction, trade and comm.erce, transport, storage and com· munications and other sen'ices ha\"e larger number of workei·s in the urban arC3S.
151
The percentage of workers to total population of the State is ~9.1~. In the di~tricts also, the rate of participation in 'mrk is egually poor. In Palghat and Cann:m01'e districts .'l:').WJ Zlnd 30.2 I per cent respectively of the popubtioll are ~\·orkcrs. But in Kozhikode district, Lhe \\orkcn make up (lnh ~().D2 per cent of the popubtiOll. \ fhet! male \\'orkers alone are taken i nto con~ideration the yariation ill percelltage of workers is negligible. \Vhat really colltributes to the higher rate of participation in 'mrk in a district is the Luger percentage oE 'women "'orkers in lhe district. In Palghat di,~Lrict :H.:12 per cent of the total workers are women '\'herca~ in Kozhikode only l7 .. "j-J. per cent are 'women.
The special resonrces of a district are reflected more In the prcdomin:ll1cc of certain indl!~trial categories of 'workers (han in the rare of panicipation in ,,·ork. For example the largest number of cultiyators are founel in QlliIon district ..,xherea,~ the largest number of agri· cultural labourers arc found in Palghat district. There is a collcultration of 'I'Orkers belonging to the third category ill KottaY:llll di~trict because of the large number of tea. rubber, :m(i cardamom plantations in the hig'h rallges of that district. {n household industry Allcppey takes the lead in the strength of \\'orkers became it is the home of lhe coil' industry in the State. Though Ernakulam is the most industri'alized district in the Slate. it comes only seco11(1 to Ouilon in the number of industrial worker~ because the- cashew industries in Ouilon district arc more labour-intensive. Ernaku· -_ lam district, with the facililie~ of Cochin harbour, is hI' ahead of the other districts in the employment of workers in LLl(le and commerce, and transport, storage zmd COllll1l11l1ications. Triyanclnllh district, with the capital of the State located ill it, has the highest number of workers in other services consisting of clerical, :ldministrative and other white collar jobs.
152

~-\ll the districts of the Slate are not equ:tllv urL:milcd. The urban workers ,d1O make up only 15.05 PCl' cent of the ,v'orkers of the State are distributed unequally in the dist ricb. In "\1alappnram, Palghat. Kott;n am, Quiloll, Call1lanore and Trichur districts, the percenLage 01 urban workers is Ie~." than Lj per cent of the (oell workers in the respecti\ e districts. In 1\1 alappuram (li"trict onh' 6.:;4 per (ellt of the workers lin~ in the urban area;. J 11 Ernaklliam. Kozhikode, /\11eppey. ;Illd
Trivandrum districts, more than 15 per cent of the total workers ill each di"lricl live in the urban areas or the district. In Ernakulam, the urban workers account for ~G,')4 per cent o[ the total number of w()rkcr~ ill t bed iSlricl.
It is strange but true that the backward communi I ies arc economically more act ive, though their stanoard of liying is poor. Out of 1.77~, 1 G8 persons belongin~ to Scheduled Castes in the State 7;)~).5:)8 are found to be workers. r n other ,,'ords, ·J~.86 per cent of them are "'orken, though in the State as a whole only ~9.1~ per cent of the population are \wrkcrs. But the type of work they do makes a large differClicc in their k\ cl of income and stamlanl of li\in~. The rei urn they .C!,et
for their work is too small and TlLll1\ of them are only poorly paid seasonal ·workers. The di~trilmtiol1 of Scheduled Caste workers among- the industrial categories throw more light on their economic conditions. The\' Zlre traditionally agricultural labourers. ~?I.2G per cent of the Scheduled Caste population are a.gricultu1"al labourers whereas only 8.94 per cent of the g'encral population belong to this category. . n1ere are only a few culti"ators among them which mcans that most of them ,York for wages. In forestry, fislling. plantation ;111<1
allied activities they are ·well represemed. They ale
inZldequately represcnted in trade anel commerce, transport and communications and manufacturing other th:111
153

household industry. :Mining and quarrying and household industries come well within their sphere of activity.
Thf: number of ,Yorkers among the tribal population of 269,3% in the State is 111,598. Their rate of participation in ,york is slightly less than that of Scheduled Castes bm higher than that of the general population. Their distribution among the industrial categories follO\\'S more or less the same pattern as the Scheduled Clstes z1l1d maintains the deviations from the general pattern. Ho\\'cver, there is an important difference, in that among the Scheduled Tribes the proportion of cultivalars is al111o:-,t on a par 'with the general population. The proportion of agricultural labourers is high compared to the general pattern but does not reach the level of that of the Scheduled Castes. The only other categories in which they are well represented are forestry, plantation and the allied activities. In all the other alenues of work, their representation is far below the State average and does not even reach the level of the Scheduled Castes who are themselves poorly represented in those categori~s.
154

CHAPTER IX
-Summing up Said to be reclaimed from the sea by a legendary
waIT~or by a mighty heave of his battle-axe and ruled hy kll1gs who traced their ancestry to the sun and the moon, the Malabar coast has never ccased to attract the attention of the vrorlel. It was the lucrative trade in spices and ivory that brought foreigners to its shores in the ancient past. Later westel'n nations fought against one another to gain a foot-hold on the :Malabar coa~t and to monopolise the trade. Ach·enturers and traders lI'ere follmred bv missionaries, scholars and travellers. AJI the great reli'gions of the world got warm reception in MJ.labar. Keraia, the State formed by the integration of the j\1 alayalam speaking areas on tlle Malabar coast in 195G, has also been in the lime light clue to various reasons. Its scenic beaut\' continues to attract tourists from far ;lJ1d near. The ~:hlOnic political instability in the State has often been commented upon. It has been described sometirnes as a 'prohlem ~tate·. There are of course problems but they arc prirnarily economic and not particular1y political in nature.
'Yhat are the special feature~ of Kerab? The land and the population have been de~dt 'rith in the preceding chapters. \Ye hayc too little land and too many people and in the present stage of de\elopment it is our most serious problem. The economic consequences of the situation and geographic features of the State need special mention. The high mOllntain wall on the east and the. Arabian Sea on the '",est ensure a heavy and regular rainfall. There are many rivers but the)'
155
are short as the distance between tbe sea and the mountain is small. There are steep blls with vast potential for the generation of hydro-electric pmver and irrigation facilities. The fairly long coastal line, and the large number of backwaters and lagoom add not only to the characteri,~lic scenic beaut\ of Kerala but also prm'ide natural facilities for fishi~lg and coir industry. Due to he;1\ \ rain and sloping terrain soil erosion takes place, the land gradnally becomes less fertile and the soil deficient ill llIineral contents.
The Srate l.s not kn()"wn to have anv resource of oil Dr co;:l. Tlte ;,bscnce of basic minerals like coal, iron and copper i~ ;1 serious impediment to industrial development. The beach sands ho,,-ever are a good source of titanium !)faring ilmenite, Fortunatelv the State has immense potel~tialjty for the generati~n of hydroelectric pO\\-er and if properly deycloped this can compensate for the dbsence of fmsil fuels.
The leading role of agTiculture in the deveJopment of the country and the n.st employment potential in this sector ha\c already been discussed. The distinctive characteristics of . this sector in Kerala desen-e special emphasis. Fibt and Ememost the high pressure of population on la1ld has rendered a large part of the rural population traditionally dependent on agriculture either unemployed 01" under-employed. Secondly the cultivation of cash crops is better organized in Kerala than {"l5ewhere in the country.
In Ret'ala, only about ;')(1 per cent of the total area .of the State is availab1e for cultiyation, the rest being forests and uncultivable lands. In the country as a whole about 70 per cent of the cropped area is' under food grains but in Kcrala onh- about 30 per cent is under food grains. On the otherhand more than 50 per cent of the cultivable area is under commercial
156

crops like tea, rubber, coconut, cardamom etc. This cropping pattern has its own advantages and disadvantages. It earns valuable foreign exchange for the country by the export of commercial crops. It also creates a huge deficit in food grains which sustain the population. Only about :)5 per cent of our requirements in rice is produced in the State. For the balance we have to depend on the supply from outside the State. Self sufficiency in food. graim at the national level is mOTe easily reached than at the regional leyel but shortages even at the national leyel and difficulties in import and distribution ha\'e been causing terrible anxiety in the State.
Increase in the production of rice, the staple diet of the people is given priority in the development of agriculture. It can be clone by an expansion of the grms area under the crop and improved agricultural practices 'which involve the use of high yielding strains, judiciom application of fertilizers, timely use of pesticides and prmision of adequate irrigation facilities. As for the expansion of the area under the crop, there is hardly any lanel in the State which can be newly brought into cultivation.
However by various schemes like reclamation of problem areas, changing cropping pattern, Kuttanad development, Kole land development and deyelopment of rice lands in the high ranges, it is emisJ.ged in the Draft Outline of the Fifth Five Year Plan (1074-79) brought out by the State Planning Boarel thJ.t the gross area under rice 'would increase from H7:! thousand hectares in 1971-72 to l.l50 thousand hect<1j-es 111
1978-79.
Already, the intensity of cropping, defined as the ratio between the gross cropped areJ. and the net cropped area is high in Kerala. But it is stated that there is scope for experimentation in this field by eyolving a desirable crop-mix pattern. In some areas it may be
157
possible to convert single crop paddy lands into double crop ones. The yield is not poor in Kerala but there again more scientific methods of cultivation can bring about an increase in production.
Kerala is in a happy position in the cultivation of plantation crops both on a large scale and in small holdings. The climate and terrain are suitable for further development of the plantation industry 'which em CZlrD valuable foreign exchange for the country. But scarcity of land even for cultivation of the much needed food crops and otber factors have slackened sustained progress even in certain plantation crops in \\'hich Kerala has a monopoly.
The basic problem of Kerala IS Its high density of population. Today it is more than three times the allIneLia average. The growth rale of pouIation has always been higher in this State than the average for the country. During the decade 1961-71 while the population of the country increased by 2c1.8 per cent the population of Kerala registered a net increase of 26.29 per cent. During the previous decade the population of Kerala increased only by 24.76 per ctnt. In absolute numbers, while the net addition to the population was 33.55 lakhs during 19;) 1-61, in the next decade the increase was 44.43 lakhs.
This .is inspite of the family planning programme which had been gaining momentum in the State during the la~t decade. The reason for the accelerated growth rate of popubtion in Kerala is not an unusually high birth rate. In S.R.S. Analytical Series-No.2, 1972 brOl.wh t out b)' the Vital Statistical Division of the Office
" of the Registrar General, India, it is stated that Kerala recorded the 10'west death rate of 10.0 in 1968 and 9.0 in 19G9. Taking the average of both years 1968 and 1969 the death rate ,,,as 1mvest in Kerala with 9.5 and highest in Uttar Pradesh with 24.6. It was further observed that Kerala had the lowest age-specific death rates, the lowest
158

death rate in the youngest age group 0-4 and the lcnrest infant mortality rate. In the older age groups also, the age-specific mortality is low compared with the other states in India. In 1969 the crude birth rate per 1,000 population was 31.1 in Kerala, the IO'west rate recorded among the States. At the same time the death rate Kas 9.0, which was by far the lowest among the states, resulting in an accelerated net increase of population. The same trend is noticed on an analysis of the latest data available. According to the Sample Regi~trati()ll figures for 1971, the birth rates for the rural and mba n areas of Kerala are 29.8 and 28.9 respectively. The death rates for the corresponding areas are 8.8 and 8.2 respectively. ''\That is the possible consequence of this trend ill the gro,,,,th of population? Even if the birth rate is reduced to 25 by 1979, the end of the Fifth FiYe Year Plan, the net addition to the population during the decade 1971-81 is not likely to be less than 44 lakhs.
'What are the economic consequences of the steeply rising trend in population? Other things remaining the same, the larger the ~pnlation, the smaller ,vill be the income per capita. The smaller also will be the ability of the community to s;_n c anc! invest. i 11 developmental activities. A further dampening etfect 011 the tempo of development is the increase in expenditure on education, health, and housing demanded by a steadily grOlYlng population. The greater the proportion of the people in the younger age groups in the population, the larger will be the expenditure on such items as education and health.
Education 'was once a passport for securing a decent means of livelihood. It is no longer so especially in Kerala where there is large scale unemployment among the educated. However this has not cooled down the enthusiasm for education among the population of Kerala. Traditionally, Malayalees attach a high premium
159

on education from the cultural point of vie,\' also. Hence expenditure on edncation will continue to soar up in Kcrala. "\Vhile discussing the rate of literacy in Kerala. the highest in India, it was also pointed out that the expenditun' on education is a heay)' burden all the State. The Goyernment expenditure on education has increased nearly three and a half times (luring the decade 1961-71. Among the states in India, Kerala spends the highest ~hare of total expenditure on education. \Vhat part of it is spellt for the improYemenl of the quality of education? Very little, as ;1 large share of total increase in expendilll1e is absorbed by the SLeep rise in enrolment in -"chools. CoyerJlment'~ expenditure on education, large as it i~. represents only a part of the amount spent for the purpose. E\'ery parent also spends a substantial ~1l1l0unt for the education of his child. The cost of education has gone up hy leap~ and bounds during the last decade, ,rithout making any imprm'ement in the quality of education. largely because of the steady increase in population.
Similarly, the medical aud health sen ices ayailable in Kerala. a~>e said to be second to nOlle in Inelia in quality and cm'crag-c, This is maintained at a tremendous CO~l to the Stale alfe! at the expense of developmental projects. It is inevitable that expenditure on medical sen'ices \\'ill go up as the pop1l1at iOll increases even if only the S;lll1e le\el of sen'ices is maintained. Alobg \\-jth modern medicille, therc i.~ a ,\'ell developed s~-stem of indigenous l1led ieal system in Kerala. The poorer sections of the commlmity arc given free medical treatment in the Gm ernment hospitals. To extend the medical facilities to the remote areas and to make a\ailable the benefits of the latest acl\-ances in the field of health to the people, Gm erl1menr \\-ill have to go on diverting large amounts to the health services.
A.110lher consequence of the accelerated gTO\\,th rate of population is the lllcrease in the public and
160

pri\"ate expenditure on housing. An increase of population means higher expenditure on housing, ,,,'ater supply, transport and allied amenities, e\ en to maintain the same standard of living. More often than not, large sections of the Por~.plation find it difficult to meet the expenditure for tl1t'!' construction and maintenaIlce of their own houses. '''hen normal aid is found inadeq1late Government may undertake massive housing programmes such as the scheme for putting up one lakh houses sponsored recently by the Government of Kerala.
Uaemployment especially among the educated has brought about an explosive situation in Kerala. As on 31st December 1971, out of 3.67 lakh of registered joh seekers as many as ?)5 per cent ,,'ere with qualifications of SSLC and above. The situation is getting worse. The number of work seekers in the live registers of Employment Exchanges rose to 4.54 lakhs by 81st December 1972 and of them 2.59 lakhs or 57 per cent ,\'ere educated. Disquieting as it is, it does not fully reveal the magnitude of the unemployment problem in the State. Many of the unemployed, especially the uneducated, do not bother to register their names in the Employment Exchange. Unemployment even among the professionally and technically qualified has reached ahrming proportions. As on 31st December 1972 there were 654 medical graduates and 2,014 engineering graduates seeking employment through the Employment Exchanges. In addition there were 4,163 diploma holders in Engineering and 11,540 I.T.T. Certificate holders among the job seekers. The Committee on Unemployment in Kerala (1971) estimated the total unemployment in 1970 at 9 1akhs and under-employment at 17.78 lakhs. The more desperate position now, is revealed by the sensational news that, when applications were called for 14,000 jobs under the Special Employment Programme in June 1973, the Office of the Kerala Public Service
161 11-1 C(;nsus/Keraia/73

Commission ,vas flooded with nearly 6 lakhs applications in a matter of days. In spite of massive efforts to solve the problem, full employment is a dream that will not be realised in the near future.
In the context of the large excess of working force, modernization of the existing sectors, perhaps the only means of improving production, is beset with conflicts of interest and confusion. In the primary sector the agricultural labourers get benefits of full employment only in certain seasons and during other times they are mostly under-employed or unemployed. If mechanization is introduced, this sector will require still less man power. But scientific method of cultivation is the only answer to greater production in the absence of more land to be brought under cultivation. The excess labourers have to be absorbed in some other sector if farming is organized on a scientific basis.
Primary activities, other than agriculture, namely animal husbandry, forestry and fisheries, have greater scope for expansion in Kerala. Forests in Kerala are rich in species like teak and rosewood and as a source of industrial raw materials they have not been fully exploited. Kerala is in the forefront among the fish producing states in India. Introduction of mechanized fishing and better fishing gear has increased production. But primitive methods of fishing are still being follmved. This means very low production and a large number of fishermen and their families live below the poverty line. Perhaps fishermen are the most depressed class of persons in Kerala and poverty and unemployment among them during certain seasons of the year have drawn the attention of the Government.
The secondary sector covering mining and industry is not highly developed in Kerala. Mining activity is naturally limited by the meagre occurrence of minerals.
162

But scope for the exploitation of the resources m titanium and. China clay is not exhausted.
The traditional industries of Kerala have a weak base. They are marked by low levels of productivity and little new investment is made in those industries. In the non-factory sector coil' is the foremost. It provides employment opportunities to a large number of workers. But under the existing conditions, workers are underemployed and hardly get sufficient wages for their existence.
In the factory sector also traditional industries like cashewnut, textile and coir factories are not modernized and due to 1m\' levels of production compared to the large vmrking force engaged in them, these industries are not thriving. Kerala has only a fe\v modern industries, with large capital investment. But they are, like all modern industries, not labour-intensive. In a state 'where there is large scale unemployment, to organize industries on modern lines, requires careful planning. The excess workers, thrown out of employment will have to be absorbed in other industries which involves among other things the investment of huge capital.
However there are some conditions favourable for stepping up the process of industrialization which has been slow and halting during the past decades in Kerala. Among them mention may be made of facilities such as cheap electric power, a ''''ell-developed transport system, and a plentiful supply of intelligent and skilled labour. The hydro-electric protential of Kerala has not been fully assessed. It is quite substantial and is about 6 per cent of the total hydro-electric potential of India. It is estimated that the hydro-electric power that can be economically developed in the State is 1,500 MW at 100 per cent load factor or 2,600 M'V at 60 per cent load factor. Even in this field the inordinate delay in the
163
commIssIOning of the giant Idikki project has affected the pace of industrialization.
There is no doubt that the trend in the grGwth of population and the other demographic characteristics haye a bearing on the social and economic conditions in the State. The population census taken every ten years besides providing a comprehensive picture of the population as on the reference date, yields valuable data for administration and for social ai1Cl economic planning. In the census, unlike any other type of social enquiry, the entire population is involyed. Hence it gives the true demographic situation. The 1971 Census, which marks the centenary of organized census in India, -has once again brought to light our resources in men and materials. The over population and the attendant problems in our state still remain unsolved. But there is an all-round a,rareness of our basic problems. It is hoped that the data collected through the 1971 Census will prove useful for social and economic planning in the State and that a more hopeful and healthy picture of the population will emerge from the next census in 1981.
164

165
Basic facts and
figures


FIGURES AT A GLANCE
(1971 CENSUS)
INDIA KERALA
POPUI,ATIO);: Total Persons 547,949,809 21,347,375
Males 283,936,614 10,587,851
Fetnales 264,013,195 10,759,524
Rural Persons 438,855,500 17,880,926
lVIales 225,218,984 8,352,350
Females 213,636,516 9,028,576
Urban Persons 109,094,309 3,466,449
J\Iales 58,717,630 1,735,501
Female, 50,376,679 1,730,948
DECENNIAL GROWTH Total 24.80 26.29
RATE,1961-71 (percentage) Rural 21.86 24.61
Urban 38.22 35.72
BIRTH ~.\TE, 1970 Total 37.0
(per 1,000 population) Rural 38.8 31.9
Urban 29.7 30.1
DEATH RATE, 1970 Total 15.9
(per 1000 population) Rural 17.3 9.2
Urban 10.2 8.8
DENSITY OF POPVLATIO&, 1971 Total 178* 549
(persons per SCI. km.) Rural 148t 477
Urban 2,50~t 2,585
SEX RATIO Total 930 1,016
(females per 1,000 males) Rural 949 1,020
Urban 858 997
PERCENTAGE OF URBAN POPULATION TO TOTAL POP{;LATION 19.91 16.24
167

IJVDIA KERA.LA ,---- ---------A. .-~------"-
Perc en- Percen-tage to tuge to total total populn- popu]a-
Number tioll Xumber tion
LITERATES Total 161,377,780 29.45 12,898,072 60.42 ~..fales 112,014,B45 39.45 7,O:'l4,O% ti6.62 Females 49,352,935 18.70 5,(J43,976 54.31
WORKERS Total 180,373,399 32.92 6,216,459 29.12 :Males 149,075,135 52.50 4,764,'iB2 45.00 Females 31,298,263 11.85 1,451,8;7 13.49
SCHEDL'LED CASTE 79,995,896 14.60 1,772,168 8.30
SCHEDULED TRIBE 38,015,162 6.94 269,356 1.26
BROAD AGE COA-IPOSI-nON Total 547,949,809 100.00 21,347,375 100.00
0-14 230,253,987 42.02 8,595,262 40.26 lj-59 284,8[16,839 51.99 II,t23,:il5 53.51
60+ 32,692,765 5.97 1,327,695 6.22
Age not stated 116,218 0.02 903 0.01
RELIGION Hindus 453,292,086 82.72 12,683,277 59.41
l\Iuslims 61,417,934 11.21 4,162,718 19.50
Christians 14,223,382 2.60 4,494,089 21.05
Sikhs 10,378,797 I.B9 1,284 0.01
Buddhists 3,812,325 0.70 605 N
JaiIlS 2,604,646 0.47 3,336 0.02
Others 2, 1B4,556 0.10 562 N
Religion !lot stated 36,083 0.01 1,504 0.01
168

INDIA /(ERALA r-____"'_-~ ,-----A..
Percen- Percen-tage to tage to total total popu!a- popula-
Number lion Number tion MOTHER TO"'iGCEt
( Speakcrs of Assamese 8,938,977 1.63 33 N
languages In- Bengali 4-!, 792,722 8.17 1,068 :'{
eluded in the Glljarati 25,875,2J2 4.72 6,.-,83 0.03
Eighth 3che- Hindi 162,577,612 29.67 10,265 0.05
dule of the K~nllada 21,707,<)18 3.% 78, :i37 0.37
Constitution of Kashmiri 2,438,360 0.44 23 N
India) ~Ja!ayalam 21,938,231 +.00 20,496,705 96.02
:vIarathi 42,251,207 7.71 17,32fi 0.08
Ol'iya 19,855,450 3.62 292 N
Punjabi 16,449,573 3.00 2,02,) K
S~nskrit 2,212 N 6 K
Sindhi 1,676,728 0.31 1,740 N
T,tmil 37,690,020 6.88 505,3{0 2.37
Telugu 44,752,926 8.17 44,282 0.21
Urdu 28,607,874 5.22 11,374 0.05
DISTRIBU-TIONOF WORKERS
Total 180,373,3!:9 100.00 6,216,459 100.00
I Cultivators 78,176,'r07 43.34 1,106,663 Ii .80
II Agricultural labourers 47,489,383 26.33 1,908,114 30.69
III Livestock, fishing, plan-tation etc. 4,296,COl 2.38 434,829 7.00
IV IHining and quarrying 922,762 0.51 29,886 0.48
V :'..Janufact:tring, proc:c~sin!:I, serViCing and repairs
(a) Household i'ldustry 6,351,714 3.52 265,892 4.28
169

INDIA KERALA ,-------A. r-----A--..
Percen- Percen-tage to tage to total total popula-
Number tion Number popula-tion
(b) Other than household ind"stry 1 0,71.5,805 5.94 711,962 11.45
VI Constrectinn 2,2J."),308 1.23 107,449 1.7&
Vll Tr'tde and commerce 10,038,243 5..~7 565,648 9.10
VIII Transport, storage and communica~ tiolls 4,401,201 2.44 242,089 3.89
IX Other services 15,765,47,", 8.74 843.927 i3.58
"'Density has been wcrkcd out after excluding figures of area and popUlation of Jammu amI Kashmit·.
tDensity for rural and urban areas han been worked out excluding figures of area and population of Jamm·J. & Kashmir and Arunachal Pradesh.
N-Negligible. tProvisional figures.
GROWTH OF POPULATION, 1901-71
Year
1901
1911
1921
1931
1941
1951
1961
1971
India ,-____ ..A_ __ ----.,
Persons Growth rate
2 3
238,337,313
252,005,470 + 5.73
251,239,492 0.30
278,867,430 + 11.00
313,539,060 + 14.23
360,950,3135 , 13.31 T
439,072,582 + 21.64
547,949,809 + 24.80
170
Kerala ,----A-
Persons Growth rat_e
4 5
6,396,262
7,147,673 + 11.75
7,802,127 + 9.16
9,507,050 + 21.85
ll,031,541 + 16.04-
13,549,118 + 22.82
16,903,715 + 24.76
2I,3~r7,375 + 2ti.29
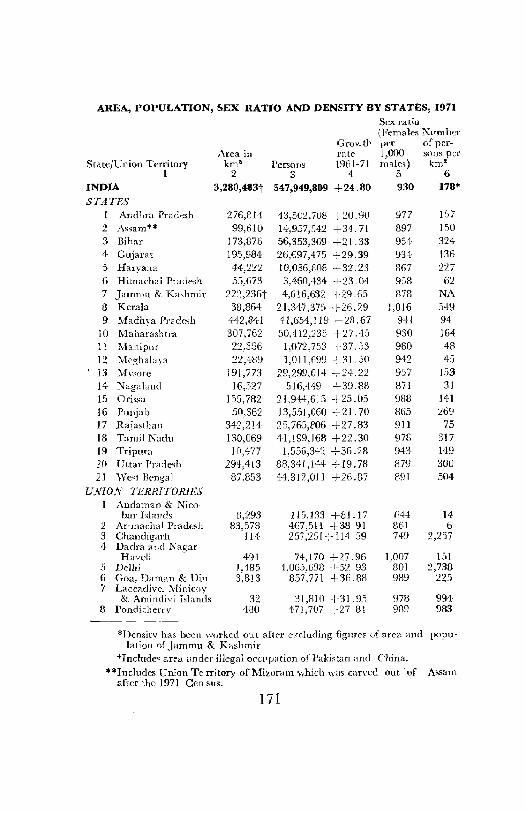
AREA, POPULATION, !'.EX RATIO AND DENSITY BY STATES, 1971 Sex ratio (Females ::\:l'mber
Grov.tl' !leI' of per-i\rea in rate 1,000 s<>ns per
State/Union Territory km' PCrsofJS 1961-71 male,) km" 1 2 3 4 5 6
INDIA 3,280,483t 547,949,809 +24.80 930 178*
STATES I Ar.dhra Pradesh 276,214 43,502,708 +20.90 977 157 2 Assam** 99,610 14,957,542 +3·1.71 897 ]SO 3 Bihar 173,876 56,353,369 +21. 33 954 324 4 Gujarat 195,984 26,1097,475 +29.39 934 ]36 5 Harya:.a 44,222 10,036,808 +32.23 867 227 6 Himachal PJ"oe,h 5'>,673 3,460,434 +23 04 958 62 7 Jammu & Kashmir 222,236t 4,616,632 +29.65 878 NA
3 Kerala 38,864 21,34i,375 +26.29 1,016 549 9 2'vfadhya Pr~dC'>h 442,841 41,654,119 -i-2R.67 941 94
10 l\Jaharash tra 307,762 50,412,235 +27.45 930 164 11 Manipnr 22,356 1,072,753 +37.53 980 48 12 :\1eghalaya 22,489 1,011,699 +31.3(1 942 45
, 13 Mysore 191,773 29,299,014 -!--24.22 957 153 14 ::'{agaland 16,527 516,449 +39.88 871 31 IS Orissa 155,782 21,944,615 +25.05 988 141 16 Punjab 50,362 13,551,OGO +21.70 865 269 17 Rajastl:an 342,211 25,765,P06 +27.83 9Il 75 18 Tamil Nadu 130,069 41,1£9,168 +22.30 97G 317 19 Tripura 10,477 1,556,342 +36.28 943 149 20 Cttar Pradesh 294,413 88,341,144 +19.78 879 300 21 vVe't Bf'ngal 87,853 44,312,011 +2fi.87 891 504
UNION TERRITORfRS I Andaman & Nico·
bar hl;mds 8,293 lEi,133 +81.17 {;44 14-2 Arunachal Prade,h 83,578 467,511 +38 91 861 6 3 Chandigarh 114 257:251+1!459 749 2,257 4 Dach'a a"cl K agar
Haveli 491 74,170 +27 96 1,007 151 5 Delhi ',485 4,065,698 +52 93 80] 2,738 6 Goa, Daman & Di" g',813 857,771 +36.88 989 225 r Laccadive, :Vlinicoy
& Amindi'-'i Islands 32 31,810 +31.95 978 994 8 Pondicl1erry 480 471,707 +27 81 989 983
*Densitv has been worked o'~t after e:-cduding figures of area and popu· lation of Jammu & Kashmir
tlnclndec arf" tonder illegal Occl'[Jation of Pakistan and China.
**Includes Union Te rritory ofl'vlizoram which was carved out of Assam after the 1971 Cen sus.
171
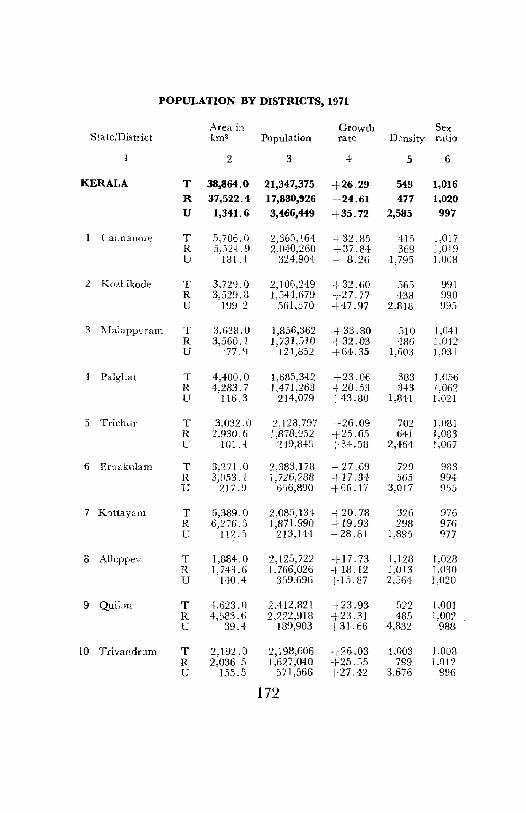
POPULATION BY DISTRICTS, 1971
Area in Growth Sex State/District km" Population rate Density ratio
2 3 4 5 6
KERALA T 38,864.0 21,347,375 +26.29 549 1,016 R 37,522.4 17,880,926 +24.61 477 1,020
U 1,341.6 3,466,449 +35.72 2,585 997
1 Cabnauofe T 5,706.0 2,365,164 +32.85 415 1,017 R 5.524.9 2,040,260 +37.('4 3(9 1,019 U 181.1 324,904 - 8.26 1,795 1,008
2 KOLl.ikode T 3,729.0 2,106,249 +32.60 :16,~ 991 R 3,529.8 1,544,679 ,27.77 433 990 U 199.2 561,570 +47.97 2,818 995
3 ~1alapp'-'ram T 3,638.0 1,856,362 +33.80 510 ],041 R 3,560.1 1,731,.">10 +32.03 486 ].042 U '77(1 124,852 +64.35 1,603 1,031
4 PalgLat T 4,400.0 1,685,342 +23.06 383 1,056 R 4,283.7 1,471,263 +20.53 343 1,062 U 116.3 214,079 -:- 43.80 1,841 1,021
:5 Trichur T 3,032.0 2,123,797 +26.09 702 1,O3l R 2,930.6 l,878,952 +25.05 641 1,083 U 101.4 'H9,345 -,-3-1. Cl3 2,464 !,067
6 Er'Jakulam T 3,271.0 2,383,178 -27.69 729 983 R 3,053.1 1,726,288 +17.34 565 994 1; 217.9 60,6,890 +66.17 3,017 955
7 K'lt.tayam T 6,389.0 2,08.1,134 ..L.20.73 326 976 R 6,276.5 1,871,990 +19.93 298 976 C 112.5 213,144 -28.81 1,895 qn
0 Alleppev T 1,884.0 2,125,722 +17.73 1,128 1,02il R L743.6 1,766,026 -+-18.12 1,0]3 J ,030 U 140.4 3.'19,696 +15.87 2,5fi1 1,020
9 Quitlu T 4,623.0 2,412,821 -+23.93 522 ['001 R 4,523.6 2,222,918 -+-23.31 485 1,002 U 39.4 189,903 +31.66 4,832 983
10 Trivanr:lrum T 2,192.0 2,193,606 -i"-26.03 1,003 1.008 R 2,036.5 1,1>27,040 +25.55 799 lJ)12 U 155.5 571,566 +27.42 3,676 996
172

RURAL-URBAN POPULATION, 1971
SI" Le/District Pe .. ',sOlJS M~les Females
2 3 4
KERALA R 17,880,S26 8,852,350 9,028,576
U 3,466,449 1,735,501 1,730,948
Cann~nol'e R 2.01-0,2GO 1,010,547 1,029,713 U 324,904 161,791 163,113
2 Kozhikode R 1,'i+L6i9 776,209 763,470 L; 561,'170 221,.'iSS 280,01.,)
3 :\IaJapPllram R 1,7.11,.'il0 841l,n28 81l3,432 L; 12'i,852 61,487 i}3,365
4 Palgl1at" R 1,'m,263 713,640 757.623 L 214,079 105,931 108)48
5 'l'r:chllr R 1,878,9:)2 901,905 97i,047 L 2-+9,845 120,369 178,976
I) Ernakulam R 1.726.233 865,868 860.420 L '6.;6;390 336,078 320)l12
7 Kottayam R 1,371 ,990 947,139 924.8.51 L 213,144 107,826 105.313
8 Alleppey R L766.1126 870,005 896.021 U 359;696 178,077 181;619
9 Qnilon R 2,222,918 1,110.17~~ 1,112,746 U 189,903 S5,548 9+,355
10 Trivandrum R 1,627,040 808,837 813,203 U 57 [,566 2W;,339 235,227
173

POPULATION BY TALUKS, 197
Population, 1971 Growth De_'1sit v r-~-'-~--~_A..--------.._ rate per km'·
District,'T alu k Persons Males Fcma:es 1961-71 1971
2 3 4- :; 6
1 CANNANORE 2,365,164 1,172,338 1,192,826 +32.85 415
Kasaragod 353,819 17R,794 175,025 -;-30.55 3fl4 Ho<d(l1g 329,201 163,065 166,136 --;--36.52 333
Taliparamba t +35,090 217,056 218,034 ---'--42.84 327 Cann:lllOre 501,766 247,461 25 i,30S --1-26.15 1,165 'I'e1!Lchcrry 615,953 299,351 316,602 --i-29.51 510 North vVynad 129,335 65,611 62,724 -43.39 173
2 KOZIflKODE 2,106,24~ 1,057,764 1,048,41>5 +32.60 565
r Badagara~ ~409,771 201,291 203,480 +28.09 74:)
Quibndy'i, L 46P,714 232,939 235,775 +28.71 619 SO'_ltb Wynad .284,515 148,727 135.788 +:)3.75 206
Kozhi'"odel (943,249 474,807 468,4-12 +31.13 919
3 MALAPPURAM 1,856,362 S09,515 946,847 +33.80 510
Ernad 715,496 35[:,253 30,9,243 +36.47 316 Perinta lmanna 273,101 132,979 140,122 +31.89 540 Tirur 653,793 317,445 336,348 +32.72 983 Ponnan; 213,972 102,838 111.134 +30.94 1,073
4 PALGHAT 1,685,342 819,571 865,771 +23.06 383
OttapalalD 522.027 24-9,539 272,488 +22.12 617 !\.fan.·J_argbat 184,579 91,897 92,682 +39.79 168 Pa1ghat 369,001 181,171 187B'-lf! +24.57 512 Ch,ttu.- 313,973 j:) :-'376 159,597 +15.:;2 272 A1at!-'ul' '), .... ''''T.')
~_~J.J: : .J,~ 14:7 ~ 588 1 ~'l.174 +22.47 520
5~· TRICHUR 2,128,797 1,022,774 1,~O6,023 +25.09 702
TaJappiJ1y '103,795 192,220 211,575 +26.35 609 Trich"r 588,36 1 23",109 301,255 --1-27.37 926 ChavJkkad 4-33,345 200,480 232,866 +23. 0 8 1,116 Kodul1>;al1ur 112,SiS 55,084 57,891 +25"12 1,545 Mukundapmam 591),317 287,881 302.436 +26.42 449
174

POPULATION BY TALUKS, 1971-contd.
Population, 1971 Growth Density r-----~__.A_~-~-~ rate per km"
District,lTaluk Persons Males Females 1961-71 1971
2 3 4 5 6
-6 ERNAKULAM 2,383,178 1,201,946 1,181,232 +27.69 729
Alwaye 302,176 151,623 150,553 +33.38 926 Parur ~81,047 140,408 140,639 --27.07 1,467 Cochin 396,849 200,523 196,326 +26.39 2,817 Kanayannur 493,384 252,072 246,812 -',-31.30 1,546 Kunr.athunad 292,113 146,962 145,145 I 27.40 131 Muvattupuzha 370,534 185,798 184,736 +20.25 552 Thodupuzha 241,575 124,554 117,021 --r28.94 237
7 KOTTAYAM 2,085,134 1,054,965 1,030,169 +20.78 326
Devicolam 134,350 69,581 L 6~,7G9 + 9.09 76 Udumbanchola 264,913 137,488 127,425 :-70.27 247 Peermade 146,841 74,714 72,127 + 9.88 112 ~\!leenachil 351,879 176,856 175,023 +13.57 487 Vaikom 252,288 125,954 126,334 +20.77 790
Kottayam 497,156 249,981 2-47,175 +17.80 920 Kanjirappally 172,360 87,808 84,532 +15.84 491 Changanachen-y 265,347 132,583 132,76·1 +18.23 1,013
8 ALLEPPEY 2,125,722 1,048,082 1,077,640 +17.73 1,128
Shertalai 379,626 189,00J 190,621 +21.86 1,184
Ambalapmha 329,661 164,224 165,437 --'-22.08 1,844-
Kuttanad 187,698 93,7.J I 93,947 ,10.92 706
ThiruvaUa 342,736 168,334 1 H,402 +12.14 989
Chengannur 232,218 113,856 ll8,362 +16.78 1,154
!v[avelikkara 323,277 158,202 165,075 +1903 1,134
Karthigapally 330,506 160,710 169,796 +1860 1,472
'9 QUILON 2,412,821 1,205,720 1,~,101 +23.93 5221
Karunagapally 321,164 160,707 160,457 +18 . .54 1,516
Klllinathur 291,796 145,492 146,304 +22 .. 58 748
175
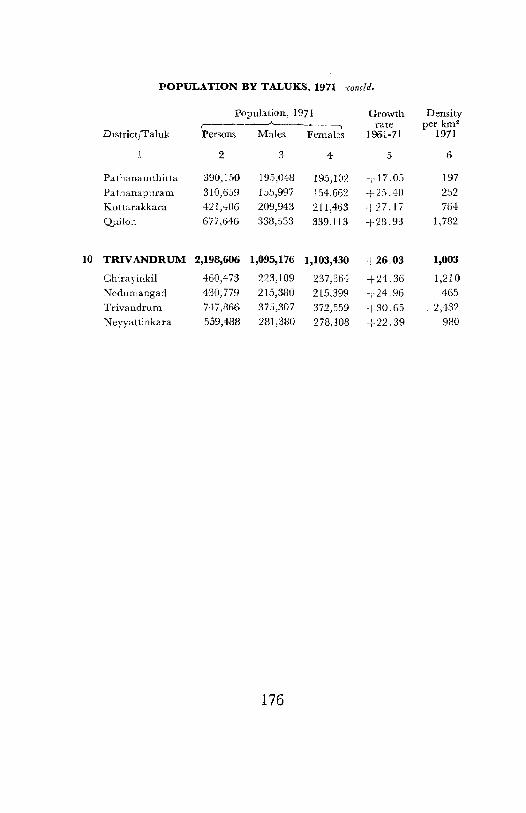
POPULATION BY TALUKS, 1971-concld.
Population, 1971 Growth Density ,----__ ------A-__ ~~___, rate per km"
District/Taluk Persons Males Females 1961-71 1971
2 3 4- 5 6
Pathanamlhitla 390,150 195,048 195,102 +17.05 197
Pathanapuram 310,659 155,997 154,662 +25.40 252 Kottarakkara 421,406 209,943 211,463 +27.17 764
Qui Ion 677,6+6 338,533 339,113 +28.93 1,782
10 TRIVANDRUM 2,198,606 1,095,176 1,103,430 +26.03 1,003
ChirayiLCkil 460,473 223,109 237,364 +24.36 1,210
~edumangad 430,779 215,330 215,399 +24.96 465
Trivandrum 747,866 375,307 372,559 +30.65 . 2,432
N eyyattinkara 559,438 231,380 278,103 +22.39 930
176

POPULATION BY TOWNS, 1971
Population, 197! Growth r---~----___..A_- ---.., rate Density
CityfTown Persons Males females 1961-71 per kmt
2 3 1 5 6
CLASS I (100,000 and arJOve)
1 Cuchin 439,066 224,992 214,074 +58.09 4,628
2 Trivandrum 409,627 206,096 203,531 +70.81 5,467
3 Calicut 333,979 168,009 165,970 +51.16 4,040
4- Alleppey 160,166 80,307 79,8:;9 +1').37 3,42:;
5 Quilon 124,208 62,545 61,663 -;-36.47 6,721
CLASS II :)0,000 - 99.999)
I Palghat 9.\788 47,776 48,0 12 --23.41 3,601
2 Trichur 76,241 37,345 38,896 -l_ 4.39 6,027
3 Tellicherry 68,759 33,738 35,021 +53.61 4,479
4- Kottayam 59,714 30,075 29,639 +13.34 3,84-0
5 Cannanore 55,162 27,907 27,2Yi +19.65 5,001 6 Kayamkulam 54,102 26,690 nA12 +2t.3. 2,483
7 Badagara 53,938 26,902 27,036 +22.84 2,528
CLASS III (20,000 - 49,999)
1 Changanacherry 48,545 24,195 24,350 +14.56 3,596 2 Kilikolloor 41,871 21,028 20,843 +29.74 3,735 3 Chalakudy 37,562 18,722 13,840 +122.73 1,4-89 4 Shertalai 36,752 18.164 18.588 +17.97 2,270 5 Ponnani 35,723 17,426 18,297 +55,47 3,833 6 Kasaragod 34,984- 17,595 17,389 +26.59 2,097
7 Tirur 32,272 16,009 16,263 +140.89 1,945
8 l\hlappuram 32,002 15.889 16,113 952 9 Kauhangau 31,869 15,971 15.398 +34-.92 985
10 Haripad 31,145 15,126 16,019 -52.84 2,335 II Feroke 30,516 15,294 15,222 +26.50 2~2~)5
12 Chavakkad 29,443 13,643 15,eOO +1.87 2,373
13 Pantalayani 28,:'30 13,826 14,704 --Hi4.38 2,239 14 Cheruvannur 28,'i22 14,379 14,143 2,765 15 Chittur--Thatha-
mangalam 28,510 14-.027 14-,483 +7.76 1.938
177 12-1 Census/Kerala/73

POPULATION BY TOWNS, 1971-colild.
Population, 1971 Growth ,---~-----"-._____-------., rate Density
City/Town Persons !\''fales Females 1961-71 per kill'
2 3 -I :> 6
Hi Trippunithura 28,090 13,825 14,265 +94.48 l,056 17 Be)'pure 27,688 1+,032 13,656 -19.55 2,660 18 Attinged 27,0.,2 13,274 13,778 +2:2.68 1,908 19 Thiruvalla 26,683 12,912 13,771 +10.07 I,B44 20 Payyallllur 26,52{ 12,620 13,904 1,122 21 Ollur 25,957 12,769 13,188 3,072 22 Ncmolll 25,8-lG 12,893 12,953 -27.23 2,122 23 ~LtYelikkara 25.618 12,416 13,232 ;-35.17 2,028 24 Irinja1akl1da 25,-W5 12,315 13,090 +13.7") 2,260 25 Xi1csh",ar 25,:297 12,220 13.077 +20.71 964 26 Ottapalam 24,823 11,971 12,852 --' 130.23 1,]]9
27 Parl1r 24,393 11.95B 12,435 -16.98 2.701 28 Alwaye :N,067 12,'r63 11,604 +EI.3f) 3,352 29 Ncyyattinkara 23.983 11,963 12,020 -i·18.33 2,472
30 ]\[uvattupuzha 22,137 11,396 10,741 -3.33 1,680 31 Shorallur ~:L,038 10,988 11,050 +54.04 1,281
32 Pappinisscri 21,952 11,039 10,913 "t 33.69 1,410
33 KunnCiman-gabm 21,7:iG 10,789 10,9('7 391
3l Perum bm'vor 20,388 10.755 10.133 -+- ~9.36· 1,537 35 ThodupllLha :W,U80 10,840 10,040 956
36 Eloor 20,725 11,192 9,533 1,987
37 Kanjirappally 20,687 10,675 10,012 +8.66 783 38 Varb];, 20,36.3 9,869 10,496 +J69.38 J,98J
39 Palai 20,:n3 10)92 9,981 +31.16 1,273 }O Vaikom 20,014 9.855 10,1:")9 --;-14.')0 2,293
CL.ISS IV (10,000 - 19,999)
i'<jarakka1 19,221 9,450 9,771 .121.83 2,235
2 Kunaalnklll aIn IB,367 8,623 9,74+ + 12.90 2,639
3 Kalamasseri 17,9:;7 9,:i05 8,+52 1,406 l Ralaramapuram 17,384 8,777 !l,G07 " ·35 33 2 U92
.) Taliparamba 16,227 8,135 8,092 -25.85 2,023
6 Guruvavur (TOWll'hip) 15,81)3 7,451 8,412 2,444
178

POPULATION BY TOWNS, 1971-concld.
Population, 1971 Growth ,--____ _.-)o_----------, rat!''! Density
City/Town Persons :\-lalcs Females 1961-71 per km2
2 3 4- .i 6
7 1\Ia njeri 1:),734- 7,70ll 3,034- +2B.17 1,186
3 Ettumanoorj 15,71:; 7,987 7,128 +:21.93 2,118
9 Ka[lalundi D,555 7,542 3,013 -; 26.60 VJ18
10 ::\~dumangad 14-,6-1:3 7,247 7,396 1,887
11 Km'alam 13,999 7,H-9 6,8:;0 -+ 28.70 3,406
12 Pazhanji 13,762 6,3:)8 7,204 -17.78 1,783
13 Ponkunnam 13,672 7,031 6,591 991
H PUllalur 13,562 6,B69 6,693 3,349
L) Chcnganllur 13,316 6,:;91 G,7:!..) ----1-0.23 2,378
16 l\lauje<hwar 12,967 6,-1-39 6,528 ---i 28.26 1,382
17 c\ngamaly 12,932 6,+31 6,501 1,899
18 ~Clnn1.<Lra 12,897 G,22li 6,671 --I B.03 811
19 :vlannarghat 12,~}80 6,197 G,3H:? 1,631
20 Pandalam 11,33-1- 5,871 6,013 +18.84- 1,251
11 Elathur 11,273 5,613 5,660 +31.02 2,202
~~ Pdttambi \0,4-11 ;:',150 5,261 ,3-1-.01 1,287
23 Kuthuparamba to,305 _\13fj 5,\G9 1,753
24 Kundara \0,262 ,-,,106 .\136 --~1.01 1,84-6
25 Mundakkayam 10,142 'J, I 9;) ·L947 +80.91 t 1,932
CLISS V (\000 '--- 9,999)
I Kazhakuttam 9,829 -1-,930 L !,899 __:_ 4:-'.46 1,170
2 ~Iokkam 9,813 .:;'169 -l,6H 732
3 ])erintallnanna 9,121 4,+63 +,GC;8 1,788
·I Chira yinkil 8,838 -1-,141 -1:,697 1,564
'> Kumbla 8,812 i U37 4,373 +33A7 657
6 Valapattanam 7,2% t 3,718 3,378 ---'-26.98 3,576
7 vI( adakkancherry 7,2!-5 3,H3 3,802 -37.03 707
B Henuunbikanagar 7,032 3,~96 3)36 1,762
'J Kothaman.gahm 6,')34- 3,DI ~,2r;3 1,1::12
rLASS VI (LESS TH-LV 5,000)
Cantlanore CantO!11nent t,750 2,335 1,914 -:-IiG. 14 2,654
2 :Vlunnar 't,382 2,4-71 1,911 743
179
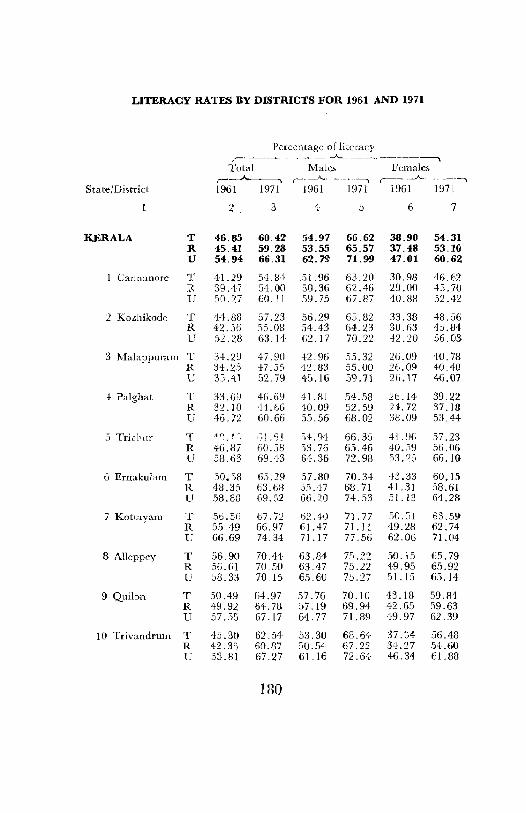
LITERACY RATES BY DISTRICTS FOR 1961 AND 1971
Percentage of literacy ( ______ _____...A.. ____ ~---__ ____,
Total Males Females r----A,------.,,~ r-...--A...,______.,,-...---~ r--------"-~---~
State/District 1961 1971 1961 1971 1961 1971
2. 3 4 5 6 7
K.ERALA T 46.85 60.42 54_97 66.62 38.90 54.31 R 45.41 59.28 53.55 65.57 37.48 53.10 U 54.94 66.31 62.79 71.99 47.01 60.62
1 Cannanore T 41.29 54.84 51.96 63.20 30.98 46.62 R 39.47 54.00 50.36 62.46 29.00 4".70 U 50.27 60.1 J 59.75 67.R7 40.88 52.42
2 KO.lhikodc T 44.88 57.23 56.29 65.82 33.38 48.56 R 42.56 55.0B 54.43 64.23 30.63 45.84 U 52.28 63.14 62.17 70.22 42.20 56.03
3 Malappuram T 34.29 47.90 42.96 55.32 26.09 40.78 R 34.23 47 . .)5 42.83 55.00 2G.09 40.40 L 33.41 52.79 45.16 59.71 26.17 46.07
t Palghat T 33.69 46.69 41.81 54.58 26.14 39.22 R 32.10 44.66 40.09 52.59 24.72 37.18 li +6.72 60.66 55.56 68.02 38.09 53.44
5 Tric+ur T L~ ~. ! ~ ,~] .51 54.94 66.35 41.96 57.23 R 46.87 60.58 53.76 65.+6 40.59 56.06 V 58.63 69.43 64.36 72.98 53.2,-, 66.10
6 Ernaklilaill T 50.58 65.29 57.80 70.34 43.33 60.15 R 48.35 63.68 55.47 68.71 +1. 31 58.61 U 58.88 69.52 66.20 74.53 51. 13 64.28
7 Kottayam T 56.5(, 67.7'2 62.40 71.77 50.51 63.59 R 55.49 66.97 61.47 71.11 49.28 62.74 U 66.69 74.34 71.17 77.56 62.06 71.04
8 Alleppcy T 56.90 70.44 63.84 75.22 50.1.5 65.79 R 56.61 70.50 63.47 75.22 49.95 65.92 U 53.33 70.15 65.60 7.5.27 51.15 65.14
9 QlIilon T 50.49 64.97 57.76 70.10 43.13 .59.84 R 49.92 64.78 57.19 69.94 42.65 59.63 U 57.55 67.17 64.77 71.89 49.97 62.39
10 Trivandrum T 45.30 62.54 53.30 68.64 :37.:;4 56.48 R 42.33 60.87 50.54 67.22 34.27 54.60 U 53.81 67.27 61.16 72.64 46.34 61.88
180

LITERACY RATES BY TALUKS. 1971
Percentage of literacy 1971 r--------"'-
DislrictjTaluk Persons J\Iales Females
2 3 4
KERALA 60.42 66.62 54.31
1 CANNAN ORE 54.84 63.20 46.62
Kasaragod 40.39 51. 24 30.31
Hosdrug 45.32 54.HB 35.93
Taliparamba 54.77 63.59 45.99
Cannanore 63.44- 71.22 :>:>.87
Tellicherry 62.56 69.68 55.83
North Wynad 47.32 55.54 38.53
2 KOZillKODE 57.23 65.82 48.56
lladagara 55.41 65.69 45.48
Quilandy 56.R4 66.77 47.04
South Wynad 47.34 54.68 39.29
Kozhikode 61.20 68.91 53.38
3 MALAPPURAM 47.g0 55.32 40.78
Ernad 43.68 56.05 41.37
Perintalmanna 50.55 56.42 44.93
Tirur 46.70 54.81 39.05
Ponnani 45.59 52.94 33.79
4; PAL GHAT 46.69 54.58 39.22
Ottapalam 52.64 53.21 47.54
:\lannarghat 38.47 45.26 31. 73
Palghat 48.81 57.75 40.18
Chittur 40.39 50.48 30.63
Alalhur 45.35 54.65 36.70
5 TRICHUR 61.61 66.35 57.23
Talappilly 56.23 60.76 52.11
Triclmr 66.35 70.35 62.53
Chavakkad 59.11 64.64 54.34
Kodungallur 60.34 . 67.92 54.11
l\fukundapuram 62.57 66.93 53.36
181

LITERACY RATES BY TALUKS, 1971--contd.
Percentage of literacy. 1971 ,-____ .--A. _____ ......
District/Taluk Persons ivIales Females-
2 3 4
6 ERNAKULAM 65.29 70.34 60.15 Alwaye 60.61 G5.83 55.35 Parur 66.76 71.74 61.79 Cochin 67.14 72.16 62.02 Kanayannur 69.46 74.70 64.11 Kunnathunad 61,61 66.97 56.19 lVluvattupuzha 63,66 68,82 58.46 Thodupuzha 64,69 63,65 60.18
7 KOTTAYAM 67,72 71.77 63,59 Devicolam 44,41 53,31 34.84 Udumbanchola 57.D2 61,55 52.14 Peermadc 5·1.29 62.04 46,27 Meenachil 72.82 Ti.46 70,14 Vaikorn 68.08 73.62 62.56 Kottayanl 75.43 78.38 72.46 Kanjirappallv 69.86 73.09 66,51 Changanacherry 74,72 77.48 71.96
8 ALLEPPEY 70.44 75.22 65,79 Shertalai 66,07 73.35 58.86 Ambalapuzha 68.72 74.61 62.87 Kuttanad 75,03 78,07 72. 01 Thiruvalla 78,29 80,27 76.38 Chengannur 72.42 76,03 68,95 '\1avelikkara 68.73 73.04 64,70 Karthigapally 66.65 72.68 60.95
9 QUILON 64,97 70.10 59.84 Karunagapally 62.4.6 6iL 71 56.20 Kunnathur 64,58 69.27 59.91 Pathanarnthitta 72.72 7:),47 69.97 Pathanapuram 62.61 67.73 57.46 Kottarakkara 63.30 68.98 57.66 Quiloll 63.97 69.79 58.16
10 TRIVANDRUM 62,54 68.64 56.48 Chirayinkil 60.65 67,81 53.91 Nedumangad 61.10 67,69 54..52 Trivandrum 67.18 72,98 61.35 Neyyattinkara 58.93 64 24 53,67
182

LITERACY RATES BY TOWNS, 1971
Percentage of literacy
District Town Persons l'vfales Females
2 3 4 5
Cannanore l\.faIl j esb ",a r 49.29 61.05 37.70
Kumbla 47.83 56.64 38.99
Kasatagod (M.l 56.04 64.21 47.78
Kanhangad 49.36 59.24 39.44
Nileshwar 50.58 61.56 40.31
Payyannur 60.48 63.45 53,25
Taliparamba 50,76 62.56 38.90
Pappini"eri 58.80 68.15 49.34
Valapattanam 60.39 69.96 50.45
Cannanore (:-'1'1 66,26 72.10 60,23
Cannanore Cantonn1ent 74,61 79.30 67.66
Kuthuparamba 59 .. 52 65.89 53.20
Tellidierry (M) 70.89 75.48 66.46
2 Kozhikode Bac1agara evIl 61.21 69.05 53.40
Pantalayani 57.14 65.03 49.71
Elathur 60,61 69,34 51. 96
Calicut (C) 65.38 71.80 58.89
Kunnamangalam 60.99 70.06 52,06
l\Tokkam 65.10 73,22 56,05
C:heruvannur 63.64 70.76 56.40
Beypore 60.24 65,35 54,47
Feroke 55.43 64.57 46.24
Kada1undi 55.87 66.12 46,21
3 l\falappuram Malappuram (1\1) 59.91 66.04 53.86
Manjeri 64,33 70.49 59.41
Perintalmanna 66.12 72.53 59,93
Tirur 55.50 61.50 49.60 Ponnani 35,25 44.26 25,58
183

LITERACY RATES BY TOWNS, 1971-col!td.
Percentage [)[ literacy
District
4 PalghClt
5 TridlUf
1I Ernaklilam
Town
2
Pattalllhi
Shoranur
Oltapalam
~lanllarghat
Hemambikanagar
Palghat ('vI)
,----'-. Persons l\{alcs
3
ji .0:1
69.06
liO.71
.:ili.31J
66.40 60.:11
4
(;hittur-Thathamallgabml)\J)jl). 23
Nemmara 54.45
G4.33
74.99 67.02
65.29
71.38 67.90
67.73 63.06
\Vadakkallcherry
Palhanji
KunnamkuLJ.ln (i\I)
Trichur ('vI) OHur
Cna\'akkad
Guruvayur 'fown "hip
Irinjalakuda (M)
Chalakudy
>\ngamaly
Alwaye C\I)
I'arm :~ 'vI)
Eloor
Niarakkal
Cochin (C)
Trippunithura
Kalamassery
Perumbavoor (1\1)
Kothamangalam
~Iuvattupuzha (M)
Thodupuzha
184
66.0:)
68.42 71.29
76.17
69.42 c13.95
68.59 73.52 6').60
63.42
H.42
71.59
71.36
70.12
59.30
n.39
62.42
67.33
69.21
68.75
68.78
70.81 71.03 73.91 79.11
72.70 58.99 72.61
76.68 69.32
67.44
7ll.73
75.98
77.06
74.20
74.57
76.67
69.11
7:1.44
74.63
74.40
13.39
------., Females
,5
!9.91 (j3.16
54.83
47.:'i6
ril.IS
.13.15 :;1.00
46.4+
61. 73 G6.05 68.93 73.34 66.25 49.59
65.04-
70.55 61. 70
59.44-
69.79
67.36
64.66
66.17
64.18
68.23
54.89
61.90
63.7S
62.75
63.80

LITERACY RATES BY TOWNS, I 971-cOIdd.
District
7 Kottayam
8 ~\llcpp"y
9 Quilon
10 Tcinndrum
Tow.n
2
]\1 unllar
Palai (]\f)
Vaikom (M)
Ettumar.Oor
Kottayam (:\T)
Ponkllnnam
Kanjirappally
:\Iumbkkayam
CILlilgall<lcherry (:\1)
Shertal"i (:\1)
Allcppey (IVf)
Thiruvalla (,\1)
Chcngannur
:\Iavclikkara (M)
Pandalam
H<Lripad
Kayamkulam (:.vI)
Punalur
Quilon (M)
Kundara
Kilikolloor
Varkala
Altingal (,\1)
Chirayinki]
Kcdllmangad
Kazhakllttam
Tri vandrum (e)
Nemom
Balaramapuram
Neyyattinkara
Kovalam
185
Percentage of literacy r-Persons Males Fem~,les
3 4 ~
70.01 76.37 61.80 77.2.) 79.14 75.29
70.84 76.34 (i5.50
73.18 75.97 7().29
77 .37 80.!:! 74.58
74.69 77 .31 71.87
6S.53 72 .J:! 64.69
69 70 73.09 6(3.14
74.9.> 78.29 71.62
69.16 76.12 62.37
70.0-l 7.1,43 6[.6:2
79.31 Sl.2-l n.49
76.52 79.8., 73.25
75.57 78.13 73.16
66 Xi 71.37 62.45
6S.57 73.83 1i3.6i
64.15 70.51 .')7.95
70.31 74.76 be'.74
68.22 72.13 64.25
70.29 73.91 G6.70
62.28 69.75 ,,-t.75
19.77 64.71 ;:,5.13
69.01 75..,6 62.69 74.07 7S.70 69.98
63.80 70.62 57.11
62.79 69.66 35.89
69.16 74.41 63.84
63.19 71.48 S8.92 60.76 67.47 53.91
67.23 72.26 62.22
34.04 36.72 31.24
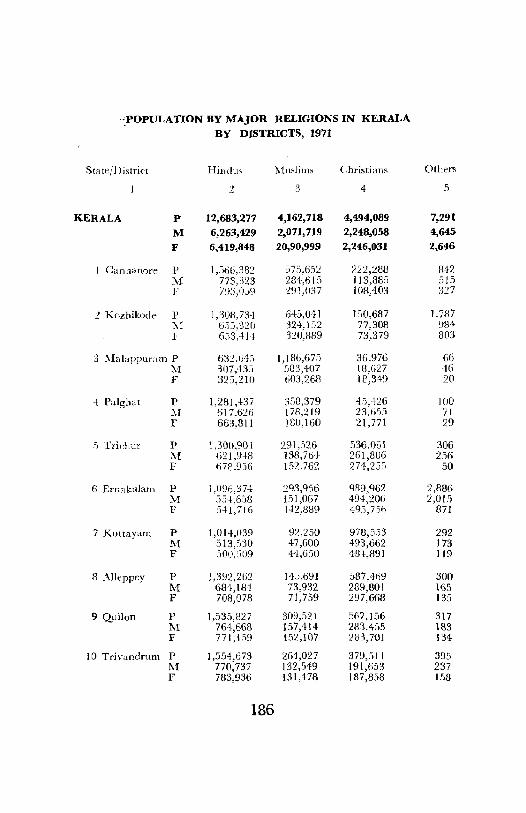
·'.POPULATION BY MAJOR RELIGIONS IN KERALA BY DISTRICTS, 1971
Sta tei District Hindu, Muslim, Christians Others
:2 3 4 5
KERALA P 12,683,277 4,162,718 4,494,089 7,291
M 6,263,429 2,071,719 2,248,058 4,645
F 6,419,848 20,90,999 2,246,031 2,646
1 Cannanore P 1,56(i,382 575,65:; 222,233 842 M 773.323 234,615 ] 13,1385 SIS F 793;059 291,037 108;103 327
2 Kozhikode P 1,308,734 645,041 F,O,687 l.787 C\l 6.):).320 32+.152 77.30B 984 l' 6:'>3,414 3:W;889 73;379 803
3 :\falappurarn P 632,li4:; 1,186,675 36,976 66 :\-1 307,433 583,407 18,627 46 F 325;210 603,268 12,349 20
-1 Palghat P 1,281,+37 358,379 4:).426 100 ::-'1 617.626 178,219 23.651 71 F 663,811 180,160 21,771 29
.s Trichur P \.300,90+ 291,526 536.061 306 ::-.[ 621,9+8 138.764 261;806 251) F 672,9:;6 152)62 274,255 50
6 Ernakulam P 1,096,37-1 293,956 989,962 2,886 ]\1 554,658 [51,067 49+,206 2,015 F 5+1,716 142,889 49:;' 751i 871
7 Kottayam P 1,014,039 92,250 978,553 292 1\1 513':>30 47,600 493,662 173 F 500,509 4+,650 484,891 Jl9
8 .\J1eppey P 1,392,262 14.),691 587.469 300 M 6134,184 73,932 289;801 165 F 708,078 71,759 297,668 135
9 Quilon P 1':)3\827 309,521 567,156 317 ~I 764,668 157,414 283.455 183 F 771,159 152,107 283,701 134
10 Trivandrurn P 1,554,673 264,027 379,:'11 39:' j\f 770,737 132,549 191,653 237 F 783,936 131,478 187,858 158
186

POPULATION BY WORKERS AND NON-WORKERS, KERALA, 1971
Category P<:rsons Males J<'emales
'2 3 4
TOTAL POPULATION T 21,347,375 10,587,851 10,759,524
R 17,880,926 8,852,350 9,028,576
U 3,466,44g 1,735,501 1,730,948
TO TAL WORh'ERS T 6,216,459 4,764.582 1.451,877
(I-IX) R 5,281,004 4,009,495 1,271,509
U 935,455 755,087 180,368
I Cultivator, T 1,10G,tiC3 1,039,331 67,332
R 1,068,823 ],004,486 61,337
1.3 37,3,1-0 34,34:'> 2.995
II Agricultural T 1,908,114 1. 19.o,,7.'i5 712,359
labourers R 1.814,824 1.1 34.94G 679,878
U 93,290 60,809 32.481
III Livestock, Forestr>', T 434,829 3;;(i.438 78.391
Fishing, Hunting and R 388,647 311,297 77,3:'>0
Plantations~ Orchards 1.3 1fi.182 4~>.l4l ],041
& allied acti"ities
IY !;Ening and Quarrving T 29,886 27,5B3 . 2,303
R 26,962 2C,,2-!6 1,716
L' 2.92-1 2,337 587
V l\:[anutacturing, Process-ing, S.;rvicing & Repairs
(a'i Household T 265,892 147,u25 IIB,2G7 Industry R 231,691 126,5S1 105,140
U 34,201 21,074 13,127
(b) Other than T 711,962 533,3i3 178.609 Household R 536,195 386,379 149,816 II ,dust! y U 175,76i 146,974 28,i93
187

POPULATION BY WORKERS AND NON-WORKERS, KERALA, 1971-colldd.
Category Persons lvlales Females
2 3 4
VI Con'itrllction T 107,+19 103,098 +,331
R 8+,7++ 81,785 2,939
U 22,7[):i 21,313 1,392
VII T!"H]'" cl'ld C'lmmcrce T :;6:;,6+8 '>36,887 28,761
R 391,8:;4 373,';:)3 18,30]
C 173,79+ 163,334 10,460
VITI Transport, Storage and T 242,089 227,571i 1-1:,,,]3
C{)lnmunication~ R 1-1:9,728 139,337 10,391
U 92,361 88,239 4,122
IX Oth,,!' Services T 8+3,927 596,93C 246,991
R 587,536 425,9Li 1(il,I):.'1
U 2,56,391 171,021 85,370
X ,\D,V-WORKERS T 15,130,916 5,823,269 9,307,647
R 12,599,922 4,842,855 7,757,067
U 2,530,994 980,414 1.550,580
188

DISTRIBUTION OF WORKERS AND NON-WORKERS, BY DISTRICTS, 1971
State/District Persons ~lales Females
2 3 4
TOTAL WORKERS
Kerala 6,216,459 4,764,582 1,451,877 I Cannanore 714,593 J38,887 IT),706
2 Kozhikode 566,936 467,485 9'),451
3 lVlalappuram 502,64+ 406,415 96,229
-I- Palghat 604,82,1 402,083 202,742
5 Trichllr 603,:;51 427,600 175,951
6 Lrnakulam 687,253 542,313 144,940
7 Kottayam 619,613 494,382 125,231
8 AJleppey 598,468 452,061 146,407
9 Quil()11 690,283 :')34,959 155,324
10 Trivandrum 628,293 498,397 129,896
CULTIVATORS
Kerala 1,106,663 1,039,331 67,332 Cannanore 130,878 112,905 17,973
2 Kozhikode 82,607 78,313 4,294
3 l\lalappuram 94,713 88,876 5,837
4 Palghat 95,20+ 80,122 15,082
!J Trichur 82,35t 73,883 8,471
6 Ernakulam 100,547 96,101 4,446
7 Kottayam 150,655 147,649 3,006
8 AUeppey 95,798 92,917 2,881
9 Qui Ion 185,620 182,985 12,635 10 Trivandrunl 88,287 85,580 j 2,707
II AGRICULTURAL LABOURERS
Ker~Ia 1,908,114 1,195,755 712,359 1 Cannanore 242,383 134,264 108,119
2 Kozhikode 149,332 t105,9B4 ' 43,348
3 l\lalappuram 196.654 131,741 64,913
189

DlSTlUBUTlON OF WORKERS AND NON-WORKERS
BY DISTRICTS, 1971-contd.
State/District Persons !vfales Females
2 3 4
4 Pal ghat 292,833 141,303 151,575 j Trichur 198,203 104,901 93,302
6 Ernakulam 1.~2 759 90,468 62,291
7 Kottayam 16],214 115,014 46,200
8 AlIeppcy 183,481 110,609 n,!!n 9 Quilon 143,647 109,318 34,329
10 Trivandrum 187,558 152,148 35,410
III LIVE-STOCK, FORESTRY, FISHI~G, HUNTING AND
PLA~TATIONS, ORCHARDS AND ALLIED ACTIVITIES
Kerala 434,829 356,438 78,391 1 Cannallore 37,822 32,339 5,483
2 Kozhikode 60,881 48,121 12,760
3 11alappuram 30,004 28,246 1,758
4 Palghat 21,706 17,764 3,942 5 Trichur 30,098 26,734 3,364
6 Ernakulam 39,420 36,306 3,114 7 Kottayam 107,680· 67,995 39,635 3 Alleppey 32,383 31,181 1,202 9 Quilon 40,922 35,927 4,995
10 'frivandrum 33,913 31,825 2,088
IV MINING AND QUARRYING
Kerala 29,886 27,583 2,303 I Call1lanore +,999 +,870 129
2 Kozhikode 3,434 3,383 51 3 l\1alappuram 2,612 2,&08 4
+ Palghat 1,659 1,622 37 ':) Trichur 4,156 3,652 504 1) Ernakulam 4,566 4,103 458 i Kottayam 1,823 1,731 92 8 Alleppey 1,352 1,320 32 9 Quilon 2,H9 2,293 156
10 Trivandrum 2,836 1,996 840
190
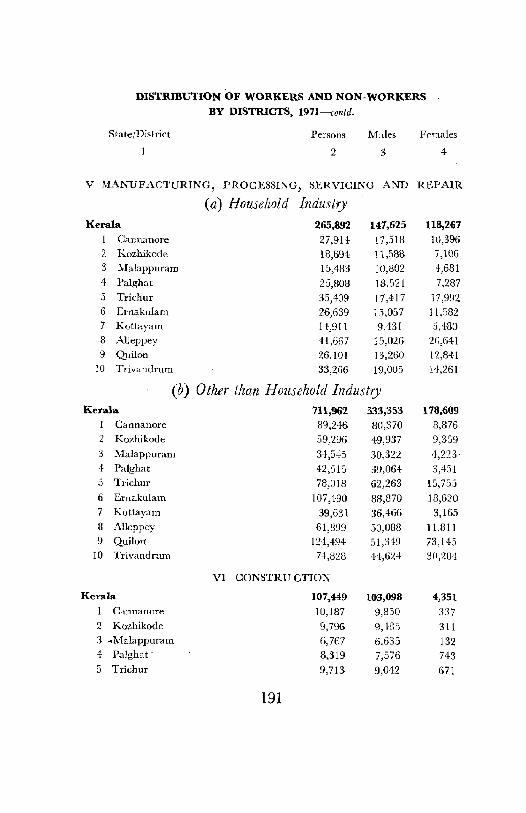
DISTRIBUTION OF WORKERS AND NON-WORKERS BY DISTRICTS, 1971-contd.
State/District Persons Males P"males
2 3 4
V MANUFACTURING, PROCESSING, SERVICING AND REPAIR
(a) Household Industry Kerala 265,892 141,625 118,267
Cannanore 27,914 17,518 10,396 2 Kozhikode 18,&94 11,588 7,106 3 ~falappuram 15,483 10,802 4,681 4 Palghat 25,808 18,521 7,287 5 Trichur 35,409 11,417 17,992 6 Ernakulam 26,639 15,057 11,582 7 Kottayam 14,911 9.431 5,480 8 AIJeppey 4[,6n7 15,026 26,641 9 Quilon 26,101 13,260 12,841
10 Trivamlrum 33,266 19,005 14,261
(b) Other than Household Industry Kerala 711,962 533,353 178,609
Cannanore 89,246 80,370 8,876 2 Kozhikode 59,296 49.937 9,359 3 :t-.laJappuram 34,545 30,322 4,223 4 Palghat 42,515 39,064 3,451 5 Trichur 78,018 62,263 15,755 6 Ernakulam 107,490 83,870 18,620 7 Kottayam 39,631 36,466 3,165 8 Alleppey 61,899 50,088 11,811 9 Quilorr 124,494 51,3+9 73,145
10 Trivandrum 74,B:28 44,6:24 30,:W4
VI CONSTRU CTION
Kerala 107,449 103,098 4,351 1 Cannanore 10,187 9,850 337 2 Kozhikode 9,796 9,4Wi 311 3 1Malappuram 6,767 6,635 132 4 Palghat· 8,319 7,576 743 5 Trichur 9,713 9,042 671
191

DISTRIBUTION OF WORKERS AND NON-WORKE RS BY DISTRICTS, 1971~co"td.
State/District Persons l\1ales Female;;
2 3 4
6 ErnakuIam 25,300 24,148 1,152 7 Kottayam 9,160 8,978 182 8 Alleppey 9,273 3,923 350 9 QuiIon 8,840 8,752 88
10 Trivandrum 10,094 9,709 385
VII TRADE A~D COM:\1ERCE
Kerala 565,648 536,887 28,761 Cannanore 70,934 67,479 3,455
2 Kozhikode 70.527 69,492 1,035 3 ?.falappuram 43,790 43,151 639 ~} Palghat 42,054 39,779 2,275 .3 Trichur 61,131 58,285 2,846 5 Ernakulam 71,710 67,497 4,213 7 Kottayam 43,568 41,640 1,928 8 Alleppey 57,970 55,Hi7 2,503 9 QuiIon 51,446 48,901 2,545
10 Trivandrum 52,518 45,196 7,322
VIII TRANSPORT, STORAGE AND COMMUNICATIONS
Kerala 242,089 227,576 14,513 CannanGre 21,188 19,179 2,009
2 Kozhikode 32,478 30,378 2,100 3 l\falappuram 17,201 16,899 302 4- FaIghat 16,735 16,223 512 .3 Trichur 24,198 21,565 2,633 6 Ernakulam 46405 43,665 2,740 7 Kottayam 16,009 15,452 557 8 AUeppey 24,112 23,215 897 9 Quilon 20,489 19,981 508
10 Trivandrum 23,274 2~,OI9 2,255
192

DISTRmUTION OF WORKERS AND NON-WORKERS BY DISTRICTS, 1971-condd.
State/District Persons Males Females
2 3 4
IX OTHER SERVICES
Kerala 843,927 596,936 246,991 Cannanore 79,042 60,1 13 13,929
:' Kozhikod" 79,891 60,804 19,087
3 MalappUl':lm 60,875 47,135 13,740 4 Palghat 57,942 40,104 17,838
5 Trichur 80,271 49,858 30,413
6 Ernakulam 112,417 76,093 35,324
7 Kottayam 74,962 50,026 24,936
3 Al1epp'y 90,533 63,315 27,218
9 Quilon 86,275 62,193 24,082
10 Trivandrum 121,719 87,295 34,424
X TOTAL NON-WORKERS
Kerala 15,130,916 5,823,269 9,307,647 1 Cannanore 1,650,571 633,451 1,017,120
2 Kozhikoc'JII 1,5~,313 590,279 949,034 3 Malappuram 1,3 3,718 503,100 850,618 4 Palghat 1,080,517 417,48& 663,029 5 Trichu:r;. 1,525,246 595,174 930,072 6 Ernakulam 1,6!J5,925 659,633 1,036,292 7 Kottayam 1,465,521 56:;,583 904,938 8 Alleppey 1,527,254 596,021 931,233 9 Quilon 1,722,538 670,761 1,051,777
10 Trivandrum 1,570,313 596,779 973,534
193 1:)-·1 Census/Keralaj73


Pad No. CJ CO.NFIDENTfAL CENSUS OF INDIA 197.
1NJ)1V11)\lAJ.. 5L1P
Loc-atiOQ Code .. ... (
Namt __ ------~------------Relationship to bead = ________ _
3 s •• 0 r--[J
[] • Age ______ _
r--. 50 Marital Sla'us ______________ _;_' _J
, For currently married women only:
(a) Agif at marriage ______ _
r--' (bl My chikl brun in t~e Jail one feu ___ I_J
(7 ! (8) Place of blrlh ___________ __
r-, (b) RurallUrban ! I
(c) Districl r-r-""1 l-+-~
(d) Stale!Counuy _________ L_J_J
~a) Place of la~1 resiroktll:e _______ _
II
12 Literacy L ~Lor 0)
13 Edurolional level
r--r--: ---------''------- '- --..!.._-..!
I< Mo'\ne:r tongue
15 Olher languages
Housebold Nc.
16 ~!AIN ACTIVITY
! ,;, Wo,k" (oj Broad ., (C. AL, UHI, OW)
c.attgQrt (ii) Non"''.\Q'rkf'.z: ·(f!,ST,R,D.B,I,O)
(b) PlAee of work (Nune(lfVillage,Town) _______ _ I (cJ N_ofE,tabl;,b"'cn' _________ _
I!i! (\_) Natw:eo{ too~t.y, Trade. :1 Ptoreaioo or SCrvic:e ________ _
-----------r-,--,--___ ~ __________ : l _ _L_j ((') Des.eriptio-n of work ____________ _
(f\ CIa>o 0' we'ker _________ D
(e) Descriptio=1 of work, _________ _
________________ [~f1CJ
(f) CIa;s:> of worker
195

CENSUS OF INDIA, 1971
PUBLICATION PROGRAMME
[CENS"CS REPORTS FOR KERALA STATE ARE PUBLISHED UNDER SERIES-9]
A Portra;t of population --- a descriptive analysis
PART I-A First Part of the General Repart
PART I-B
PART I-C
PART II-A PART Il-B
PART H·C (i)
PART II-C (ii)
PART II-D
PART III PART IV
PART y
PART VI-A
PART VI-B PART VI-C
PART VIII-A
PAl-a VIII-B
PART IX PART X
PART A & B
PART C
Second Part of the General Repart
Subsidiary Tables General Population Tables (A-Series)
Ecanomic Tables (B-Series)
Distribution of Population-~J\10ther Tangue. Religion, Scheduled Caste, and Scheduled Tribes
Other Soci~.l and Cultural Tables and Fertility Tables, Ta'Jles on Household Comoosition, Single Year Age, Marital Status, Educational Levels, Scheduled Castes and Scheduled Tribes, etc.
Migration Tables
Report and Tables on Establishments
Housiilg Report and Tables
Special Tables and Ethnographic Xotes on ScheJuled Castes and Scheduled Tribes
Town Directory
Special Survey Reports on Selected Towns Sun'ey Reports on Selected Villages
Administration ReFortEnumerati()n
Administration Report-Tabulation
State Census Atlas
Districl Census Handbooks
l I ~
J
Not for sale--for official uSt' only.
Village and Town Directory and Village and Townwise Primary Census Abstract
Analytical Report, Administrative Statements and District Census Tables
ALL-INDIA PUBLICATIONS
Volumes similar to those indicated a!_;ove are being published at the a!lIndia level. Apart from these, aU-India Census Tables on I per cent sample basis being Part II (Spl.) and a Special RepOIt on Graduate ai,d Teehnieal Personnel being Part VII are also being published_
197 MGIPCBE-S7-1 Cemus Kerala/73-26-2-74-1000 Boolc;.


