16
A Practical Approach to Assigning Credibility for Group Medical Insurance Pricing December 2015

A Practical Approach to Assigning Credibility for Group Medical Insurance Pricing
December 2015
A Practical Approach to Assigning Credibility for Group Medical Insurance Pricing
Caveat and Disclaimer The opinions expressed and conclusions reached by the authors are their own and do not represent any official position or opinion of the Society of Actuaries or its members. The Society of Actuaries makes no representation or warranty to the accuracy of the information.
Copyright ©2015 All rights reserved by the Society of Actuaries
SPONSOR Health Section Research Committee
AUTHOR
Charles Fuhrer

3
© 2015 Society of Actuaries
A PRACTICAL APPROACH TO ASSIGNING CREDIBILITY FOR GROUP MEDICAL INSURANCE PRICING
SECTION I Introduction The Group Medical Insurance Environment This paper focuses on credibility when used in the underwriting and pricing of group medical insurance. In this report, group medical refers to broad comprehensive major medical coverage that reimburses the insured for practically all necessary health-related services, subject only to a very high payment limit and modest member cost-sharing in the form of copays, deductibles, and coinsurance. Readers are expected to have some familiarity with this coverage. Some common features of group medical insurance and the market environment are: 1. The insurance coverage is written with premium rates guaranteed for a period of
time that is usually one year. 2. Groups usually consist of employees of a single company, a governmental unit, or
members of a union. In general, group membership is based on the employer- employee relationship, and eligible dependents of the employees typically are covered. Although there may be some covered individuals who are added or leave the group, generally the majority will maintain coverage throughout the contract year and persist over several years.
3. Healthy individuals tend to remain that way from one year to the next, and they incur few claims. Many illnesses tend to last more than one year.
4. Insurance coverage is written without individual health underwriting. 5. The premium rates are expressed per employee and per dependent unit. Although
the insurer may base rates on the characteristics of the employees, such as their ages at the beginning of the year, the rates themselves do not vary during the year. Thus, the insurer bears the risk of enrollment changes in the employee group that occur between policy renewal dates.
6. There may be provision for retrospective experience rating, particularly on groups of more than 100 employees.
7. Insurers have a manual or tabular rating system that includes many factors. A few of those commonly used are geographic location, age, gender, industry, occupation, size of group, and the benefit plan offered.
8. Most insurers use the group's own base period claim experience in projecting the upcoming contract year claims cost and setting premium rates. The method of using this experience varies widely and depends on the size of the group. For groups in the 100- to 300-member range, the method usually involves blending the group's own experience rate with the manual rate. In general, this calculation is performed by group underwriters. They usually rely on a company’s actuarial department to supply a credibility table for the blending of rates. The table or formula for credibility should not vary by too many factors and be relatively easy to explain to group underwriters applying it.

4
© 2015 Society of Actuaries
9. Purchasers of group health insurance tend to be very knowledgeable about their members’ benefits and premium rates. They often seek quotes from multiple insurers and consider transferring coverage to secure more competitive premium rates and benefits.
10. The market for health insurance coverage is very price competitive relative to other products. Most other insurance products compete on quality considerations. Many health insurers have tried to distinguish themselves from their competitors through wellness programs, better customer service, and other offerings. Nevertheless, there is not really much difference between insurers as long as the benefit plan is the same and significant turnover in the market occurs.
11. The policyholder is usually advised by a consultant or insurance broker who has little loyalty to the insurer but may have a strong influence on the policyholder’s choice. It is often necessary for the insurer to explain and justify its rating methods to these advisers. Marketing departments of insurers are frequently involved in these communications and rating decisions. As a result, the final rates are often the result of negotiation and compromise, rather than the theoretically calculated amount. This interaction is a practical market reality that should be taken into account.
12. Competitive pressure exerts a downward price influence and reduces the amount available for profit margin in the premium rates.
13. Although most insurers will use a group's own claim and premium experience in setting rates on even smaller size groups, they may not provide experience reports to the group in a form that would be useful to a competing insurer preparing a quote.
14. Over the course of a year, the majority of covered individuals incur at least some claims.
15. The distribution of medical claims by individual has a very high variance. While the majority of members incur a relatively low annual claim amount, there is typically a small percentage that incurs an extremely high amount, thus raising the overall group average (mean). Usually, there is a significant portion of member annual claim amounts that are 10 to even 50 times the mean.
Consequences of the Group Medical Insurance Environment The following are considerations for the application of credibility in the context of the group medical insurance environment and its features outlined in the previous section: 1. Many credibility models apply to insurance products and product environments
besides group medical insurance in which claims are rare. For these products, it is important to model claim frequency rates. In group medical insurance, however, most individuals have claims, even if the claim amounts are small. Hence, a reasonable simplifying assumption is that all individuals have claims (some of which have an amount of $0).
2. Individuals within a group who have high claims in one year will tend to have higher claims in the succeeding year. Thus, there is a significant amount of information concerning the health status (propensity to incur health claims) levels of individuals within the group just by knowing their prior year’s claim total. The credibility formula needs to recognize this. Therefore, the credibility of even a group of one member is significant because the level of that person’s claims reflects their health status. Another consequence of this tendency is that groups with a stable population will

5
© 2015 Society of Actuaries
have greater credibility than those in which there is a higher turnover of employees, because the employees who leave the group will not have their health status affect future claims.
3. The market is competitive. Insurers that use inappropriate credibility levels could end up overpricing less expensive groups and underpricing more expensive groups. This could result in significant losses for the insurer. When the estimate of claims based on experience is significantly different from that based on manual rates, the credibility can have a significant effect on the rates quoted to a group. Premium rate competition results in each insurer tending to insure those groups for which they have the lowest rates among the insurance companies competing for the group’s business. To the extent that those mispricing situations result from poorly designed credibility tables, the insurer’s profitability may suffer. For example, suppose an insurer ignored group-specific claims experience entirely. That insurer would tend to attract groups with higher-than-manual claims experience, as those groups would be quoted lower premium rates by that insurer as compared to other insurers that consider actual claims experience. If that higher experience correctly predicted higher future claims rates for those groups, then that insurer would have rates for those groups that are insufficient to cover the claims. The cumulative effect of this depends on a number of intangible factors that influence the selection of insurance carriers by each group. Nevertheless, since price is a major factor in an efficient market, an insurance company that assigns credibility less accurately than its competitors will tend to price incorrectly and thereby result in losses.
Section II – Basic Credibility Formula Proposed and Variations
The Basic Formula by Size of Group Using a least squares credibility model, it can be shown that the credibility z for one
year of experience should be 3
21
11
1
kn
knkz
. See the References in Appendix 1 for
a derivation of this formula. In terms of applying the formula, the following are descriptions of each parameter: n is the number of individuals in the group. k1 is the credibility of a group consisting of one individual. It is equal to the regression coefficient of an individual’s claims in the current year based on the prior year. It is relatively easy to estimate this value based on two years of claim data. The value of k1 is typically around 25%. In other words, healthy people with no claims in a year will have an average amount of claims at 75% of the mean of all individuals in the succeeding year. Less healthy individuals with claims at twice the mean of all individuals in a year can be expected to have claims at 125% of the mean in the succeeding year. This can be illustrated with a simple example as shown in Appendix II. k2 is the regression coefficient of claims for individuals in the current year based on the claims of others in the same group in the prior year. This factor is difficult to estimate

6
© 2015 Society of Actuaries
from data. Even if the data consists of a large number of groups, with data from two successive years, it will be sensitive to outliers that have an unusual pattern such as very low claims in one year and very high in the other. One easy way to address this problem is to just set k2 = k3 so the credibility eventually approaches 1.0 as the group size becomes very large. k3 is a measure of how the claims of each individual are related to others within the same group. It is a measure of how the in-group variance is less than the total variance of individual claims. It is easier to derive a value from data for k3 than k2, but it is still difficult. See Appendix I for a reference on this calculation. Values are probably between 0.5% and 2%. We will use 1% in the rest of this paper. Using the parameter values described above, we have the following formula:
01.011
01.0125.0
n
nz

7
© 2015 Society of Actuaries
Applying this formula to various group sizes results in the following table of basic credibility by size of group:
k 1= 0.25
k 2=k 3= 0.01
n z
1 25.0%
5 27.9%
10 31.2%
25 39.5%
50 49.7%
75 56.9%
100 62.3%
150 69.9%
200 74.9%
250 78.5%
500 87.5%
750 91.2%
1,000 93.2%
1,500 95.3%
2,000 96.4%
2,500 97.1%
BASIC CREDIBILITY
BY SIZE OF GROUP
TABLE I
Examples
There are nine example groups used in this section Group A - Small group with 27 members all of whom are the same age and sex.
Group B - Same small group with 27 members half of whom are 60-year old females and the other half are 20-year old males.
Group C - Same small group 27 members with a realistic distribution of ages and sexes.
Group D - Medium size group with 106 members all of whom are the same age and sex.
Group E - Same medium sized group with 106 members half of whom are 60-year old females and the other half are 20-year old males.
Group F - Same medium sized group 106 members with a realistic distribution of ages and sexes.
Group G - Large size group with 775 members all of whom are the same age and sex.
Group H - Same large sized group with 775 members half of whom are 60-year old females and the other half are 20-year old males.
Group I - Same large sized group 775 members with a realistic distribution of ages and sexes.
8
© 2015 Society of Actuaries
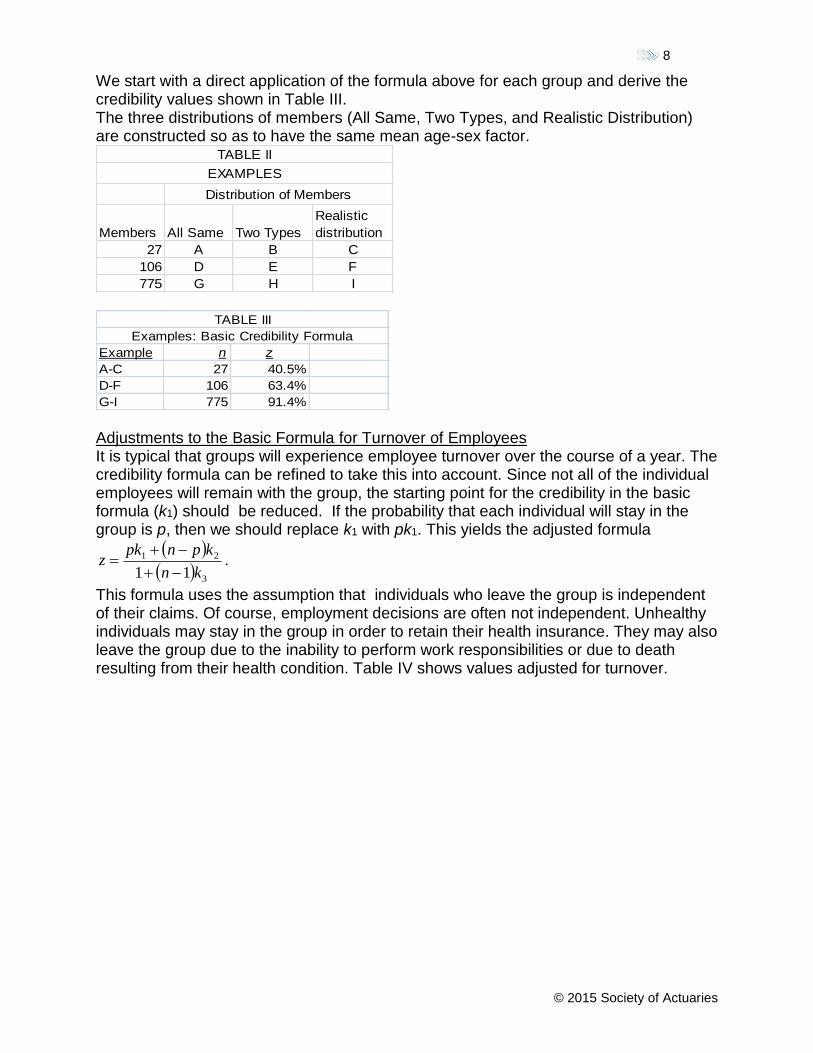
We start with a direct application of the formula above for each group and derive the credibility values shown in Table III. The three distributions of members (All Same, Two Types, and Realistic Distribution) are constructed so as to have the same mean age-sex factor.
Members All Same Two Types
Realistic
distribution
27 A B C
106 D E F
775 G H I
EXAMPLES
Distribution of Members
TABLE II
Example n z
A-C 27 40.5%
D-F 106 63.4%
G-I 775 91.4%
Examples: Basic Credibility Formula
TABLE III
Adjustments to the Basic Formula for Turnover of Employees It is typical that groups will experience employee turnover over the course of a year. The credibility formula can be refined to take this into account. Since not all of the individual employees will remain with the group, the starting point for the credibility in the basic formula (k1) should be reduced. If the probability that each individual will stay in the group is p, then we should replace k1 with pk1. This yields the adjusted formula
3
21
11 kn
kpnpkz
.
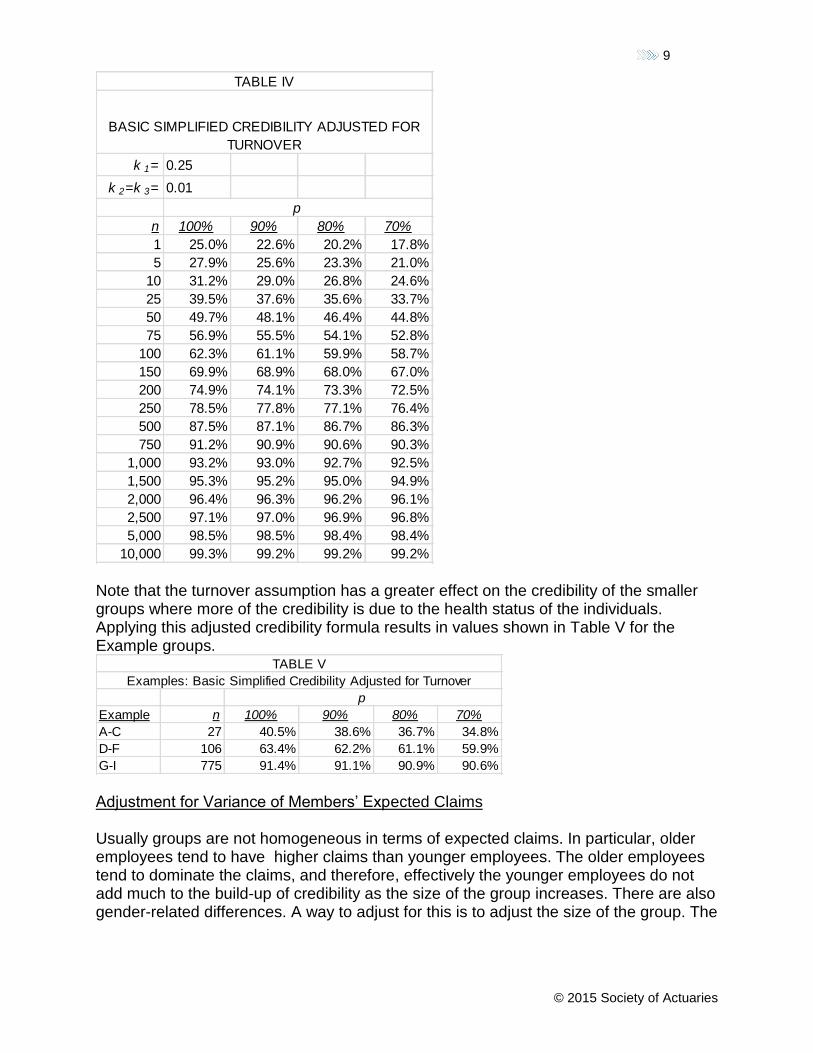
This formula uses the assumption that individuals who leave the group is independent of their claims. Of course, employment decisions are often not independent. Unhealthy individuals may stay in the group in order to retain their health insurance. They may also leave the group due to the inability to perform work responsibilities or due to death resulting from their health condition. Table IV shows values adjusted for turnover.
9
© 2015 Society of Actuaries
k 1= 0.25
k 2=k 3= 0.01
n 100% 90% 80% 70%
1 25.0% 22.6% 20.2% 17.8%
5 27.9% 25.6% 23.3% 21.0%
10 31.2% 29.0% 26.8% 24.6%
25 39.5% 37.6% 35.6% 33.7%
50 49.7% 48.1% 46.4% 44.8%
75 56.9% 55.5% 54.1% 52.8%
100 62.3% 61.1% 59.9% 58.7%
150 69.9% 68.9% 68.0% 67.0%
200 74.9% 74.1% 73.3% 72.5%
250 78.5% 77.8% 77.1% 76.4%
500 87.5% 87.1% 86.7% 86.3%
750 91.2% 90.9% 90.6% 90.3%
1,000 93.2% 93.0% 92.7% 92.5%
1,500 95.3% 95.2% 95.0% 94.9%
2,000 96.4% 96.3% 96.2% 96.1%
2,500 97.1% 97.0% 96.9% 96.8%
5,000 98.5% 98.5% 98.4% 98.4%
10,000 99.3% 99.2% 99.2% 99.2%
TABLE IV
BASIC SIMPLIFIED CREDIBILITY ADJUSTED FOR
TURNOVER
p
Note that the turnover assumption has a greater effect on the credibility of the smaller groups where more of the credibility is due to the health status of the individuals. Applying this adjusted credibility formula results in values shown in Table V for the Example groups.
Example n 100% 90% 80% 70%
A-C 27 40.5% 38.6% 36.7% 34.8%
D-F 106 63.4% 62.2% 61.1% 59.9%
G-I 775 91.4% 91.1% 90.9% 90.6%
p
TABLE V
Examples: Basic Simplified Credibility Adjusted for Turnover
Adjustment for Variance of Members’ Expected Claims Usually groups are not homogeneous in terms of expected claims. In particular, older employees tend to have higher claims than younger employees. The older employees tend to dominate the claims, and therefore, effectively the younger employees do not add much to the build-up of credibility as the size of the group increases. There are also gender-related differences. A way to adjust for this is to adjust the size of the group. The

10
© 2015 Society of Actuaries
adjusted size
22
2
nn where is the mean of the age-sex factors in the
group and 2 is their variance. Table VI illustrates these values.
Example n σ2 μ
Adjustment
Factor n' 100% 90% 80% 70%
A 27 0.0000 1.2 1.0000 27.0 40.5% 38.5% 36.6% 34.7%
B 27 0.6031 1.2 0.7048 19.0 36.5% 34.4% 32.3% 30.3%
C 27 0.3551 1.2 0.8022 21.7 37.8% 35.8% 33.8% 31.8%
D 106 0.0000 1.2 1.0000 106.0 63.4% 62.2% 61.0% 59.8%
E 106 0.6031 1.2 0.7048 74.7 56.8% 55.4% 54.0% 52.6%
F 106 0.3551 1.2 0.8022 85.0 59.2% 57.9% 56.6% 55.2%
G 775 0.0000 1.2 1.0000 775.0 91.4% 91.1% 90.8% 90.6%
H 775 0.6031 1.2 0.7048 546.2 88.4% 88.0% 87.6% 87.2%
I 775 0.3551 1.2 0.8022 621.7 89.6% 89.2% 88.9% 88.6%
p
Examples: Credibility Adjusted for Member Expected Claim Variance
TABLE VI
Section III – More Advanced Topics
Pooling Points or Limits on Individual Claim Amounts
The credibility of the claim projection can be increased by limiting the amount of claims that would be counted for the underlying experience of each individual. This limit is usually called the pooling point. As the pooling point is decreased, at first the predictability increases due to the reduction in the variance of underlying claims. With further reductions in the pooling point, a threshold is reached where so much of the claim data is being ignored that further reductions in the pooling point lead to a decrease in the credibility. Therefore, there is an optimum pooling point. This optimum point increases with group size because the relative variance of the total claims decreases with group size. Note that the projection of claims should be increased by the expected amounts over the pooling point so as not to systematically understate the projections.
Despite lack of data to support any conclusion, the curve of credibility by size is likely relatively flat, so that moderate differences from the optimum point have little effect on the predictability. Nevertheless, the use of pooling at some point is significantly better
than not using pooling at all. A good rule of thumb is that the pooling point should be between 5% and 15% of projected annual claims.

11
© 2015 Society of Actuaries
Specific or Individual Stop Loss A type of group medical coverage written with a very high deductible amount ($50,000 or more), is called specific or individual stop-loss insurance. The deductible amount is called the specific attachment point. Its usual purpose is to protect an employer's self-insured medical plan from the fluctuation due to large claims. Generally, insurers rate this product in one of two different ways. The first method uses tabular rates that take into account age, sex, industry, specific level, etc. In this method the group's own experience is ignored. The second method applies a percentage, which varies only by the specific level, to the group's estimated total claims. These two methods can lead to significantly different results, and there is some controversy as to which is superior. The credibility model above can be used to yield a blend of the two methods. The weight given to the second method using the group’s total claims will be called z (credibility). Using this method, it can be shown that k2<k3 so that the credibility approaches a smaller level than 100% for very large groups. Using our previous assumptions, the ratio s=k2/k3 is 1.00 when the attachment point is equal to 0, as the stop-loss claims are the same as all of the claims. s then would decrease as the attachment point increases. There is no recent study that has estimated the appropriate values for s. Nevertheless, the author recommends an assumption such as s reduces by 10% for each $50,000 increase in attachment point. Table VIII illustrates the resulting values.
k 1= 0.25
k 2= sk 3
k 3= 0.01
s= 100% - 10%*(Attachment Point)/$50,000
n $0 $50,000 $100,000 $150,000 $200,000 $250,000 $300,000
1 25.0% 25.0% 25.0% 25.0% 25.0% 25.0% 25.0%
5 27.9% 27.5% 27.1% 26.7% 26.3% 26.0% 25.6%
10 31.2% 30.4% 29.5% 28.7% 27.9% 27.1% 26.2%
25 39.5% 37.6% 35.6% 33.7% 31.8% 29.8% 27.9%
50 49.7% 46.4% 43.1% 39.8% 36.5% 33.2% 29.9%
75 56.9% 52.6% 48.4% 44.1% 39.9% 35.6% 31.4%
100 62.3% 57.3% 52.4% 47.4% 42.4% 37.4% 32.5%
150 69.9% 63.9% 57.9% 51.9% 45.9% 40.0% 34.0%
200 74.9% 68.3% 61.6% 54.9% 48.3% 41.6% 35.0%
250 78.5% 71.4% 64.2% 57.1% 50.0% 42.8% 35.7%
500 87.5% 79.1% 70.8% 62.5% 54.2% 45.8% 37.5%
750 91.2% 82.3% 73.5% 64.7% 55.9% 47.1% 38.2%
1000 93.2% 84.1% 75.0% 65.9% 56.8% 47.7% 38.6%
1500 95.3% 85.9% 76.6% 67.2% 57.8% 48.4% 39.1%
2000 96.4% 86.9% 77.4% 67.9% 58.3% 48.8% 39.3%
2500 97.1% 87.5% 77.9% 68.3% 58.7% 49.0% 39.4%
5000 98.5% 88.7% 78.9% 69.1% 59.3% 49.5% 39.7%
10000 99.3% 89.4% 79.5% 69.6% 59.7% 49.8% 39.9%
Attachment Points
TABLE VIII
Stop-Loss Credibilty with Basic (Unadjusted Formula)
12
© 2015 Society of Actuaries
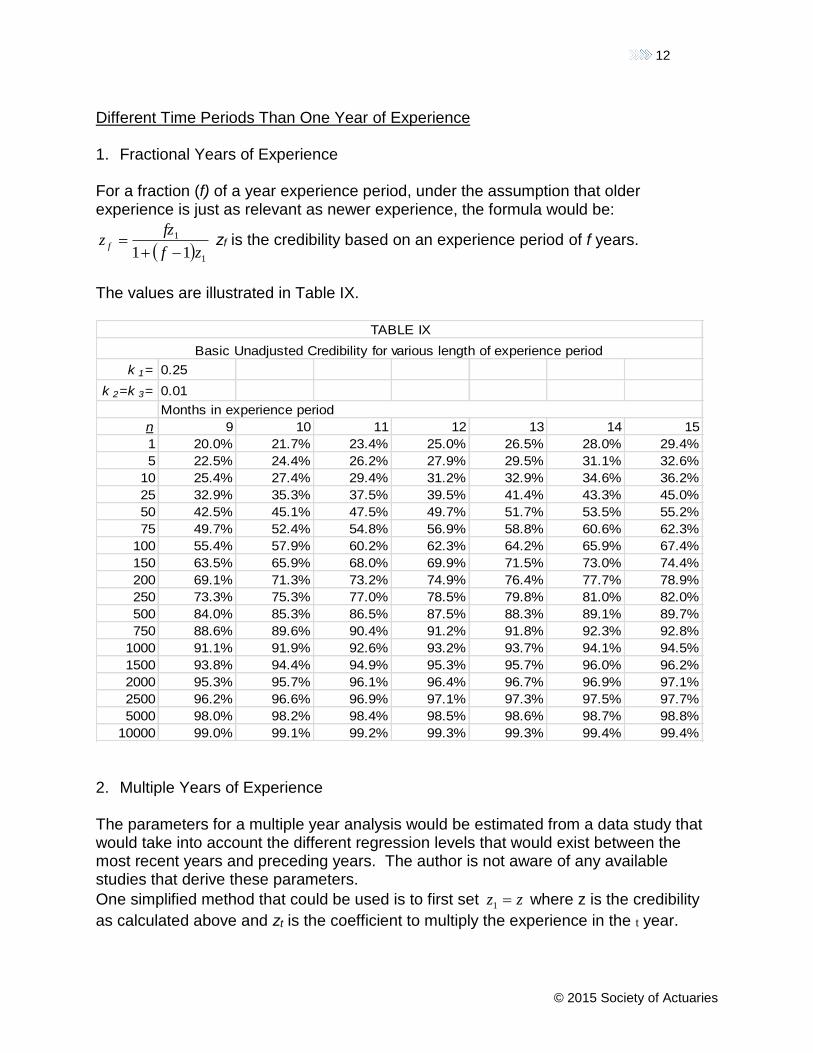
Different Time Periods Than One Year of Experience 1. Fractional Years of Experience
For a fraction (f) of a year experience period, under the assumption that older experience is just as relevant as newer experience, the formula would be:
1
1
11 zf
fzz f
zf is the credibility based on an experience period of f years.
The values are illustrated in Table IX.
k 1= 0.25
k 2=k 3= 0.01
n 9 10 11 12 13 14 15
1 20.0% 21.7% 23.4% 25.0% 26.5% 28.0% 29.4%
5 22.5% 24.4% 26.2% 27.9% 29.5% 31.1% 32.6%
10 25.4% 27.4% 29.4% 31.2% 32.9% 34.6% 36.2%
25 32.9% 35.3% 37.5% 39.5% 41.4% 43.3% 45.0%
50 42.5% 45.1% 47.5% 49.7% 51.7% 53.5% 55.2%
75 49.7% 52.4% 54.8% 56.9% 58.8% 60.6% 62.3%
100 55.4% 57.9% 60.2% 62.3% 64.2% 65.9% 67.4%
150 63.5% 65.9% 68.0% 69.9% 71.5% 73.0% 74.4%
200 69.1% 71.3% 73.2% 74.9% 76.4% 77.7% 78.9%
250 73.3% 75.3% 77.0% 78.5% 79.8% 81.0% 82.0%
500 84.0% 85.3% 86.5% 87.5% 88.3% 89.1% 89.7%
750 88.6% 89.6% 90.4% 91.2% 91.8% 92.3% 92.8%
1000 91.1% 91.9% 92.6% 93.2% 93.7% 94.1% 94.5%
1500 93.8% 94.4% 94.9% 95.3% 95.7% 96.0% 96.2%
2000 95.3% 95.7% 96.1% 96.4% 96.7% 96.9% 97.1%
2500 96.2% 96.6% 96.9% 97.1% 97.3% 97.5% 97.7%
5000 98.0% 98.2% 98.4% 98.5% 98.6% 98.7% 98.8%
10000 99.0% 99.1% 99.2% 99.3% 99.3% 99.4% 99.4%
TABLE IX
Basic Unadjusted Credibility for various length of experience period
Months in experience period
2. Multiple Years of Experience The parameters for a multiple year analysis would be estimated from a data study that would take into account the different regression levels that would exist between the most recent years and preceding years. The author is not aware of any available studies that derive these parameters.
One simplified method that could be used is to first set zz 1 where z is the credibility
as calculated above and zt is the coefficient to multiply the experience in the t year.

13
© 2015 Society of Actuaries
Where t=1 for the most recent year, 2 for the preceding year, etc. Then set
1
1
1
1
t
t
r
rt zzz for each t>1. Resulting values are illustrated in Table X.
k 1= 0.25
k 2=k 3= 0.01
n\Year: 1 2 3 1 2 3
1 25.0% 18.8% 10.5% 25.0% 43.8% 54.3%
5 27.9% 20.1% 10.5% 27.9% 48.0% 58.5%
10 31.2% 21.5% 10.2% 31.2% 52.7% 62.8%
25 39.5% 23.9% 8.7% 39.5% 63.4% 72.2%
50 49.7% 25.0% 6.3% 49.7% 74.7% 81.0%
75 56.9% 24.5% 4.6% 56.9% 81.4% 86.0%
100 62.3% 23.5% 3.3% 62.3% 85.8% 89.1%
150 69.9% 21.0% 1.9% 69.9% 90.9% 92.8%
200 74.9% 18.8% 1.2% 74.9% 93.7% 94.9%
250 78.5% 16.9% 0.8% 78.5% 95.4% 96.2%
500 87.5% 11.0% 0.2% 87.5% 98.4% 98.6%
750 91.2% 8.1% 0.1% 91.2% 99.2% 99.3%
1000 93.2% 6.4% 0.0% 93.2% 99.5% 99.6%
1500 95.3% 4.5% 0.0% 95.3% 99.8% 99.8%
2000 96.4% 3.4% 0.0% 96.4% 99.9% 99.9%
2500 97.1% 2.8% 0.0% 97.1% 99.9% 99.9%
5000 98.5% 1.4% 0.0% 98.5% 100.0% 100.0%
10000 99.3% 0.7% 0.0% 99.3% 100.0% 100.0%
Coefficents Total Credibilty
Coefficients and Credibility for Multiple Years Based on Basic Unadjusted Credibility
TABLE X
14
© 2015 Society of Actuaries
Appendix I References
The formulas in the paper were all derived in:
Fuhrer, Charles “Some Applications of Credibility Theory to Group Insurance”
Transactions Society of Actuaries XL, part 1 (1988): 387-404.
http://www.soa.org/library/research/transactions-of-society-of-
actuaries/1988/january/tsa88v40pt112.pdf
A discussion and presentation of some formulas to estimate all of the parameters, particularly k3,
presented at an SOA meeting:
Fuhrer, Charles “Credibility Theory” Record of the Society of Actuaries XIX, 1B (1993):
863-881.
http://www.soa.org/library/proceedings/record-of-the-society-of-actuaries/1990-
99/1993/january/rsa93v19n1b21.aspx
Methodology explained in chapter 12 pages 218-220 of:
Herzog, Thomas N. Introduction to Credibility Theory, 4th Edition, 2010 ACTEX
Publications
This book also contrasts the credibility methodology used here versus the limited fluctuation
methodology.

15
© 2015 Society of Actuaries
Appendix II - Example of Parameter k1 Estimation
The parameter k1, is the credibility of a 1-life group, assuming that that person is covered for the
whole experience year. The derivation used a simple linear regression technique (that is it
minimizes the least squared error). We know from linear regression that the regression
coefficient, for X2 estimated from X1, is equal to 1
21
Var
,Cov
X
XX. This will tend to be around 25%
reflecting the fact that most health claims are spread over many years.
Here is an example claim listing that illustrates the calculation:
This claim listing consists claims for 20 individuals over 2 years. Claim Listing
Year
# 1 2
1 $0 $0
2 $0 $5,000
3 $0 $5,000
4 $0 $5,000
5 $5,000 $0
6 $5,000 $0
7 $5,000 $0
8 $5,000 $5,000
9 $5,000 $5,000
10 $5,000 $5,000
11 $5,000 $5,000
12 $5,000 $5,000
13 $5,000 $5,000
14 $5,000 $10,000
15 $5,000 $10,000
16 $5,000 $10,000
17 $10,000 $5,000
18 $10,000 $5,000
19 $10,000 $5,000
20 $10,000 $10,000
Sum $100,000 $100,000
Mean $5,000 $5,000
Variance 10,000,000 10,000,000
Covariance 2,500,000 K1 =Credibility z=Cov/Var 25.0%
Counts by Amount

16
© 2015 Society of Actuaries
Amount # Year 1 # Year 2
$0 4 4
$5,000 12 12
$10,000 4 4
Tot 20 20
Analysis
Counts From To: $0 $5,000 $10,000
Tot Claims /person cred (z) z*(Year 1)+(1-z)*Mean
$0 1 3 0 $15,000 $3,750 25.0% $3,750
$5,000 3 6 3 $60,000 $5,000 $5,000
$10,000 0 3 1 $25,000 $6,250 25.0% $6,250
Transition Probabilities From To: $0 $5,000 $10,000
$0 25% 75% 0%
$5,000 25% 50% 25%
$10,000 0% 75% 25%


