A Practical Process Mineralogy Approach to Advancing the Flowsheet for the Kamoa Project MEI Flotation ’15, Cape Town, November 16-19, 2015 Elizabeth Whiteman 1,2 Norman O. Lotter 1 Steve Amos 3 1 XPS Consulting & Testwork Services 2 Corresponding Author 3 Ivanhoe Mines Ltd. November 18, 2015
Transcript
A Practical Process Mineralogy Approach to Advancing the Flowsheet for the Kamoa Project
MEI Flotation ’15, Cape Town, November 16-19, 2015
– Describe the use a Process Mineralogy centric methodology as a valid predictive tool in flowsheet design
••
•
•
Complex ore bodies can undergo many stages of empirical flotation testing Mineralogical data is used in this methodology to eliminate multiple stages of empirical testing and focus on requirements of the ore By focusing on ore requirements, we have removed inherent limitations in flotation equipment i.e. building flowsheet around Denver cell for example Flowsheet design and simulation is based entirely on mineralogical measurement data collected from simple kinetic flotation test
•Objective 2:
– Demonstrate the use of this methodology in advancing and improving the Kamoa Flowsheet as a case study
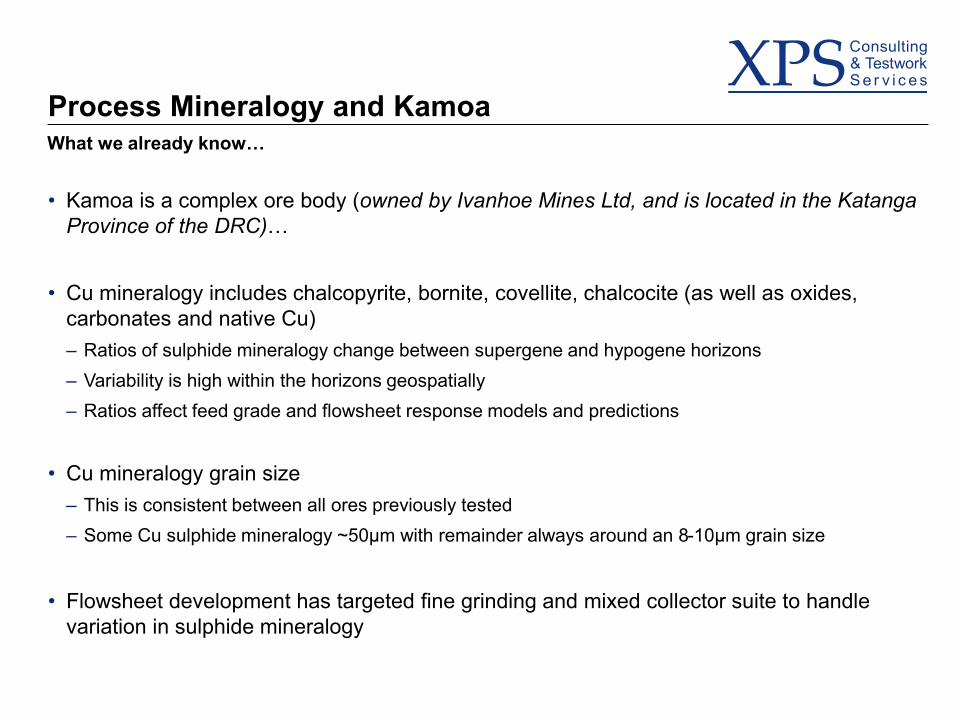
Process Mineralogy and Kamoa What we already know…
•Kamoa is a complex ore body (owned by Ivanhoe Mines Ltd, and is located in the Katanga Province of the DRC)…
•Cu mineralogy includes chalcopyrite, bornite, covellite, chalcocite (as well as oxides, carbonates and native Cu) –––
Ratios of sulphide mineralogy change between supergene and hypogene horizons Variability is high within the horizons geospatially Ratios affect feed grade and flowsheet response models and predictions
•Cu mineralogy grain size ––
This is consistent between all ores previously tested Some Cu sulphide mineralogy ~50µm with remainder always around an 8-10µm grain size
•Flowsheet development has targeted fine grinding and mixed collector suite to handle variation in sulphide mineralogy
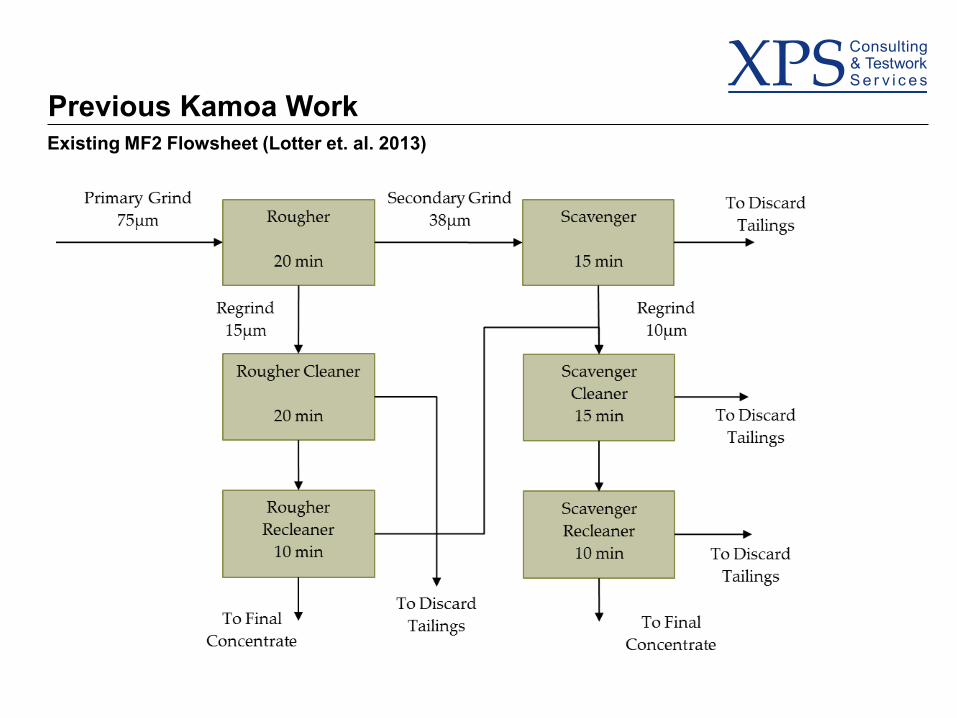
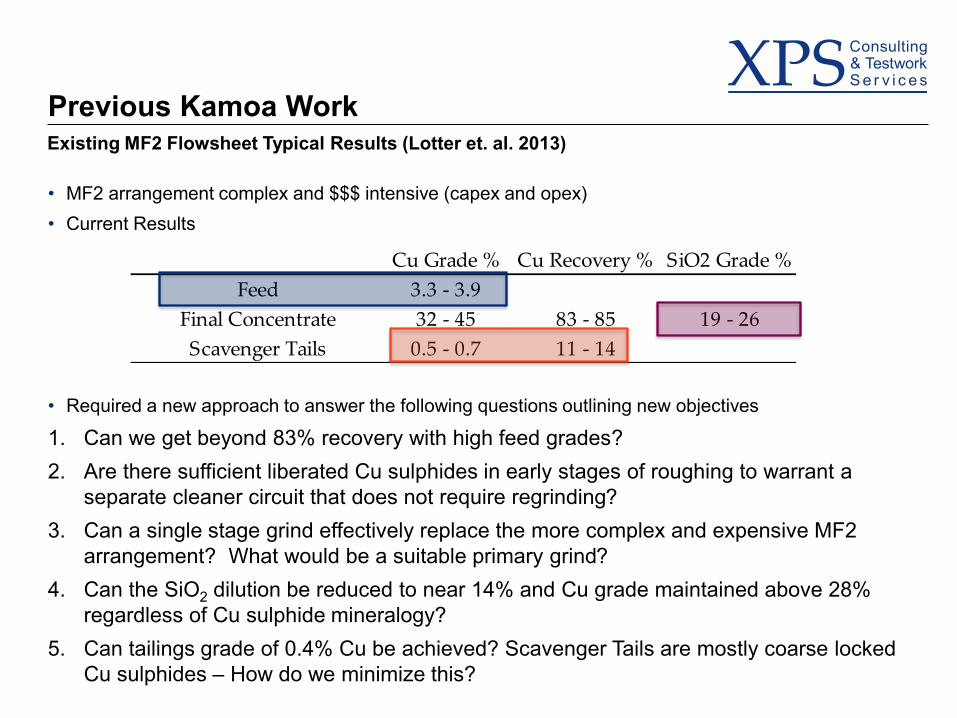
Previous Kamoa Work Existing MF2 Flowsheet (Lotter et. al. 2013)
• MF2 arrangement complex and $$$ intensive (capex and opex) • Current Results
Cu Grade % Cu Recovery % SiO2 Grade %
Feed 3.3 - 3.9
Final Concentrate 32 - 45 83 - 85 19 - 26
Scavenger Tails 0.5 - 0.7 11 - 14
• Required a new approach to answer the following questions outlining new objectives
1. Can we get beyond 83% recovery with high feed grades? 2. Are there sufficient liberated Cu sulphides in early stages of roughing to warrant a
separate cleaner circuit that does not require regrinding? 3. Can a single stage grind effectively replace the more complex and expensive MF2
arrangement? What would be a suitable primary grind? 4. Can the SiO2 dilution be reduced to near 14% and Cu grade maintained above 28%
regardless of Cu sulphide mineralogy? 5. Can tailings grade of 0.4% Cu be achieved? Scavenger Tails are mostly coarse locked
Cu sulphides – How do we minimize this?
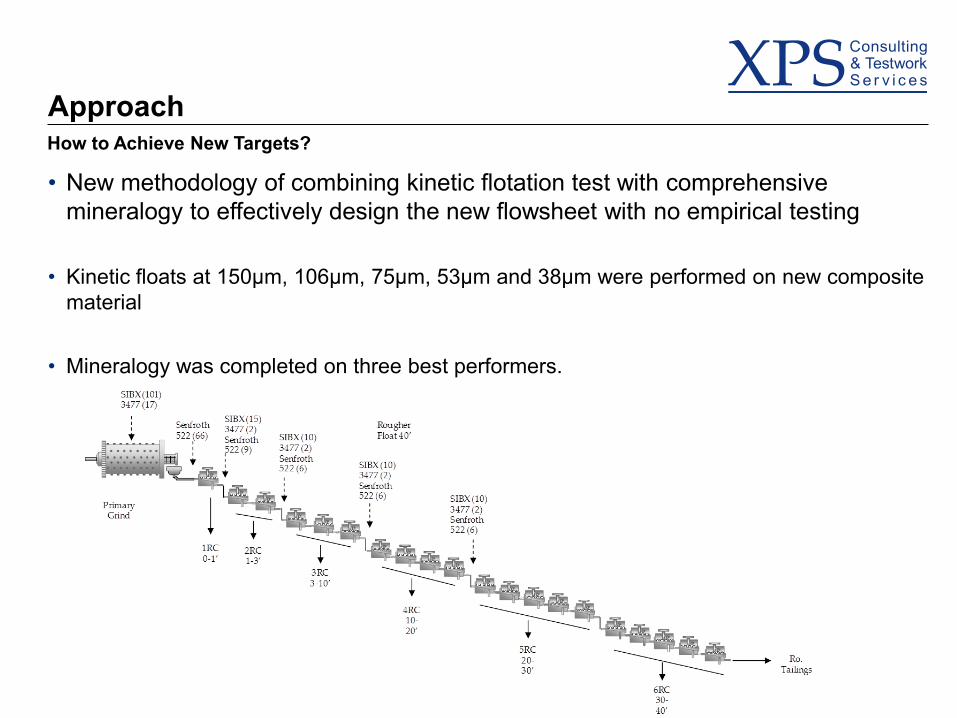
Approach How to Achieve New Targets?
•New methodology of combining kinetic flotation test with comprehensive mineralogy to effectively design the new flowsheet with no empirical testing
•Kinetic floats at 150µm, 106µm, 75µm, 53µm and 38µm were performed on new composite material
•Mineralogy was completed on three best performers.
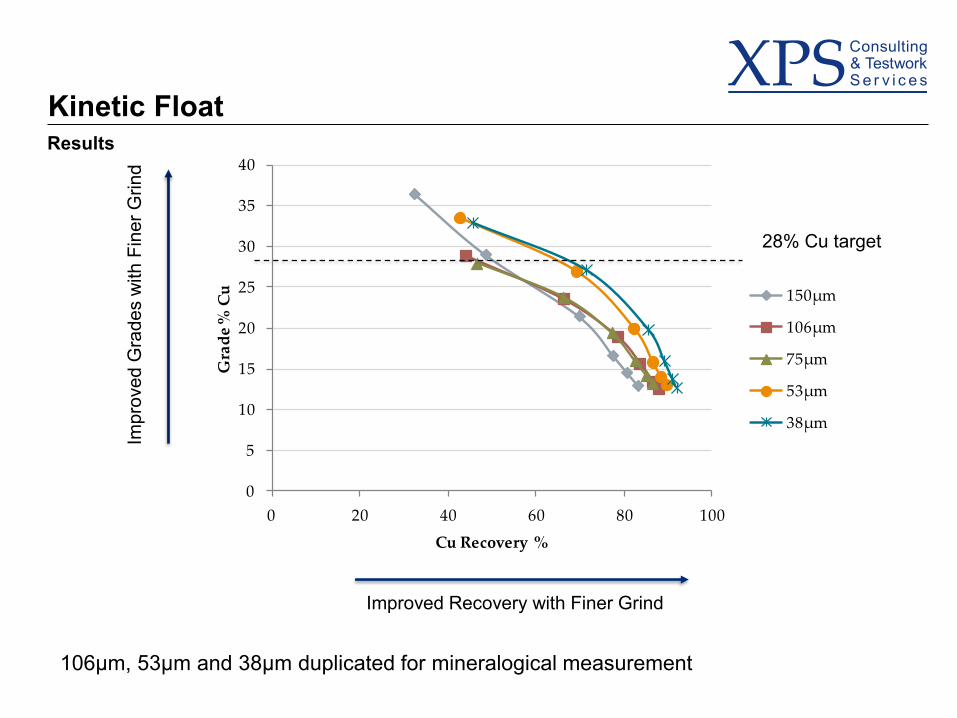
Kinetic Float Results
0
5
10
15
20
25
30
35
40
0 20 40 60 80 100
Gra
de
% C
u
Cu Recovery %
150µm
106µm
75µm
53µm
38µm
Grin
d in
er
F hitw
Gra
des
ed
prov
mI
28% Cu target
Improved Recovery with Finer Grind
106µm, 53µm and 38µm duplicated for mineralogical measurement
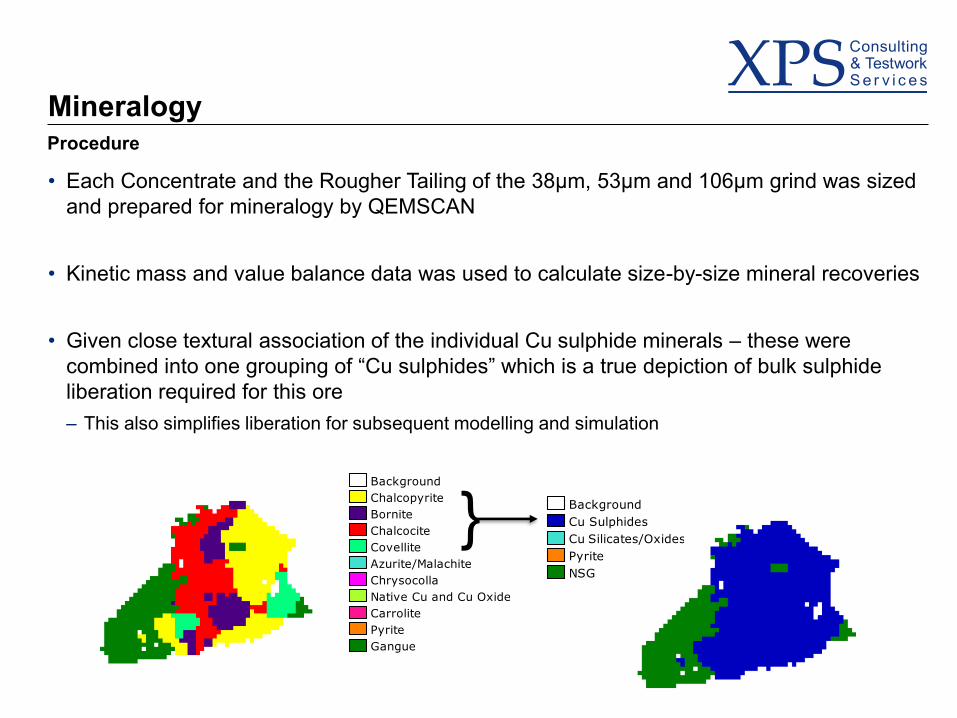
Mineralogy Procedure
•Each Concentrate and the Rougher Tailing of the 38µm, 53µm and 106µm grind was sized and prepared for mineralogy by QEMSCAN
•Kinetic mass and value balance data was used to calculate size-by-size mineral recoveries
•Given close textural association of the individual Cu sulphide minerals – these were combined into one grouping of “Cu sulphides” which is a true depiction of bulk sulphide liberation required for this ore –This also simplifies liberation for subsequent modelling and simulation
Background
Chalcopyrite
Bornite
Chalcocite
Covellite
Azurite/Malachite
Chrysocolla
Native Cu and Cu Oxide
Carrolite
Pyrite
Gangue
} Background
Cu Sulphides
Cu Silicates/Oxides
Pyrite
NSG
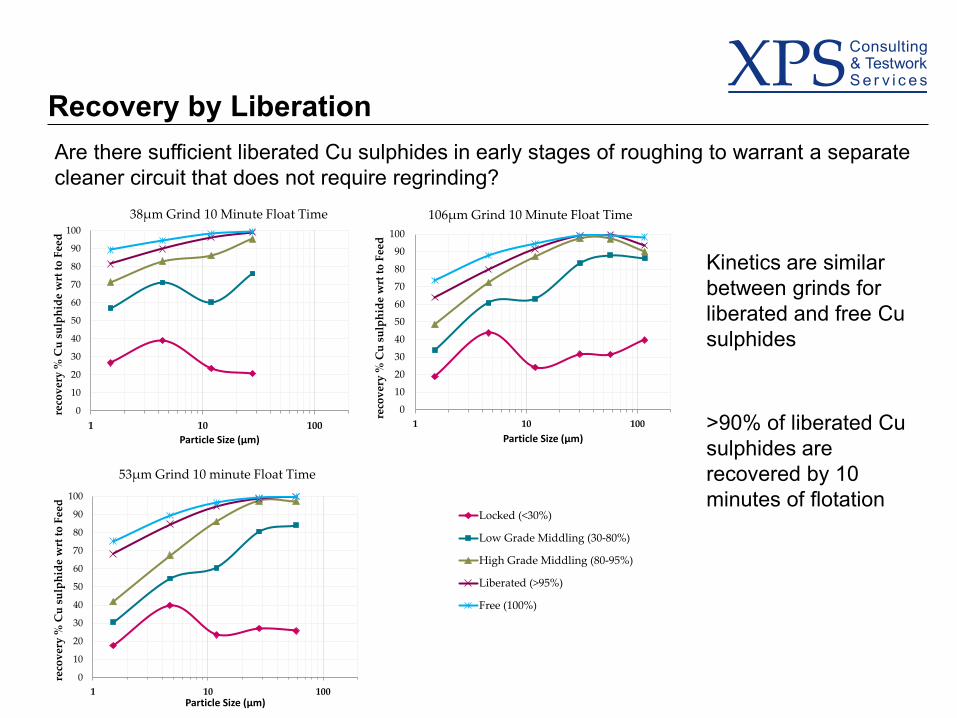
Recovery by Liberation Are there sufficient liberated Cu sulphides in early stages of roughing to warrant a separate cleaner circuit that does not require regrinding?
0
10
20
30
40
50
60
70
80
90
100
1 10 100
reco
ver
y %
Cu
su
lph
ide
wrt
to
Fee
d
Particle Size (µm)
38µm Grind 10 Minute Float Time
0
10
20
30
40
50
60
70
80
90
100
1 10 100
reco
ver
y %
Cu
su
lph
ide
wrt
to
Fee
d
Particle Size (µm)
53µm Grind 10 minute Float Time
0
10
20
30
40
50
60
70
80
90
100
1 10 100
reco
ver
y %
Cu
su
lph
ide
wrt
to
Fee
d
Particle Size (µm)
106µm Grind 10 Minute Float Time
Locked (<30%)
Low Grade Middling (30-80%)
High Grade Middling (80-95%)
Liberated (>95%)
Free (100%)
Kinetics are similar between grinds for liberated and free Cu sulphides
>90% of liberated Cu sulphides are recovered by 10 minutes of flotation
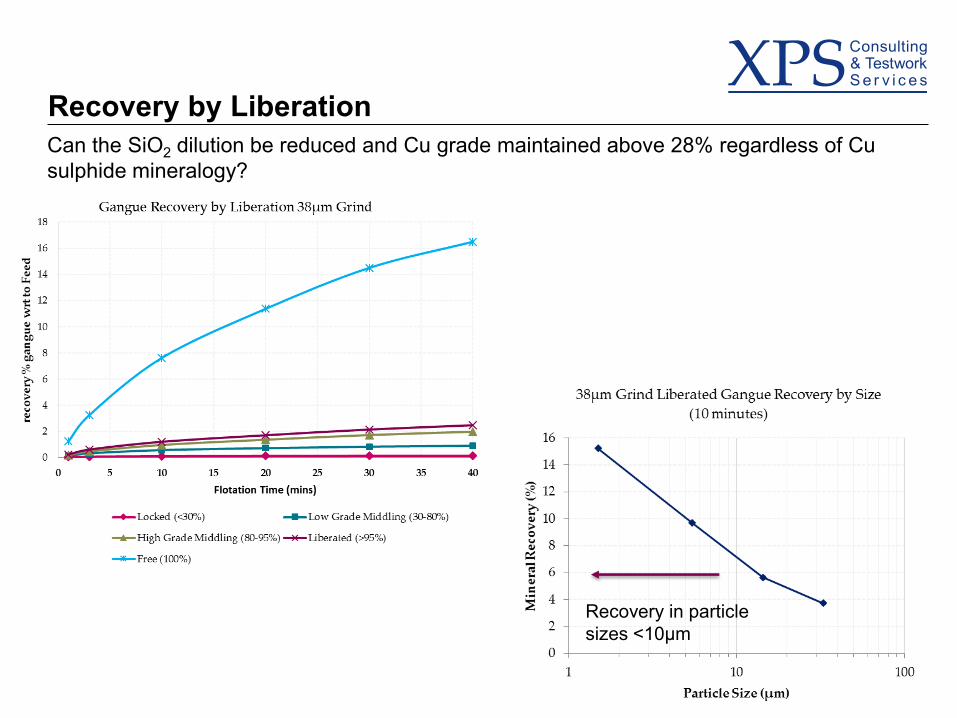
Recovery by Liberation Can the SiO2 dilution be reduced and Cu grade maintained above 28% regardless of Cu sulphide mineralogy?
Recovery in particle sizes <10µm
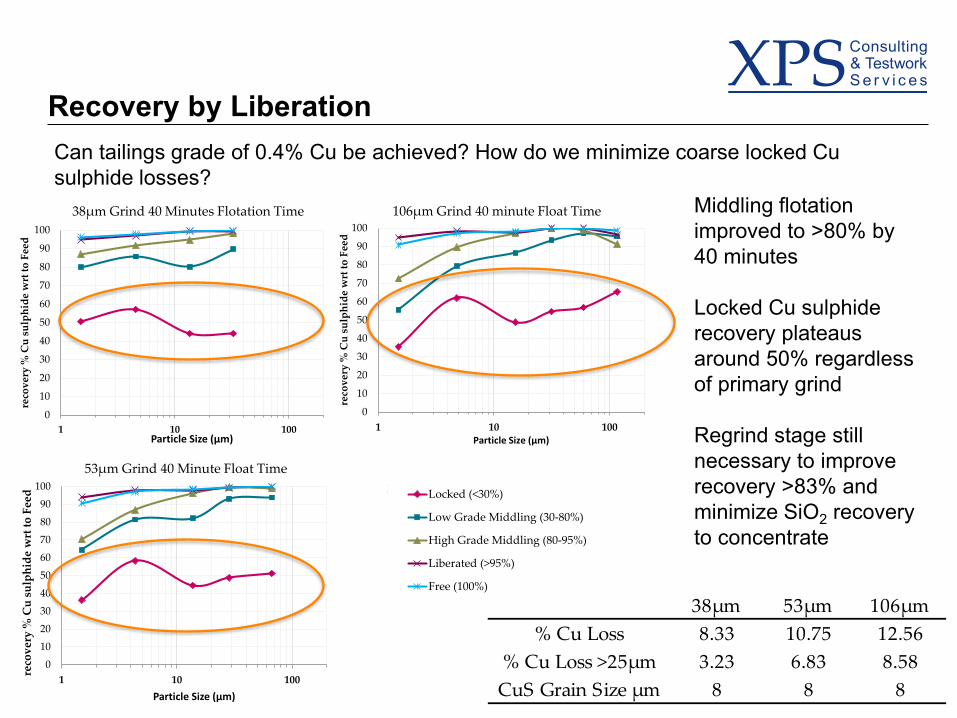
Recovery by Liberation Can tailings grade of 0.4% Cu be achieved? How do we minimize coarse locked Cu sulphide losses?
0
10
20
30
40
50
60
70
80
90
100
1 10 100
reco
ver
y %
Cu
su
lph
ide
wrt
to
Fee
d
Particle Size (µm)
38µm Grind 40 Minutes Flotation Time
0
10
20
30
40
50
60
70
80
90
100
1 10 100
reco
ver
y %
Cu
su
lph
ide
wrt
to
Fee
d
Particle Size (µm)
53µm Grind 40 Minute Float Time
0
10
20
30
40
50
60
70
80
90
100
1 10 100
reco
ver
y %
Cu
su
lph
ide
wrt
to
Fee
d
Particle Size (µm)
106µm Grind 40 minute Float Time
Locked (<30%)
Low Grade Middling (30-80%)
High Grade Middling (80-95%)
Liberated (>95%)
Free (100%)
Middling flotation improved to >80% by 40 minutes
Locked Cu sulphide recovery plateaus around 50% regardless of primary grind
Regrind stage still necessary to improve recovery >83% and minimize SiO2 recovery to concentrate
38µm 53µm 106µm
% Cu Loss 8.33 10.75 12.56
% Cu Loss >25µm 3.23 6.83 8.58
CuS Grain Size µm 8 8 8
Flowsheet Simulation Options
•Simulations completed on mineralogical dataset
•Liberation data suggests a bypass without the need for regrinding is possible –Simulation looks at 3 minute and 10 minute bypass concentrate
•Can tailings grade of 0.4% Cu be achieved? How do we minimize coarse locked Cu sulphide losses? –Finer primary grinding than 38µm not economical –Simulation assesses scalping of coarse particles for reprocessing and subsequent tailings grade
•Can the SiO2 dilution be reduced to near 14%? – Simulation assesses SiO2 recovery by liberation and particle size and models bypass concentrate
cleaning potential
•Can a single stage grind effectively replace the more complex and expensive MF2 arrangement? What would be a suitable primary grind –Simulation assesses all of the above options at the 3 grinds of 106µm, 53µm and 38µm
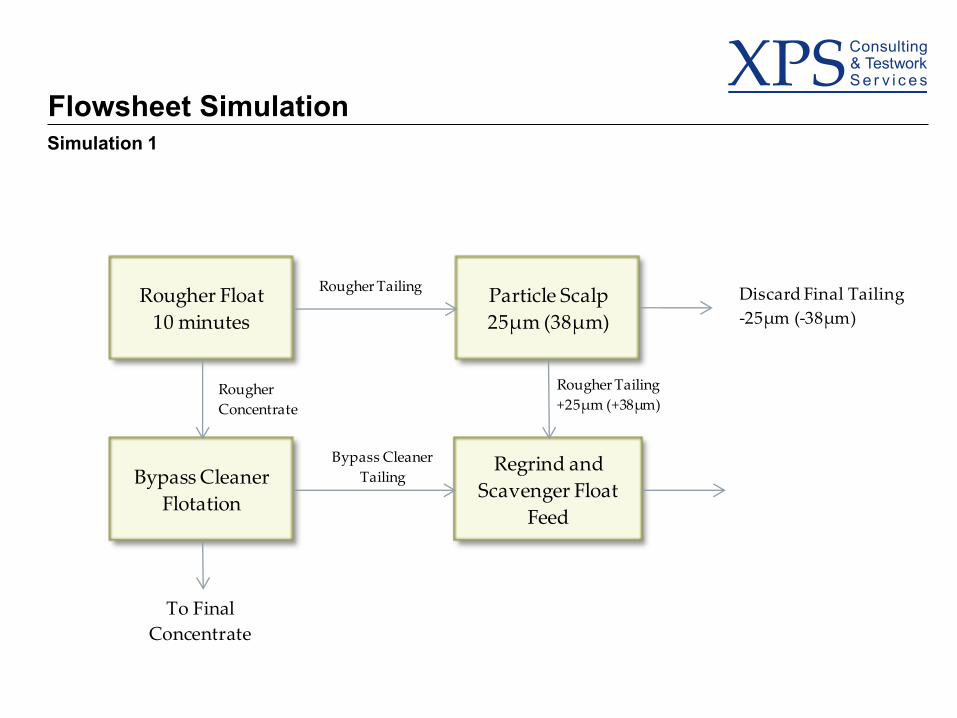
Flowsheet Simulation Simulation 1
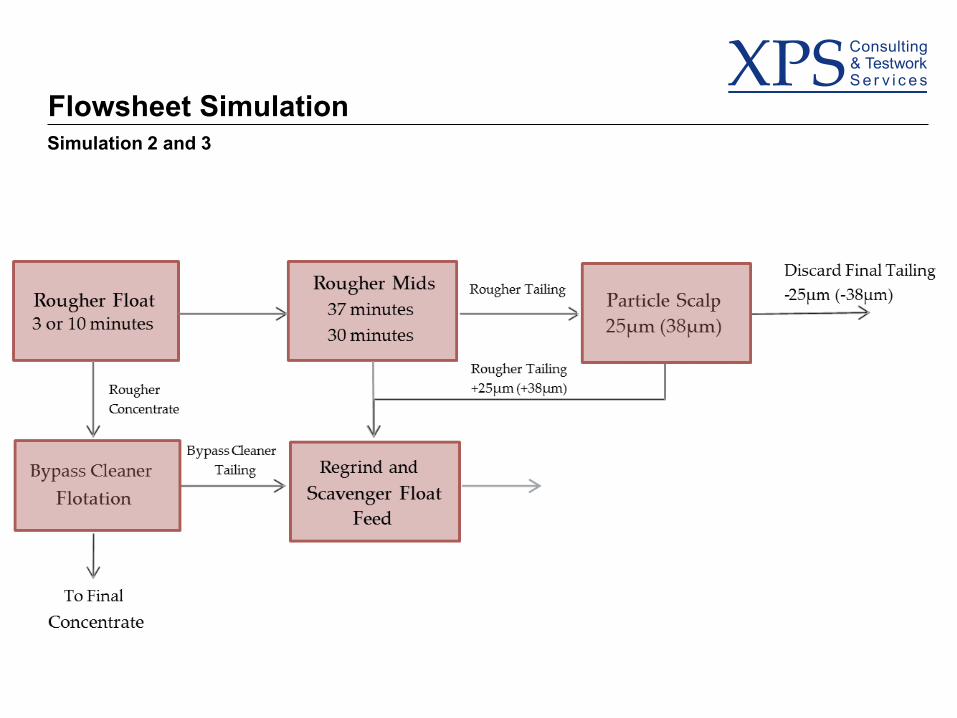
Rougher Tailing Discard Final Tailing
-25µm (-38µm)
Rougher
Concentrate
To Final
Concentrate
Bypass Cleaner
Tailing
Rougher Tailing
+25µm (+38µm)
Rougher Float
10 minutes
Particle Scalp
25µm (38µm)
Bypass Cleaner
Flotation
Regrind and
Scavenger Float
Feed
Flowsheet Simulation Simulation 2 and 3
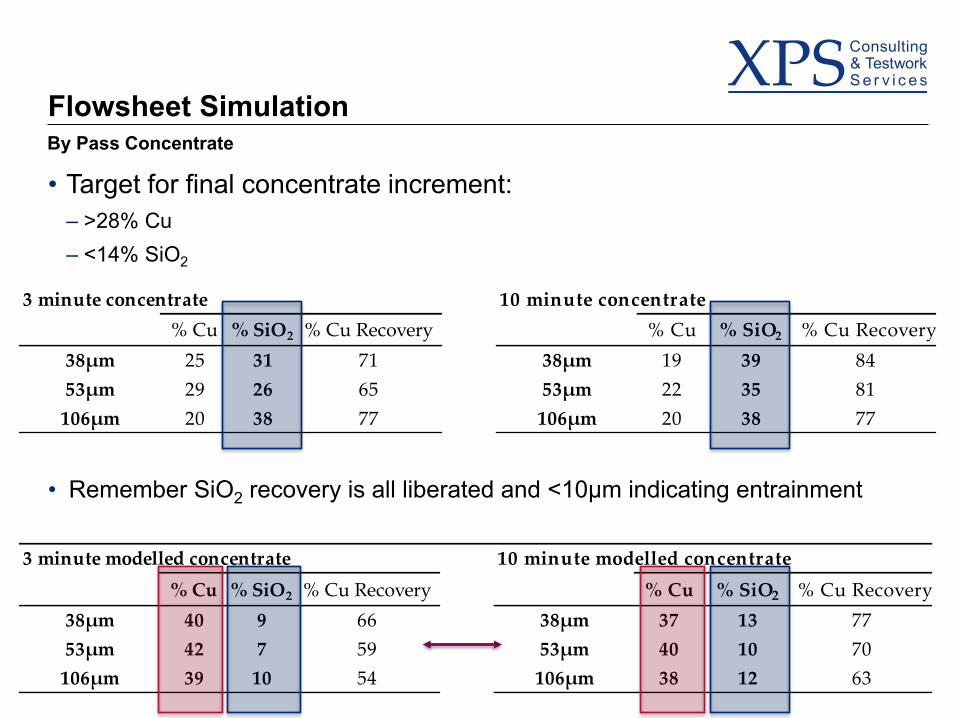
Flowsheet Simulation By Pass Concentrate
Target for final concentrate increment:>28% Cu <14% SiO2
Remember SiO2 recovery is all liberated and <10µm indicating entrainment •
•– –
3 minute concentrate
% Cu % SiO2 % Cu Recovery
38µm 25 31 71
53µm 29 26 65
106µm 20 38 77
10 minute concentrate
% Cu % SiO2 % Cu Recovery
38µm 19 39 84
53µm 22 35 81
106µm 20 38 77
3 minute modelled concentrate
% Cu % SiO2 % Cu Recovery
38µm 40 9 66
53µm 42 7 59
106µm 39 10 54
10 minute modelled concentrate
% Cu % SiO2 % Cu Recovery
38µm 37 13 77
53µm 40 10 70
106µm 38 12 63
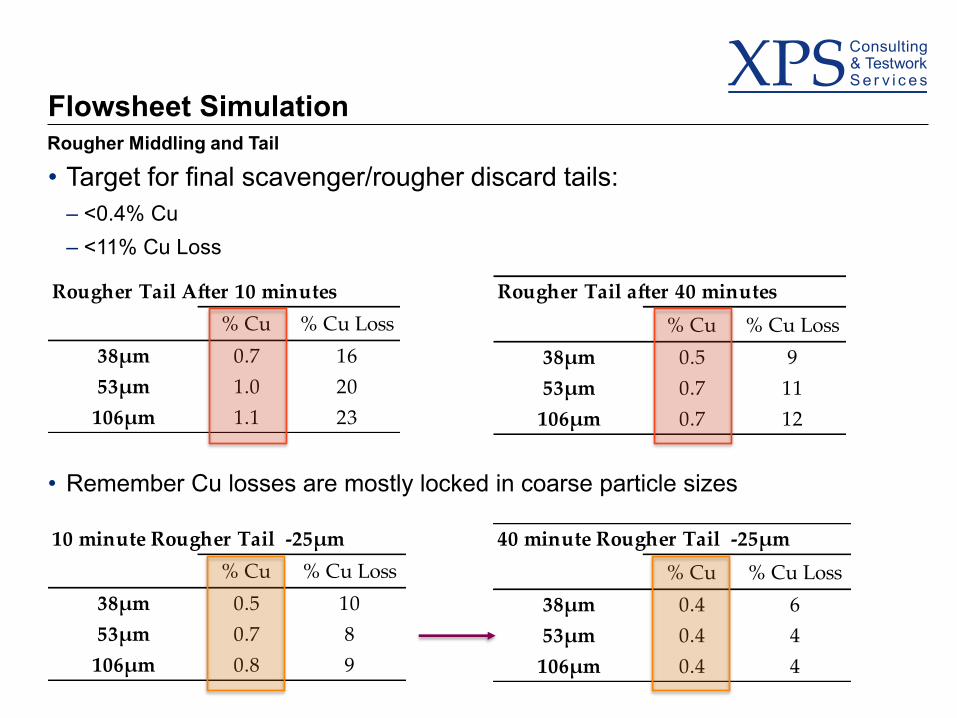
Flowsheet Simulation Rougher Middling and Tail
Target for final scavenger/rougher discard tails: <0.4% Cu <11% Cu Loss
Remember Cu losses are mostly lo cked in coarse particle sizes •
• – –
Rougher Tail after 40 minutes
% Cu % Cu Loss
38µm 0.5 9
53µm 0.7 11
106µm 0.7 12
Rougher Tail After 10 minutes
% Cu % Cu Loss
38µm 0.7 16
53µm 1.0 20
106µm 1.1 23
10 minute Rougher Tail -25µm
% Cu % Cu Loss
38µm 0.5 10
53µm 0.7 8
106µm 0.8 9
40 minute Rougher Tail -25µm
% Cu % Cu Loss
38µm 0.4 6
53µm 0.4 4
106µm 0.4 4
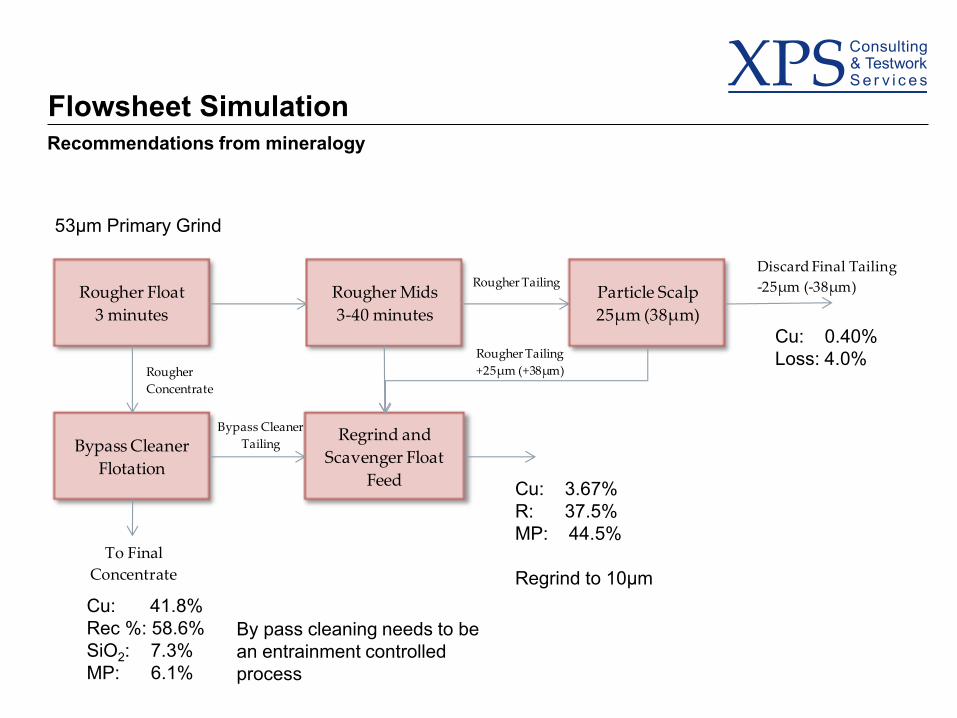
Flowsheet Simulation Recommendations from mineralogy
By pass cleaning needs to be an entrainment controlled process
Cu: 3.67%R: 37.5%MP: 44.5%
Regrind to 10µm
✓
✓
✓
✓
Flowsheet Simulation Did we achieve our project goals with this mineralogical design method?
Can we get beyond 83% recovery with high feed grades?
Is there sufficient liberated Cu sulphides in early stages of roughing to warrant a separate cleaner circuit that does not require regrinding?
Can a single stage grind effectively replace the more complex and expensive MF2 arrangement? What would be a suitable primary grind
Can tailings grade of 0.4% Cu be achieved? How do we minimize coarse locked Cu sulphide losses?
Can the SiO2 dilution be reduced?
✓
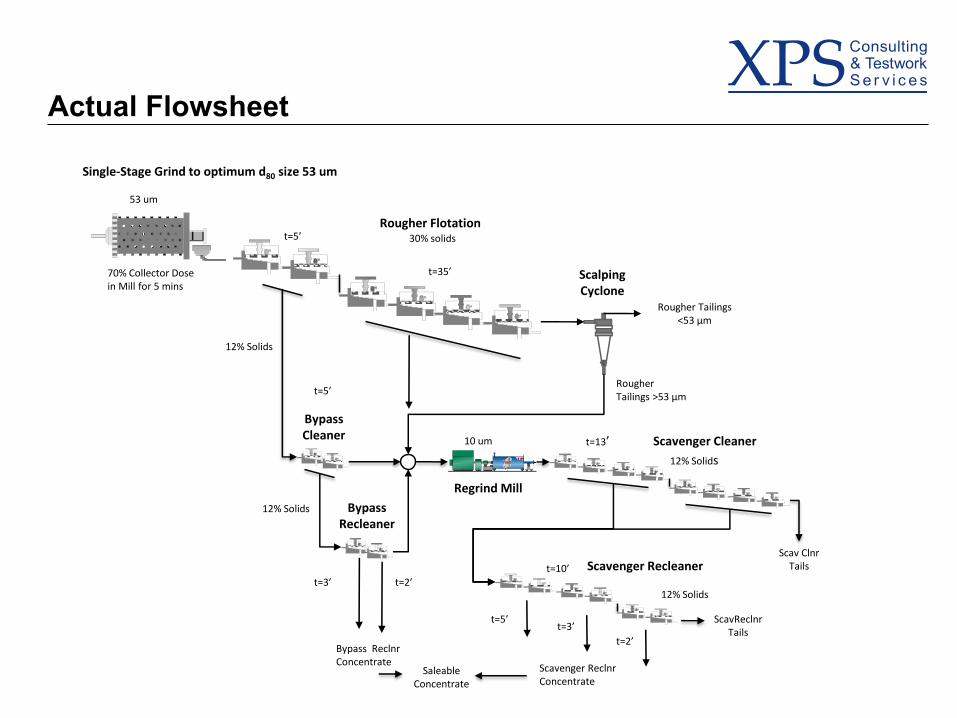
Actual Flowsheet
Single-Stage Grind to optimum d80 size 53 um
Rougher Flotationt=5’ 30% solids
Rougher Tailings <53 µm
RougherTailings >53 µm
70% Collector Dose in Mill for 5 mins
t=35’
ScavReclnrTails
Scav ClnrTails
Scavenger Cleaner
Scavenger Recleaner
Saleable Concentrate
Bypass Cleaner
Bypass Recleaner
10 um
12% Solids
12% Solids
12% Solids
12% Solids
Scavenger ReclnrConcentrate
t=13’
t=10’
ScalpingCyclone
t=5’
t=3’ t=2’
Bypass ReclnrConcentrate
t=5’
t=2’
t=3’
Regrind Mill
53 um
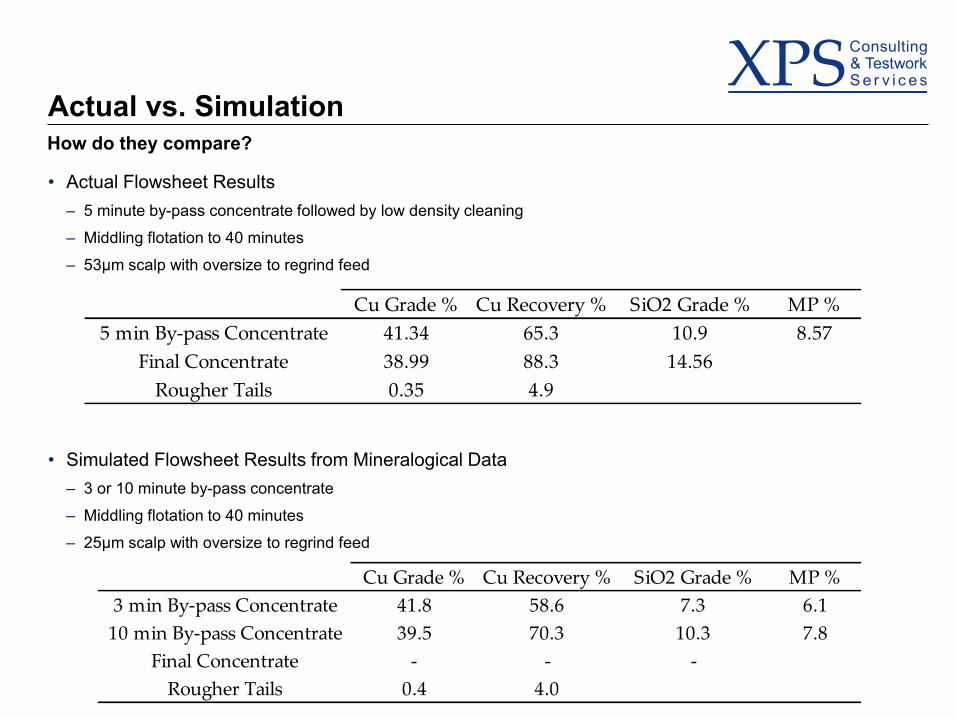
Actual vs. Simulation How do they compare?
• Actual Flowsheet Results –
–
–
5 minute by-pass concentrate followed by low density cleaning
Middling flotation to 40 minutes
53µm scalp with oversize to regrind feed
Cu Grade % Cu Recovery % SiO2 Grade % MP %
5 min By-pass Concentrate 41.34 65.3 10.9 8.57
Final Concentrate 38.99 88.3 14.56
Rougher Tails 0.35 4.9
• –
–
–
Simulated Flowsheet Results from Mineralogical Data 3 or 10 minute by-pass concentrate
Middling flotation to 40 minutes
25µm scalp with oversize to regrind feed
Cu Grade % Cu Recovery % SiO2 Grade % MP %
3 min By-pass Concentrate 41.8 58.6 7.3 6.1
10 min By-pass Concentrate 39.5 70.3 10.3 7.8
Final Concentrate - - -
Rougher Tails 0.4 4.0
Conclusions
•A simple combination of kinetic floats with size-by-size mineralogy was used
•Designed a flowsheet based on the mineralogical data and the kinetics of key minerals by particle size and liberation
•Enhanced laboratory testwork by: –
– –
Effectively replacing empirical flotation testing and accurately predicting the physical response of the ore at set target grind Removed inherent laboratory equipment limitations and identified the process required Guiding physical testing to begin at demonstration and optimization rather than discovery
•Process mineralogy can be used as a valid predictive tool in process design
Acknowledgements
• Management of XPS Consulting & Testwork Services