26
Chin-Ying Chen, Hsueh-Sheng Chang A Preliminary Study of Factors Affecting the Urban Transportation Energy Consumption of Urban Form in Taiwan

Chin-Ying Chen, Hsueh-Sheng Chang
A Preliminary Study of Factors Affecting the Urban Transportation Energy Consumption of Urban Form in Taiwan
Outline
Introduction
Development of Compact City
2
Study Area and Methodology
Analysis and Result
Conclusion

Introduction
3
Fig1. The world's energy consumption

Introduction
Energy Shortage
To view the status of the Taiwan's energy development, dependence on imported energy has reached up to 99.3% in 2007.
4
Energy Shortage
Reduce Energy Consumption
????????

Introduction
1987Rickaby(1987) discusses the relatedness among the urban formand the energy use. He discovered that no matter what kind of the urban development can save more energy consumption which compared to the original plan.
1989 The studies of Newman and Kenworthy (1989)on the relationship between urban density and transportation energy conclude that the Compact City is good for energy efficiency.
5
conclude that the Compact City is good for energy efficiency.
Breheny (1992) think that compact city would be overcrowding, lack of urban open space living environment, resulting in more energy consumption and the cost of pollution.
1992
1995 Owen (1995) mentioned that the key issue of compact city is what kind of forms of development and accessibility,as well as how flexible combination of policies, financial and other tools to make sustainable development.

Introduction
Urban PlanningUrban PlanningUrban PlanningUrban Planning
The impact of the trasportation enrgy consumption would be different with different compactnesss.And the impact would be different because the city has different the public transportation ,landuse zoning,infrustruction and so on. (Yeh kuang-yi,et al.,2003)
2003
6
Energy Shortage Reduce Energy ConsumptionUrban PlanningUrban PlanningUrban PlanningUrban Planning
QuestionQuestionQuestionQuestion::::1. What kind of urban forms in order to reduce energy
consumption to achieve sustainable development?2. How compact dose it achieve to reduce transportation energy
consumption and optimal urban development?
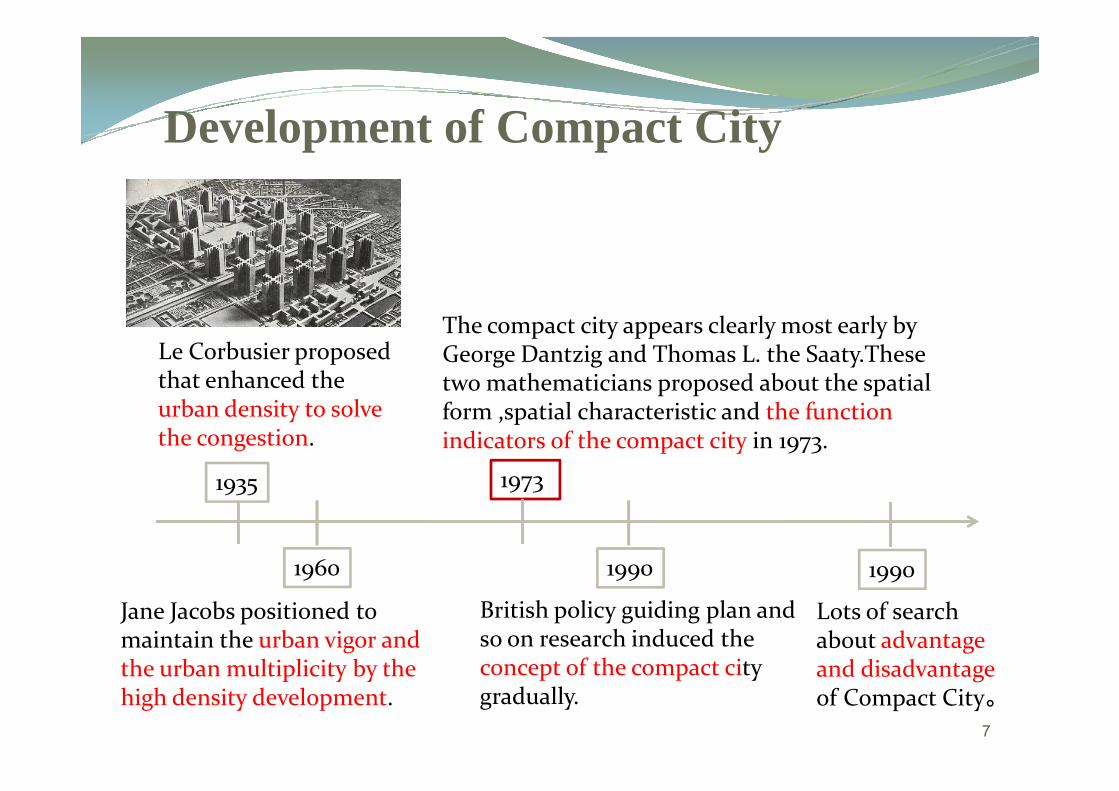
Development of Compact City
Le Corbusier proposed that enhanced the urban density to solve
The compact city appears clearly most early by George Dantzig and Thomas L. the Saaty.These two mathematicians proposed about the spatial
7
1935
urban density to solve the congestion.
British policy guiding plan and so on research induced the concept of the compact city gradually.
19901960
Jane Jacobs positioned to maintain the urban vigor and the urban multiplicity by the high density development.
1973
two mathematicians proposed about the spatial form ,spatial characteristic and the function indicators of the compact city in 1973.
Lots of search about advantage and disadvantage of Compact City。
1990

Definition of Compact City
Scholar Year Definition
Williams 1999The compact city paradigm is based on concepts of efficient land use and urban containment, but includes alongside this a number of goals and parameters.
Jenks ,Burgess 2001
He believes that the spatial characteristics should be moving in a dense continuous improvement caused by economic development, in
8
Jenks ,Burgess 2001 improvement caused by economic development, in order to achieve economic, environmental and social sustainability。
Burton 2002
He pointed out the compact city was usually described as one or other or all of three types of city, two that are related to 'product':1. the high-density city,2. the mixed-use city, 3. the intensified city, it is related to process.

� This research uses Curve Estimation analysis, carries on the examination in view of the urban form to influence of the energy use.
Methodology
Calculates various cities energy use and compactness.
9
The compactness of various cities will divide into two groups, a group for the high compactness city, and a group for the low compactness city.
Analyze the energy consumption impact belong to urban compactness and urban form.

Study Area•Taiwan is located in the Southwest part of the island, an average density of 547.79 persons/km, and total area is approximately 2016 km2.
•The study areas are 22 cities in
10
•The study areas are 22 cities in Taiwan.

Variables and IndicatorsDimension Variable Indicator
Compactness
Density•Population per hectare
•Develop household of number the land perhectare
Mix Use
•The proportion of Housing and non-housing
•Entropy
11
•Retail trade number per hectare
Energy Energy Consumption•Average each gasoline and diesel oilconsumption
Urban Form
Urban Service Function•Industry and commerce factory number
Development Degree ofTransportation
•The utilization ratio of Transportation
Information circulation •The Rate of Internet Surfer
Knowledge educationlevel
•Above 15 years old of education level structure -technical college population and above

Compactness of Taiwan Cities DevelopmentTaipei City
Hsinchu City
•There are twenty-two cities in Taiwan. The urban compactness and the average energy per person consumption, as we can see in Figure.2 and Figure.3.
•By Figure.2, the higher compactness cities mainly distributes in the north and
12
Fig.2. Urban Compactness in Taiwan
Kaohsiung City
cities mainly distributes in the north and south two main cities.

Energy Consumption of Taiwan Cities DevelopmentTaoyuan County
Hsinchu County
•By Figure.3, the higher energy consumption cities mainly distributes in the north and south two main cities.But it is not the same cities with the higher compactness cities in Figure.2.
13
Fig.3. Average Energy per person Consumption in Taiwan
Tainan County
•To compare these two figures,it appears that the higher compactness cities in Figure.2 instead is the average each person of energy use is lowest in Figure.3.

Compactness vs. Energy Consumption
EquationModel Summary Parameter Estimate
R Square F df1 df2 Sig Constant b1 b2 b3Quadratic .176 2.023 2 19 .160 .672 .000 .000
Cubic .183 1.340 3 18 .293 .761 .000 .000 .000
14

Urban Service Function vs. Energy Consumption
EquationModel Summary Parameter Estimate
R Square F df1 df2 Sig Constant b1 b2 b3
Quadratic .262 3.554 2 20 .048 .599 .000 .000
Cubic .345 3.339 3 19 .041 .476 .000 .000 .000
15
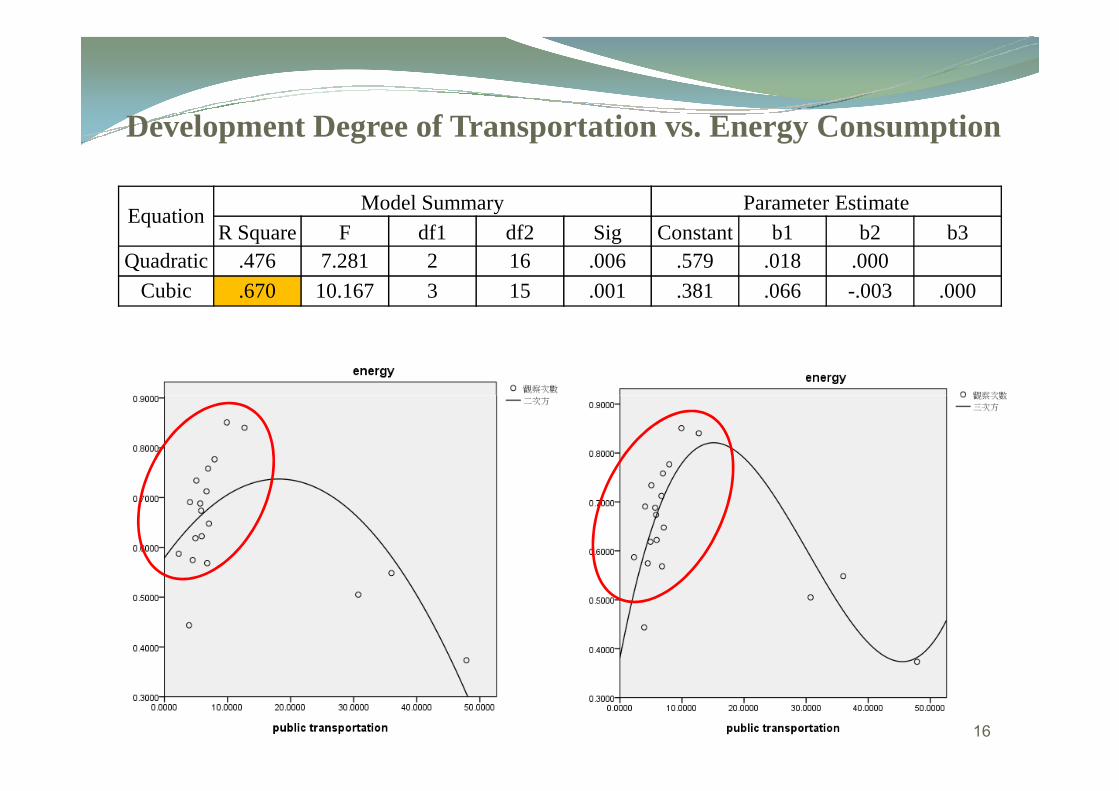
Development Degree of Transportation vs. Energy Consumption
EquationModel Summary Parameter Estimate
R Square F df1 df2 Sig Constant b1 b2 b3Quadratic .476 7.281 2 16 .006 .579 .018 .000
Cubic .670 10.167 3 15 .001 .381 .066 -.003 .000
16

Information circulation vs. Energy Consumption
EquationModel Summary Parameter Estimate
R Square F df1 df2 Sig Constant b1 b2 b3
Quadratic .010 .106 2 20 .900 .593 .003 .000
Cubic .011 .111 2 20 .895 .636 .000 .000 .000
17

Knowledge Education Level vs. Energy Consumption
EquationModel Summary Parameter Estimate
R Square F df1 df2 Sig Constant b1 b2 b3
Quadratic .196 2.439 2 20 .113 .532 .013 .000
Cubic .196 1.547 3 19 .235 .591 .007 .000 .000
18

Cluster Analysis
The compactness of various cities will divide into two groups, a group for the high compactness city, and a group for the low compactness city. In order to understand different
19
order to understand different compactness and the energy consume relations. (See Table2)

Compactness vs. Energy Consumption
EquationModel Summary Parameter Estimate
R Square F df1 df2 Sig Constant b1 b2 b3
Higher Cubic .201 1.008 2 8 .407 .494 .000 .000 .000
Lower Cubic .280 .906 3 7 .485 -.733 .005 .000 .000
Higher Compactness of Cities vs. Energy Consumption
Lower Compactness of Cities vs. Energy Consumption
20

Urban Service Function vs. Energy ConsumptionEquation
Model Summary Parameter EstimateR Square F df1 df2 Sig Constant b1 b2 b3
Higher Cubic .313 1.063 3 7 .424 .669 .000 .000 .000Lower Cubic .607 4.125 3 8 .048 .374 .000 .000 .000
Higher Compactness of Cities
Lower Compactness of Cities
21

Development Degree of Transportation vs. Energy Consumption
EquationModel Summary Parameter Estimate
R Square F df1 df2 Sig Constant b1 b2 b3Higher Cubic .791 8.809 3 7 .009 .325 .072 -.003 .000Lower Cubic .611 3.926 2 5 .094 .662 .000 .001 .000
Higher Compactness of Cities
Lower Compactness of Cities
22
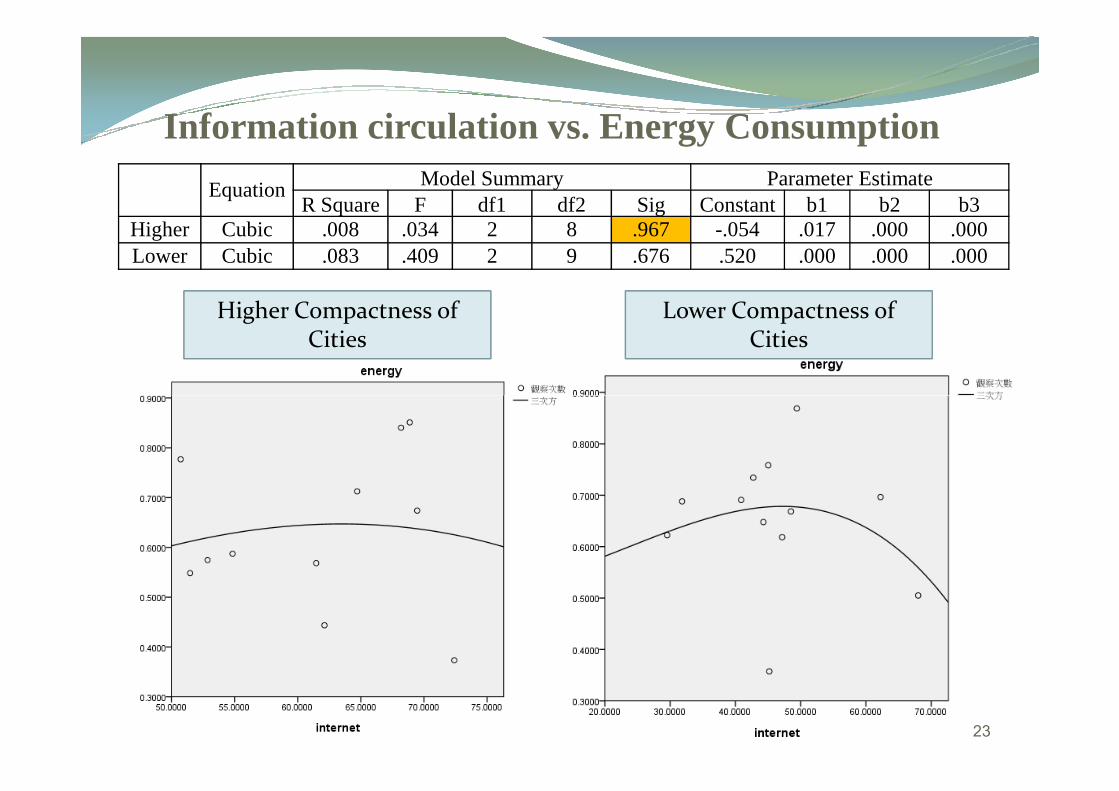
Information circulation vs. Energy Consumption
Equation Model Summary Parameter EstimateR Square F df1 df2 Sig Constant b1 b2 b3
Higher Cubic .008 .034 2 8 .967 -.054 .017 .000 .000Lower Cubic .083 .409 2 9 .676 .520 .000 .000 .000
Higher Compactness of Cities
Lower Compactness of Cities
23
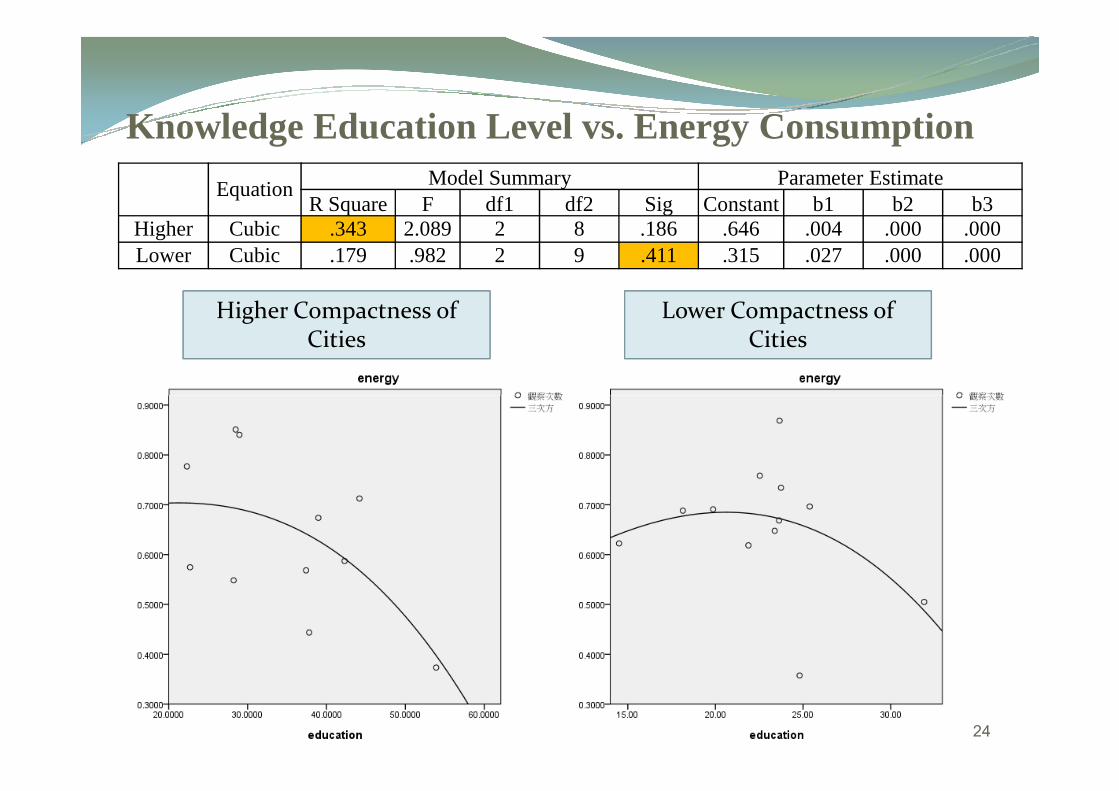
Knowledge Education Level vs. Energy Consumption
Higher Compactness of Cities
Lower Compactness of Cities
Equation Model Summary Parameter EstimateR Square F df1 df2 Sig Constant b1 b2 b3
Higher Cubic .343 2.089 2 8 .186 .646 .004 .000 .000Lower Cubic .179 .982 2 9 .411 .315 .027 .000 .000
24

� According to the above result and the analysis, it may understand that the different urban form truly would affect the energy use. But in different compactness situation, it also will have the different influence energy consumption.In order to achieve sustainable development, it should probably consider the more urban variable in the future.
� Transportation is one of the major energy consumption department.Many
Conclusion
� Transportation is one of the major energy consumption department.Many experts advocate to use alternative energy.However,this research prove that various urban form and compactness would consume different energy.Therefore,when urban planner will make the urban planning, they should consider the energy consumption impact of the urban form and compactness.Then the city can achieve the sustainable development.
25


