Steam Generator Tube Rupture (SGTR) • SGTR one of the most significant safety issues in PWRs.
– Leads to loss of primary coolant inventory, primary side de-pressurization and potential reactor core meltdown.
– Bypasses the plant’s containment structure, resulting in direct release of radioactivity into atmosphere.
• Frequency of SGTR in required in Probabilistic Risk Assessments (PRAs) of PWRs.
• There have been 10 large scale SGTR occurrences in US between 1975 and 2000.
• Several other reported cases of SG tube leakages and low scale ruptures (100,000 plugging as per US NRC).
An example of SGTR event (US NRC, LER, 1990): – SGTR event occurred at McGuire Unit 1 PWR near Charlotte, NC on March 7, 1989. – Cause of this SGTR was stress corrosion cracking under normal operating conditions.
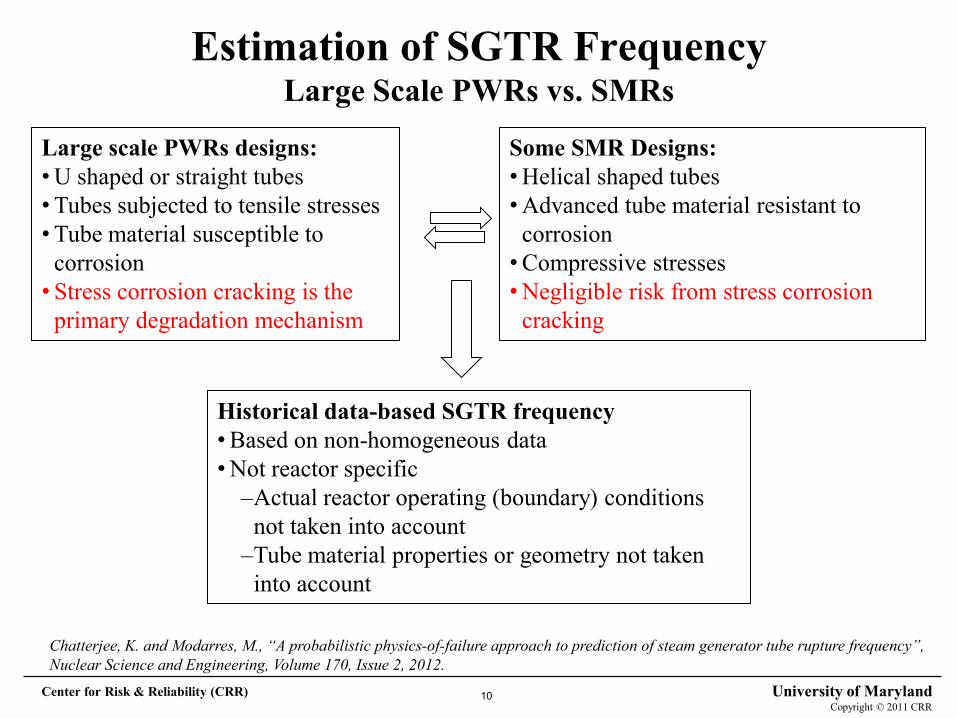
Estimation of SGTR Frequency Large Scale PWRs vs. SMRs
Some SMR Designs: • Helical shaped tubes • Advanced tube material resistant to
corrosion • Compressive stresses • Negligible risk from stress corrosion
cracking
Large scale PWRs designs: • U shaped or straight tubes • Tubes subjected to tensile stresses • Tube material susceptible to
corrosion • Stress corrosion cracking is the
primary degradation mechanism
Historical data-based SGTR frequency • Based on non-homogeneous data • Not reactor specific
–Actual reactor operating (boundary) conditions not taken into account
–Tube material properties or geometry not taken into account
Chatterjee, K. and Modarres, M., “A probabilistic physics-of-failure approach to prediction of steam generator tube rupture frequency”, Nuclear Science and Engineering, Volume 170, Issue 2, 2012.
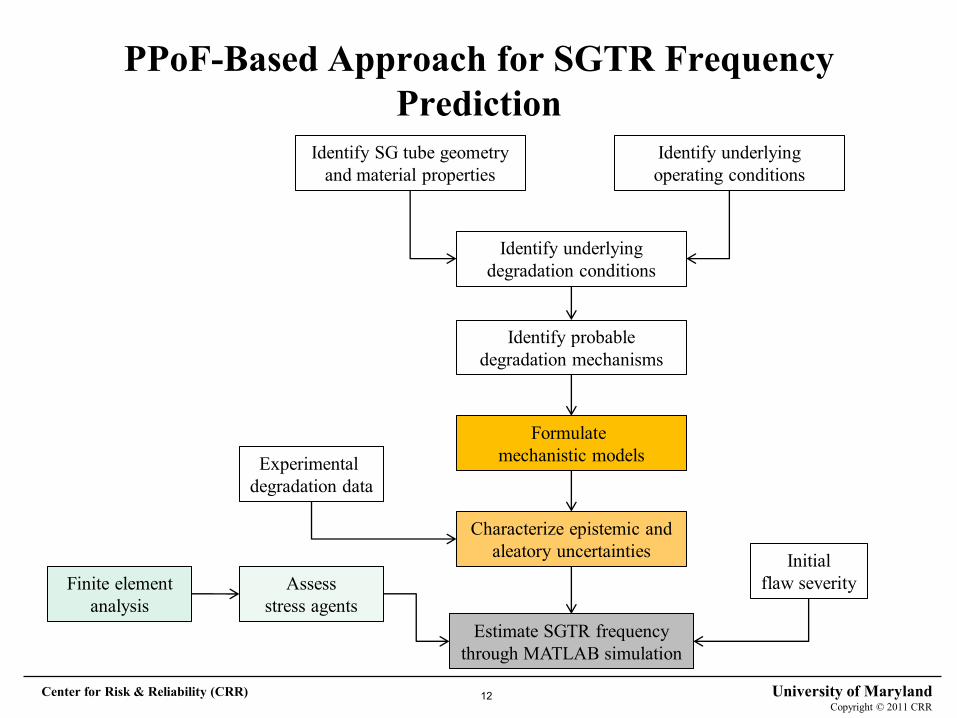
PPoF Estimation of SGTR Frequency Probabilistic Physics-of-Failure (PPoF) is a structured mechanistic-based
approach with consideration of uncertainties. – Why mechanistic?
• Considers underlying degradation and processes that lead to failure. – Why probabilistic?
• Considers uncertainties associated with unknown or partially known factors such as material properties, manufacturing methods, model uncertainties, and measurement errors.
Research objective: – Develop a PPoF-based approach to SGTR frequency prediction.
– Develop mechanistic models of applicable primary failure mechanisms under normal operating conditions.
– Develop a Bayesian approach to estimate and characterize the epistemic and aleatory uncertainties.
– Develop an approach to estimate the stress agents acting on tubes. – Develop a probabilistic reliability simulation and prediction approach.
• Alloy 690 (higher corrosion resistance) used in modern steam generators. • Risk of tube failure from SCC and pitting corrosion considerably reduced*. • Susceptible to failure mechanisms: fatigue and fretting wear caused by flow-induced
tube vibration.
SGTR
Fatigue
Fretting wear Pitting corrosion
Stress corrosion cracking
*Berge, P. et al., “Materials requirements for pressurized water reactor steam generator tubing”, Nuclear Technology, Vol. 55, October 1981.
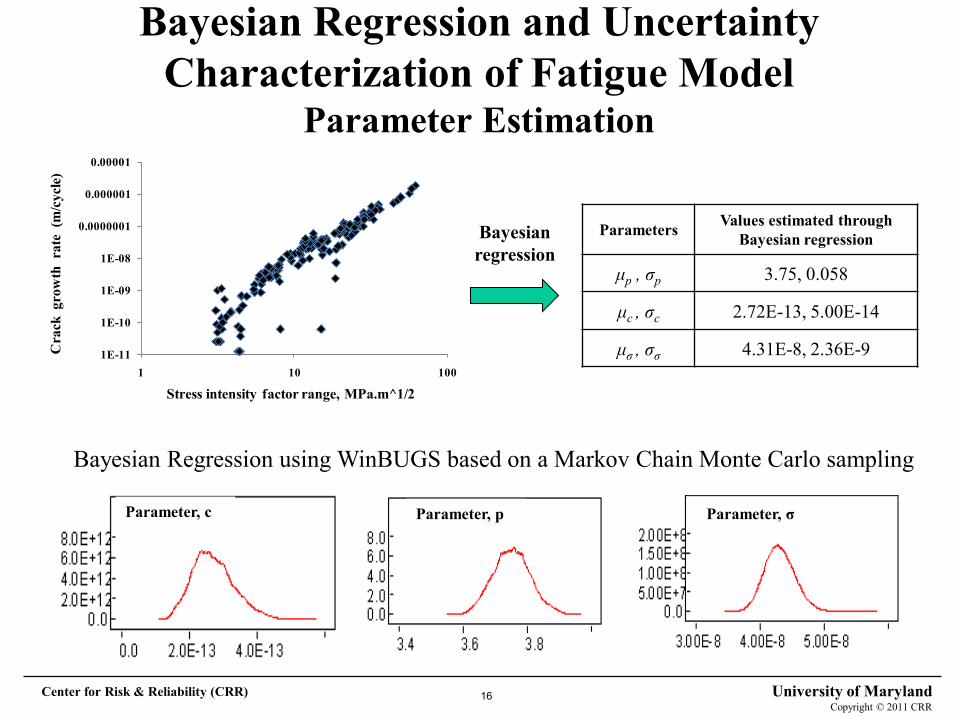
da / dN = crack growth rate; DK = stress intensity factor range; R = stress ratio;a f = final crack size; c & p = model parameters; Y = crack geometry factor; tm = mean life of steam generator; a i = initial crack size; DS= stress range for the applied loading
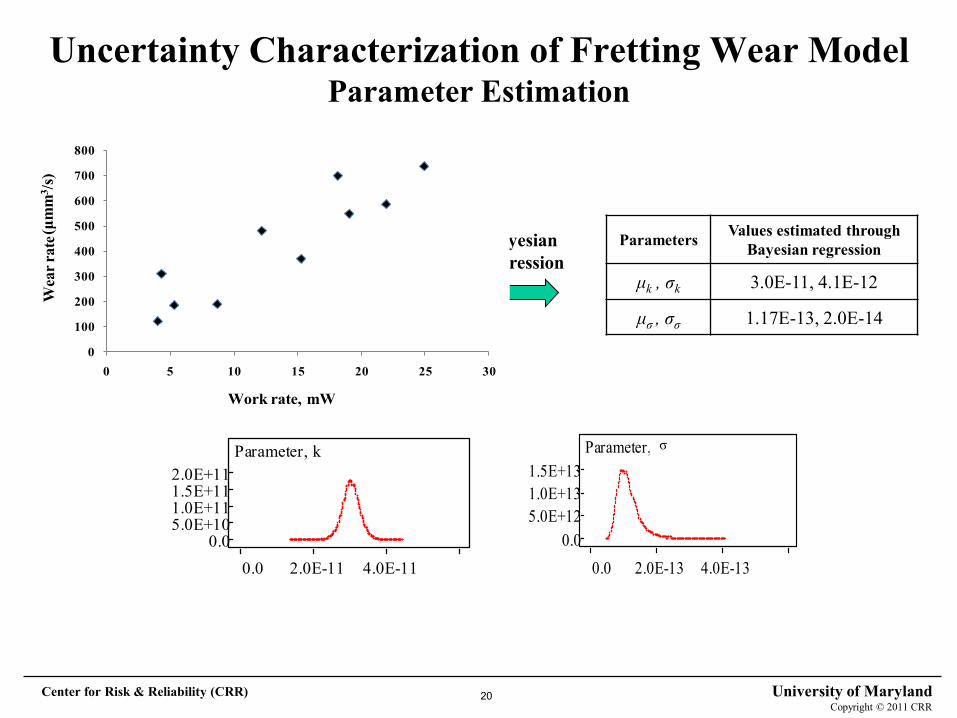
Uncertainty Characterization of Fretting Wear Model Bayesian Regression Approach
Bayesian regression
PoF model
Likelihoodfunction
Fretting wear data for Alloy 690
Prior distribution of k
BayesianInference
Posterior distribution of k
0
100
200
300
400
500
600
700
800
0 5 10 15 20 25 30
Wea
r rat
e
Work rate, mW
(μm
m3 /s
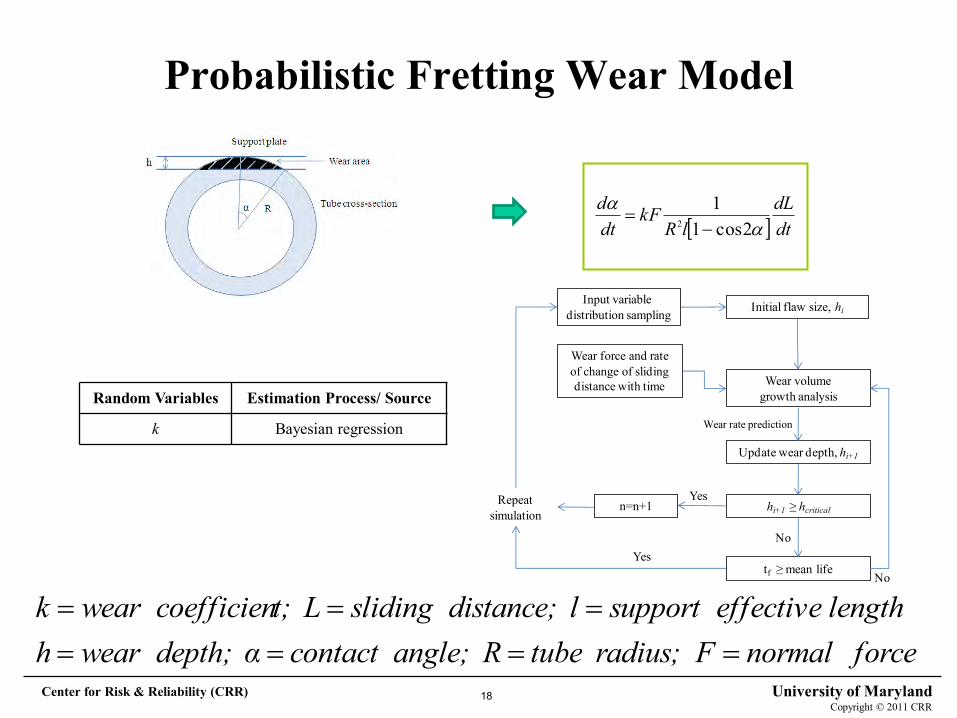
) V = kFLdVdt
= k d(FL)dt
= k dWdt
V = kW+e(0,s)
Model error • Epistemic • Aleatory
g(k) Parameter uncertainty
(epistemic)
g(ε)
Data From: Lee, Y. et al., “A study on wear coefficients and mechanisms of steam generator tube materials,” Wear, Vol. 250, Issues 1-12, pp: 718–725, 2001
SG Design Parameters • SG coil is a once-through heat exchanger with many
helically coiled tubes intertwined like DNA structure. • Helical tubes are made of Alloy 690. • Compressive forces. • Primary coolant flows downward through the tube bundle
by natural circulation. • Helical tubes are subjected to liquid cross-flow externally
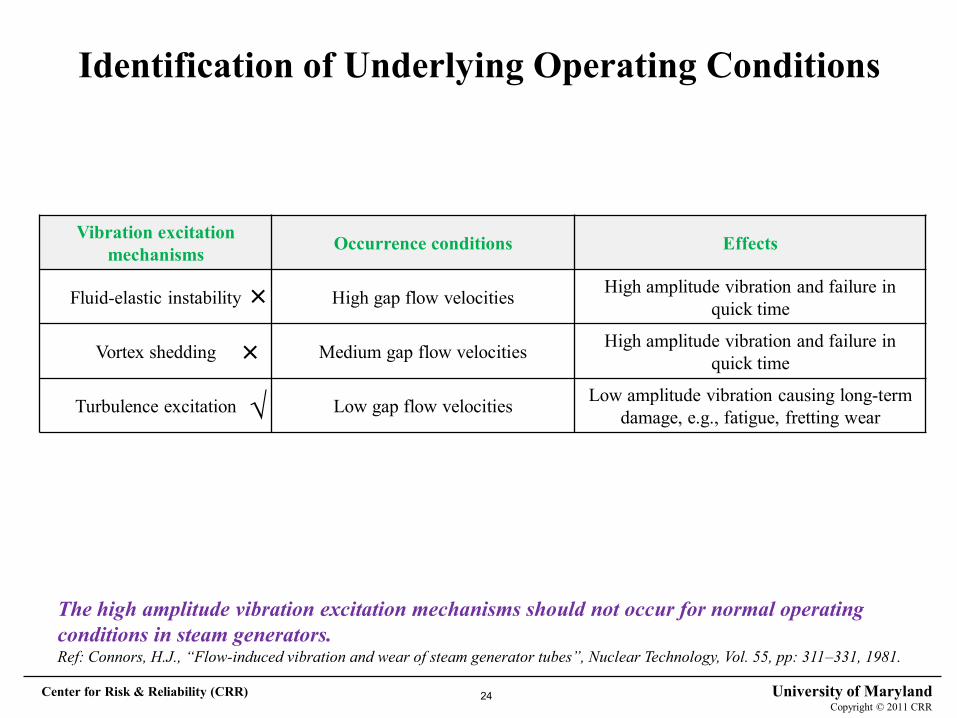
The high amplitude vibration excitation mechanisms should not occur for normal operating conditions in steam generators. Ref: Connors, H.J., “Flow-induced vibration and wear of steam generator tubes”, Nuclear Technology, Vol. 55, pp: 311–331, 1981.
Alloy 690 helical tubes with pre-existing flaws are susceptible to fatigue and fretting wear failure mechanisms under turbulent flow-induced tube vibration.
Failure mechanisms Degradation conditions Conditions in helical SG design
Assessing Stresses Random Vibration Analysis Approach
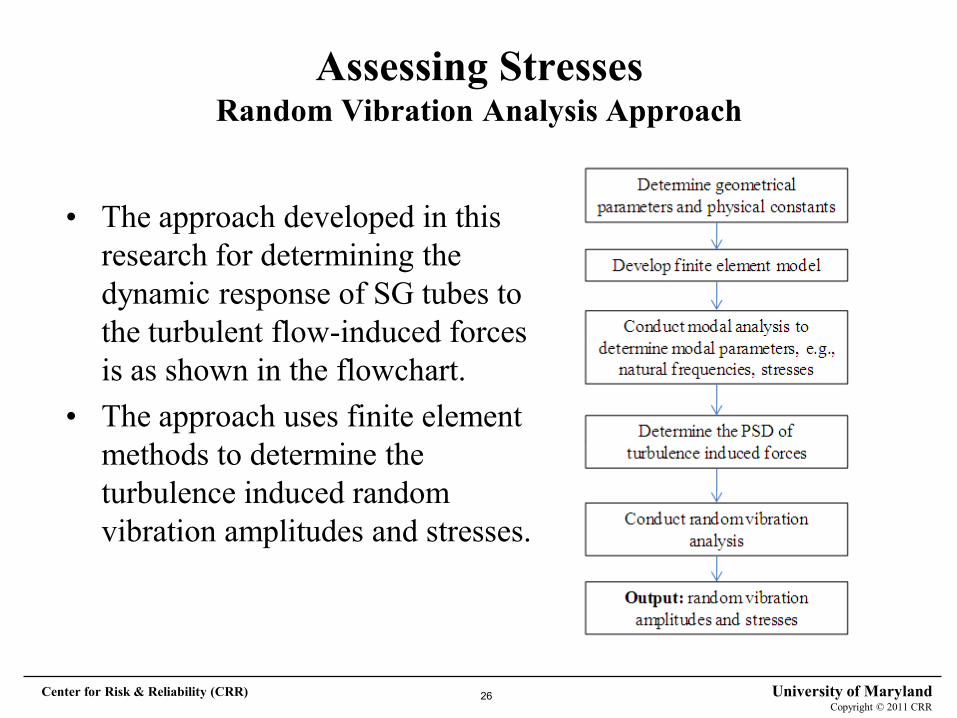
• The approach developed in this research for determining the dynamic response of SG tubes to the turbulent flow-induced forces is as shown in the flowchart.
• The approach uses finite element methods to determine the turbulence induced random vibration amplitudes and stresses.
Assessment of Stresses Turbulence-Induced Force PSD Calculation
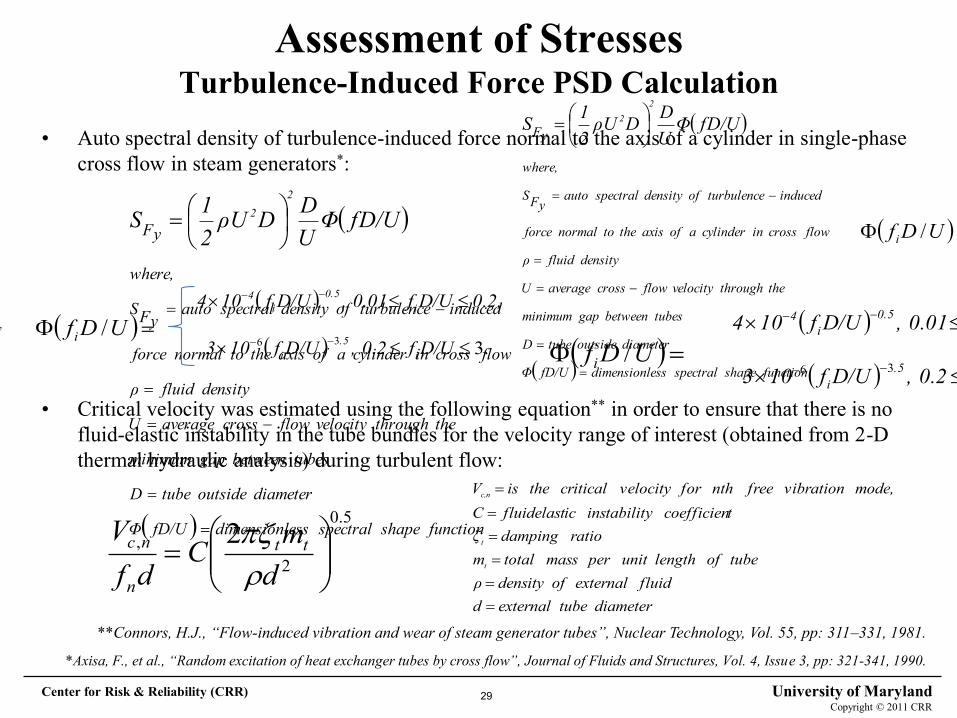
• Auto spectral density of turbulence-induced force normal to the axis of a cylinder in single-phase cross flow in steam generators*:
• Critical velocity was estimated using the following equation** in order to ensure that there is no fluid-elastic instability in the tube bundles for the velocity range of interest (obtained from 2-D thermal hydraulic analysis) during turbulent flow:
.336 D/Uf0.2 ,D/Uf103 i
.5i
0.2,D/Uf0.01 ,D/Uf104 i0.5
i4
UDfi /
function shape spectralessdimensionlfD/UΦ
diameter outside tubeD
tubes between gap minimum
the throughvelocity flowcross averageU
density fluidρ
flow cross in cylinder a of axis the to normal force
inducedturbulence ofdensity spectralautoyFS
where,
yF fD/UΦUDDρU
21S
22
5.0
2, 2
dmC
dfV tt
n
nc
diameter tube externaldfluid external ofdensity ρ
tube of length unit per mass totalmratio damping ζ
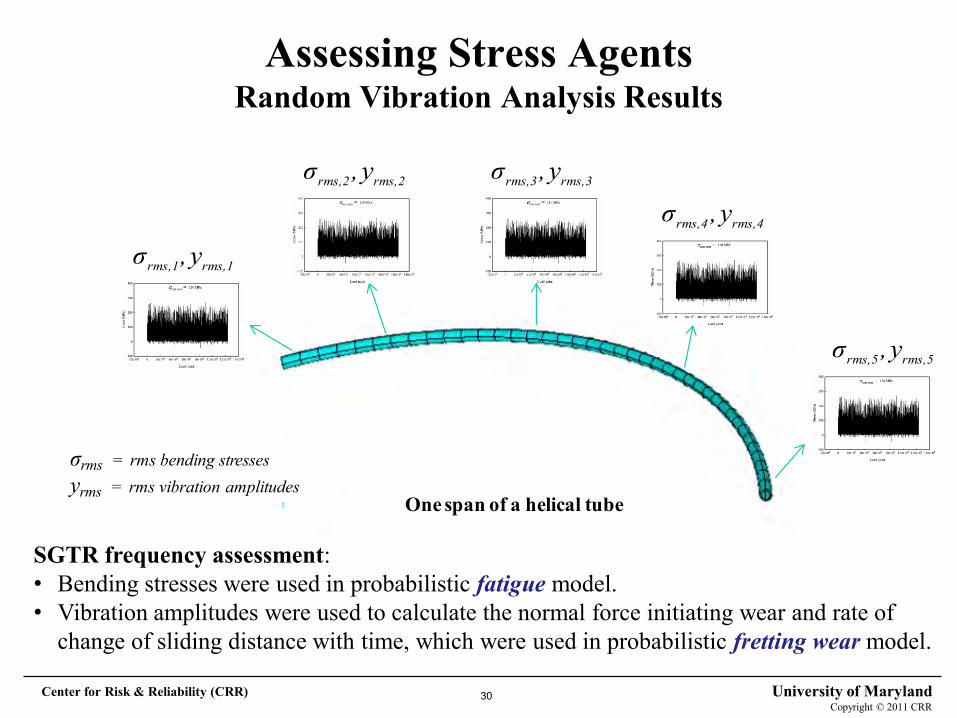
SGTR frequency assessment: • Bending stresses were used in probabilistic fatigue model. • Vibration amplitudes were used to calculate the normal force initiating wear and rate of
change of sliding distance with time, which were used in probabilistic fretting wear model.
Summary and Conclusions • Historical failure data-based SGTR frequency estimates do not apply to
SMRs – Based on non-homogeneous data collected from varied PWRs. – Not plant specific. – Do not account for degradation conditions or tube material and
geometry. • A PPoF-based SGTR frequency prediction approach has been developed
in this research. – Accounts for underlying degradation conditions. – Considers epistemic and aleatory uncertainties of models and data.
• An application of the PPoF approach has been successfully implemented.
• PPoF technique provides an effective tool for evaluating safety and reliability of new SGs and other passive systems and structures.
More detailed 3-D thermal hydraulic analysis of the
primary-side fluid-flow characteristics (e.g., gap turbulent flow velocities, fluid density) and secondary side in SG tube bundles during normal operating conditions in the SMRs.
Better characterization of the initial flaw characteristics


![Probabilistic Upscaling of Material Failure Using Random ... · spectral stochastic finite element method to plasticity and failure [4]. To solve multiscale failure problems such](https://static.documents.pub/doc/80x56/5edc0184ad6a402d66667c35/probabilistic-upscaling-of-material-failure-using-random-spectral-stochastic.jpg)