Page 1
A procedure for evaluating the
nutrient assimilative capacity of
Darwin Harbour
E.C.V. Butler, C. Streten-Joyce, J.J. Tsang, D.K. Williams,
D.M. Alongi, M.J. Furnas and A.D. McKinnon
PRODUCED FOR
Aquatic Health Unit,
NT Department of Land Resource Management
Darwin
September 2013
Australian Institute of Marine Science
Page 2
2
This document should be cited as: Butler, E.C.V., Streten-Joyce, C., Tsang, J.J., Williams, D.K., Alongi, D.M., Furnas, M.J. and McKinnon, A.D. (2013) A procedure for evaluating the nutrient assimilative capacity of Darwin Harbour. Report for Aquatic Health Unit, NT Department of Land Resource Management. Australian Institute of Marine Science, Darwin. (41 pp. plus appendices).
© Copyright .Australian Institute of Marine Science (AIMS) [2013]
All rights are reserved and no part of this document may be reproduced, stored or copied in any form or by any means whatsoever except with the prior written permission of AIMS. DISCLAIMER
While reasonable efforts have been made to ensure that the contents of this document are factually correct, AIMS does not make any representation or give any warranty regarding the accuracy, completeness, currency or suitability for any particular purpose of the information or statements contained in this document. To the extent permitted by law AIMS shall not be liable for any loss, damage, cost or expense that may be occasioned directly or indirectly through the use of or reliance on the contents of this document.
Page 3
3
Table of Contents
Table of Contents ...................................................................................................................................... 3 Executive Summary ............................................................................................................................... 4
1. Introduction ....................................................................................................................................... 6 1.1. Objectives of Investigation .................................................................................................... 8
2. Nutrient distribution and cycling in Darwin Harbour, and the broader system
ecology—a review ..................................................................................................................................... 9 2.1. Nutrient cycling—an introduction ....................................................................................... 9 2.2. Nutrient distribution and cycling within Darwin Harbour .......................................... 14 2.3. Inputs of nutrients to the harbour..................................................................................... 21 2.4. Fates of nutrients ................................................................................................................... 23
3. Nutrient assimilative capacity in Darwin Harbour—thresholds and the means of
assessing them and predicting their advent ....................................................................................... 25 3.1. Indicators of thresholds in nutrient assimilative capacity in a Northern Australian
macrotidal estuary ............................................................................................................................... 26 3.2. A modelling approach to nutrient assimilative capacity, and scenario testing ........ 27
4. Knowledge gaps and their filling .................................................................................................. 30 4.1. Monitoring ............................................................................................................................... 30 4.2. Process understanding .......................................................................................................... 31 4.3. Modelling .................................................................................................................................. 31
5. Summary and Conclusions ............................................................................................................ 32 Acknowledgements.................................................................................................................................. 33 References ................................................................................................................................................. 34 Appendices ................................................................................................................................................... i Appendix 1: .................................................................................................................................................. ii
Page 4
4
Executive Summary
We advocate the application of nutrient assimilative capacity in Darwin Harbour within a
preventative framework, with a capacity for forewarning. Current knowledge and
understanding of nutrient dynamics in the harbour are insufficient to address the
application of the concept fully. Without this knowledge, a nutrient loading capacity for
the Harbour as a whole, and more importantly, specific parts of the harbour under
immediate threat, cannot be properly evaluated.
An overview of nutrient cycling in coastal waters has been presented, with nutrient
assimilative capacity defined for this study as the scope of the system to incorporate nutrients
into living matter and sediments, so preventing build-up of nutrient concentrations in the water
column, with two important provisos—that the nutrient assimilation process within the harbour
does not lead to 1) loss of estuarine or coastal biodiversity, or 2) degradation of environmental
services of the system.
In a review of nutrient cycling and distribution in Darwin Harbour, it is recorded that the
water body is nitrogen limited (although phosphorus co-limitation has been noted in
some instances). Nitrogen became the focus for our study.
The dominant form of dissolved nitrogen is dissolved organic nitrogen, which is
representative of a generally undisturbed system; this observation is corroborated by the
low levels of chlorophyll a in the harbour. The top two primary producers have been
identified as mangroves followed by phytoplankton in the water column. The order is
reversed with respect to nitrogen and phosphorus demand (in effect, nutrient
assimilation): phytoplankton and then mangroves, with other estimated uptakes assessed
as trivial.
Darwin Harbour is a net autotrophic system. Constraints on primary production (and
hence, nutrient uptake) in the water column include light (attenuated by turbidity) and
grazing. Both factors need to be characterised much more fully. The scope for pollutants
(e.g. metals, organohalides, PAHs and TBT) to interfere with biological uptake of
nutrients in Darwin Harbour is not known.
Nutrient inputs into Darwin Harbour from terrestrial discharges (including human
activities) have been well studied and documented; there are also predictions of likely
increases with increased land clearing and urbanisation. It is concluded that these inputs
will remain minor (<15% of total) compared to other known inputs, such as coastal sea
waters and N fixation, but this does not preclude localised harm (a current example is
Buffalo Creek). Further data gathering and research are needed to quantify definitively
inputs from all other sources apart from surface, terrestrial diffuse and point-source
discharges.
Fates of nutrients are more poorly resolved than inputs. By analogy with studies
elsewhere in tropical Australia (e.g. Great Barrier Reef), ultimate sinks for nitrogen are
likely to be the atmosphere (via denitrification to N2) with a minor loss to deep burial in
sediments. Mangroves (and their ecosystems) are suggested to be effective intermediate
repositories for nutrients.
Page 5
5
To apply the concept of a nutrient assimilative capacity in Darwin Harbour (within a
preventative framework and having capacity for forewarning), multiple threshold
indicators have been suggested to highlight changes in conditions. Recommended as these
set of indicators are chlorophyll a, dissolved oxygen and as yet unspecified rates of
reaction within the nitrogen cycle. The last indicator, or indicators, will be the outcome
of research involving molecular biology techniques. Potential N-cycle indicators include
rates of denitrification (possibly coupled with N fixation) and turnover rates for ammonia.
Integral to the application of nutrient assimilative capacity as espoused in this report is
the incorporation of the set of threshold indicators into a water quality model for
scenario testing and vulnerability resolution. The RMA2/RMA11 package has already been
used extensively for modelling hydrodynamics and sediment transport in Darwin
Harbour. It has recently been enhanced to a full water quality model, and is the prime
candidate for this work.
Knowledge gaps were identified that are hampering effective evaluation of nutrient
assimilative capacity. They were categorised under monitoring, process understanding
and modelling. Aside from those covered in preceding dot points, other major
deficiencies include: a need to establish the bioavailable fraction of dissolved organic
nitrogen; quantification of heterotrophic bacterial activity; increased autonomous
monitoring and across the full spectrum of harbour conditions; measurement of
denitrification in sediments; assessment of the nutrient assimilation by sponges; improved
characterisation of the underwater light environment; and focussed measurements in the
outer harbour to improve model boundary conditions.
Finally, the estimation of nutrient assimilative capacity of Darwin Harbour can be realised
through a combination of observations, experimentation and modelling; a framework has
been outlined. It is a process that would be used improperly if done only on a whole-of-
harbour basis; its zoned application, and case by case, within the waterway guarantees
more surely the integrity of ecological components (e.g. tidal creeks) of the full system.
Page 6
6
1. Introduction
Nutrient assimilative capacity, drawing on the explicit technical meaning of the individual
words, refers to the scope for nutrients (nutrient elements N, P, K, Si, Fe, etc.) to be
incorporated into organic (cellular) compounds of living organisms. It is most commonly used
when referring to the capacity of wetlands—natural (Correll et al. 1992) or constructed (Gray
et al. 2000)—to filter out nutrients from waters in transit through the system. In this use,
nutrients can be removed in living material (e.g. macrophytes and microalgae), detritus or the
soils/sediments of the wetland.
When it comes to coastal water bodies, nutrient assimilative capacity is in practice defined by
exception: when it is exceeded, in the view of the observer. Australian examples include, the
increase of phytoplankton biomass at the expense of seagrass in Cockburn Sound, Western
Australia (Pearce 1991), and when reviewing the effects of non-point sources more widely in
coastal ecosystems (Gabric and Bell 1993).
The definition to be used in this report, in considering Darwin Harbour (a macrotidal
estuarine system in the seasonally wet/dry tropics), is that nutrient assimilative capacity is the
scope of the system to incorporate nutrients into living matter (mangroves, macrophytes,
sponges, macroalgae, microalgae—pelagic or benthic, bacteria, etc., and the food webs
supported by these primary producers) and sediments, so preventing build-up of nutrient
concentrations in the water column. There are two important provisos: that the nutrient
assimilation process within the harbour does not lead to 1) loss of estuarine or coastal
biodiversity, or 2) degradation of environmental services of the system. An assessment of
nutrient assimilative capacity can be applied to the entire water body or to individual
compartments of it. The intent here will become clear through the report.
The domain of our study is the Greater Darwin Harbour as defined by the seaward boundary
Charles Point to Gunn Point, which encompasses Port Darwin and Shoal Bay (Figure 1). This
same boundary is used administratively, and in earlier reports considering its environmental
quality and ecology (e.g. Padovan 2003, McKinnon et al. 2006). The macrotidal harbour has a
maximum tidal amplitude of 7.8 m (mean spring amplitude: 5.5 m; mean neap amplitude:
1.9 m). Its surface area is 1220 km2 at the highest astronomical tide and 660 km2 at the lowest
astronomical tide, which compares with a relatively small catchment area of 2010 km2
(Skinner et al. 2009), of which ~7% of total system area is mangroves fringing the water body.
It is a shallow estuary with water depth of 20–30 m in the main channel at the mouth of the
Darwin Harbour, a maximum depth of ~40 m within the harbour, decreasing to 5–10 m in its
arms. The mean annual rainfall is 1731 mm; most falls between December and March in the
wet season (~80%; Bureau of Meteorology http://www.bom.gov.au/climate/data/index.shtml
(accessed 24 Aug 2013); Darwin Airport). During the dry season (May–September), the rivers
feeding Darwin Harbour (Blackmore River into Middle Arm, Elizabeth River into East Arm,
and Howard River into Shoal Bay) cease to flow, apart from a small residual flow from aquifer-
fed springs into the Blackmore River. The harbour is a stratified estuary (with fresher surface
waters) for a few days to a few weeks at a time in the upper estuary during the wet season,
depending on rainfall (Williams et al. 2006, Drewry et al. 2010b). At all other times, it is a
vertically well-mixed estuary (uniform salinity top to bottom). During the dry season, the
harbour becomes an inverse estuary with hypersaline water (exceeding seawater salinity)
formed in its landward arms as a result of evaporation.
Page 7
7
Figure 1. Map of Darwin Harbour and catchment, along with administrative boundaries
(Source: http://www.lrm.nt.gov.au/water/dhac/map).
The historic condition of Darwin Harbour, which persists in the main water body to this day,
is low concentrations of chlorophyll a (Chl a – a measure of phytoplankton density) and
dissolved nutrients, but with high concentrations of suspended particulate matter (or
‘suspended solids’) (Padovan 1997, 2003). The former results from oligotrophic, tropical
oceanic waters from the Timor and Arafura Seas mixing with the run-off from ancient,
weathered catchments of Northern Australia; the latter ensues from the large tides
remobilising fine sediments from the shallow harbour floor, and especially from the intertidal
mudflats. What is confusing is that measures of system productivity (e.g. net primary
production of 400 g C m–2 y–1) suggest that the harbour is overly productive or eutrophic.
This productivity is attributed to the mangroves, inhabiting at least two-thirds of the
foreshore, and their ecosystem (McKinnon et al. 2006, Burford et al. 2008).
This desktop study forms part of the Darwin Harbour Water Quality Protection Plan
(WQPP) project and conforms to a priority of the plan to protect Darwin Harbour
waterways from excessive nutrient inputs. We outline a mechanism for evaluating a nutrient
Page 8
8
assimilative capacity for the water body as a whole, but with the flexibility to be applied to a
compartment or sub-region of the harbour.
1.1. Objectives of Investigation
The goals of this study are:
1) To present what is known currently of the status and function of Darwin Harbour in
regard to nutrient loads and the processing of these;
2) To outline how to address the question of nutrient assimilative capacity of the Harbour,
and what further knowledge is needed to achieve it;
3) To identify how to tackle the knowledge gaps and recommend a priority for their
resolution.
These goals will be realised through a series of tasks as follows:
a) literature review of nutrient distribution and cycling in Darwin Harbour, within the
context of the system’s ecology; this will also include current nutrient loads of
nutrients (from catchments and WWTPs)—dissolved and particulate—and the
different fates of these forms;
b) appraisal of the available nutrient data: its coverage, accessibility, and relevance in
forming an assessment of nutrient assimilative capacity;
c) consideration of different paradigms for identifying exceedance of assimilative capacity
of Darwin Harbour for nutrients, and how related thresholds might be obtained;
d) assessment of a model approach that will canvass such matters as scenario testing,
zonal assimilative capacities and identification of sensitive areas (hot spots), and
optimisation of observational/monitoring programs;
e) as key knowledge areas, elaborate on the following: nutrient speciation and distribution;
critical nutrient ratios (N:P, etc.) and their effect on communities of micro-organisms;
nutrient sources/sinks and cycling, and associated harbour compartmentalisation; light
limitation of primary production and interplay with other drivers; model
underpinning—relevant chemical thermodynamics and kinetics, and ‘decay
coefficients’;
f) as information requirements (specific to Darwin Harbour), look into eutrophication and
toxicity (e.g. ammonia about WWTP outfalls) testing; and laboratory experiments to
determine threshold levels/ trigger values that come out of earlier stages of this study;
g) evaluation of the preceding tasks to reveal the knowledge/information gaps (available
resources against needs); and
h) determine the priority for filling the knowledge/information gaps, and formulate in a
set of recommendations
Page 9
9
2. Nutrient distribution and cycling in Darwin Harbour, and the
broader system ecology—a review
2.1. Nutrient cycling—an introduction
An array of nutrients is required for plant growth in estuarine and marine waters; from the
generally abundant oxygen and carbon to the trace amounts of micronutrients, such as cobalt,
iodine and zinc (Morel et al. 2003, Libes 2009). The macronutrients nitrogen and phosphorus
are vital to marine plants, whether mangroves or single-celled phytoplankton; a third
macronutrient silicon is essential for planktonic diatoms.
Nitrogen cycle
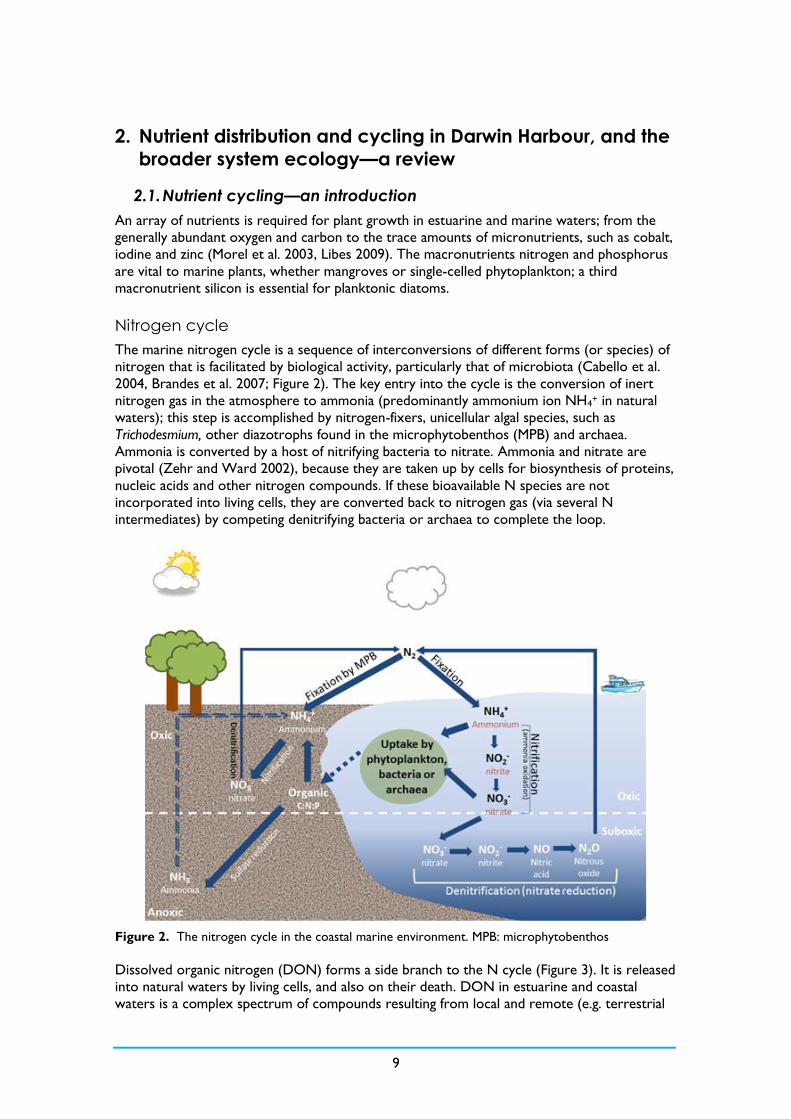
The marine nitrogen cycle is a sequence of interconversions of different forms (or species) of
nitrogen that is facilitated by biological activity, particularly that of microbiota (Cabello et al.
2004, Brandes et al. 2007; Figure 2). The key entry into the cycle is the conversion of inert
nitrogen gas in the atmosphere to ammonia (predominantly ammonium ion NH4+ in natural
waters); this step is accomplished by nitrogen-fixers, unicellular algal species, such as
Trichodesmium, other diazotrophs found in the microphytobenthos (MPB) and archaea.
Ammonia is converted by a host of nitrifying bacteria to nitrate. Ammonia and nitrate are
pivotal (Zehr and Ward 2002), because they are taken up by cells for biosynthesis of proteins,
nucleic acids and other nitrogen compounds. If these bioavailable N species are not
incorporated into living cells, they are converted back to nitrogen gas (via several N
intermediates) by competing denitrifying bacteria or archaea to complete the loop.
Figure 2. The nitrogen cycle in the coastal marine environment. MPB: microphytobenthos
Dissolved organic nitrogen (DON) forms a side branch to the N cycle (Figure 3). It is released
into natural waters by living cells, and also on their death. DON in estuarine and coastal
waters is a complex spectrum of compounds resulting from local and remote (e.g. terrestrial
Page 10
10
run-off) sources (Bronk, 2002); it is further modified by photochemical reactions and
reworked by biogeochemical processes. Macromolecular forms of DON (e.g. humic and fulvic
acids) can be quite inert and persistent, but their ultimate pathways are either aggregation to
particulate organic N (PON) and depositing in sediments, or microbial decomposition to
bioavailable forms of DON and remineralisation to ammonia, and thus, returning to the
central N cycle.
Figure 3. Sources of nitrogen pools and their entry into the nitrogen cycle (modified from Furnas et
al. 2011). DON: dissolved organic nitrogen; the green ellipses also represent particulate organic
nitrogen.
Traditionally it was thought that inorganic nitrogen was only assimilated by eukaryotic
plankton and that primary role of heterotrophic bacteria in the N cycle was the release of
ammonia during the decomposition of organic matter so it was available for phytoplankton
(Zehr and Ward 2002). It is now known that species of heterotrophic bacteria are also
capable of assimilating nitrogen. For example, studies of heterotrophic bacteria in Barents Sea
showed that their uptake of dissolved inorganic nitrogen (17–36% of nitrate and 12–40% of
ammonia) was appreciable in polar oceans (Allen et al. 2002); a similar prominence is inferred
for shelf waters of the Great Barrier Reef (Furnas et al. 2011). Heterotrophs can be
competing with phytoplankton for ammonia, regenerating ammonia through decomposition or
simultaneously doing both (Zehr and Ward 2002).
Nitrogen cycling in sediments remains essentially unaltered from the water column, but it is
compressed in the vertical scale, constrained by the supply of dissolved oxygen, and modified
by heterogeneous (viz. particle-surface) reactions and higher densities of microbes. Important
characteristics to note are that denitrifiers are restricted by redox potential, competition for
nitrate with other bacteria, and supply of organic matter (Alongi 1988, Rivera-Monroy &
Twilley 1996). Oscillation between oxic and anoxic conditions in surface sediments can
promote denitrification (Laverock et al. 2010, Devries et al. 2012). Whilst, increasing supply of
Page 11
11
organic matter can switch coastal sediments from net nitrogen fixation to net denitrification
(Fulweiler et al. 2007).
High rates of denitrification (compared to opposing reactions) result in its dominance in
coastal waters; this is reasoned as the cause of N being limited almost universally in estuarine
and coastal waters (Harris 2001a, Howarth et al. 2011; and see Section 2.2 below). A recent
review by Burgin and Hamilton (2007) contends that perhaps too much emphasis has been
placed on respiratory denitrification as the removal process for nitrate. They have postulated
five other pathways (or variations of pathway) that remove it. Most of the five have N2 either
as the end-product or an option, but some end up with bioavailable ammonia. One of the
alternative nitrogen pathways is anammox, which has been identified as possibly the main N
cycling pathways in suboxic environments (Zehr and Kudela 2011).
Phosphorus cycle
The central inorganic and bioavailable form of phosphorus is phosphate (Figure 4; represented
as PO4, and analytically determined as molybdate-reactive P). Like the N cycle, the P cycle is
strongly regulated by the activity of micro-organisms (Dyhrman et al. 2007), but it differs from
Figure 4. Phosphorus cycling in marine environment. PIP – Particulate inorganic phosphate, DOP –
Dissolved organic phosphate.
N in also being highly particle-reactive. Geochemical processes of adsorption and desorption on
mineral surfaces1 (e.g. hydrous oxides of Fe, Mn, Al, clays, etc.)—either as suspended particles
or sediment surfaces—determine its concentration in solution, and hence, its bioavailability
(Paytan & McLaughlin 2007). Phosphate is taken up within cells and converted to dissolved
organic P (DOP; e.g. phospholipids, phytin, nucleic acids). When released back into solution,
1 In reality, these will not be pure phases, but particles composed of minerals, organic matter among
which are rich populations of micro-organisms (Cowan & Bruland 1985, Mackey & Zirino 1994)
Page 12
12
DOP can be remineralised by microbial activity (Thingstad et al. 1993; e.g. extracellular
enzymes, such as alkaline phosphates) or become adsorbed to particle surfaces.
Other forms of phosphorus in the marine environment include inorganic polyphosphates
(refractory polymeric forms of phosphate) and P associated with various minerals that
contribute to the particulate inorganic P (PIP) phase (Benitez-Nelson 2000), Paytan &
McLaughlin 2007). PIP is introduced by terrestrial run-off, but it is also produced authigenically
in seawaters. If not remineralised by biological processes to return into the marine P cycle,
PIP is buried in sediments (e.g. phosphorite deposits).
In sediments, bacteria actively decompose organic P to phosphate (Gächter and Meyer 1993),
but the latter is only released to sediment porewaters if bacterial nutritional requirements are
met (Thingstad et al. 1993). Even then, the availability of phosphate is not assured, it is
influenced by redox potential (P release from hydrous Fe and Mn oxides under reducing
conditions: suboxic to anoxic), sorption to clay particles, humic acids, bioturbation,
mobilisation by macrophytes, and physical processes, such as resuspension and wave pumping
(Paytan and McLaughlin 2007).
Factors effecting nutrient cycling
Our consideration of the N and P cycles here has been necessarily brief, and has not
elaborated the full complexity of them. We emphasise that the N and P cycles do not exist in
isolation, they interact closely with one another (e.g. they are closely linked intracellularly in
such as nucleic acids and nucleoside triphosphates), and they are modulated by other
elements cycles, particularly carbon and sulphur. An example has already been provided above
of a link between the C and N cycles: denitrifying bacteria couple the conversion of nitrate (or
N intermediates) to N2 with decomposition of organic matter. Another example is carbon
availability (a combination of concentration and form of organic carbon) being inversely
related to the rate of nitrification by sediment bacteria (Strauss and Lamberti 2000). It has
been proposed that the decline in nitrification arises from organic carbon stimulating non-
nitrifying bacteria, which are then able to outcompete nitrifying bacteria. Some sedimentary
bacteria species (e.g. Roseobacter denitrificans), capable of both denitrification and nitrogen
fixation, also use sulfate as an electron acceptor (Fulweiler et al. 2013). The ability of these
bacteria species to switch between N and S as energy sources is but one example of why both
cycles are intimately linked in sediments. The third marine macronutrient Si has not been
discussed above, but its cycling is also entwined with N and P. It is crucial to the siliceous
microalgae diatoms, but also to other life forms, such as Radiolarians and sponges.
The micronutrient metals (Fe, Mn, Zn, Co, Cu, etc.) are important as cofactors in many
enzymes. Recent studies have shown that bacterial communities in sediments of tropical areas
(Cornall et al. 2012) are influenced by bioavailable metal concentrations. Insufficiency of
essential trace metals causes activities of enzymes to be depressed, if not inactivated, and
certain microbial taxa can be become nutrient limited. However, if the situation tips over into
excess concentrations of metals, as in contaminated waterways, other metals can become
enzyme inhibitors or even cause toxic effects. Other organic contaminants, such as
organohalides, PAHs, triazine compounds, can also have detrimental consequences for
nutrient cycling and uptake by harming communities of micro-organisms (Koelmans et al.
2001).
Aside from nutrients (and their antagonists), the availability of light—or strictly its intensity
and quality—is the other primary factor in the productivity of phytoplankton (Kirk 2011).
Turbidity from total suspended sediment and coloured dissolved organic matter (CDOM –
e.g. humic substances) is the main factor attenuating light in Darwin Harbour. There is
Page 13
13
currently a lack of information on the underwater light environment (Mobley 1994) that
characterises the surface waters of Darwin Harbour and its neighbouring coastal zone. We
can surmise the effects of turbidity on light (e.g. photosynthetically available radiation; PAR)
and the ensuing effects on primary production and nutrient cycling from studies in other parts
of the world. For example, Pratt et al. (2013) have shown that increasing suspended solids
concentration constrained the primary productivity of MPB (three-fold reduction) and
enhanced the efflux of nutrients (e.g. four-fold increase in ammonia release) from sediments in
benthic chambers. Studies of the influence of light (PAR) in the freshwater tidal zone of a
mesotidal, turbid estuary (Domingues et al. 2011) revealed that diatoms were the most light
limited, while cyanobacteria were the only taxa capable of acclimating to the low light. Wan et
al. (2013) incorporated a light attenuation algorithm into a physical–biogeochemical coupled
model and demonstrated improved results for nutrients, chlorophyll concentrations, and
primary production.
Other physical (e.g. salinity, turbulence, sediment grain-size and porosity), chemical (e.g.
dissolved oxygen and pH) and biological (e.g. grazing pressure) conditions also influence
nutrient cycling and assimilation. These will be highlighted as necessary later in the report
when considering the environment of Darwin Harbour. Subtle changes in microbial
community structure, possibly resulting from physico-chemical factors but also arising from
within-community interactions (bloom progressions, grazing effects, even quorum sensing)
also alter nutrient biogeochemistry. For example, a transition in the class of phytoplankton
from diatoms to cyanobacteria (e.g. Cook et al. 2004) can change the status of surface coastal
seawaters from N limited to N replete.
Page 14
14
2.2. Nutrient distribution and cycling within Darwin Harbour
The distribution and biogeochemical cycling of nutrients is considered here from the seaward
boundary of Darwin Harbour to the tidal limit in the upper reaches of its arms. It also
encompasses the zone of maximum inundation under a spring high tide, which draws in the
fringing vegetation, such as mangroves.
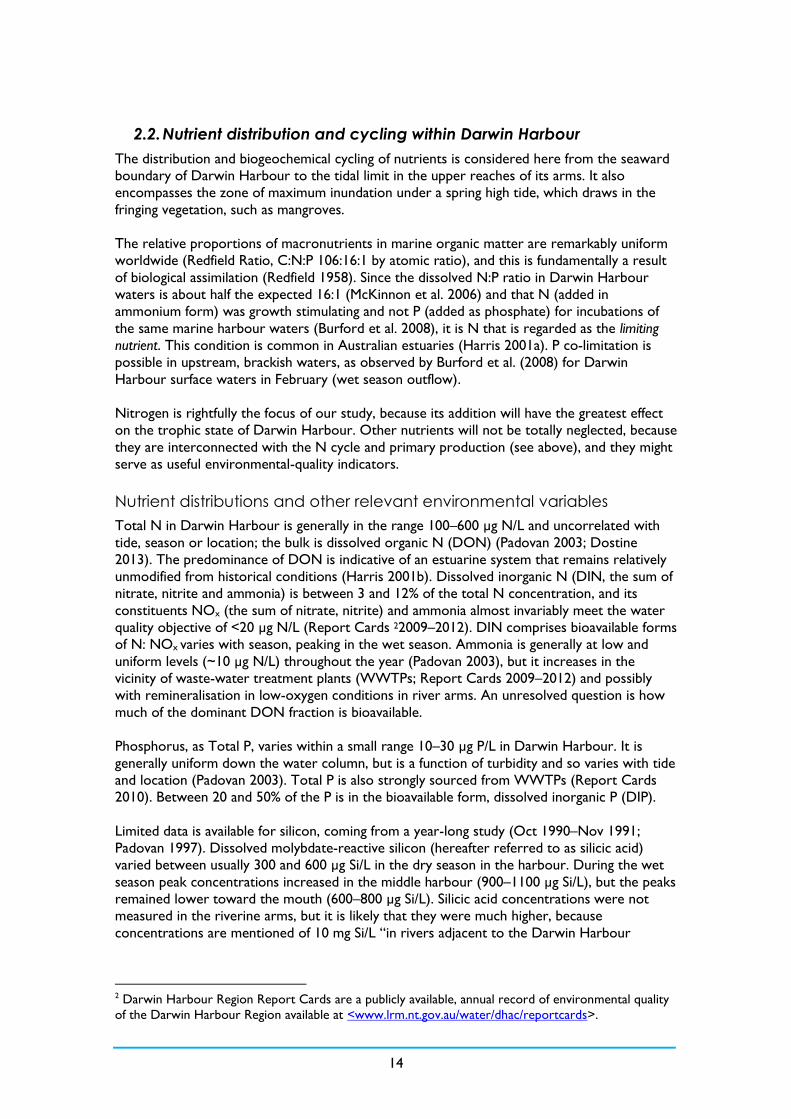
The relative proportions of macronutrients in marine organic matter are remarkably uniform
worldwide (Redfield Ratio, C:N:P 106:16:1 by atomic ratio), and this is fundamentally a result
of biological assimilation (Redfield 1958). Since the dissolved N:P ratio in Darwin Harbour
waters is about half the expected 16:1 (McKinnon et al. 2006) and that N (added in
ammonium form) was growth stimulating and not P (added as phosphate) for incubations of
the same marine harbour waters (Burford et al. 2008), it is N that is regarded as the limiting
nutrient. This condition is common in Australian estuaries (Harris 2001a). P co-limitation is
possible in upstream, brackish waters, as observed by Burford et al. (2008) for Darwin
Harbour surface waters in February (wet season outflow).
Nitrogen is rightfully the focus of our study, because its addition will have the greatest effect
on the trophic state of Darwin Harbour. Other nutrients will not be totally neglected, because
they are interconnected with the N cycle and primary production (see above), and they might
serve as useful environmental-quality indicators.
Nutrient distributions and other relevant environmental variables
Total N in Darwin Harbour is generally in the range 100–600 µg N/L and uncorrelated with
tide, season or location; the bulk is dissolved organic N (DON) (Padovan 2003; Dostine
2013). The predominance of DON is indicative of an estuarine system that remains relatively
unmodified from historical conditions (Harris 2001b). Dissolved inorganic N (DIN, the sum of
nitrate, nitrite and ammonia) is between 3 and 12% of the total N concentration, and its
constituents NOx (the sum of nitrate, nitrite) and ammonia almost invariably meet the water
quality objective of <20 µg N/L (Report Cards 22009–2012). DIN comprises bioavailable forms
of N: NOx varies with season, peaking in the wet season. Ammonia is generally at low and
uniform levels (~10 µg N/L) throughout the year (Padovan 2003), but it increases in the
vicinity of waste-water treatment plants (WWTPs; Report Cards 2009–2012) and possibly
with remineralisation in low-oxygen conditions in river arms. An unresolved question is how
much of the dominant DON fraction is bioavailable.
Phosphorus, as Total P, varies within a small range 10–30 µg P/L in Darwin Harbour. It is
generally uniform down the water column, but is a function of turbidity and so varies with tide
and location (Padovan 2003). Total P is also strongly sourced from WWTPs (Report Cards
2010). Between 20 and 50% of the P is in the bioavailable form, dissolved inorganic P (DIP).
Limited data is available for silicon, coming from a year-long study (Oct 1990–Nov 1991;
Padovan 1997). Dissolved molybdate-reactive silicon (hereafter referred to as silicic acid)
varied between usually 300 and 600 µg Si/L in the dry season in the harbour. During the wet
season peak concentrations increased in the middle harbour (900–1100 µg Si/L), but the peaks
remained lower toward the mouth (600–800 µg Si/L). Silicic acid concentrations were not
measured in the riverine arms, but it is likely that they were much higher, because
concentrations are mentioned of 10 mg Si/L “in rivers adjacent to the Darwin Harbour
2 Darwin Harbour Region Report Cards are a publicly available, annual record of environmental quality
of the Darwin Harbour Region available at <www.lrm.nt.gov.au/water/dhac/reportcards>.
Page 15
15
catchment [cites WRD records]”. An inverse relationship for Si with salinity is expected
(Burton et al. 1970).
Dissolved oxygen (DO) concentrations play a decisive part in all aspects of biological nutrient
processing, and as recounted above, the influence extends beyond to chemical redox control
(with DO as a master variable) of phosphate release from mineral phases. The water column
in the main body of Darwin Harbour is well oxygenated (65–100% saturation) (Padovan 1997,
Report Cards 2009–10). Levels of saturation decline in the arms of the Harbour (50–85%; e.g.
estuaries of Elizabeth and Blackmore Rivers—see Dostine 2013 for former). Greater oxygen
demand from organic matter, originating from the mangrove forests along the banks, is
suggested as a reason (Padovan 2003). DO concentrations also cycle with the tides to a
minimum at low tide with outflow from the arms, and are restored on the incoming tides with
well oxygenated coastal seawaters.
Turbidity is proportional to the suspended solids concentration, which has an influence on
nutrient biogeochemistry by not only affecting light quality, and therefore photosynthesis, but
also by providing particle surfaces for adsorption/desorption reactions and microbial
colonisation. Darwin Harbour turbidity varies from 1 to >30 NTU (Padovan 1997, Padovan
2003, Report Cards 2009-10). It is variable over time, location and with depth. This variability
is attributed to fluctuation in tidal currents during a day and from neaps to springs; it is also
affected by characteristics of the sediments (grain size, cohesiveness) over which they flow
and water depth. Increased turbidity in the wet season has been attributed to wash-off from
catchment soils, but the magnitude is not great (means: 4 & 12 NTU, Dry to Wet). However,
other mechanisms, such as the dispersion of mangrove sediments associated with brackish
waters (originating from freshwater inflow) may also contribute to upper estuarine high
turbidity in the wet season.
Chlorophyll a (Chl a) gives a measure of phytoplankton biomass. Its range is <0.5–3.0 µg/L for
data over time in the main body of Darwin Harbour (Padovan 1997, McKinnon et al. 2006,
Report cards 2009–12). During 2004, McKinnon et al. (2006) observed that harbour-wide
mean concentrations were uniformly low throughout the year (wet season, 0.77 µg L–1; dry
season, 0.89 µg L–1). Peaks of up to 8 µg/L Chl a have been observed in harbour arms, but are
typically 25% of that concentration; however, Chl a levels can be an order of magnitude higher
in tidal creeks affected by WWTP discharges. Chl a is reported not to vary seasonally but
episodically through the year (Padovan 1997).
Other water-column data relevant to Darwin Harbour, obtained in 2003 (McKinnon et al.
2006), are presented in Table 1.
Page 16
16
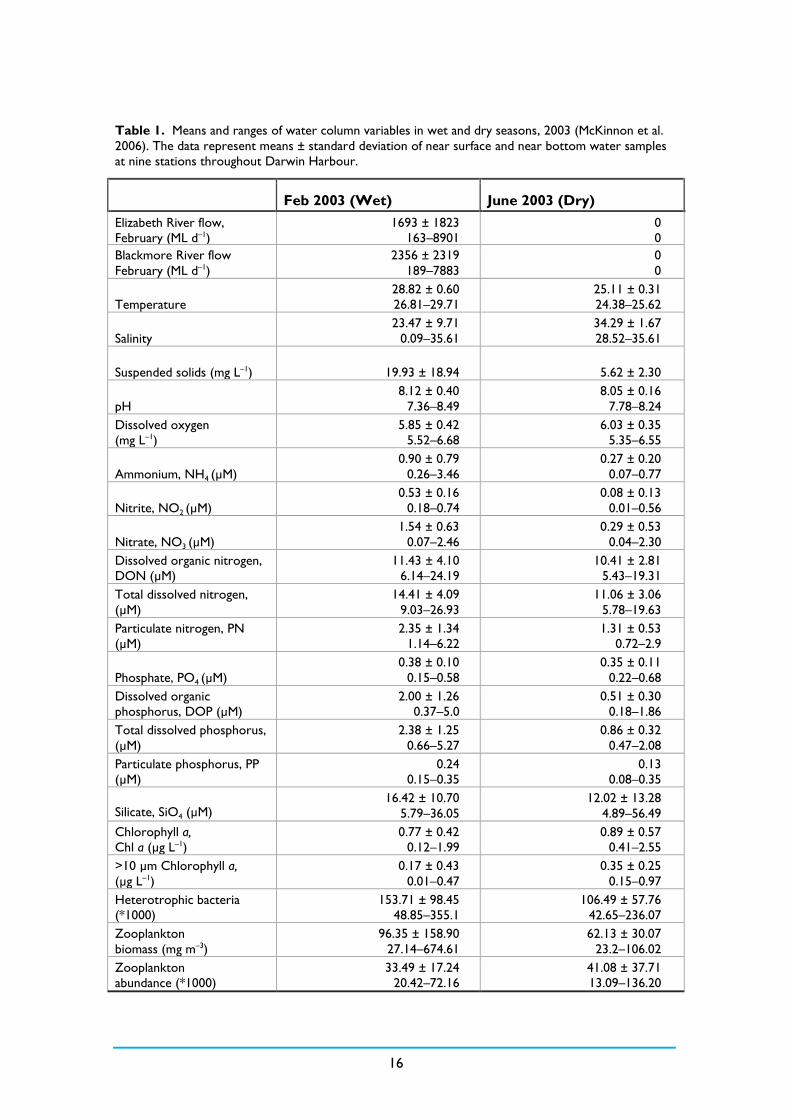
Table 1. Means and ranges of water column variables in wet and dry seasons, 2003 (McKinnon et al.
2006). The data represent means ± standard deviation of near surface and near bottom water samples
at nine stations throughout Darwin Harbour.
Feb 2003 (Wet) June 2003 (Dry)
Elizabeth River flow,
February (ML d–1)
1693 ± 1823
163–8901
0
0
Blackmore River flow
February (ML d–1)
2356 ± 2319
189–7883
0
0
Temperature
28.82 ± 0.60
26.81–29.71
25.11 ± 0.31
24.38–25.62
Salinity
23.47 ± 9.71
0.09–35.61
34.29 ± 1.67
28.52–35.61
Suspended solids (mg L–1)
19.93 ± 18.94
5.62 ± 2.30
pH
8.12 ± 0.40
7.36–8.49
8.05 ± 0.16
7.78–8.24
Dissolved oxygen
(mg L–1)
5.85 ± 0.42
5.52–6.68
6.03 ± 0.35
5.35–6.55
Ammonium, NH4 (µM)
0.90 ± 0.79
0.26–3.46
0.27 ± 0.20
0.07–0.77
Nitrite, NO2 (µM)
0.53 ± 0.16
0.18–0.74
0.08 ± 0.13
0.01–0.56
Nitrate, NO3 (µM)
1.54 ± 0.63
0.07–2.46
0.29 ± 0.53
0.04–2.30
Dissolved organic nitrogen,
DON (µM)
11.43 ± 4.10
6.14–24.19
10.41 ± 2.81
5.43–19.31
Total dissolved nitrogen,
(µM)
14.41 ± 4.09
9.03–26.93
11.06 ± 3.06
5.78–19.63
Particulate nitrogen, PN
(µM)
2.35 ± 1.34
1.14–6.22
1.31 ± 0.53
0.72–2.9
Phosphate, PO4 (µM)
0.38 ± 0.10
0.15–0.58
0.35 ± 0.11
0.22–0.68
Dissolved organic
phosphorus, DOP (µM)
2.00 ± 1.26
0.37–5.0
0.51 ± 0.30
0.18–1.86
Total dissolved phosphorus,
(µM)
2.38 ± 1.25
0.66–5.27
0.86 ± 0.32
0.47–2.08
Particulate phosphorus, PP
(µM)
0.24
0.15–0.35
0.13
0.08–0.35
Silicate, SiO4 (µM) 16.42 ± 10.70
5.79–36.05
12.02 ± 13.28
4.89–56.49
Chlorophyll a,
Chl a (µg L–1)
0.77 ± 0.42
0.12–1.99
0.89 ± 0.57
0.41–2.55
>10 µm Chlorophyll a,
(µg L–1)
0.17 ± 0.43
0.01–0.47
0.35 ± 0.25
0.15–0.97
Heterotrophic bacteria
(*1000)
153.71 ± 98.45
48.85–355.1
106.49 ± 57.76
42.65–236.07
Zooplankton
biomass (mg m–3)
96.35 ± 158.90
27.14–674.61
62.13 ± 30.07
23.2–106.02
Zooplankton
abundance (*1000)
33.49 ± 17.24
20.42–72.16
41.08 ± 37.71
13.09–136.20
Page 17
17
Nutrient cycling in mangroves
Our discussion of nutrient cycling in Darwin Harbour begins with the mangroves, moves to
the intertidal mudflats and adjacent subtidal sediments, and finishes with the pelagic system in
the harbour waters.
Mangroves occupy two-thirds of Darwin Harbour’s foreshore (204 km2; Brocklehurst &
Edmeades 1996) and are one of the main contributors to nutrient cycling in Darwin Harbour
(McKinnon et al. 2006). These forests are diverse in having 36 species—half of the world’s
mangrove inventory. Knowledge of mangroves in the harbour has been reviewed by
McGuinness (2003).
Mangrove systems are important barriers structurally, but also to pollutants (such as nutrients
and metals) entering the harbour because they act as filtering systems (Alongi 2009). They are
also one of the most productive ecosystems globally, with an average productivity of 2,500 mg
C m–2, often four-fold greater than adjacent coastal waters (Jennerjahn & Ittekkot 2002). They
are the most productive component of Darwin Harbour (1,609,220 t C y–1; Burford et al.
2008). The movement of organic matter and nutrients in and out of the forests is driven by
tidal exchange. Originally, it was thought there was a large efflux of organic matter out of
these systems into the tidal creeks and coastal waters beyond (Robertson & Duke 1990), but
the current view is that they are more parsimonious with export of carbon (Bouillon et al.
2008), and almost certainly other nutrients. Alongi and McKinnon (2005) observe that
although particulate matter export is significant, it is refractory aged litter that is nutritionally
very poor with an average C:N ratio of 52:1.
Burford et al. (2008) have estimated a nutrient demand for mangroves of 12,750 t N y–1 and
1,380 t P y–1 from the data of McKinnon et al. (2006). This places mangroves second to only
pelagic phytoplankton for nutrient uptake in Darwin Harbour (see below).
Based on knowledge of other tropical ecosystems, we can infer properties of mangrove
systems in Darwin Harbour:
the bulk of the N and P required by mangroves in Darwin Harbour will be provided
by heterotrophic microbial activity in the mangrove sediment, with possibly the
mangroves stimulating the bacteria by root excretion of organic matter (Nedwell et
al. 1994);
aside from microbial aerobic respiration and anaerobic sulphate reduction, recent
evidence also supports iron respiration in the sediments (Kristensen et al. 2008);
the mangrove trees themselves harbour nitrogen-fixing bacteria (in their bark –
Uchino et al. 1984, and in their pneumatophores – Lugomela & Bergman 2002), and
so have a direct source of supplementary DIN;
efflux of carbon and nitrogen out of these systems will be limited owing to the
sediment characteristics (reducing redox potentials and fine grain size) and microbial
activity—this is supported by stable isotope studies (e.g. Bouillon et al. 2008);
tannins released from the trees are important in regulating DON, particularly its
retention in the system (Maie et al. 2008, Alongi 2009);
other than mangrove litter, the other important autochthonous carbon source (and
consumer of nutrients) are benthic microalgae (Kristensen et al. 2008)
Nutrient cycling in mud flats and sediments
Tidal mud flats are primary depositional sites in macrotidal systems, such as Darwin Harbour,
for organic carbon exported from the catchment, other anthropogenic sources and whatever
Page 18
18
escapes mangroves. The high POC concentrations on the mudflats are augmented by in-situ
benthic microalgal production. Even though the intertidal mudflats (557. 3km2, 226,210 t C y-1)
and the subtidal mudflats (660 km2, 227,800 t C y–1) were individually double and more the
area of mangrove forests, they were a fraction of the productivity of the last (Burford et al.
2008). They were both measured at ~14% of mangrove gross productivity.
Nevertheless, the high organic C load on both types of mudflat, from allochthonous and
autochthonous sources, has a high nutrient demand. This respiratory requirement for N (by
heterotrophic bacteria) would appear to be met by the highest rates of N-fixation observed in
the harbour (intertidal mudflats, 2733 t N y–1; subtidal mudflats, 1956 t N y–1 – Burford et al.
2008), because N import to and export from the mudflats were negligible, although we do not
know what amount of recycled N became available from diagenesis deeper in the sediments.
Studies from an intertidal mudflat in a temperate climate (Huon Estuary, Tasmania; Cook et al.
2004) suggest that organic C from terrestrial run-off is refractory. That which is produced in
excess by MPB when living (e.g. exopolysaccharides when nutrient limited) or subsequently
from dead cells of MPB and pelagic phytoplankton is much more labile, and available to
heterotrophic organisms (Goto et al. 1999). We do not know if the same source distinction
as to the nature of organic carbon applies under tropical conditions.
Rates of denitrification have not been measured anywhere in Darwin Harbour, apart from a
handful of measurements in a couple of tidal creeks (see below). This is a critical deficiency. As
we have recounted above in discussing the N cycle generally, it is the concentration of organic
matter that can determine whether nitrogen fixers (low C) are active, or if they are
supplanted by denitrifiers (high C) (Fulweiler et al. 2007). The productivity of nitrogen fixers
on harbour mudflats—intertidal or subtidal—suggests that much of the organic carbon in
mudflat sediments is refractory (i.e. not bioavailable, or its degradation by possibly a
specialised group of microbes is very slow).
The availability of nitrate in sedimentary environments suitable for denitrifying bacteria can be
another constraint on their activity. This hindrance might ensue from competition for nitrate
between denitrifiers and decomposing bacteria, with the latter group immobilising or shielding
the nitrate for their own use (Alongi 1988, Rivera-Monroy & Twilley 1996).
In coastal sediments, especially intertidal sediments, coupled nitrification/denitrification (i.e.
oxidation of ammonia to nitrate, then stepwise reduction to N2 via N2O) is the dominant
denitrification process. The cycle of tidal inundation and exposure imposes a sedimentary
oscillation between oxic–suboxic/anoxic conditions, suiting the different redox potentials
required by nitrifiers and denitrifiers (Rivera-Monroy & Twilley 1996). Such conditions should
be optimal in mangrove sediments and their adjacent intertidal mudflats. Although the
mangroves might be proficient at preventing loss of essential nutrients in dissolved form to
nearby aquatic environments, they cannot prevent loss of some nitrogen to the atmosphere
(Alongi 2009).
A comparison of the nutrient cycling in intertidal mud flats of two tidal creeks (Myrmidon and
Buffalo Creeks) that receive elevated levels of nutrients from WWTPs is instructive about
overloading the harbour’s sensitive receiving environments. Based on sediment nutrient flux,
the nutrient assimilation capacity has been exceeded in Buffalo Creek but not at Myrmidon
Creek (Burford et al. 2012, Smith et al. 2012). The assimilation capacity of the former’s
sediments has been swamped so that N and P build up in the water column. The critical factor
for two creeks receiving similar nutrient loadings seems to be flushing time, determined by
Page 19
19
tidal exchange: 3, 1.6–4.8 d (Buffalo Creek) compared with 0.3–0.6 d (Myrmidon Creek)
(Burford et al. 2012). In comparing the contaminated Myrmidon Creek with uncontaminated
Reference Creek, Smith et al. (2012), found confirmation that Myrmidon Creek’s sediments
were in functional condition; it and Reference Creek had similar rates of benthic respiration
(65–92 mmol C m–2 d–1), and were comparable with Darwin Harbour generally (65–74 mmol
C m–2 d–1). It was only Buffalo Creek that was anomalous (271–391 C m–2 d–1).
In Reference and Myrmidon Creeks, denitrification was consistently high (5.50–6.83 mmol N
m–2 day–1), while at Buffalo Creek, it was low and variable (Smith et al. 2012; K Gibb, personal
comm., reports denitrification completely shut down in some areas of Buffalo Creek).
Denitrification efficiency was high (83–97%) at the former two creeks, but was <10% at
Buffalo Creek.
Nutrient cycling in the water column
Despite the sometimes high turbidity of Darwin Harbour seawaters that often limit the
euphotic zone to the top 10 m (Padovan 1997), it is a net autotrophic system (mean PG/R 2.1
observed for studies in 2004 and 2006; Burford et al. 2008). Primary production is high in the
thin surface layer; highest surprisingly in the wet season (mean net production of 2.2 ± 0.8 g C
m–2 d–1; c.f. dry season, 1.0 ± 0.2 g C m–2 d–1; McKinnon et al. 2006). Gross pelagic production
at 395,170 t C y–1 is second only to the mangrove production around the perimeter of the
harbour (Burford et al. 2008). In terms of nutrient demand (56,000 t N y–1 and 3300 t P y–1),
pelagic phytoplankton are the dominant mechanism for uptake of N and P throughout the
harbour.
The high production in Darwin Harbour surface waters is not translated to high microalgal
biomass. Mean harbour-wide Chl a concentrations are likely to be < 4µg/L Fortune (2010) or
even <1.0 µg/L, regardless of season (see above and Table 1). Horizontal distribution of
biomass is influenced by season; phytoplankton are washed out of the river arms during the
wet season, but the arms favour blooms during the dry season—possibly because of limited
flushing and availability of nutrients (McKinnon et al. 2006). Distribution of Chl a is generally
uniform with depth in the water column; except that in the wet season, near-surface levels
were greater than deeper (2 m vs. 20 m), possibly resulting from light limitation. Tidal mixing
is likely to work against phytoplankton, even motile forms, migrating to optimal light levels,
and Padovan (1997) has suggested that turbulence keeps phytoplankton in suspension, whilst
bed shear stress will resuspend benthic phytoplankton.
Pelagic primary production in the tropics is dominated by picoplankton (cell diam. <2 µm –
e.g. cyanobacteria and pico-eukaryotes); Padovan (1997) also tabulates the dominance of the
smallest cell sizes in his cell counts from three locations in Darwin Harbour. The
prochlorophyte Synechococcus is a ubiquitous species; during the wet season, it is displaced to
the outer harbour, but is distributed harbour-wide through the dry season (McKinnon et al.
2006). A greater proportion of Chl a is in larger cells (>10 µm, e.g. diatoms) during the dry
season (39% c.f. 22%) in the arms of the harbour.
A very recent survey of Darwin Harbour’s East Arm has shown a more general shift in
community structure between the wet and dry seasons (Dostine 2013); phytoplankton are
least abundant, but most diverse during the former. Diatoms (with Chaetoceros, Bacteriastrum
and Asterionellopsis, typical of tropical marine waters) were just over half of the summed cell
density and dinoflagellates were a little under 30% for the survey period June 2010 to June
3 Tidal exchange quite often underestimates residence times in upper arms of Darwin Harbour; and
therefore, can overestimate flushing rates.
Page 20
20
2012. Weak correlation was noted for the microalgal community with salinity and nitrate
(explaining <40% of the variation), which suggests that other factors are involved (see Section
2.1). Harbour location influenced community structure; communities differed as a function of
N concentration.
So far, we have considered only the phytoplankton and phytoplankton dynamics; their
community composition will be influenced by nutrient ratios (C:N, N:P and N:Si;
Harris 2001b) and availability of micronutrient metals—deficiency or excess (Butler 1998). As
we have remarked above, phytoplankton remove nutrients from seawater in the Redfield
Ratio proportions (C:N:P 106:16:1), and phytoplankton production (with associated nutrients)
is generally thought to be efficiently remineralised and recycled. Therefore, they do not
themselves cause gross changes in nutrient ratios (with the possible exception of diazotrophs
augmenting N). The dissolved N:P ratio outside Darwin Harbour (Timor Sea) is 30:1, but
inside the harbour it is less than Redfield Ratio and down at 4.9:1 for dissolved inorganic N
and P (DIN + urea : phosphate; Burford et al. 2008). McKinnon et al. (2006) estimated
depletion time for depth integrated DIN stocks of 1.6 d in the wet season and 0.8 d in the dry
season; the equivalent estimates for phosphate were 3.3 d and 6.8, respectively. This they
indicated was further evidence of N limitation for phytoplankton in Darwin Harbour. Indeed,
it is also evidence that bacteria are active, because they have the potential to radically alter
nutrient ratios. We have already indicated that denitrifying bacteria are postulated as the main
agents for causing the change of N:P ratio in Darwin Harbour, and in estuaries and coastal
waters generally, through their removal of DIN as N2.
There is currently no data available on the heterotrophic bacteria in Darwin Harbour. It is
possible that they might exploit situations that phytoplankton struggle under. For example,
with freshwater flow in tidal creeks during the wet season, the phytoplankton community
declines (Butler et al. 2005), possibly as a result of increased turbidity. Such conditions, along
with increased organic carbon (bioavailable) could favour heterotrophic bacteria. If such did
eventuate, and more widely in the harbour, then it would be conceivable that heterotrophic
bacteria play an important role in nutrient cycling (e.g. denitrification) during the wet season.
We have to this point considered a ‘bottom-up’ perspective on primary production in Darwin
Harbour. Zooplankters, from a two-year study (2004–06) of the water body, are dominated
by mesozooplankton (>73 µm), of which 94% of these were copepods (Duggan et al. 2008).
Burford et al. (2008) reported dilution experiments that showed microzooplankton grazing
rates accounting for up to 85% of primary production. These results suggest that ‘top-down’
control of phytoplankton biomass is a possibility. Harvesting of phytoplankton by zooplankton
releases nutrients during the act of consumption, but copepods are also known for faecal
pellets that are effective in transferring nutrients directly to the sediments below (Frangoulis
et al. 2004).
Finally, although not pelagic, marine sponges have a profound influence on the water column.
They comprise a diverse and significant component of benthic communities aiding in important
functional roles—including for sponges, benthic-pelagic coupling associated with their
immense filtering capabilities (Bell 2008). Darwin Harbour is no exception, with previous
systematic studies highlighting the abundant and diverse sponge populations (e.g. Alvarez et al.
2000, Alvarez & Hooper 2009, 2010). Sponges form intimate associations with microbes
(holobionts), and through these partnerships contribute to important functional processes
such as nitrification (Schläppy et al. 2010), denitrification (Schläppy et al. 2010, Hoffmann et al.
2009) and anammox (Hoffmann et al. 2009, Mohamed et al. 2010). To date, much of the work
on denitrification and anammox in sponges has focused on a species common to the North-
East Atlantic and Artic, leaving a gap in the knowledge of the functional potential of sponge
Page 21
21
species in Northern Australia. Given the diversity of sponges in Darwin Harbour, it is likely
some species are sinks for nitrogen.
2.3. Inputs of nutrients to the harbour
The largest source of nutrients in Darwin Harbour is suggested from the sea (Beagle Gulf);
Burford et al. (2008 and references therein) reported net ocean inputs of 15,015 t N/y and
1,087 t P/y. The same researchers also reported substantially lower atmospheric inputs via N
fixation by the intertidal mudlflats (2,733 t N/y), subtidal sediments (1,956 t N/y) and
mangroves4 (220 t N/y). N fixation in the water column was not considered to be a major
input (Burford et al. 2008), owing to the low concentrations of chlorophyll a in Darwin
Harbour (McKinnon et al. 2006). Moreover, N input from direct rainfall is minor (194 t N/y;
Burford et al. 2008 and references therein).
Diffuse source loads from catchment runoff during the wet season would also contribute
nutrients to the Darwin Harbour (via rivers and creeks); albeit a relatively minor input
compared to oceanic and atmospheric sources. Catchment N and P loads into Darwin
Harbour for a typical wet season (1.7 m rainfall) were determined to be 722 t and 42 t,
respectively (Skinner et al. 2009). Catchment loads entering Darwin Harbour are proportional
to the annual rainfall, so nutrient loads can vary from 413–1,150 t N and 22.7–67.1 t P over
the range of wet season rainfalls (i.e., 1.0–2.7 m; Skinner et al. 2009). Most of these nutrients
are derived from the two largest sub-catchments: Blackmore River (63,471 ha; 191 t N and
8.7 t P during average wet season) and Howard River (54,163 ha; 174 t N and 8.95 t P during
average wet season).
Darwin Harbour catchment has an area of 2010 km2; ~80 % is undeveloped, non-pristine
savannah woodland, ~11 % is urban land-use (i.e., residential living, manufacturing/industrial
uses, roads and fence facilities) and the remaining land-uses are rural (Skinner et al. 2009).
These different land-uses can influence the nutrient loads entering Darwin Harbour.
Blackmore River and Howard River catchments are largely undisturbed/rural but they
contribute a substantial fraction of catchment nutrient loads to Darwin Harbour because of
their sheer size. Although representing a small fraction of the catchment, urban land-use
contributed a disproportionately higher nutrient load to Darwin Harbour compared to
rural/undeveloped areas (Townsend 1992; Schult 2004; Skinner et al. 2009). Urban
development changes overland flow paths, reduces infiltration to groundwater and decreases
the time runoff takes to enter rivers and creeks (Skinner et al. 2009); this effectively increases
the volume of runoff, and thereby, increases transportation of pollutants into receiving waters
and ultimately Darwin Harbour.
Higher concentrations of TN and TP were reported for urban (Moil and Karama) and
industrial (Winnellie) catchments compared to rural/undisturbed catchments (Kernohan and
Townsend 2000; Padovan 2001a; Padovan 2001b; Padovan 2002; Schult 2004; Skinner et al.
2009). Future developments within the catchment are likely to increase nutrient loads into
Darwin Harbour. For an average wet season, proposed future developments could increase
annual loads of N and P to 991 t and 70 t, respectively (Skinner et al. 2009); this equates to
increases of 37 % TN and 67 % TP.
A large proportion of nutrients entering Darwin Harbour from predominantly
rural/undisturbed catchments (e.g. Blackmore, Elizabeth, Howard, West Arm, Woods Inlet)
are probably not readily bioavailable, as P largely exists as particulates and most N compounds
4 Wilson et al. 2004 reported 1.28–3.38 kg N/ha and 0.14–0.96 kg P/ha can be exported into the
harbour with mangrove drainage over the tidal cycle.
Page 22
22
are likely to be organic (Padovan 2001b, Drewry et al. 2010a, Drewry et al. 2010b, Darwin
Harbour Region Report Card 2012); whereas ammonia, nitrite and nitrate are minor
constituents of the N pool but have ecological significance. Nutrients from aquaculture
operations in the Blackmore River catchment will be bioavailable, but they are estimated as a
minor load (~1%; Julia Fortune, personal communication).
In contrast, nutrients from urban (Moil) and industrial (Winnellie) catchments are likely to be
more bioavailable due to greater fractions of dissolved P and N compared to
rural/undisturbed catchments (Schult 2004; Skinner et al. 2009); the latter predominantly
exists as nitrate. The greater proportion of nitrate derived from urban/industrial catchments
may be attributed to the sparsity of vegetation (compared to rural/undisturbed areas), which
would typically intercept and take up dissolved nitrate (Skinner et al. 2009).
Schult (2004) observed seasonal trends in the concentration and fractionation of nutrients
from rural (Bees Creek and Elizabeth River) catchments; elevated TN, TP as well as dissolved
N and P were typically detected in the early wet season, but they rapidly decreased within the
first two months of the wet season. This first flush of nutrients was also observed in an
industrial catchment (Winnellie; Padovan 2001a). In addition to seasonal effects, tidal cycles
are known to influence the flux of loads in and out of Darwin Harbour. During neap tide, TN
exported to Darwin Harbour from Blackmore river estuary was greater than that imported
by up to 56 % (Wilson et al. 2004). However, during spring tide, TN imported into the
estuary was greater by 10 %. Wilson et al. (2000) reported that TP load exported to Darwin
Harbour was greater than that imported by at least 20 % (Blackmore River estuary, spring
tide) and up to 45 % (Middle Creek, spring neap tide).
In addition to catchment loads from diffuse sources, nutrients can also enter Darwin Harbour
via point sources; these are mainly from wastewater treatment plants. Based on 2006
discharge data, 321 t N/y and 102 t P/y entered Darwin Harbour from wastewater discharges
(Skinner et al. 2009). In comparison to catchment loads, wastewater contributed a significant
fraction of the annual load of nutrients (particularly P) into Darwin Harbour (Townsend 1992;
Padovan 2001a; Skinner et al. 2009); 71 % P and 31 % N were due to wastewater discharges
(Skinner et al. 2009). Point source nutrient loads are likely to increase as the population
grows. Skinner et al. (2009) estimated wastewater-derived P and N could increase up to 80 %
and 50 % of annual loads, respectively, with a doubling of the population.
Skinner et al. (2009) estimated point and diffuse sources contributed 1,043 t N/y and 144 t P/y
into Darwin Harbour, which is relatively minor compared to oceanic (15,015 t N/y and 1,087
t P/y; Burford et al. 2008 and references therein) and atmospheric inputs (4,909 t N/y from N
fixation by intertidal mudlflats, subtidal sediments and mangroves; Burford et al. 2008). Hence
nutrient loads from point and diffuse sources related to human activity is unlikely to
substantially affect biogeochemical processes on a whole of harbour scale, but may be
significant at local scales (e.g., tidal creeks or upper reaches of estuary; Skinner et al. 2009).
While nutrient loads from land-based diffuse and point sources have been reported widely,
there is a lack of information on groundwater nutrient inputs into Darwin Harbour. Although
most rivers/creeks cease to flow by June, the Howard River and Berry Creek continue to flow
during the dry season from groundwater inflows (Skinner et al. 2009 and references therein).
Hence, groundwater nutrients can potentially contribute to loads to Darwin Harbour, albeit
minor compared to oceanic and atmospheric inputs. Some insights come from neighbouring
catchments to Darwin Harbour: consistently elevated nitrate concentrations were measured
in the Douglas River (near Oolloo Road bridge in Daly catchment; Townsend et al. 2002,
Schult and Metcalfe 2006); this was attributed to contaminated groundwater, possibly from
agricultural developments in the region, but may also result from weathering of dolomite rock
Page 23
23
(Coughanowr 2001) in this catchment (and could also apply to Berry Creek dolomite
outcrops in Darwin Harbour catchment). Schult and Metcalfe (2006) estimated the nitrate
load of Douglas River was ~17 kg/day, which was 16 times greater than that for the Daly
River. All other nutrient loads were greater in the Daly River, in accordance with its much
larger flow volume (Schult and Metcalfe 2006). The high nitrate concentration in the Douglas
River can potentially adversely influence the Daly River water quality. Despite the elevated
nitrate concentration in the Douglas River, high phytoplankton concentrations were not
measured downstream owing to phosphorus limitation in freshwaters (Townsend et al. 2002).
2.4. Fates of nutrients
The fate of nutrients depend on their biogeochemical properties, the pathways open to them
and the environmental conditions that apply in the subject domain (in this case, Darwin
Harbour). Despite a rich supply of information on nutrient inputs and at least reasonable
knowledge, albeit with some gaps, of cycling and standing stocks in the harbour itself, there is
scant information on fates of nutrients, apart from a report concerning mangrove sediments
(Welch et al. 2008), and another concerning short-term fate in tidal creeks (Smith et al. 2012).
Nitrogen and phosphorus differ markedly in the pathways open to them. We have
summarised these above (Section 2.1 and Figures 2–4). The ultimate sink for both is burial in
estuarine, coastal or even offshore marine sediments. However, it is a case of how long they
can keep cycling to avoid that terminal fate (in sub-geological time). Nitrogen has more
options here, because it can evade to the atmosphere as N2, and other volatile inorganic (e.g.
N2O and NO) and organic forms (e.g. short-chain alkylamines). The only volatile form of P is
phosphine that is so highly reactive and only produced in such trace quantities under strongly
reducing (anoxic) conditions that it can be ignored (Weber 1999).
When considering effective nutrient assimilative capacity for a system, such as Darwin
Harbour, the sinks that are relevant are of two types. The first are those that remove the
nutrient element from the system entirely; the second—within the system—quarantine or
sequester it sufficiently long that natural correction or remedial action has time to act.
Denitrification and deep burial in sediments are examples of the former; locking up nutrients
in the trunk of a mangrove might be an instance of the latter. However, the assimilation of
nutrients by phytoplankton would not satisfy the second criterion if the bulk is returned to
the water column by in-situ remineralisation or diffuses back across the sediment-water
interface after early sedimentary diagenesis to be available for the next growth period of
phytoplankton. Because then, the recycled supply of nutrients combines with inputs from
terrestrial run-off, WWTP discharges and diffuse urban supply to increase the available
nutrient stock year by year.
The Port Phillip Bay Environmental Study (Harris et al. 1996) revealed the importance of
denitrification in the bay’s sediments in dealing with N in the nutrient load delivered directly
from the urban area of Melbourne, or via the Melbourne Water Western Treatment Plant at
Werribee.
The most suitable analogue for discerning the probable fates of N and P (and if required, C) in
Darwin Harbour would seem to be the work of Alongi and McKinnon (2005). Along with
terrestrially derived sediments, they considered the cycling and fate of nutrients to the coastal
zone of the Great Barrier Reef shelf. Although the GBR differs in not being a macrotidal
system, their study site at Princess Charlotte Bay is at a latitude very similar to Darwin. Their
major findings form a basis for testing in Darwin Harbour:
Page 24
24
microbial communities in coastal waters and in unconsolidated sediments metabolise
nutrients equivalent to the entire dissolved and particulate nutrient load arriving from
land;
nearly all nitrogen is ultimately returned to the atmosphere via denitrification;
there is little net burial of nutrients in subtidal sediments;
despite significant re-suspension, sedimentation fluxes are sufficient to balance benthic
mineralisation rates;
mangroves and tidal flats trap, transform, and store a disproportionate amount of
sediment and organic matter;
Page 25
25
3. Nutrient assimilative capacity in Darwin Harbour—
thresholds and the means of assessing them and predicting
their advent
Underlying the concept of nutrient assimilative capacity is the desire to retain a system—in
this case a coastal water body—in its present state or even to return it to an earlier favoured
one. As we commented at the outset, it is common that the concept is invoked when a
negative change has occurred, for example, deterioration or loss of a valued component of an
ecosystem (seagrass, corals, dugongs or others). Then, it is presented in the sense that
nutrient assimilative capacity has been exceeded. A better application would be in a
preventative framework with a capacity for forewarning. The payoff is not only the retention
of the prized species, but the avoiding of a severe penalty for crossing critical thresholds in the
form of system hysteresis (Harris 1999), whereby the earlier cost of pre-emptive action is far
exceeded by the cost of correction.
Another shortcoming of some impressions of nutrient assimilative capacity is that it applies to
the entirety of a water body. This view of averaging over a system, such as Darwin Harbour,
has an inherent risk: it ignores the diversity of estuarine environments, temporal changes and
other factors causing patchiness. Some locations will be more sensitive to nutrient inputs,
because of decreased assimilative capacity arising from poor flushing, low light, differences in
planktonic or microbial community at the base of the ecosystem, or other ecological factors.
Overloading these sites with nutrients will cause localised degradation. The striking example
for Darwin Harbour is Buffalo Creek. It is conceivable that because individual tidal creeks are
small components of the harbour that a couple more instances like Buffalo Creek would still
not exceed an averaged harbour-wide estimation of acceptable nutrient assimilative capacity.
What damage would this cause in possible loss of biodiversity and habitat, as well as cultural
and recreational values? The heads of the tidal creeks are small zones spatially, but they
represent a finite number of special niches.
Traditional environmental indicators5, such as phytoplankton biomass (using Chl a), seagrass
area and species, mangrove area and species, or even concentrations of nitrogen forms (Ward
et al. 1998) have their place. However, in most cases they are critical threshold indicators
(and most would be listed under ‘condition’ indicators; N is a pressure or stressor indicator).
If they have been crossed or triggered, then it is likely that damage to the ecosystem has been
done that is not easy to rectify. Certainly, they have their place in modelling simulations,
usually as the ‘end-game’—arriving at situations that are not desired.
Limited research has been done in selecting environmental indicators for estuarine and coastal
systems that are harbingers of troublesome change in trophic status. These indicators need to
be selected—and verified—not only so that they might be used in environmental monitoring,
but also that they might be tested in ecohydrological / biogeochemical models to reveal that
they do indeed precede, in sequence, the critical threshold or condition indicators. In an
extensive study of temperate estuarine lagoons along the NSW coast, Scanes et al. (2007)
have remarked on the need to use a range of indicators “to assess trends in ecological
condition of an estuarine ecosystem, particularly where stressor levels are not great”. They
noted for their study lagoons that using water-quality indicators as the sole means of
5 Some that were selected nationally—e.g. turbidity to infer phytoplankton effect on light (rather than
inorganic suspended sediment) —are appropriate for temperate regions of Australia, but entirely
unsuited for Darwin Harbour and Top End coastal waters.
Page 26
26
assessment was an inadequate practice. We shall look to select a set of indicators as a
‘multiple-strands-of-evidence’ approach in the next section.
3.1. Indicators of thresholds in nutrient assimilative capacity in a
Northern Australian macrotidal estuary
Our discussion here should be more universal than just Darwin Harbour, although it is the
focus for our recommended application. The precepts should be applicable to other tropical
macrotidal (and likely mesotidal) estuaries draining similar Northern Australian catchments.
The fundamental condition indicator Chl a concentration needs to be included in our set,
because it is a benchmark for the transition—a state change—from clearer, macrophyte-
dominated systems to more murky plankton-dominated ones (Harris 2001b). Chl a has been
routinely used as the critical output result for different N loadings in estuarine biogeochemical
models (e.g. HES 2000). It is also the indicator that will used to calibrate other selected
indicators in model studies recommended in later sections here.
Dissolved Oxygen (DO) is another indicator that would be, at first inspection, included in the
critical category. However, its declining trend can also be a useful portent of change. It will be
of particular benefit in identifying deleterious conditions in vulnerable locations in the harbour
as a result of location or temporal factors (tides, springs/neaps or seasonal). For example, in a
useful model system, a mesotidal tropical estuary with fringing mangroves adjacent to the
Hinchinbrook Channel in Queensland (at Lat. ~18° 20 S), became quite hypoxic (<2 mg L–1)
during wet-season low tides (McKinnon et al. 2010). In this case, the increased N load was
imposed by sea-cage finfish farming.
Since it is N that is the primary limiting nutrient in Darwin Harbour and most estuaries
(acknowledging that P co-limitation can possibly manifest in brackish waters of the upper
reaches and in surface-water outflow during the wet season), it is with the cycling of this
nutrient that we might have some of the most suitable threshold indicators. At this point, it is
not possible to be definitive about which step in the N cycle will prove to be the most useful
and sensitive, not to mention the most pragmatic. We are not aware of published research
that might provide guidance to the selection of such an indicator. Nevertheless, it appears that
a molecular technique specifically targeting the algae, bacteria and archaea genes involved in N
cycling (metagenome or transcriptome) will offer the advantages of specificity and sensitivity,
and that it will be ‘triggered’ before conventional monitoring of water quality would identify a
change. We do anticipate that a molecular technique targeted at bacterial activity will be the
favoured approach, because of the intimate association of bacteria with all steps of the N cycle
and because it can identify the active pathway when the end products are the same, for
example denitrification and anammox.
From our discussions above (Section 2), a few options for indicators in the N cycle might be
put forward. Denitrification would seem to be a pivotal step in the N cycle as an N sink, and
postulated as the cause of the pervasive N limitation of primary production. Therefore, a
suitable indicator might monitor the population density or activity of the denitrifiers. Recycled
production in the water column is associated with ammonia as the N source; it is turned over
quickly under N limitation. If oxidised forms of N (NOx – nitrate and nitrite) become more
readily available, arising from human activities, they fuel ‘new’ production; as a result ammonia
turnover falls away. A molecular means to track ammonia use by heterotrophic bacteria
would furnish a useful indicator. We have also commented earlier on the critical balance
between nitrogen fixation and denitrification on intertidal mudflats being influenced by labile
organic C. If this carbon substrate is an indication of increasing anthropogenic input and also
the ‘health’ of N cycling, then molecular techniques to rapidly evaluate the balance between N
Page 27
27
fixers and denitrifiers in these sediments would be insightful. Our intention is not to be
prescriptive here; this is an area for ground-breaking applied research.
Finally, the omission of potentially sensitive biological indicators (e.g. seagrass – canopy cover,
standing crop [dry wt/shoot density], epiphyte abundance, etc. (Scanes et al. 2007 and
references therein); macroalgal biodiversity and abundance) does not reflect on their
suitability for monitoring trophic status. Their impediment is that they are likely to be more
difficult to model than the rate of steps in the N cycle (mediated by bacteria).
3.2. A modelling approach to nutrient assimilative capacity, and
scenario testing
There are good examples nationally of sophisticated ecohydrological or biogeochemical6
models used to model nutrients in Australian estuaries and coastal waters—especially to study
the effects of increased N loadings: e.g. Port Phillip Bay (Harris et al. 1996, Murray &
Parslow1999), Brisbane River/Moreton Bay (McEwan et al. 1998), Swan River estuary (Robson
& Hamilton 2004) and South-East Tasmania (Wild-Allen et al. 2010). Almost without
exception, such models are applied in temperate and subtropical zones.
One ecohydrological model that has been sketched out for Darwin Harbour is that of
Wolanski et al. (2006). It is underpinned by the open-access RMA suite of models. RMA2 – a
finite-element, depth-averaged hydrodynamic model, and RMA11 – a water quality model
(with cohesive-sediment transport) have been used to describe the hydrodynamics and
sediment transport in the Darwin Harbour (Williams et al. 2006), and are used in a package
for numerous applications associated with the harbour.
A very basic application of the RMA2/RMA11 package has been used to model total N and
total P in Darwin Harbour with single decay coefficients each to simulate their uptake by
biogeochemical processes (Fortune & Maly 2009). The model was run “to estimate the total
maximum pollutant loads [from catchment run-off and WWTP discharge] to achieve water
quality objectives”. Such an over-simplification of the N and P cycling, and the other
biogeochemical influences over them, was doomed to fail to estimate a ‘nutrient assimilative
capacity’ of the harbour for all of the reasons presented in the preceding sections. It was
acknowledged in the report that the model needed to be enhanced with information on N
and P cycles among other factors.
It seems timely to review the water quality modelling of Darwin Harbour to optimise
approaches for effective management of the water body under various development and
waste-water treatment scenarios. The ten-step sequence advocated by Robson et al. (2008)
for process-based biogeochemical models of estuaries that can be used retrospectively seems
a worthwhile approach to reflect on requirements, assess knowledge gaps, and bring this
together in a systematic and holistic manner.
We shall not undertake that task here; it is the substance of another project. The outcomes
of the review using Robson and co-workers’ (2008) approach can be integrated with the
improvements that have been identified by David Williams for the RMA11 model:
Time series of nutrients fluxes at the ocean boundary
Upstream and diffuse sediment-nutrient dynamics
Speciation of Total N and Total P constituents so that the bioavailable concentrations
are better defined
6 The two descriptions will be used interchangeably.
Page 28
28
Rates of interaction of nutrients with phytoplankton and zooplankton
Rates of interaction with nutrients and sediments
Effect of sediment concentration on light availability affecting both pelagic and benthic
productivity
Microbial interaction with nutrients and sediments
Effect of salinity on cohesive sediment dynamics and nutrient interactions
Zonal differences in sediment-nutrient interactions
Very recently, work has been carried out with the RMA11 model for Darwin Harbour to get
the WQ modelling suite operative. The model inputs are the forms of N and P, as well as DO
and sediment relations; it predicts changes to microalgae and zooplankton populations.
Improvements with data coverage and process understanding for nutrients and other water-
and sediment-quality variables need to proceed in parallel with improvements to the model,
or even precede them if the model is not well developed for a particular process or set of
conditions. Only with better observational and experimental data will the revised and
enhanced model be calibrated and effectively validated.
It should be realised that in many cases, that information for water/sediment quality and
biogeochemical processes in Australia’s tropical coastal seas (especially northern waters) is
non-existent or deficient. In some cases, it will require additional monitoring; in others it will
require experimental work in microcosms, incubators, flumes and other simulators of the
tropical aquatic environment. Examples of the latter are likely to include the rate constants of
reactions/steps in the nutrient cycles.
Application of an ecohydrologic model to estimation of nutrient
assimilation capacity—scenario testing and more
Once a fully functional ecohydrologic model is in place, validated and implemented, it can be
run to identify any remaining data gaps (much in the vein of Wild-Allen et al. 2011, but
comparing the optimised sampling program with the existing monitoring sites to identify
deficiencies). After which the model can be run in a number of modes:
a) scenario testing, where existing conditions and revised nutrient loadings (in line with
proposed urban/industrial development, modified WWTP discharge figures linked to
plant improvements, etc. – see Section 2.3) are compared with water and sediment
quality objectives;
b) vulnerability resolution, where existing conditions are used to identify localities that are
most at risk of approaching or exceeding the threshold indicators identified in Section
3.1 (for example, conditions verging on hypoxic or even oxygen-deficient during low
tides in the wet season (per McKinnon et al. 2010); it is presumed that tidal creeks
and estuary arms with longer residence times of stratified bottom waters will be most
at risk);
c) a combination of a) and b) for refined scenario testing.
As further developments proceed with threshold indicators (e.g. pin-pointing of steps in N
cycle, and possibly other nutrient cycles, that are most sensitive to deleterious change), they
should be incorporated into modes b) and c) for updating results.
It is worth reiterating that the applications of the model envisaged here are not whole-of-
harbour results, but are targeted to produce results on site-to-site, case-by-case basis. The
Page 29
29
latter approach is far more likely to guarantee protection of vulnerable, high-value
components of the combination of ecosystems that make up Darwin Harbour.
Page 30
30
4. Knowledge gaps and their filling
This section is a brief listing of knowledge gaps (and logically going back to data gaps in some
instances), with commentary as necessary. It considers these under three headings:
monitoring, process understanding and modelling. In reviewing these gaps, we have decided
not to be specific about the order in which they are tackled. We suspect many can be tackled
in parallel, because there is not interdependence among them, apart from modelling relying on
some new knowledge from process studies or the generation of rate constants (decay
coefficients) in experimental studies.
4.1. Monitoring
Ambient estuarine water quality of Darwin Harbour is monitored by the Aquatic
Health Unit (AHU; Department of Land Resource Management), with more specific
monitoring being undertaken under license conditions set by the Northern Territory
Environmental Protection Agency. Monitoring for turbidity and other water quality
parameters by the AHU has been standardised to neap conditions in order reduce the
influence of tidal conditions on turbidity and facilitate temporal comparisons. This
means, however, that the results are biased toward conditions when suspended solids
are at a minimum during the lunar tidal cycle (springs/neaps). According to Padovan
(2003), this could also bias results for Chl a, total P and metals, and warrants definitive
assessment. Some supplementary sampling is suggested in the vein of observations by
Wilson et al. (2004) in Middle Arm.
Dissolved organic N (DON) is overwhelmingly the largest fraction of total N. It is
suspected that a fraction of this is bioavailable. A method should be implemented to
gauge this fraction. It is also relevant to modelling the N cycle.
Dissolved oxygen (DO) is one of our threshold indicators. It is not presently being
reported as part of the ambient estuarine water quality program, because “Water
Quality Objectives are currently under revision”. This situation needs to be resolved
for such an important parameter.
Bacterial activity (especially heterotrophic bacteria processing of organic matter inputs
– Furnas et al. 2011) is likely to outweigh that of all other life forms in Darwin
Harbour. Simple tests should be included with the regular monitoring to characterise
densities of key functional groups and their level of activity in waters and sediments.
Nutrient levels in sediment substrates need only be measured infrequently, because
they are unlikely to change rapidly (unless some other critical variable such as DO
changes); concentrations of nutrients in sediment porewaters are of interest, but in
the context of sediment-water exchange (see Section 4.2).
Contaminants, such as metals/metalloids, persistent organic pollutants (e.g.
organohalides, PAHs and tributyltin), endocrine-disruptive compounds and other
toxicants need to be monitored on a semi-regular basis, because they can disrupt
biological pathways critical for effective nutrient assimilation. Since sediments are an
integrator of contaminants in the water column, they would be the preferred
monitoring medium.
More automated monitoring is needed of water column and sediment variables7,
which either come under the environmental health objectives or are important
ancillary data. Furthermore, a goal should be to network these around the harbour
and catchment (irrespective of provider), such that data is collected and stored under
a unified and accredited data management system. Freedom of access to this data
7 For example, the benefit of ruggedised, automated turbidity loggers for all-year-round monitoring of
sediment and nutrient loads into coastal waters has been well demonstrated in Schaffelke et al. (2007)
Page 31
31
should be a driver for a comprehensive view of the total system from which all
stakeholders benefit.
4.2. Process understanding
The largest gap in this category would appear to be measurement of denitrification,
which is postulated as the reason for N-limitation in Darwin Harbour. Key areas for
information are the intertidal and subtidal mudflats, but corroboration of estimates in
mangrove sediments would also be worthwhile.
Benthic nutrient processing within soft sediments (e.g. mudflats) of Darwin Harbour
have been reasonably covered, with the exception of the dot point immediately above
and possibly also macrophytes. Hard substrates, and particularly the organisms (e.g.
sponges, macroalgae and corals) that reside there, have not been incorporated so far
into evaluation of nutrient cycling and assimilation. As we have remarked in the body
of the report, sponges owing to their filtering capacity, are a serious omission.
Nutrient exchanges across interfaces (viz. sediment–water, particle–water, air–sea,
etc.) need to be characterised better, in both field and laboratory experiments.
The preceding three points should go a long way to make this next one possible—the
harbour is in need of comprehensive N and P budgets (building on Fortune and Maly
(2009), and in the fashion of Furnas et al. (2011)). Currently, terrestrial input data is
reasonable, as are standing stocks, but sinks are poorly known.
The underwater light environment in Darwin Harbour is inadequately known, as is the
influence of light (or in reality, the attenuation of light by turbidity) on primary
production in the water column and the shallow sediments beneath. For the main
body of the harbour, all observations reported are of a net autotrophic system
(McKinnon et al. 2006, Burford et al. 2008), but this is not true of the limited number
of tidal creeks studied (Smith et al. 2012). Is this also true of the estuary arms in the
wet season, and how widespread is the phenomenon? Is light implicated?
Padovan(2003) indicates that the effect of time-dependent events (e.g. tide,
springs/neaps and seasons) on water quality is poorly known for tidal creeks; it is not
clear whether more recent studies (Burford et al. 2012, Smith et al. 2012) have
resolved this situation adequately.
Use of stable isotopes of N (15N) and C (13C) should be regularised to assist with
assignment of sources of N and C, as should possibly other practical techniques that
assist in tracking nutrients’ inputs.
4.3. Modelling
A set of modelling gaps were listed immediately before this section, so they will not be
repeated here. Additional gaps identified in other reports not covered in the previous list are
included:
Focussed measurements (as/not part of AHU monitoring) in the outer harbour to
improve the model’s boundary conditions.
Confirm net input of C and N to harbour from marine sources.
A constantly evolving conceptual diagram of N cycling (and its confrere elements C, S,
P and Si) is needed as the common language among scientists and informed managers
responsible for monitoring, process understanding and modelling of Darwin Harbour.
Although not a gap in itself, improvements in monitoring and process understanding
need to be implemented in revisions of the model (as should insights from the
modelling be factored back into monitoring or studies to improve process
understanding).
Page 32
32
5. Summary and Conclusions
For a concept that does not appear to have a binding definition when applied to estuarine
waters or coastal seawaters, we have defined it in practice for this report with two provisos:
Nutrient assimilative capacity is the scope of the system to incorporate nutrients into living
matter and sediments, so preventing build-up of nutrient concentrations in the water column, with
two important provisos—that the nutrient assimilation process within the harbour does not lead to
1) loss of estuarine or coastal biodiversity, or 2) degradation of environmental services of the
system.
With this definition in mind, existing information on nutrients and nutrient cycling in Darwin
Harbour has been reviewed. At an early stage nitrogen, N, was identified as the limiting
nutrient for primary production in the water body. Our study focussed on this element, but
we also paid heed to phosphorus, because the two macronutrients in marine and estuarine
systems are so closely intertwined, and phosphorus is seen as the “ultimate limiting nutrient”
(Tyrrell 1999) in the oceans. Where needed, other influential element cycles (i.e. C and S)
were discussed. From general knowledge on the cycling of N and P, the review moved to a
description of the distribution of these two macronutrients in Darwin Harbour, and then
focussed on nutrient cycling in key compartments of the system: mangroves, intertidal and
subtidal mudflats and the harbour’s water column. It concluded with an elaboration of nutrient
inputs and fates. Key points for Darwin Harbour include that it is generally an undisturbed
system as regards trophic status (i.e. low Chl a concentrations, DON dominates forms of N);
mangroves are the main primary producer (and an important sequester of carbon and
nutrients), with phytoplankton second; along with N, light levels and grazing are constraining
primary production in the water column; and heterotrophic micro-organisms are suspected to
be pivotal in the breakdown of particulate carbon (and nutrients) entering the harbour. Inputs
of nutrients from terrestrial run-off and human activity are currently minor, but localised
degradation cannot be overlooked (e.g. Buffalo Creek). Nutrient sinks need to be
characterised more fully.
The third section represented an important kernel of our study, because in light of the review,
we nominated a set of threshold indicators on the path of changing trophic status for Darwin
Harbour. These are chlorophyll a, dissolved oxygen and—yet to be identified by research—
one or more N cycle indicators (using molecular biology of relevant bacteria). A framework is
identified for incorporating these threshold indicators into the relevant RMA model suite and
arriving at outputs that should prove beneficial to decision making for an ecologically
sustainable future for Darwin Harbour, in the face of increased nutrient loads.
The final section looks at knowledge gaps in monitoring, process understanding and modelling,
and how they might be fulfilled with the goal of smoothing the path to robust estimates of
nutrient assimilative capacity for Darwin Harbour (see Plate A1 in the Appendix for the state
of knowledge for nitrogen in Darwin Harbour). Some important gaps included information on
denitrification harbour-wide, the capacity of sponges as nutrient assimilators, and a
requirement for more (and automated) monitoring of nutrients and other ecological variables
across the spectrum of harbour conditions (tidal, spring/neaps, seasonal and interannual). The
estimation of nutrient assimilative capacity of Darwin Harbour can be realised through a
combination of observations, experimentation and modelling; a framework has been outlined.
Yet, it is not a calculation that should be made on a whole-of-harbour basis, but from location
to location within the waterway to protect the integrity of ecological components of the full
system.
Page 33
33
Acknowledgements
We are grateful to the Aquatic Health Unit (Northern Territory Department of Land
Resource Management) for the opportunity to carry out this study, and we thank Dr Simon
Townsend for the provision of departmental information.
Page 34
34
References
Allen, A.E., Howard-Jones, M.H., Booth, M.G., Frischer, M.E., Verity, P.G., Bronk, D.A., and
Sanderson, M.P. (2002) Importance of heterotrophic bacterial assimilation of ammonium
and nitrate in the Barents Sea during summer. Journal of Marine Systems 38, 93–108.
Alongi, D.M. (1988) Bacterial productivity and microbial biomass in tropical mangrove
sediments. Microbial Ecology 15, 59–79.
Alongi, D.M. (1994) The role of bacteria in nutrient recycling in tropical mangrove and other
coastal benthic ecosystems. Hydrobiologia 285, 19–32.
Alongi, D., and McKinnon, A. (2005) The cycling and fate of terrestrially-derived sediments
and nutrients in the coastal zone of the Great Barrier Reef shelf. Marine Pollution Bulletin
51, 239–252.
Alongi, D.M. (2009) 'The energetics of mangrove forests.' Springer, New York. 216 pp.
Alvarez, B., Crisp, M.D., Driver, F., Hooper, J.N.A., and Van Soest, R.W.M. (2000)
Phylogenetic relationships of the family Axinellidae (Porifera: Demospongiae) using
morphological and molecular data. Zoologica Scripta 29, 169–198.
Alvarez, B., and Hooper, J.N.A. (2009) Taxonomic revision of the order Halichondrida
(Porifera: Demospongiae) from northern Australia. Family Axinellidae. The Beagle, Records
of the Museums and Art Galleries of the Northern Territory 25, 17–40.
Alvarez, B., and Hooper, J.N.A. (2010) Taxonomic revision of the order Halichondrida
(Porifera: Demospongiae) of northern Australia. Family Dictyonellidae. The Beagle,
Records of the Museums and Art Galleries of the Northern Territory 26, 13–36.
Bell, J.J. (2008) The functional roles of marine sponges. Estuarine, Coastal and Shelf Science 79,
341–353.
Benitez-Nelson, C.R. (2000) The biogeochemical cycling of phosphorus in marine systems.
Earth-Science Reviews 51, 109–135.
Bouillon, S., Connolly, R.M., & Lee, S.Y. (2008) Organic matter exchange and cycling in
mangrove ecosystems: recent insights from stable isotope studies. Journal of Sea Research,
59, 44–58.
Brandes, J.A., Devol, A.H., and Deutsch, C. (2007) New developments in the marine nitrogen
cycle. Chemical Reviews 107, 577–589.
Brocklehurst, P.S., and Edmeades, B.F. (1996) Mangrove Survey of Darwin Harbour, Northern
Territory, Australia. Technical Report No. R96/7. Department of Lands, Planning and
Environment, Darwin, NT.
Bronk, D. A. (2002) Dynamics of DON. In 'Biogeochemistry of marine dissolved organic
matter’ (Eds. D.A. Hansell and C.A. Carlson), Academic Press, London. p. 153–247.
Burford, M.A., Alongi, D.M., McKinnon, A.D., and Trott, L.A. (2008) Primary production and
nutrients in a tropical macrotidal estuary, Darwin Harbour, Australia. Estuarine, Coastal
and Shelf Science 79, 440–448.
Page 35
35
Burgin, A.J., and Hamilton, S.K. (2007). Have we overemphasized the role of denitrification in
aquatic ecosystems? A review of nitrate removal pathways. Frontiers in Ecology and the
Environment, 5, 89–96.
Burt, T.P., and Pinay, G. (2005) Linking hydrology and biogeochemistry in complex landscapes.
Progress in Physical Geography 29, 297–316.
Burton, J.D., Liss, P.S., and Venugopalan, V.K. (1970). The behaviour of dissolved silicon during
estuarine mixing. I. Investigations in Southampton Water. Journal du Conseil, 33, 134–140.
Butler, A. (1998) Acquisition and Utilization of Transition Metal Ions by Marine Organisms.
Science 281, 207–209.
Butler, J., Padovan, A., and Fortune, J. (2005) The water quality of five tidal creeks in Middle
Arm Darwin Harbour. Report No. 17/2005D. Water Monitoring Branch, Natural
Resource Management Division, Department of Natural Resources, Environment and the
Arts, Darwin, NT.
Cabello, P., Roldán, M., and Moreno-Vivián, C. (2004) Nitrate reduction and the nitrogen cycle
in archaea. Microbiology 150 (Part II), 3527–3546.
Cook, P.L.M., Revill, A.T., Clementson, L.A., and Volkman, J.K. (2004). Carbon and nitrogen
cycling on intertidal mudflats of a temperate Australian estuary. III. Sources of organic
matter. Marine Ecology Progress Series 280, 55–72.
Cornall, A.M., Beyer, S., Rose, A., Streten-Joyce, C., McGuinness, K., Parry, D., and Gibb, K.
(2013) HCl-extractable metal profiles correlate with bacterial population shifts in metal-
impacted anoxic coastal sediment from the wet/dry tropics. Geomicrobiology Journal 30,
48–60.
Correll, D.L., Jordan, T.E., and Weller, D.E. (1992) Nutrient flux in a landscape: Effects of
coastal land use and terrestrial community mosaic on nutrient transport to coastal
waters. Estuaries 15, 431–442.
Coughanowr, C. (2001) Nutrients in the Derwent Estuary catchment. Final Report to the
Natural Heritage Trust. Department of Primary Industries, Water and Environment,
Hobart, TAS. [unpublished]
DeVries, T., Deutsch, C., Rafter, P.A., and Primeau, F. (2012) Marine denitrification rates
determined from a global 3-dimensional inverse model. Biogeosciences Discussions 9,
14013–14052.
Domingues, R.B., Anselmo, T.P., Barbosa, A.B., Sommer, U., and Galvão, H.M. (2011) Light as
a driver of phytoplankton growth and production in the freshwater tidal zone of a turbid
estuary. Estuarine, Coastal and Shelf Science 91, 526–535.
Dostine, D.L. (2013) Phytoplankton communities of East Arm in Darwin Harbour. Report No.
03/2013D. Department of Land Resource Management, Palmerston, NT.
Drewry, J., Fortune, J., and Browne, D. (2010a) Water quality of the Elizabeth River estuary,
Darwin Harbour, before and during the 2006-2007 wet season. Report No. 18/2010D.
Department of Natural Resources, Environment, the Arts and Sport, Darwin, NT. 75 pp.
Drewry, J., Fortune, J., and Majid, M. (2010b) Flood plume water quality and spatial
distribution of water quality indicators in Elizabeth River estuary, Darwin Harbour.
Report No. 20/2010D. Department of Natural Resources, Environment, the Arts and
Sport, Darwin, NT. 60 pp.
Page 36
36
Duggan, S., McKinnon, A.D., and Carleton, J.H. (2008) Zooplankton in an Australian tropical
estuary. Estuaries and Coasts 31, 455–467.
Dyhrman, S.T., Ammerman, J.W., and Van Mooy, B.A.S. (2007) Microbes and the marine
phosphorus cycle. Oceanography 20, 110–116.
Fortune, J (2010) Water Quality Objectives for the Darwin Harbour Region - Background
Document. Department of Natural Resources, Environment, the Arts and Sport,
Palmerston, N.T. 38 pp.
Fortune, J., and Maly, G. (2009) Phase One Report – Towards the development of a water
quality protection plan for the Darwin Harbour Region. Department of Natural
Resources, Environment, the Arts and Sport, Darwin, NT. 11 pp.
Frangoulis, C., Christou, E., and Hecq, J. (2004) Comparison of marine copepod outfluxes:
nature, rate, fate and role in the carbon and nitrogen cycles. Advances in Marine Biology 47,
253–309.
Fulweiler, R.W., Nixon, S.W., Buckley, B.A., and Granger, S.L. (2007) Reversal of the net
dinitrogen gas flux in coastal marine sediments. Nature, 448, 180–182.
Fulweiler, R.W., Brown, S.M., Nixon, S.W., & Jenkins, B.D. (2013) Evidence and a conceptual
model for the co-occurrence of nitrogen fixation and denitrification in heterotrophic
marine sediments. Marine Ecology Progress Series, 482, 57–68.
Furnas, M., Alongi, D., McKinnon, D., Trott, L., and Skuza, M. (2011) Regional-scale nitrogen
and phosphorus budgets for the northern (14°S) and central (17°S) Great Barrier Reef
shelf ecosystem. Continental Shelf Research 31, 1967–1990.
Gabric, A.J., and Bell, P.R.F. (1993) Review of the effects of non-point nutrient loading on
coastal ecosystems. Marine and Freshwater Research 44, 261–283.
Gray, S., Kinross, J., Read, P., and Marland, A. (2000) The nutrient assimilative capacity of
maerl as a substrate in constructed wetland systems for waste treatment. Water Research
34, 2183–2190.
Gächter, R., and Meyer, J.S. (1993) The role of microorganisms in mobilization and fixation of
phosphorus in sediments. Hydrobiologia 253, 103–121.
Goto, N., Kawamura, T., Mitamura, O., and Terai, H. (1999) Importance of extracellular
organic carbon production in the total primary production by tidal-flat diatoms in
comparison to phytoplankton. Marine Ecology Progress Series 190, 289–295.
Harris, G.P. (1999) Comparison of the biogeochemistry of lakes and estuaries: ecosystem
processes, functional groups, hysteresis effects and interactions between macro- and
microbiology. Marine and Freshwater Research 50, 791–811.
Harris, G. (2001a) A nutrient dynamics model for Australian waterways: land use, catchment
biogeochemistry and water quality in Australian rivers, lakes and estuaries. Department
of the Environment and Heritage, Canberra, ACT.
Harris, G.P. (2001b) Biogeochemistry of nitrogen and phosphorus in Australian catchments,
rivers and estuaries: effects of land use and flow regulation and comparisons with global
patterns. Marine and Freshwater Research 52, 139–149.
Page 37
37
Harris, G., Batley, G., Fox, D., Hall, D., Jernakoff, P., Molloy, R., Murray, A., Newell, B.,
Parslow, J., and Skyring, G. (1996) 'Port Phillip Bay environmental study: final report.'
CSIRO Canberra, Australia. 248 pp.
Hoffmann, F., Radax, R., Woebken, D., Holtappels, M., Lavik, G., Rapp, H.T., Schläppy, M.-L.,
Schleper, C., and Kuypers, M.M.M. (2009) Complex nitrogen cycling in the sponge Geodia
barretti. Environmental Microbiology 11, 2228–2249.
Howarth, R., Chan, F., Conley, D.J., Garnier, J., Doney, S.C., Marino, R., and Billen, G. (2011)
Coupled biogeochemical cycles: eutrophication and hypoxia in temperate estuaries and
coastal marine ecosystems. Frontiers in Ecology and the Environment 9, 18–26.
Huon Estuary Study Team (2000) Huon Estuary Study—environmental research for integrated
catchment management and aquaculture. Final report to the Fisheries Research and
Development Corporation. Project number 96/284, June 2000.' CSIRO Division of
Marine Research. Marine Laboratories, Hobart, Tasmania. 285 pp.
Jennerjahn, T.C., and Ittekkot, V. (2002) Relevance of mangroves for the production and
deposition of organic matter along tropical continental margins. Naturwissenschaften, 89,
23–30.
Kernohan, A.K., and Townsend, S.A. (2000) Runoff water quality from an urban catchment
(Karama, Darwin). Report No. 2000/11. Department of Land Planning and Environment,
Darwin, NT. 80 pp.
Koelmans, A.A., Van der Heijde, A., Knijff, L.M., & Aalderink, R.H. (2001) Integrated modelling
of eutrophication and organic contaminant fate & effects in aquatic ecosystems. A review.
Water Research 35, 3517–3536.
Kirk, J.T. (2011) 'Light and photosynthesis in aquatic ecosystems', 3rd Edition. Cambridge
University Press, Cambridge, UK. 662 pp.
Kristensen, E., Bouillon, S., Dittmar, T., and Marchand, C. (2008) Organic carbon dynamics in
mangrove ecosystems: A review. Aquatic Botany 89, 201–219.
Laverock, B., Smith, C.J., Tait, k., Osborn, A.M., Widdicombe, S., and Gilbert, J.A. (2010)
Bioturbating shrimp alter the structure and diversity of bacterial communities in coastal
marine sediments. The ISME journal 4, 1531–1544.
Libes, S.M. (2009) 'Introduction to marine biogeochemistry', 2nd Edition. Academic Press,
London.
Lugomela, C., and Bergman, B. (2002) Biological N2-fixation on Mangrove Pneumatophores:
Preliminary Observations and Perspectives. AMBIO: A Journal of the Human Environment
31, 612–613.
Mackey, D.J., and Zirino, A. (1994) Comments on trace metal speciation in seawater or do
“onions” grow in the sea? Analytica Chimica Acta 284, 635–647.
Maie, N., Pisani, O., and Jaffé, R. (2008) Mangrove tannins in aquatic ecosystems: Their fate
and possible influence on dissolved organic carbon and nitrogen cycling. Limnology and
Oceanography, 53, 160–171.
McEwan, J., Gabric, A.J., and Bell, P.R.F. (1998) Water quality and phytoplankton dynamics in
Moreton Bay, south-eastern Queensland. II. Mathematical modelling. Marine and
Freshwater Research 49, 227–239.
Page 38
38
McGuinness, K.A. (2003) The mangrove forests of Darwin Harbour: a review of research on
the flora and invertebrate fauna. In 'Darwin Harbour Region: Current knowledge and
future needs.' (Ed. Working Group for the Darwin Harbour Advisory Committee),
Proceedings of the Darwin Harbour Public Presentations – February 2003, Darwin.
p. 19–36.
McKinnon, A.D., Smit, N., Townsend, S., and Duggan, S. (2006) Darwin Harbour: Water
Quality and Ecosystem Structure in a Tropical Harbour in the Early Stages of Urban
Development. In 'The Environment in Asia Pacific Harbours'. (Ed. E. Wolanski) Springer,
Dordrecht, Netherlands. p. 433–459.
McKinnon, A.D., Trott, L.A., Brinkman, R., Duggan, S., Castine, S., O’Leary, R.A., and
Alongi, D.M. (2010) Seacage aquaculture in a World Heritage Area: the environmental
footprint of a Barramundi farm in tropical Australia. Marine Pollution Bulletin 60, 1489–
1501.
Mobley, C.D. (1994) 'Light and Water: Radiative Transfer in Natural Waters' Academic Press,
San Diego, California. 592 pp.
Mohamed, N.M., Saito, K., Tal, Y., and Hill, R.T. (2010) Diversity of aerobic and anaerobic
ammonia-oxidizing bacteria in marine sponges. The ISME Journal 4, 38–48.
Morel, F. M. M., Milligan, A. J., and Saito, M. A. (2003) Marine Bioinorganic Chemistry: The
Role of Trace Metals in the Oceanic Cycles of Major Nutrients. In 'Treatise on
Geochemistry, Volume 6'. (Eds. H. Elderfield, H.D. Holland, and K.K. Turekian). Elsevier
Pergamon, Amsterdam. p. 113–143.
Murray, A.G., and Parslow, J.S. (1999) Modelling of nutrient impacts in Port Phillip Bay; a semi-
enclosed marine Australian ecosystem. Marine and Freshwater Research 50, 597–612.
Muslim, I., and Jones, G. (2003) The seasonal variation of dissolved nutrients, chlorophyll a and
suspended sediments at Nelly Bay, Magnetic Island. Estuarine, Coastal and Shelf Science 57,
445–455.
Nedwell, D.B., Blackburn, T.H., and Wiebe, W.J. (1994) Dynamic nature of the turnover of
organic carbon, nitrogen and sulphur in the sediments of a Jamaican mangrove forest.
Marine Ecology Progress Series 110, 223–231.
Padovan, A. (1997) The water quality of Darwin Harbour: October 1990 – November 1991.
Report No. 34/1997D. Water Quality Branch, Water Resources Division, Department of
Lands, Planning and Environment, Darwin, NT. 41 pp.
Padovan, A. (2001a) The quality of run-off and contaminant loads to Darwin Harbour. Report
No. 29/2000D. Department of Infrastructure, Planning and Environment, Darwin, NT.
43 pp.
Padovan, A. (2001b) Catchment load monitoring during the 2000/01 wet season (Berry Creek
and Winnellie Drain Stations). Report No. 51/2001. Department of Infrastructure,
Planning and Environment, Darwin, NT. 8 pp.
Padovan, A. (2002) Catchment load monitoring during the 2001/02 wet season (Berry Creek,
Elizabeth River and Bees Creek stations). Report No. 22/2002. Department of
Infrastructure, Planning and Environment, Darwin, NT. 9 pp.
Page 39
39
Padovan, A. (2003) Darwin Harbour water and sediment quality. In 'Darwin Harbour Region:
Current knowledge and future needs.' (Ed. Working Group for the Darwin Harbour
Advisory Committee), Proceedings of the Darwin Harbour Public Presentations –
February 2003, Darwin. p. 5–18.
Paytan, A., and McLaughlin, K. (2007) The oceanic phosphorous cycle. Chemical Reviews 107,
563–576.
Pearce, R.J. (1991) Management of the marine environment in Western Australia: An
ecosystem approach. Marine Pollution Bulletin 23, 567–572.
Pratt, D.R., Pilditch, C.A., Lohrer, A.M., and Thrush, S.F. The effects of short-term increases in
turbidity on sandflat microphytobenthic productivity and nutrient fluxes. Journal of Sea
Research DOI:10.1016/j.seares.2013.07.009.
Redfield, A.C. (1958) The biological control of chemical factors in the environment. American
Scientist 46, 205–221.
Rivera-Monroy, V.H., and Twilley, R.R. (1996) The relative role of denitrification and
immobilization in the fate of inorganic nitrogen in mangrove sediments. Limnology and
Oceanography 41, 284–296.
Robertson, A.I. (1988) Decomposition of mangrove leaf litter in tropical Australia. Journal of
Experimental Marine Biology and Ecology 116, 235–247.
Robertson, A.I., Duke, N.C. (1990) Mangrove fish-communities in tropical Queensland,
Australia: Spatial and temporal patterns in densities, biomass and community structure.
Marine Biology 104, 369–379.
Robson, B.J., and Hamilton, D.P. (2004) Three-dimensional modelling of a Microcystis bloom
event in the Swan River estuary, Western Australia. Ecological Modelling 174, 203–222.
Robson, B.J., Hamilton, D.P., Webster, I.T., & Chan, T. (2008) Ten steps applied to
development and evaluation of process-based biogeochemical models of estuaries.
Environmental Modelling & Software 23, 369–384.
Scanes, P., Coade, G., Doherty, M., and Hill, R. (2007) Evaluation of the utility of water quality
based indicators of estuarine lagoon condition in NSW, Australia. Estuarine, Coastal and
Shelf Science 74, 306–319.
Schaffelke, B., Thompson, A., Carleton, J., De’ath, G., Doyle, J., Feather, G., Furnas, M.,
Neale, S., Skuza, M., and Thomson, D. (2007) Water Quality and Ecosystem Monitoring
Programme–Reef Water Quality Protection Plan. Final Report to GBRMPA. Australian
Institute of Marine Science, Townsville.
Schläppy, M.L., Schöttner, S.I., Lavik, G., Kuypers, M.M., de Beer, D., and Hoffmann, F. (2010)
Evidence of nitrification and denitrification in high and low microbial abundance sponges.
Marine Biology 157, 593–602.
Schult, J. (2004) Nutrient concentrations in four Darwin region streams. Report No.
24/2004D. Department of Infrastructure, Planning and Environment, Darwin, NT. 34 pp.
Schult, J., and Metcalfe, R. (2006) High nitrate concentrations in the Douglas River and their
impact on Daly River water quality. Report No. 9/2006D. Department of Natural
Resources, Environment, the Arts and Sport, Darwin, NT. 27 pp.
Page 40
40
Skinner, L., Townsend, S.A., and Fortune, J. (2009) The impact of urban land-use on total
pollutant loads entering Darwin Harbour. Report No. 06/2008D. Department of Natural
Resources, Environment, the Arts and Sport, Darwin, NT. 66 pp.
Smith, J., Burford, M.A., Revill, A.T., Haese, R.R., and Fortune, J. (2012) Effect of nutrient
loading on biogeochemical processes in tropical tidal creeks. Biogeochemistry, 108, 359–
380.
Strauss, E.A., and Lamberti, G.A. (2000) Regulation of nitrification in aquatic sediments by
organic carbon. Limnology and Oceanography 45, 1854–1859.
Thingstad, T.F., Skjoldal, E.F., and Bohne, R.A. (1993) Phosphorus cycling and algal-bacterial
competition in Sandsfjord, western Norway. Marine Ecology Progress Series 99, 239–259.
Townsend, S., Stewart, G., Gell, P., Bickford, S., Tibby, J., Croome, R., Przybylska, M., Padovan,
A.V., and Metcalfe, R. (2002) Periphyton and phytoplankton response to reduced dry
season flows in the Daly River. Report No. 10/2003D. Department of Infrastructure,
Planning and Environment, Darwin, NT. 15 pp.
Townsend, S.A. (1992) Nutrient suspended solid and metal inputs, from point and non-point
sources, into Darwin Harbour, November 1990–October 1991. Report No. 38/92,
Power and Water Authority, Darwin, NT. 18 pp.
Tyrrell, T. (1999) The relative influences of nitrogen and phosphorus on oceanic primary
production. Nature 400, 525–531.
Uchino, F., Hambali, G.G., and Yatazawa, M. (1984) Nitrogen-Fixing Bacteria from Warty
Lenticellate Bark of a Mangrove Tree, Bruguiera gymnorrhiza (L.) Lamk. Applied and
Environmental Microbiology 47, 44–48.
Wan, Z., Bi, H., and She, J. (2013) Comparison of two light attenuation parameterization
focusing on timing of spring bloom and primary production in the Baltic Sea. Ecological
Modelling 259, 40–49.
Ward, T.J., Butler, E., and Hill, B.J. (1998) Environmental indicators for national State of the
Environment reporting: estuaries and the sea. State of the Environment (Environmental
Indicator Reports), Department of the Environment, Canberra. 80 pp.
Weber, J.H. (1999) Volatile hydride and methyl compounds of selected elements formed in
the marine environment. Marine Chemistry 65, 67–75.
Welch, M., Schult, J., and Padovan, A. (2008) Effects of urban stormwater on heavy metal and
nutrient concentrations in mangrove sediments of Darwin Harbour. Report No.
08/2008D. Department of Natural Resources, Environment, the Arts and Sport, Darwin,
NT. 7 pp.
Wild-Allen, K., Herzfeld, M., Thompson, P.A., Rosebrock, U., Parslow, J., and Volkman, J.K.
(2010) Applied coastal biogeochemical modelling to quantify the environmental impact of
fish farm nutrients and inform managers. Journal of Marine Systems 81, 134–147.
Wild-Allen, K., Thompson, P.A., Volkman, J.K., and Parslow, J. (2011) Use of a coastal
biogeochemical model to select environmental monitoring sites. Journal of Marine Systems
88, 120–127.
Williams, D., Wolanski, E., and Spagnol, S. (2006) Hydrodynamics of Darwin Harbour. In 'The
Environment in Asia Pacific Harbours'. (Ed. E. Wolanski) Springer, Dordrecht,
Netherlands. p. 461–476.
Page 41
41
Wilson, D., Padovan, A., and Townsend, S. (2004) The water quality of spring and neap tidal
cycles in the middle arm of Darwin Harbour during the dry season. Department of
Infrastructure, Planning and Environment, Darwin, NT. 93 pp.
Wolanski, E., McKinnon, A.D., Williams, D., and Alongi, D.M. (2006) An estuarine
ecohydrology model of Darwin Harbour, Australia. In 'The Environment in Asia Pacific
Harbours'. (Ed. E. Wolanski) Springer, Dordrecht, Netherlands. p. 477–488.
Zehr, J.P., & Kudela, R.M. (2011) Nitrogen cycle of the open ocean: from genes to ecosystems.
Annual Review of Marine Science 3, 197–225.
Zehr, J.P., and Ward, B.B. (2002) Nitrogen cycling in the ocean: new perspectives on
processes and paradigms. Applied and Environmental Microbiology 68, 1015–1024.
Page 43
ii
Appendix 1:
Plate A1. Depiction of nutrient inputs, cycling and sinks in a stylised Darwin Harbour, including
indication of fluxes that are not known. It is not intended to be geographically accurate.
Notes: (a) The size of arrows is broadly indicative of the magnitude of the transfer or flux,
except where the question mark indicates that it has not been quantified. (b) Total nitrogen
supply via the rivers is very episodic, depending on the rainfall events in each wet season. (c)
U-turn arrows (e.g. seawater input of DIN and mangrove processing of TN) are indicative of
tidal exchange. (d) Heterotrophic bacteria can process organic matter either to release
dissolved inorganic nitrogen (DIN, especially ammonia via ammonification) or transfer
nitrogen to the atmosphere via denitrification as N2 – neither process is quantified. (e)
Nitrogen fixation has been directly determined for intertidal mudflats and subtidal sediments
and estimated for mangroves (Burford et al. 2008), but is unknown, assumed small, for the
water column, although the possible seasonal appearance of Trichodesmium blooms has not
been accounted. (f) the net effect of mangroves with incoming TN and small amounts of
outgoing PN is removal of DIN and DON and some of the PN. (g) Benthic microalgae (as
distinct from pelagic microalgae – i.e. phytoplankton) have not been depicted, but may also
have considerable nutrient uptake potential on intertidal mudflats or over shallow subtidal
sediments. (h) the capacity of other benthic life forms (e.g. sponges and seagrass) to take up
nutrients remains undetermined in Darwin Harbour.