+ All Categories
Home > Documents > TEMPERATURE EFFECTS ON ASSIMILATIVE CAPACITY OF …

TEMPERATURE EFFECTS ON ASSIMILATIVE CAPACITY OF …

Date post: 14-Mar-2022
Category:
Upload: others
View: 5 times
Download: 0 times
Share this document with a friend
26
TEMPERATURE EFFECTS ON ASSIMILATIVE CAPACITY OF RIVERS, LAKES AND ESTUARIES 2016 Georgia-Pacific Environmental Conference Atlanta Airport Marriott Gateway Hotel October 18, 2016 Michael R. Corn, P.E., BCEE AquAeTer, Inc Brentwood, TN
Transcript

TEMPERATURE EFFECTS ON

ASSIMILATIVE CAPACITY OF RIVERS, LAKES AND ESTUARIES

2016 Georgia-Pacific Environmental Conference

Atlanta Airport Marriott Gateway Hotel

October 18, 2016

Michael R. Corn, P.E., BCEEAquAeTer, IncBrentwood, TN

Grand Ole OpryHome of Country Music

Beech Grove near Nashville, Tennessee

FEDERAL WATER POLLUTION CONTROL ACT AMENDMENTS OF 1972

(CLEAN WATER ACT)1. RESTORATION AND MAINTENANCE OF CHEMICAL, PHYSICAL

AND BIOLOGICAL INTEGRITY OF NATION’S WATERS;a. discharge of pollutants into the navigable waters be eliminated by 1985;b. protection and propagation of fish, shellfish, and wildlife and provides

for recreation in and on the water be achieved by July 1, 1983;c. discharge of toxic pollutants in toxic amounts be prohibited; andd. control of nonpoint sources of pollution be developed and implemented

in an expeditious manner.

CLEAN WATER ACT OF 1972WATER QUALITY-BASED PERMIT LIMITS

WATER QUALITYBASED LIMITS FOR

DO

TECHNOLOGYBASED LIMITS

WHOLE EFFLUENTWATER QUALITY

BASED LIMITS

BAT ANDEFFLUENT LIMITS

GUIDELINES

CONVENTIONALAND

PRIORITY POLLUTANTS

ANTIBACKSLIDINGPROVISION

END OF PIPE

NUMERIC STANDARD

(TYPICALLY 5 mg/L)

IODPROTECTIONOF AQUATICRESOURCES

BOD5LIMITS

NH3,4 LIMITS

HUMANHEALTH

CRITERIA

ACUTETOXICITYCRITERIA

CHRONICTOXICITYCRITERIA

ANTIBACKSLIDINGPROVISION

ANTIDEGRADATIONPROVISION

MIXING ZONE

1987 WATER QUALITY

ACT

END OF PIPE

Impacts to Receiving Stream Water Qualityfrom Municipal and Industrial Discharges

o Typical impairments identified downstream from Discharges DO standard not being met Nutrient enrichment (DO sag or nuisance algal blooms) Metals (typically Hg, Pb, As, Cu) Dioxins Sedimentation (silvicultural activities) Other Toxins – Carcinogens, Non-Carcinogens,

Teratogens

HOW DOES TEMPERATURE AFFECTTREATMENT AND EFFLUENT LIMITS

1. Max T for Aerobic Treatment ~ 104°F (40°C);2. Min T for Nitrification ~ 59°F (15°C);3. DO saturation decreases per degree T increase;4. Oxygen depletion increases per degree T increase;5. Reaeration Rates increase per degree T increase;6. Net Effect:

a. Lower BOD5 limits per degree T increase;b. Lower Nitrogen limits per degree T increase;c. More oxygen supply per degree T increase; andd. More stress on aquatic resources per degree T increase.

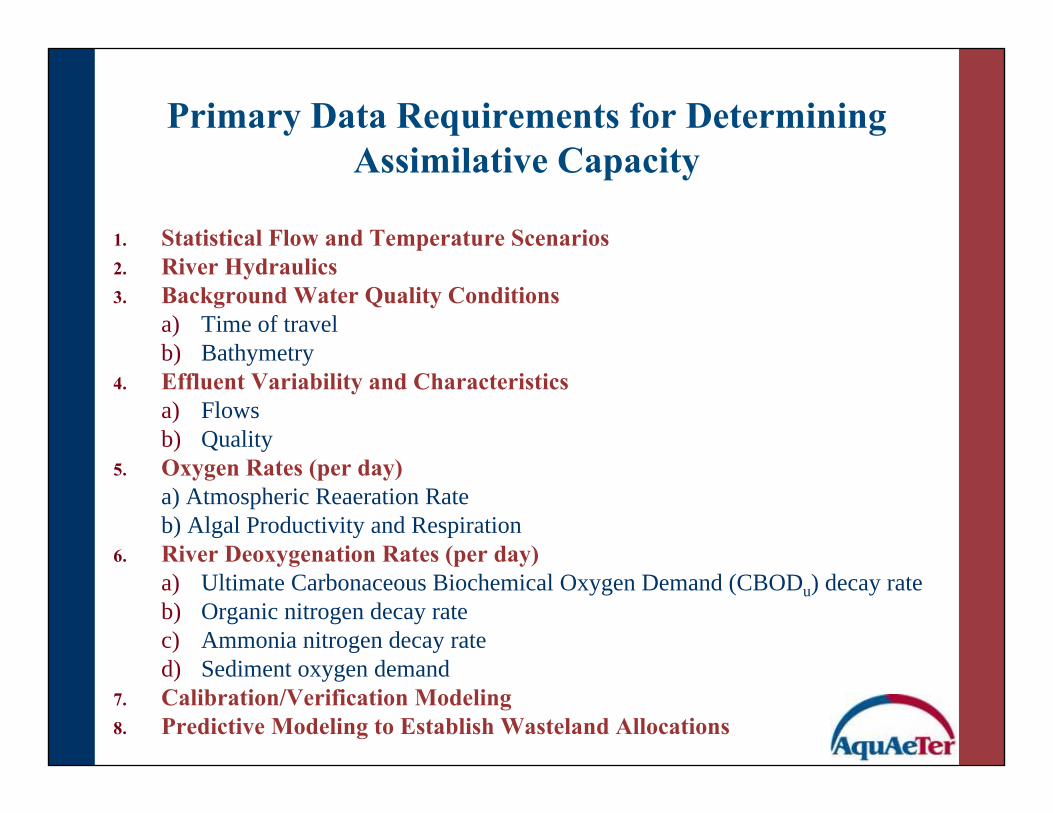
Primary Data Requirements for Determining Assimilative Capacity

1. Statistical Flow and Temperature Scenarios2. River Hydraulics3. Background Water Quality Conditions

a) Time of travelb) Bathymetry

4. Effluent Variability and Characteristicsa) Flowsb) Quality

5. Oxygen Rates (per day)a) Atmospheric Reaeration Rateb) Algal Productivity and Respiration

6. River Deoxygenation Rates (per day)a) Ultimate Carbonaceous Biochemical Oxygen Demand (CBODu) decay rateb) Organic nitrogen decay ratec) Ammonia nitrogen decay rated) Sediment oxygen demand

7. Calibration/Verification Modeling8. Predictive Modeling to Establish Wasteland Allocations

Schematic of the Oxygen BalanceCalculations In QUAL2E

OXYGEN DEMANDSIN

CBODuNITROGEN SERIES

IOD

OXYGEN DEMANDSOUT

CBODuNITROGEN SERIES

IOD

O2 IN O2 OUT

NUTRIENTS NUTRIENTS

O2 BALANCE = ASSETS – LIABILITIES = DO – OXYGEN DEMANDS

-O2AMMONIFICATION

Org N NH3

-O2NITRIFICATIONNH3 NO2 + NO3

-NO3, -CBODuDENITRIFICATION

@ANOXICCONDITIONS

-O2CBODu

+O2SUSPENDED ALGAE(PRODUCTION AND

RESPIRATION)

-O2IOD

NUTRIENTSTOTAL NTOTAL P CBODu

NUTRIENTS

+O2

ATTACHED ALGAEAND AQUATIC PLANTS

(PRODUCTION ANDRESPIRATION)

DENITRIFICATION BENTHICOXYGEN

DEMANDS

CBODuNUTRIENTS

SOD

ATMOSPHERICREAERATION +O2

-CBODu, NO3

AUGUST 27, 1998 CALIBRATION MODELOUACHITA RIVER NEAR CROSSETT, AR

0

1

2

3

4

5

6

7

8

190195200205210215220225230

ORM

DISS

OLV

ED O

XYGE

N (m

g/L)

PREDICTED DO AVERAGE DOMAX DO MIN DOOBS DO PREDICTED DO NO GP DISCHARGEUSEPA DO

PREDICTED DO, NO DISCHARGE

Ouachita River Calibration Model

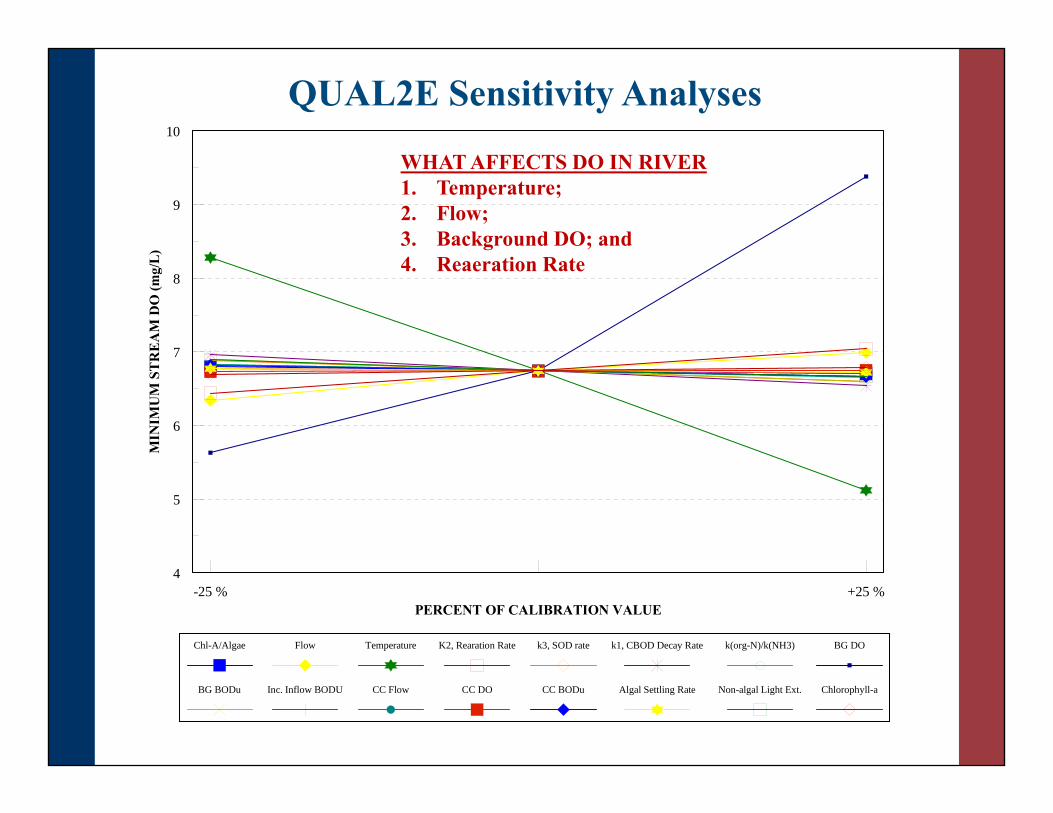
QUAL2E Sensitivity Analyses

-25 % +25 %4

5

6

7

8

9

10

PERCENT OF CALIBRATION VALUE

MIN

IMU

M S

TR

EA

M D

O (m

g/L

)

Chl-A/Algae Flow Temperature K2, Rearation Rate k3, SOD rate k1, CBOD Decay Rate k(org-N)/k(NH3) BG DO

BG BODu Inc. Inflow BODU CC Flow CC DO CC BODu Algal Settling Rate Non-algal Light Ext. Chlorophyll-a

WHAT AFFECTS DO IN RIVER1. Temperature;2. Flow;3. Background DO; and4. Reaeration Rate

WHAT HAPPENS IN THE STREAM AT HIGHER TEMPERATURES

1. Decreasing DO with Increasing Temperature;2. Essential to match Q and T that occur at same time;3. Higher reaeration rates @ high T;4. Higher O2 depletion @ high T;5. Optimum T for algae ~27.5°C or 81.5°F; and6. Blue-green algae max T ~72°C or 163°F.

Monthly Temperatures

Tombigbee finished 1984

WHAT IS THE PROJECTION FOR AMBIENT AIR TEMPERATURE TRENDS IN THE

SOUTHEAST1. Avg Annual Temperature increased in SE by ~2°F since 1970;2. By 2100, Avg temperature to rise 4 to 8°F or 2.2 to 4.4°C;3. Number of days over 95°F or 35°C to increase (2041-2070)

https://www3.epa.gov/climatechange/southeheast.html

FLOW & TEMPERATURE

DO CONCENTRATION AND SATURATIONVS TEMPERATURE

0.00%

20.00%

40.00%

60.00%

80.00%

100.00%

120.00%

0.000

2.000

4.000

6.000

8.000

10.000

12.000

14.000

16.000

0.0 5.0 10.0 15.0 20.0 25.0 30.0 35.0 40.0 45.0

SAT

UR

ATIO

N V

S 0.

0 (%

)

CO

NC

EN

TR

ATIO

N (m

g/L

)

TEMPERATURE (deg C)

DO vsTemperature

Percent Saturation vs 0.0°C

DO vs Temperature

From Standard Methods

-0.2 to -0.3 mg/L per 1°C T rise~250 lbs/day of BOD5

Comparison Between Measured and Calculated Reaeration Coefficients

STREAMREACH

1

2

3

4

5

6

1

2

3

DEPTH(feet)

0.375

0.706

0.620

1.700

0.860

0.440

1.140

1.280

1.420

VELOCITY(fps)

0.0620

0.0490

0.0530

0.0096

0.0450

0.0620

0.4300

0.4000

0.3300

REAERATIONRATE (K )

4.194

2.890

2.840

0.277

1.950

2.817

1.500

1.380

1.250

O'CONNOR

14.050

4.810

6.080

0.573

3.580

11.000

6.950

5.630

4.380

OWENS

20.700

5.450

7.310

0.361

3.580

15.310

9.630

7.400

5.370

CHURCHILL

4.040

1.020

1.370

0.053

0.670

2.830

4.010

7.400

5.370

LANGBIEN

1.750

0.028

0.763

0.036

0.420

1.408

2.750

2.260

1.580

2

FIELD MEASURED VALUES EMPIRICAL PREDICTIONS OF K

SAN GABRIEL RIVER

2

BRUSHY CREEK

REAERATION RATE INCREASES WITH TEMPERATURE

k2 = c*ΔhTOT

k2 @ 29.5°C = 1.72/dayk2 @ 20°C = 1.72/day * 1.02220 -29.5

k2 @ 20°C = 1.40/day

From GP Red River Waste Assimilative Capacity Study on Red River (Jernigan and Corn June 1992; March 1993)

Reaeration is a function of turbulence not depth

0.000

0.020

0.040

0.060

0.080

0.100

0.120

0.140

0.0 5.0 10.0 15.0 20.0 25.0 30.0 35.0 40.0 45.0

k 2(p

er d

ay)

WATER TEMPERATURE (°C)

REAERATION RATE, k2, vs TEMPERATURE

GROWTH RATE FOR ALGAE

0.00%

20.00%

40.00%

60.00%

80.00%

100.00%

120.00%

0 5 10 15 20 25 30 35 40

GR

OW

TH

RAT

E (%

)

TEMPERATURE (deg C)

Algae growth vs Temperature

MAXIMUM GROWTH RATE @ 27.5°C(100% as compared to other temperatures)

(Cassidy, K.O. 2011. "Evaluating Algal Growth at Different Temperatures", UK)

IMPACT OF TEMPERATURE INCREASE

1. Increasing Temperature, DO instream decreases;2. Reaeration rate increases – but water cannot hold as

much oxygen;3. Algae – 16 to 30°C optimum; > 30°C conducive to blue-

green algae

DEOXYGENATION RATES ARE TEMPERATURE DEPENDENT

1. Temperature Correction Factor for deoxygenation rates is 1.047 (Empirically determined)

2. For CBODu, k1, of 0.1/day at 30°C, the rate converted to 20°C is:

k1 @ 20°C = 0.1/day @ 30°C * 1.04720-30 = 0.06/day k1 @ 35°C = 0.1/day @ 30°C * 1.04735-30 = 0.13/day

0.000

0.020

0.040

0.060

0.080

0.100

0.120

0.140

0.0 5.0 10.0 15.0 20.0 25.0 30.0 35.0 40.0 45.0

k 1(p

er d

ay)

WATER TEMPERATURE (°C)

DEOXYGENATION RATE, k1, vs TEMPERATURE

Determination of River CBODu and Ammonia Deoxygenation Rates

Note: Calibration kr=0.44/day

Verification kr=0.40/day

Sediment Oxygen Demand

Monthly BOD5 Loadings Ouachita River Downstream from Coffee Creek

MONTH 7Q10 90th PERCENTILE WLA GP PERMITWATER BOD5 BOD5

TEMPERATURE(cfs) (°C) (lbs/day) (lbs/day)

January 2,658 <18 53,539 8,000February 5,269 <18 102,142 8,000March 4,037 <18 79,435 8,000April 2,436 25.1 24,614 8,000May 1,591 26.5 21,591 8,000June 1,049 31.0 22,706 8,000July 894 31.9 14,605 8,000August 802 31.6 8,069 7,262September 829 29.8 6,568 5,911October 822 25.1 10,423 8,000November 1,231 18.0 25,888 8,000December 2,059 <18 42,071 8,000

Note: CBODu/BOD5 = 4

y = 339.08x0.5866

R² = 0.9973y = 375.52x0.5582

R² = 0.9954

y = 438.37x0.5226

R² = 0.993

y = 558.52x0.4743

R² = 0.9835

y = 739.8x0.4203

R² = 0.9732

y = 1215.4x0.337

R² = 0.9437

10000800

BO

D5

LO

AD

ING

(lbs

/day

)

FLOW (cfs)

BOD5 LOADING VS FLOW & TEMPERATURE

22 deg C

24 deg C

26 deg C

28 deg C

30 deg C

32 deg C

Power (22 deg C)

Power (24 deg C)

Power (26 deg C)

Power (28 deg C)

Power (30 deg C)

Power (32 deg C)

22°C

24°C

26°C28°C

30°C

32°C

Each 2°C Temperature Rise Costs you~ 1,000 lbs/day of BOD5 or 5 mg/L of effluent BOD5

y = 830009x-1.238R² = 0.9985

1000020

BO

D5

LO

AD

ING

(lbs

/day

)

TEMPERATURE (°C)

BOD5 LOADING VS TEMPERATURE

'@ 7Q10 OF 900 CFS Power ('@ 7Q10 OF 900 CFS)

@ 32°C, 11,315 lbs/day effluent limit for BOD51. For 25 mgd Qeffl, BOD5 = 54 mg/L2. For 40 mgd Qeffl, BOD5 = 34 mg/L3. For each 2°C temperature rise, ~5 mg/L less BOD5

Michael R. Corn, P.E.AquAeTer, Inc., Brentwood, TN(615) 373-8532

[email protected]

For a copy of today’s presentation

Go to www.aquaeter.com/downloads.htm


Recommended