Page 1
غزة –الجامعة اإلسالمية عمادة الدراسة العليا
كلية الهندسة قسم الهندسة المدنية هندسة البنى التحتية
Islamic University of Gaza High Studies Deanery Faculty of Engineering Civil Engineering Department Infrastructure Engineering
A proposal for Asphalt Wearing Course Specification in Palestine
Nasser AL-Shrafi
Supervised by
Dr. Shafik Jendia
In partial fulfillment of the requirement for degree of Master of Science in Infrastructure Engineering
Gaza – Palestine
May, 2005
Page 2
م اللهـنبس ٱلرحيم ٱلرحم" نيبو مهنيا بلنعجىوي ٱلقرى ٱلتا قريها فكنارب
سيروا فيها ليالي ٱلسيرظاهرة وقدرنا فيها نيناما آمأي18سبأ (" و(
ظاهللا الع قديمص
Page 3
i
To My Parents, Wife, Sons, Brothers and Sisters
Page 4
ii
Acknowledgments
I would like to send my sincere appreciation to people who made this thesis possible.
Special thanks are to my supervisor Dr. Shafik Jendia, for his guidance, patience and
encouragement.
I would like to thank all lecturers in The Islamic University who have helped me during
my study of Infrastructure Civil Engineering Master Program. Those are Dr. Yahya El
Sarraj, Dr. Mohammed Awad, Dr. Mohamed Ziara, Dr. Khairy Al Jamal, Dr. Majed El
Bayaa, Dr. Mohammed Sager, Dr. Hassan Shaban, Dr. Ahmed Shwedeh and Dr.
Mohamed El Reefi.
Finally, I wish to acknowledge the cooperation and support of the entire staff members
of the material and soil laboratory of The Islamic University of Gaza and Material
Testing Laboratory of the Engineering Association, for their consistent help during
conducting the laboratory experiments.
Page 5
iii
Abstract: The undertaken research work includes the development of a proposal for wearing
asphalt layer specifications that is suitable for local aggregate and bitumen in Palestine.
The proposed specifications has been developed after collecting and reviewing eleven
specifications for asphalt wearing layer and dividing them into three groups. These
groups are the international group, the regional group and the local Palestinian
requirements. This research differs from the previous researches because it introduces a
special specification for the wearing asphalt layer which suits the local materials in
Palestine. In addition to the new methodology which was used by the researcher to
select the most suitable specifications. The adopted mechanism was drawing one frame
consists of a minimum and maximum gradations for all the collected specifications and
selecting several asphalt mixes with different gradations. These gradations cover the
wide range between the minimum and maximum of the frame. Also, the mechanical
properties for the eleven specifications were studied and the researcher selected good
mechanical properties to be adopted for the proposed specification. Finally, the
gradation which achieved the selected mechanical properties with minimum bitumen
content was selected as a proposed specification.
It is recommended that the developed proposal specification to be used in the
construction of the asphalt wearing layer in Palestine. The proposed specification is
expected to solve the problems between the stakeholders of the roads if it is used and
unified. It is also expected to improve the planning and implementation of roads
projects.
Page 6
iv
:ملخص البحث ھذا البحث یقدم اقتراحا لمواصفة فلسطینیة خاصة بتدرج الخلطة اإلسفلتیة لطبقة الرصف السطحیة
و لتقدیم ھذا االقتراح ت م جم ع و مراجع ة أح د . ومینت والبیتباستخدام المواد المحلیة من الحصویا
او یتمیز ھذا البحث عن األبحاث ال سابقة بأن ھ یق دم اقتراح . ة وإقلیمیة ومحلیة عالمی عشر مواصفة
و ت تلخص . لمواصفة محلیة خاصة بفلسطین و كذلك بتبنیھ آلیة و طریقة جدیدة لتقدیم ھ ذا االقت راح
ھذه الطریقة بأخذ مغلف واحد أعظمي و أصغري لجمیع المواصفات و المتطلبات التي تم جمعھا و
و م ن ث م عم ل مجموع ة م ن الخلط ات الخاص ة بت درجات مختلف ة بحی ث تغط ي المج ال دراس تھا
و من ثم اختیار التدرج و نسبة البیتومین التي تحقق الصفات . الواسع بین الحدین األعظم و األصغر
المیكانیكی ة الجی دة و الت ي أی ضا ت م اختی اره بع د دراس ة جمی ع ال صفات المیكانیكی ة للمواص فات
.المذكورة
حصویات الأما بالنسبة لتطبیق ھذه المواصفة المقترحة فھي صالحة عند استخدام المواد المحلیة من
یح ل ج زءا كبی را م ن م ن المتوق ع أن حی ث أن مث ل ھ ذا االقت راح ف ي ح ال تطبیق ھ . البیت ومین و
. ةالتعارض بین المؤسسات و الجھات العاملة في المجال و الناتجة عن استخدام مواصفات مختلف
Page 7
v
Table of Contents: Dedication -------------------------------------------------------------------------------- i
Acknowledgement ----------------------------------------------------------------------- ii
Abstract ----------------------------------------------------------------------------------- iii
Table of contents ------------------------------------------------------------------------ v
List of tables ------------------------------------------------------------------------------ ix
List of figures ---------------------------------------------------------------------------- xiii
List of abbreviations -------------------------------------------------------------------- xv
Chapter One: Introduction
1-1 Introduction --------------------------------------------------------------------------- 1
1-2 Statement of the problem ----------------------------------------------------------- 2
1-3 Research Objectives ----------------------------------------------------------------- 2
1-4 Methodology ------------------------------------------------------------------------- 3
1-5 Report Organization ----------------------------------------------------------------- 3
Chapter Two: Materials of Asphalt Pavement
2-1 Introduction --------------------------------------------------------------------------- 5
2-2 Types of Aggregates ---------------------------------------------------------------- 5
2-3 Classification of aggregates -------------------------------------------------------- 6
2-4 Specification of aggregates --------------------------------------------------------- 6
2-5 Test for Road Aggregates ---------------------------------------------------------- 6
2-6 Particle shape classification -------------------------------------------------------- 7
2-7 Desirable Aggregate Properties ---------------------------------------------------- 7
2-8 Groups of Bituminous Materials --------------------------------------------------- 8
2-9 Sources of Bitumen ------------------------------------------------------------------ 9
2-10 Chemical composition of bitumen ----------------------------------------------- 9
2-11 Tests of bitumen -------------------------------------------------------------- 9
2-12 Cut back Bitumen ------------------------------------------------------------- 10
2-13 Types of Cut-backs ---------------------------------------------------------------- 10
2-14 Test for cut-backs ------------------------------------------------------------ 10
2-15 Emulsion ---------------------------------------------------------------------------- 11
Page 8
vi
2-16 Tests for bitumen emulsions ------------------------------------------------------ 11
3-17 Tar ------------------------------------------------------------------------------------ 11
2-18 Tar Tests ---------------------------------------------------------------------------- 12
2-19 Conclusion-------------------------------------------------------------------------- 12
Chapter Three: Pavement Layers and Bituminous Mix Design
3-1 Introduction --------------------------------------------------------------------------- 13
3-2 Desirable Characteristics of Pavements ----------------------------------------- 13
3-3 Pavement Types --------------------------------------------------------------------- 13
3-4 Flexible Pavement Layers ---------------------------------------------------------- 14
3-4-1 Asphalt Covering Layers ---------------------------------------------------- 14
3-4-2 Base Course -------------------------------------------------------------------- 15
3-4-3 Sub-base Course -------------------------------------------------------------- 15
3-5 Attributes of Asphalt Pavements ------------------------------------------------- 16
3-6 Desirable requirements of bituminous mixes ------------------------------------ 16
3-7 Basic Considerations for selecting mix type ------------------------------------- 17
3-8 Objects of bituminous paving mix design ---------------------------------------- 18
3-9 Design procedure of bituminous mixes ------------------------------------------- 19
3-10 Mix design method----------------------------------------------------------------- 19
3-11 Marshall method -------------------------------------------------------------------- 19
3-12 Conclusion -------------------------------------------------------------------------- 21
Chapter Four: Specifications of Asphalt Wearing Course
4-1Introduction --------------------------------------------------------------------------- 22
4-2 Methodology of Selecting the Gradation and Mechanical Properties ------- 22
4-3 International Group ------------------------------------------------------------------ 23
4-3-1 German Specifications ZTV ------------------------------------------------- 23
4-3-2 Association of States and Highway Transportation Officials
(AASHTO) ----------------------------------------------------------------------------
27
4-3-3 British Standard (BS 594) --------------------------------------------------- 30
4-3-4 Gradation of International Group ----------------------------------------- 32
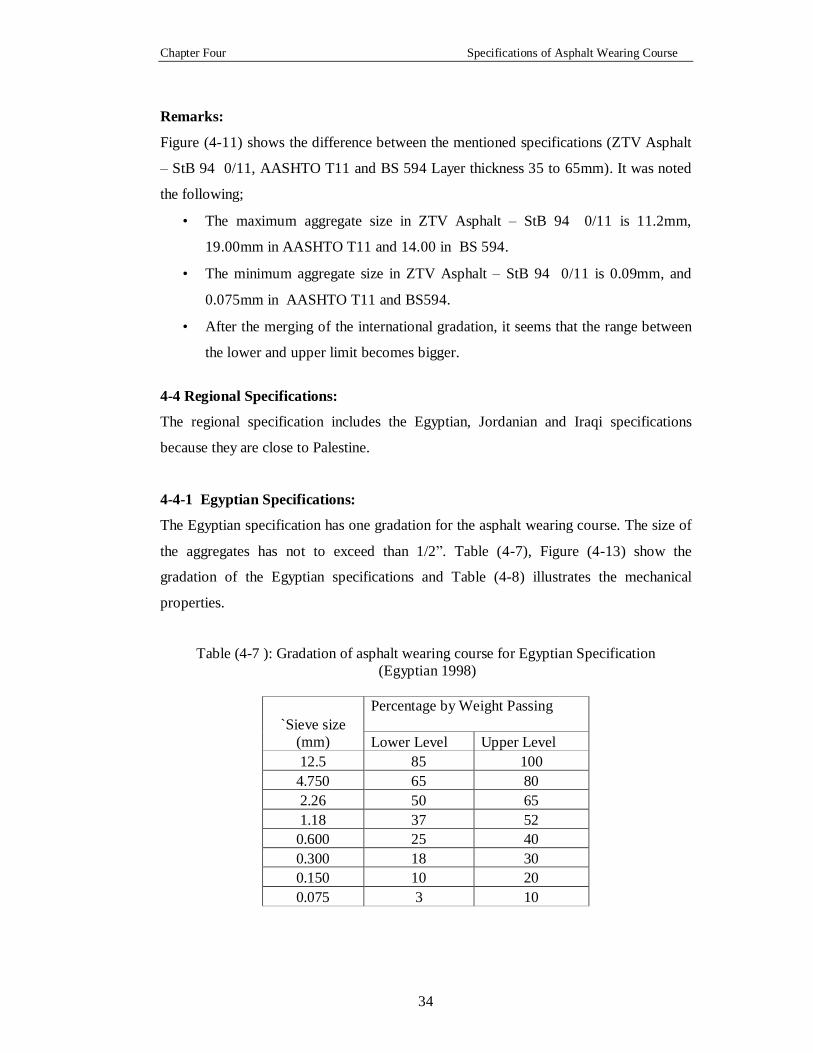
4-4 Regional Specifications-------------------------------------------------------------- 34
4-4-1 Egyptian Specifications ----------------------------------------------------- 34
Page 9
vii
4-4-2 Jordanian Specifications ----------------------------------------------------- 36
4-4-3 Iraqi Specification ------------------------------------------------------------ 37
4-4-4 Gradation of Regional Group ----------------------------------------------- 38 4-5 Local Requirements ----------------------------------------------------------------- 40
4-5-1 Municipality of Gaza (MoG) Requirements ------------------------------ 41
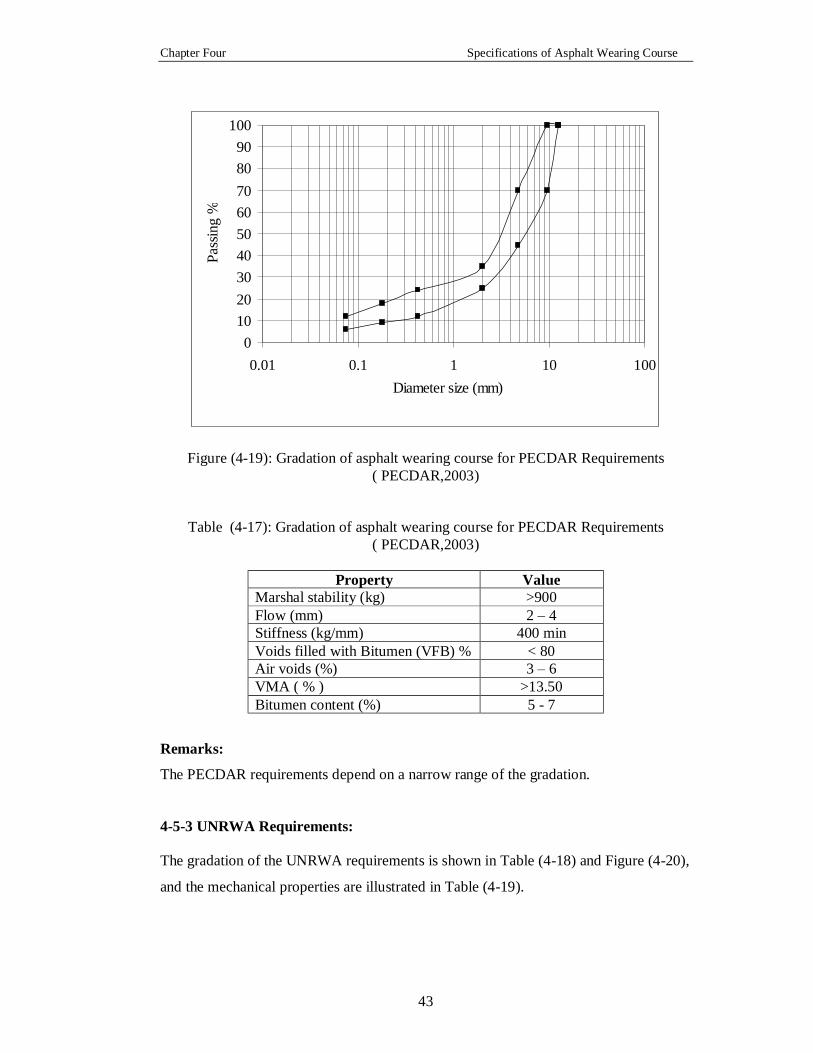
4-5-2 BECDAR Requirements ----------------------------------------------------- 42
4-5-3 UNRWA Requirements ------------------------------------------------------ 43
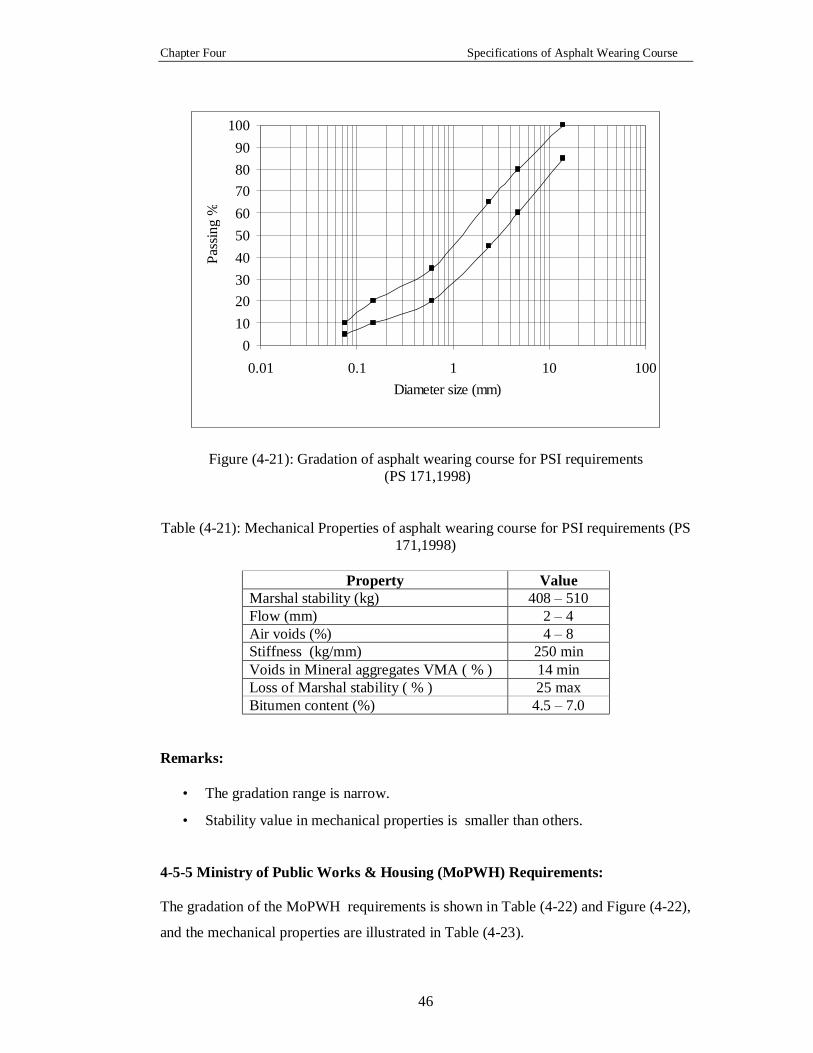
4-5-4 Palestine Standard Institution (PSI) Requirements ----------------------- 45
4-5-5 Ministry of Public Works & Housing (MoPWH) ------------------------ 46
4-5-6 Gradation of local requirements -------------------------------------------- 48
4-6 Gradation and Mechanical Properties for the International, Regional and
Local Groups Together ------------------------------------------------------------------
49
Chapter Five: Tests of Materials
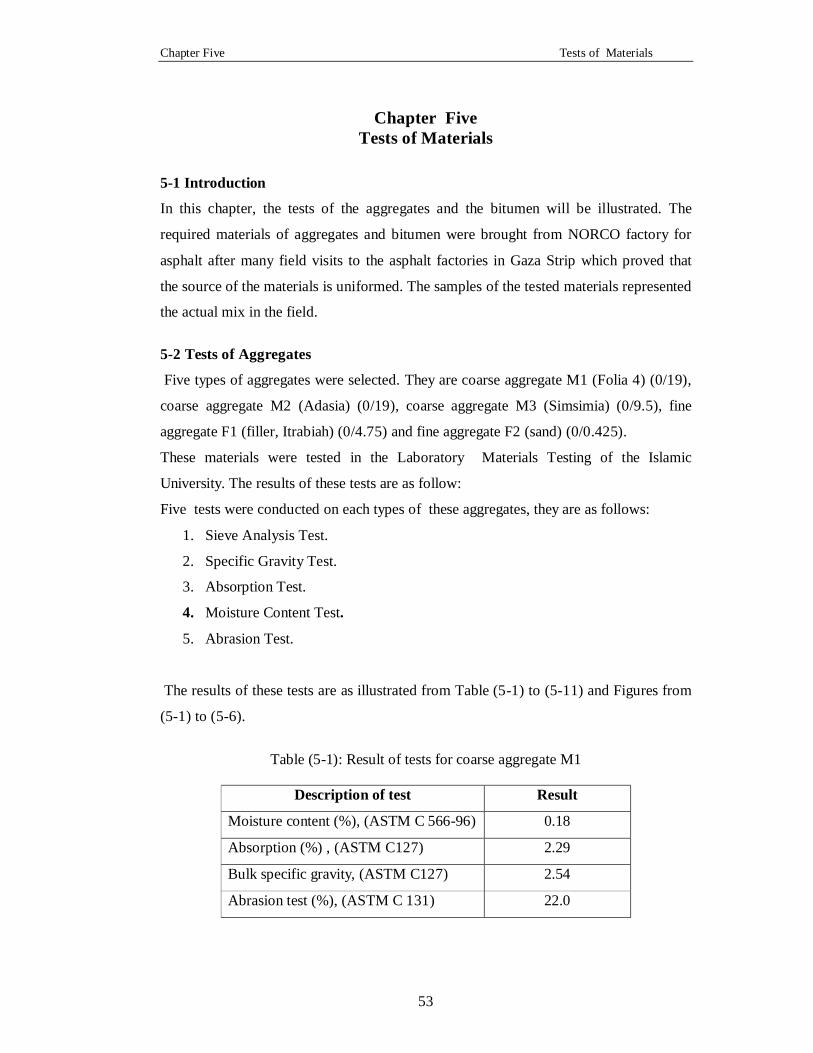
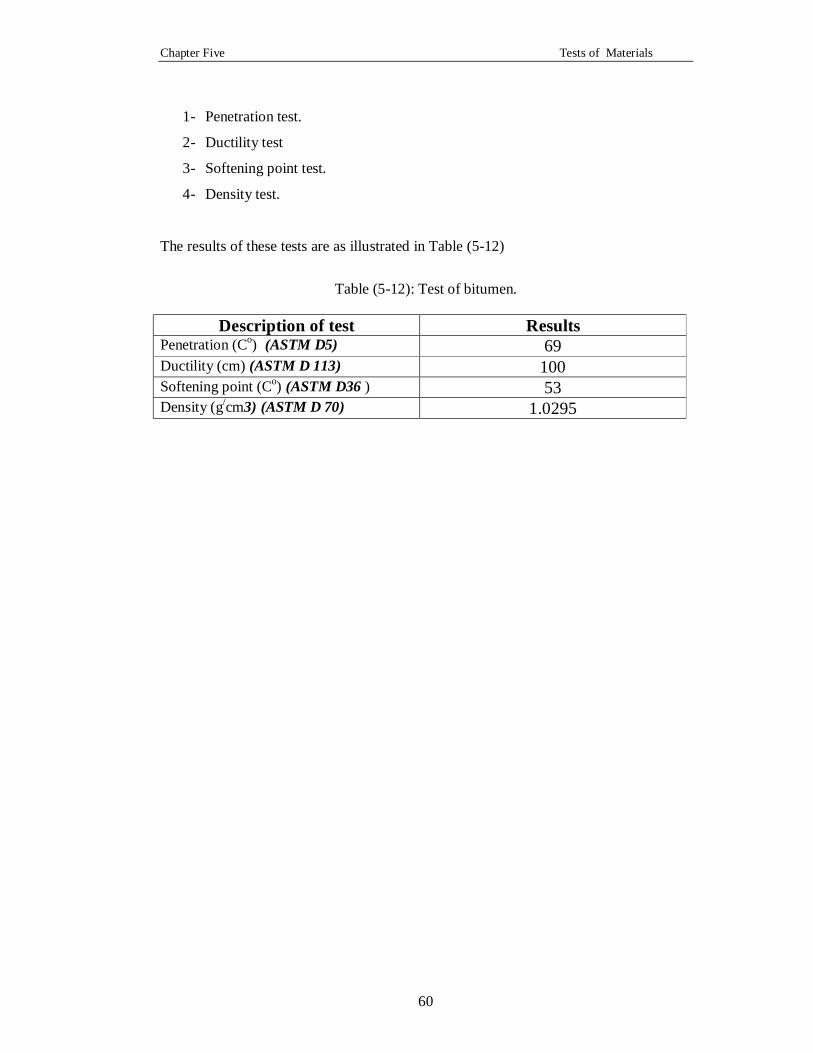
5-1 Introduction --------------------------------------------------------------------------- 53
5-2 Tests of Aggregates ----------------------------------------------------------------- 53
5-3 Tests of Bitumen --------------------------------------------------------------------- 59
Chapter Six: Preparation and Testing of Asphalt Mixes
6-1 Introduction -------------------------------------------------------------------------- 61
6- 2 Methodology of Selecting the Proposed Mix ---------------------------------- 61
6-3 Gradations and Job Mixes --------------------------------------------------------- 63
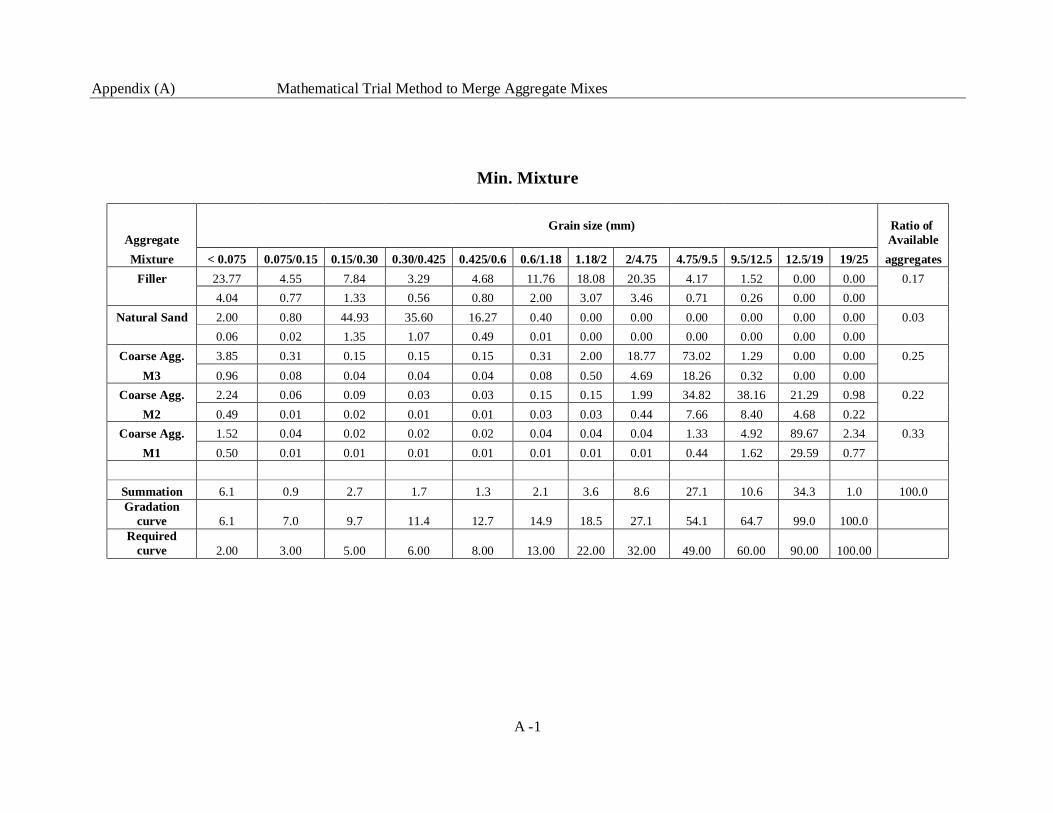
6-3-1 Min. Curve Mix --------------------------------------------------------------- 63
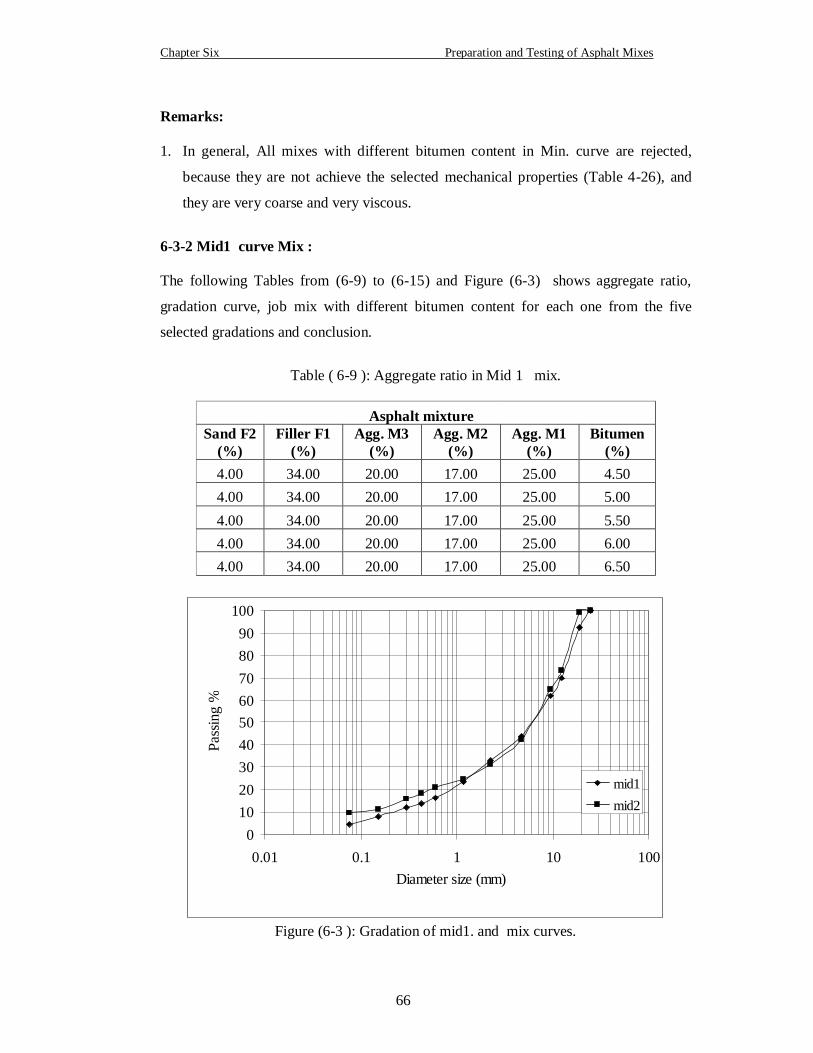
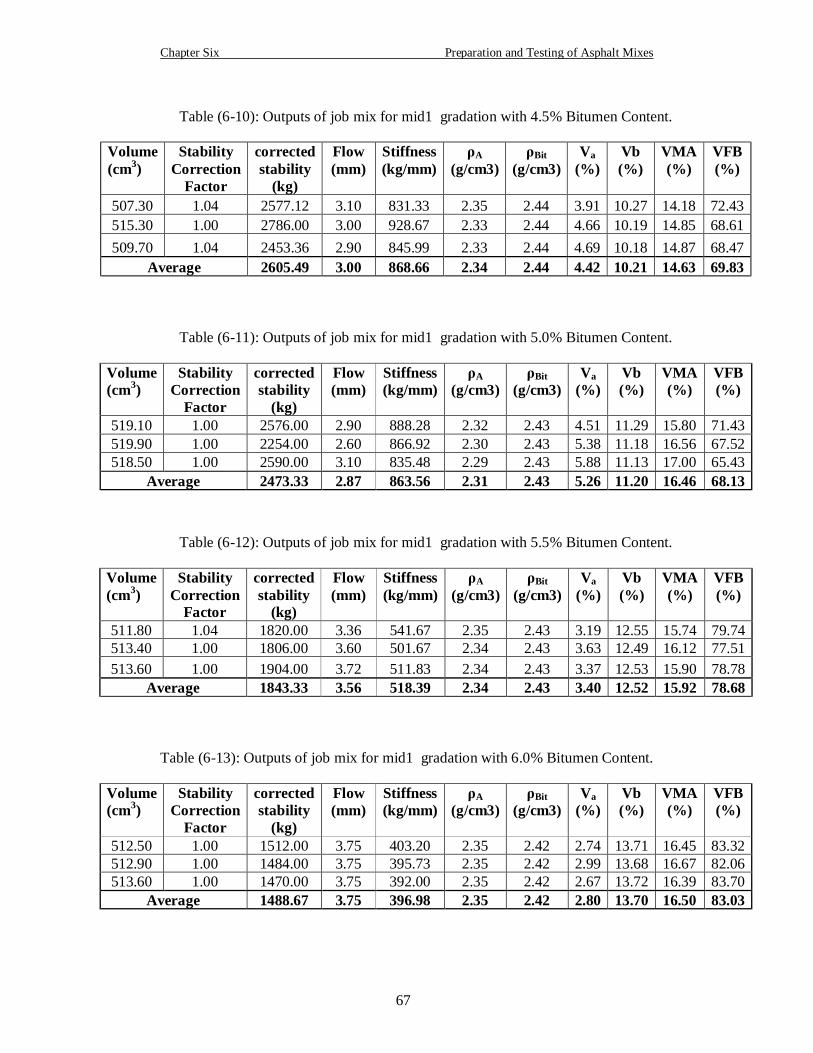
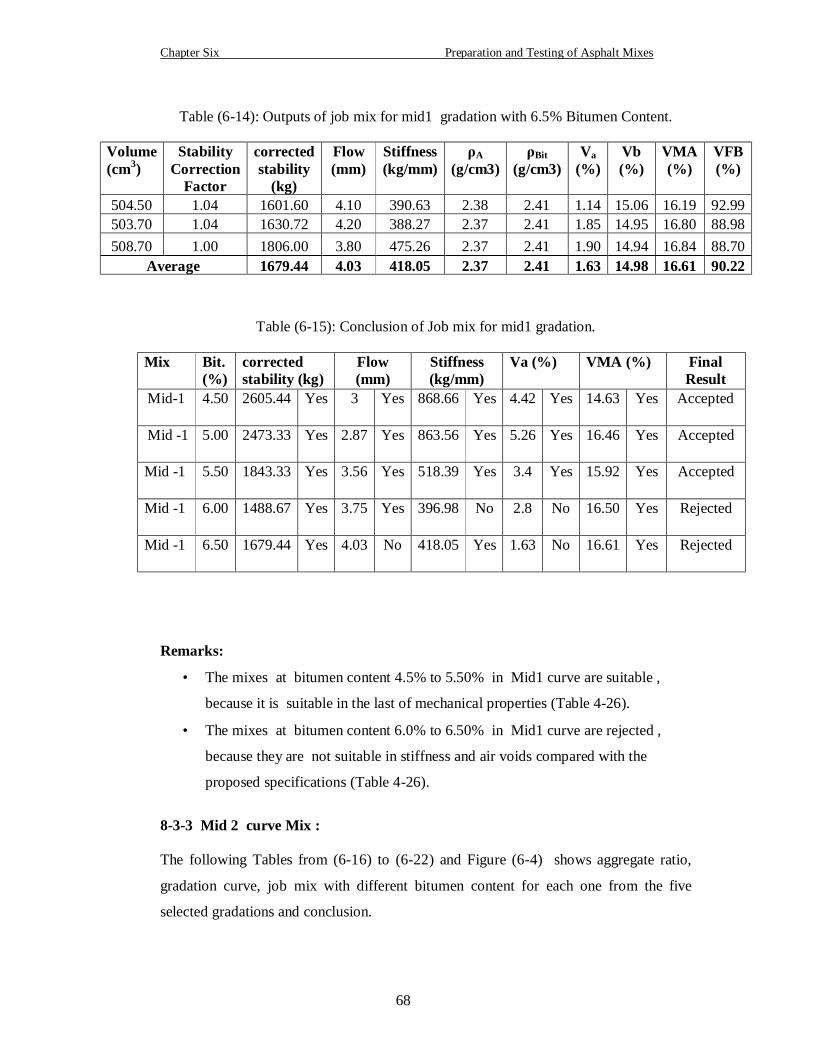
6-3-2 Mid1 curve Mix -------------------------------------------------------------- 66
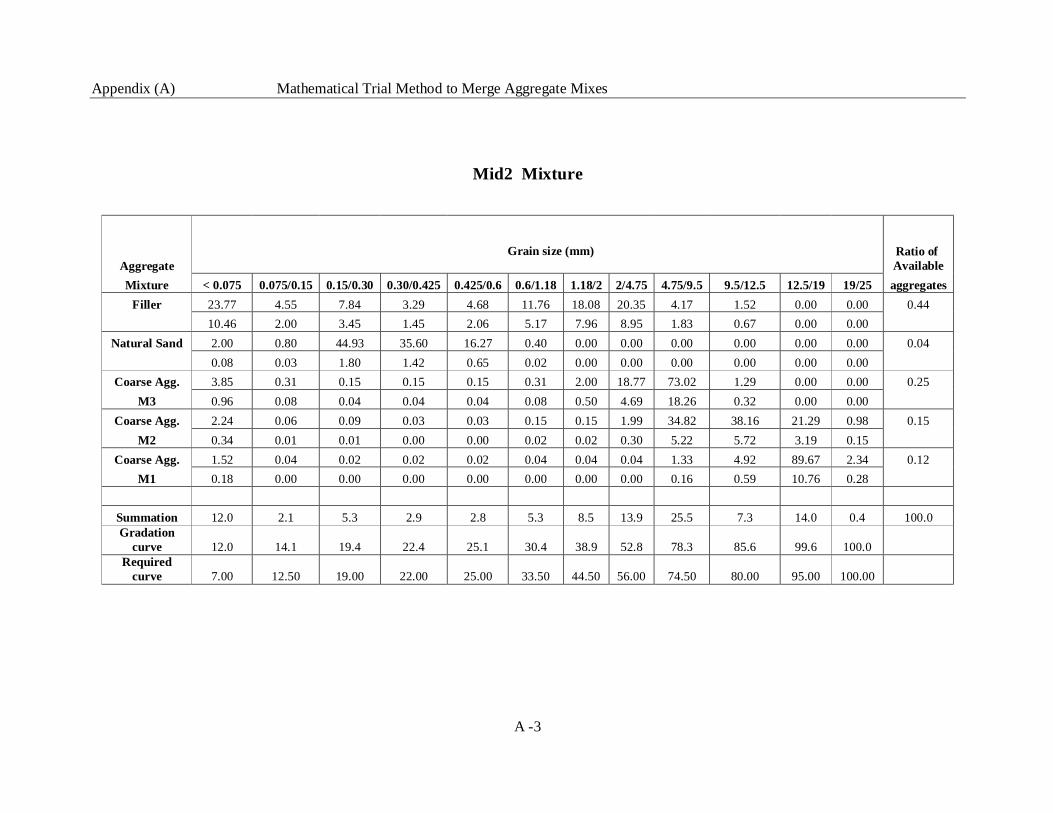
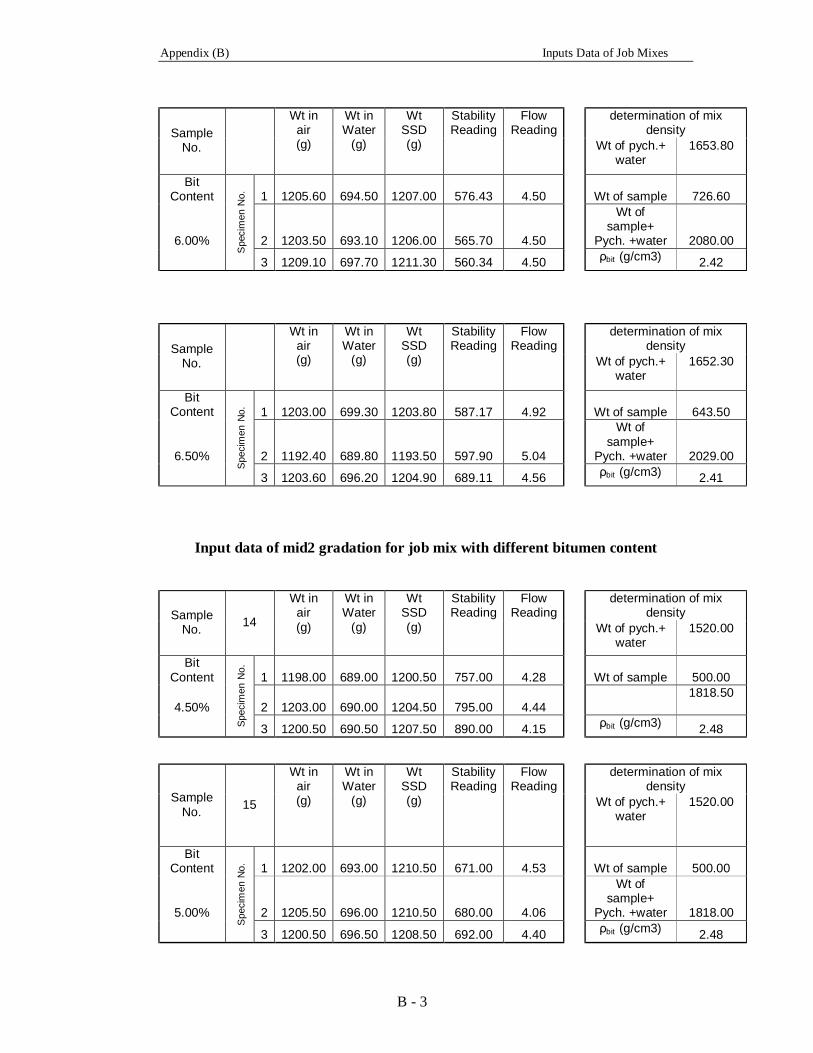
6-3-3 Mid 2 curve Mix -------------------------------------------------------------- 68
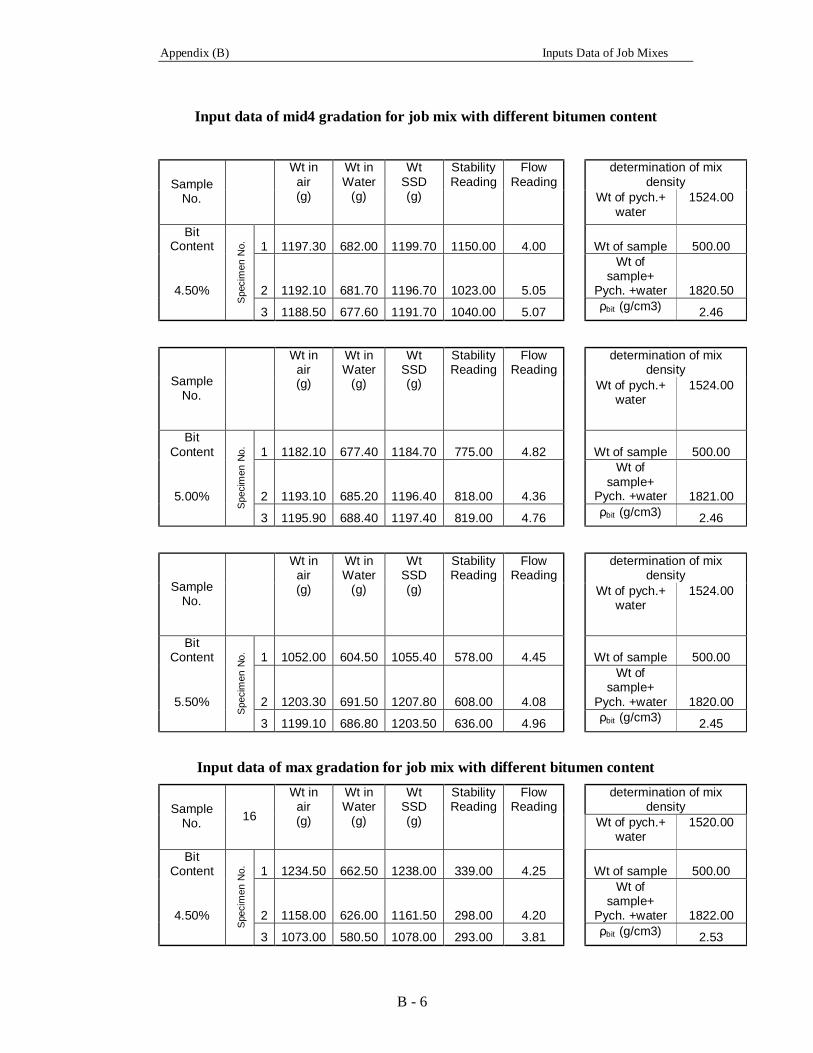
6-3-4 Mid 3 curve Mix -------------------------------------------------------------- 71
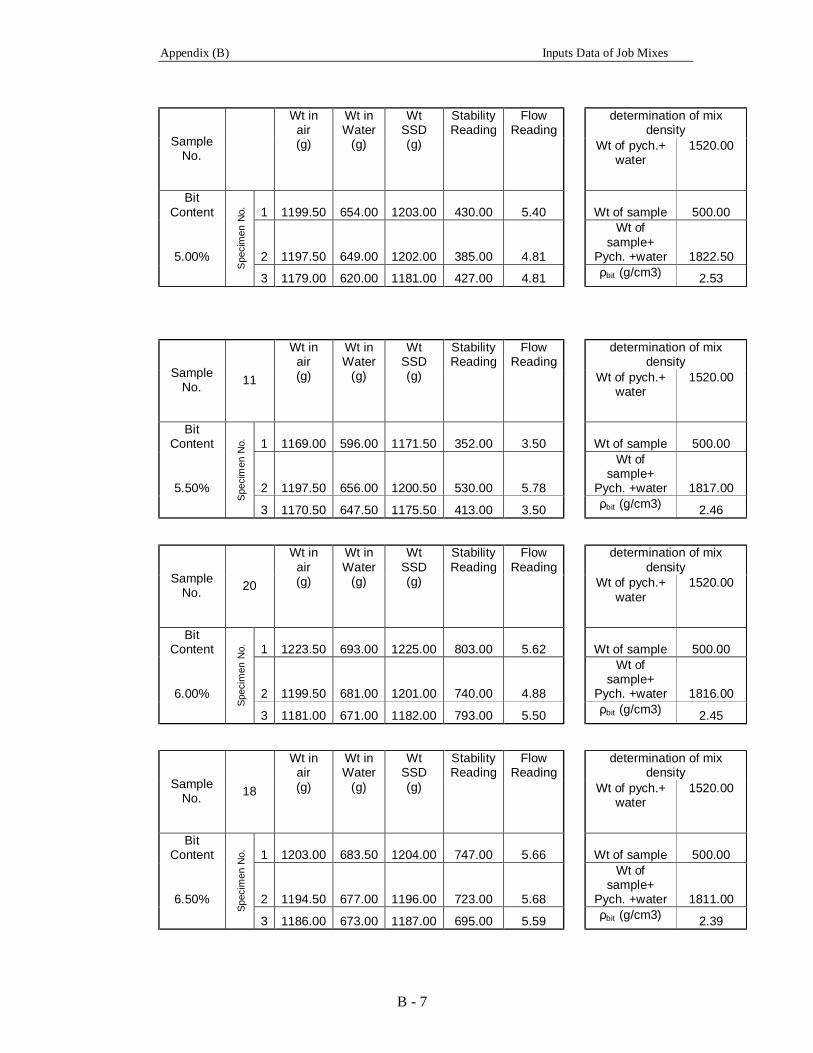
6-3-5 Max. curve Mix -------------------------------------------------------------- 74
6-3-6 Mid4 curve mix --------------------------------------------------------------- 78
6-4 Proposal Specification of Asphalt Wearing Course ----------------------------- 79
6-5 Comparison between the Proposed Specifications and the most popular
requirements “MoG Requirements” ---------------------------------------------------
82
Page 10
viii
Chapter Seven: Conclusions and Recommendations
7-1 Introduction --------------------------------------------------------------------------- 85
7-2 Description of Developed Specification ------------------------------------------ 85
7-3 Conclusions --------------------------------------------------------------------------- 85
7-4 Recommendations ------------------------------------------------------------------- 86
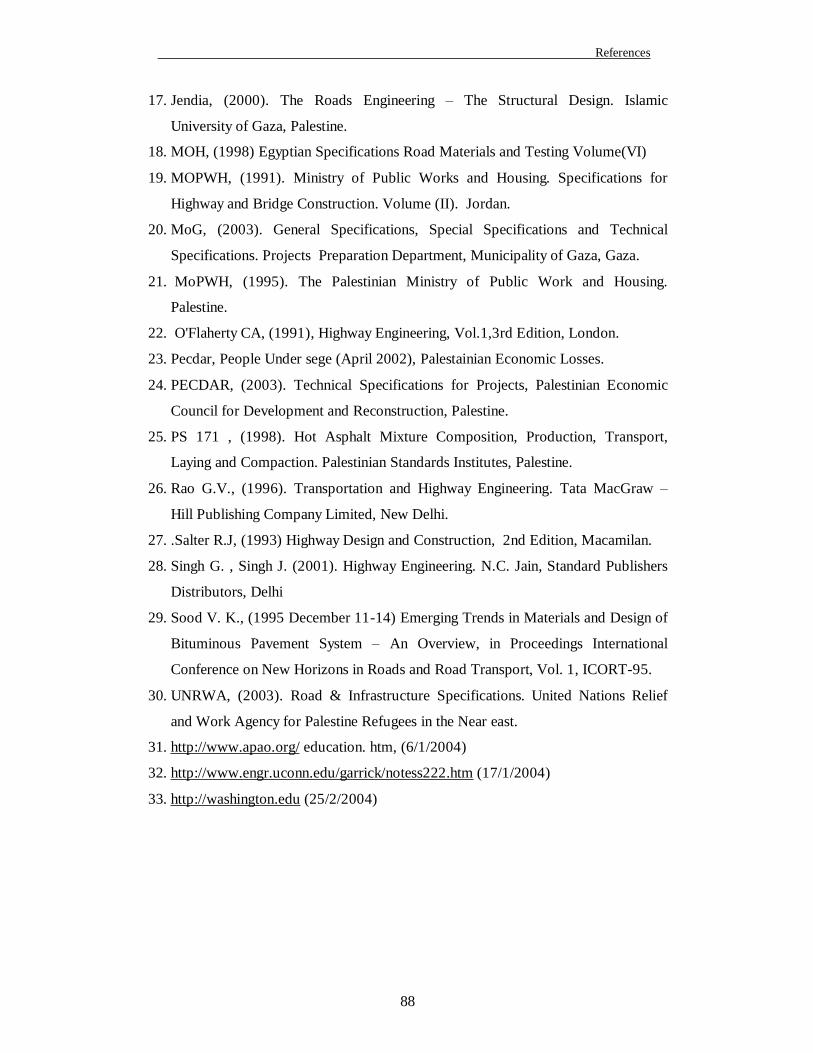
References -------------------------------------------------------------------------------- 87
Appendix
Appendix (A) Mathematical trial method to merge aggregate mixes ------------- A
Appendix (B) Inputs data of job mixes ------------------------------------------------ B
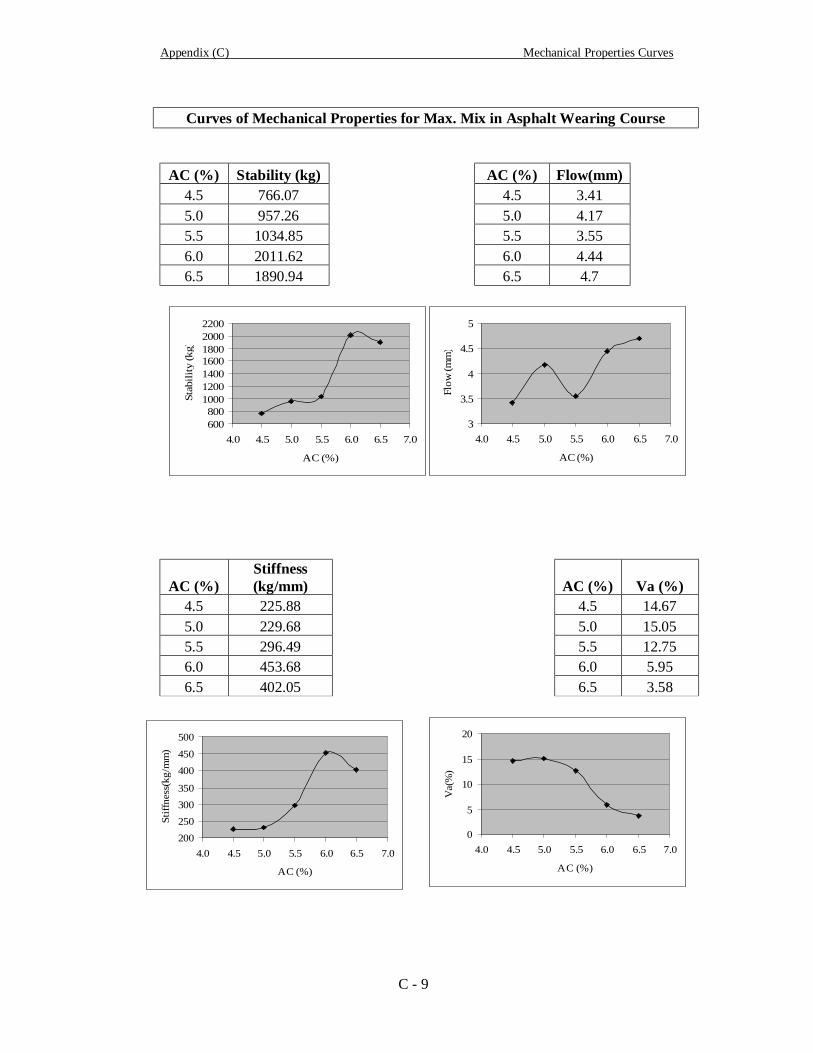
Appendix (C)Mechanical properties curve ------------------------------------------- C
Appendix (D)Photos show method of work in the laboratory ---------------------- D
Page 11
ix
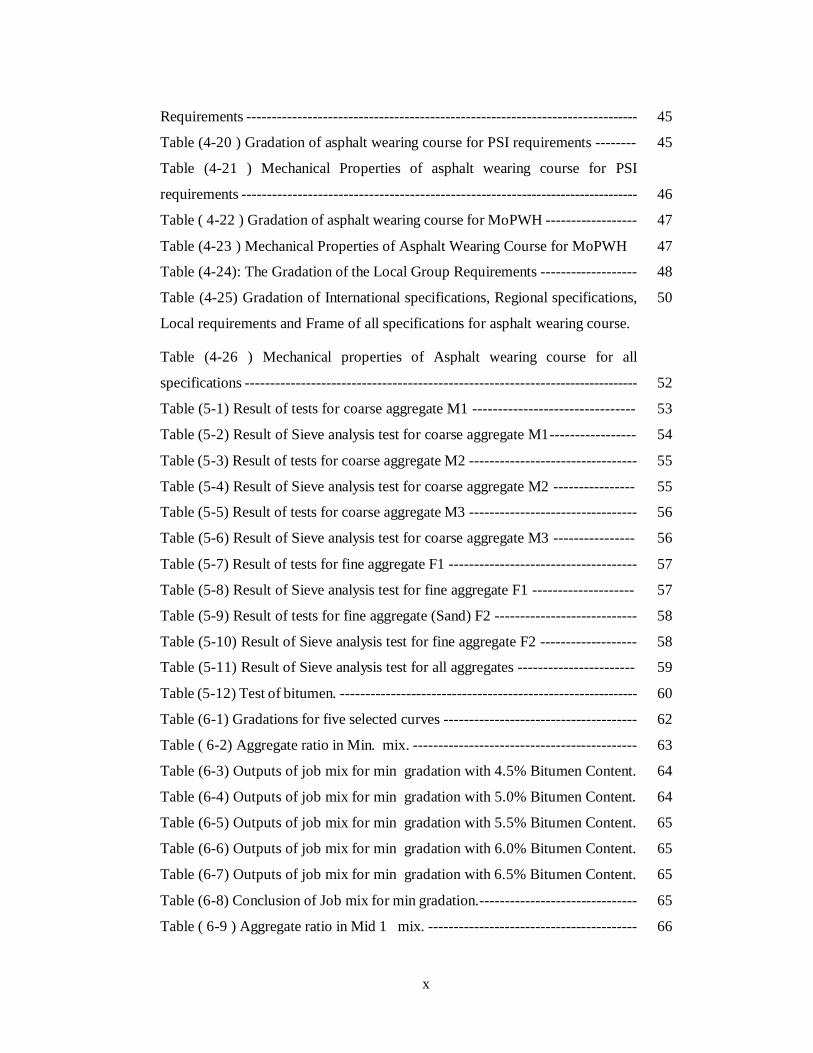
List of Tables: Table (2-1) Particle shape classification ----------------------------------------------- 7
Table (2-2) Grade of Tar and uses ----------------------------------------------------- 12
Table (3-1) Minimum thickness of asphalt layers------------------------------------ 18
Table(4-1) Gradation and Properties of Asphalt Wearing Course (German
Specification ZTV) -----------------------------------------------------------------------
24
Table (4-2 ) Gradation of asphalt wearing course for AASHTO T27 and T11--- 28
Table (4-3) Mechanical Properties and Bitumen content for AASHTO T27
and T11-------------------------------------------------------------------------------------
29
Table (4-4) Gradation of asphalt wearing course for BS 594 , Layer thickness
25 to 50mm and , Layer thickness 35 to 65mm ----------------------------------
30
Table (4-5) Mechanical Properties of Asphalt Wearing Course for BS 594 ----- 31
Table (4-6) Gradation of asphalt wearing course (Ztv 0/11, AASHTO T11, BS
594 Layer thickness 35 to 65mm) -------------------------------------------------
32
Table (4-7) Gradation of asphalt wearing course for Egyptian Specification 34
Table (4-8) Mechanical Properties of Asphalt Wearing Course for Egyptian
Specification ------------------------------------------------------------------------------
35
Table (4-9) Gradation of asphalt wearing course for Jordanian Specification 36
Table (4-10) Mechanical Properties of Asphalt Wearing Course for Jordanian
Specifications ----------------------------------------------------------------------------
37
Table (4-11) Gradation of asphalt wearing course for Iraqi Specification 1983 38
Table (4-12) Mechanical Properties of Asphalt Wearing Course for Iraqi
Specifications 1983 ----------------------------------------------------------------------
39
Table (4-13) Gradation of Asphalt Wearing Course (Iraqi 1983, Egyptian, and
Jordanian Specifications) ----------------------------------------------------------------
39
Table (4-14 ) Gradation of asphalt wearing course for MoG Requirements ----- 41
Table (4-15) Gradation of asphalt wearing course for MoG Requirements ----- 42
Table (4-16) Gradation of asphalt wearing course for PECDAR Requirements 42
Table (4-17) Gradation of asphalt wearing course for PECDAR Requirements 43
Table (4-18 ) Gradation of asphalt wearing course for UNRWA Requirements 44
Table (4-19) Mechanical Properties of Asphalt Wearing Course for UNRWA
Page 12
x
Requirements ----------------------------------------------------------------------------- 45
Table (4-20 ) Gradation of asphalt wearing course for PSI requirements -------- 45
Table (4-21 ) Mechanical Properties of asphalt wearing course for PSI
requirements -------------------------------------------------------------------------------
46
Table ( 4-22 ) Gradation of asphalt wearing course for MoPWH ------------------ 47
Table (4-23 ) Mechanical Properties of Asphalt Wearing Course for MoPWH 47
Table (4-24): The Gradation of the Local Group Requirements ------------------- 48
Table (4-25) Gradation of International specifications, Regional specifications,
Local requirements and Frame of all specifications for asphalt wearing course.
50
Table (4-26 ) Mechanical properties of Asphalt wearing course for all
specifications ------------------------------------------------------------------------------
52
Table (5-1) Result of tests for coarse aggregate M1 -------------------------------- 53
Table (5-2) Result of Sieve analysis test for coarse aggregate M1----------------- 54
Table (5-3) Result of tests for coarse aggregate M2 --------------------------------- 55
Table (5-4) Result of Sieve analysis test for coarse aggregate M2 ---------------- 55
Table (5-5) Result of tests for coarse aggregate M3 --------------------------------- 56
Table (5-6) Result of Sieve analysis test for coarse aggregate M3 ---------------- 56
Table (5-7) Result of tests for fine aggregate F1 ------------------------------------- 57
Table (5-8) Result of Sieve analysis test for fine aggregate F1 -------------------- 57
Table (5-9) Result of tests for fine aggregate (Sand) F2 ---------------------------- 58
Table (5-10) Result of Sieve analysis test for fine aggregate F2 ------------------- 58
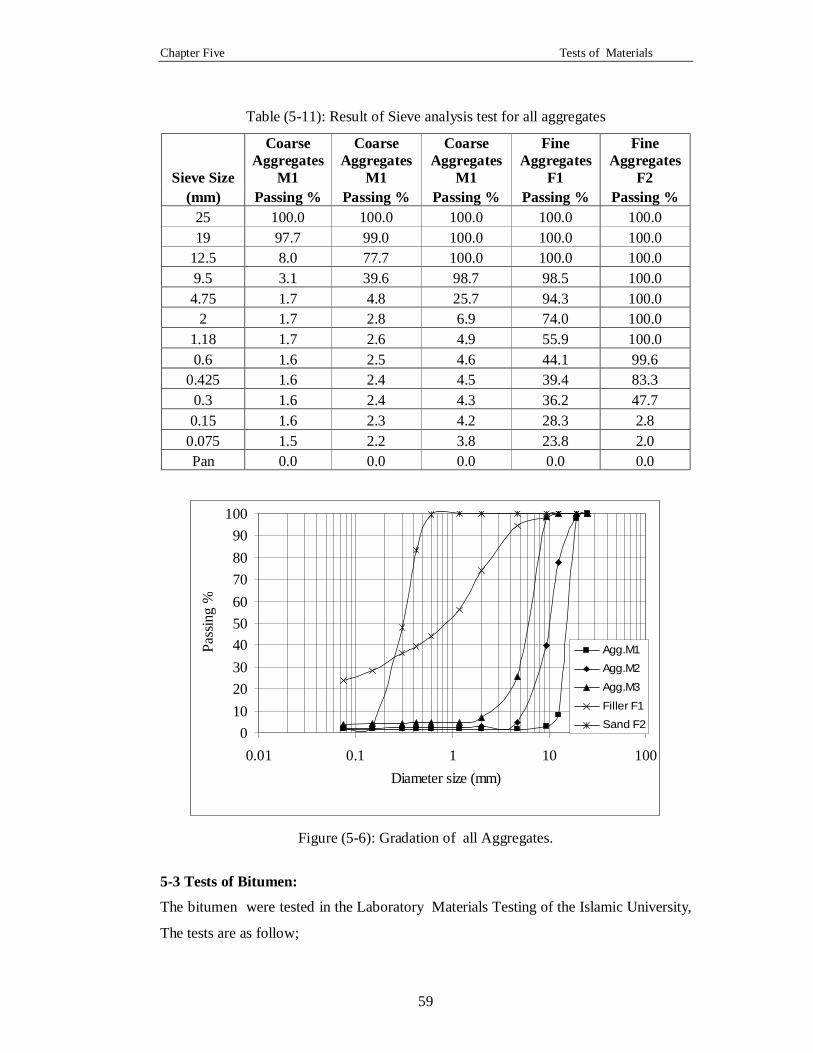
Table (5-11) Result of Sieve analysis test for all aggregates ----------------------- 59
Table (5-12) Test of bitumen. ----------------------------------------------------------- 60
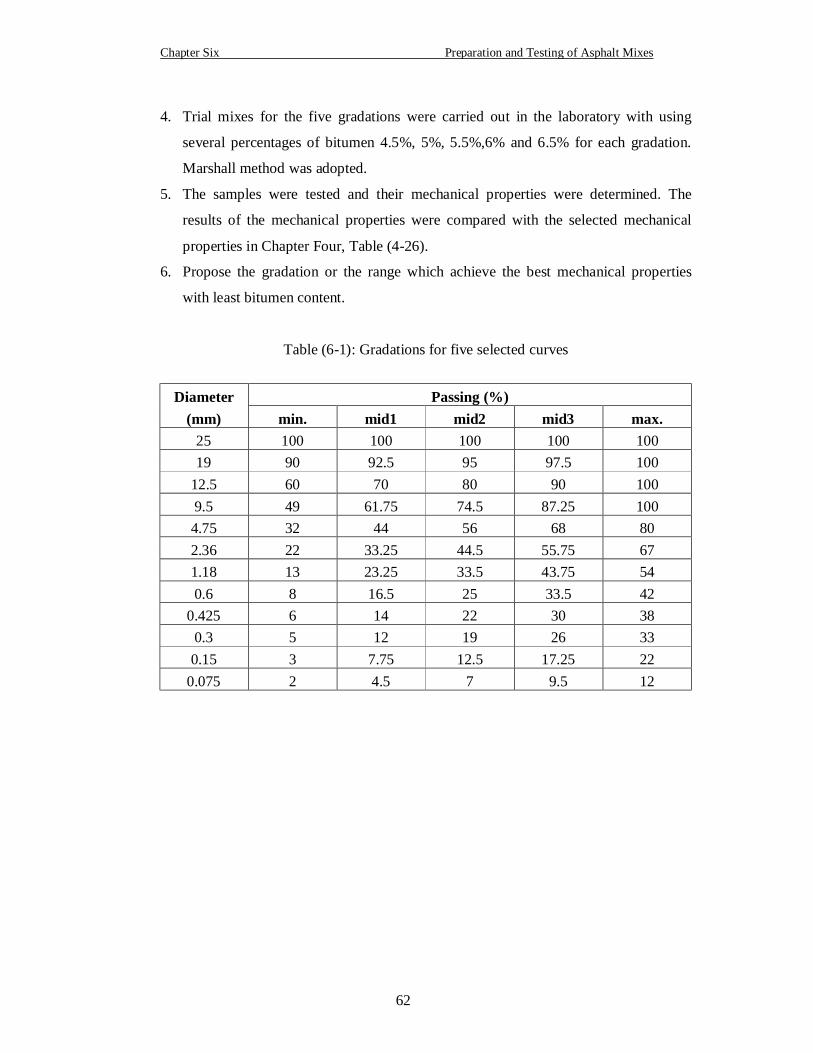
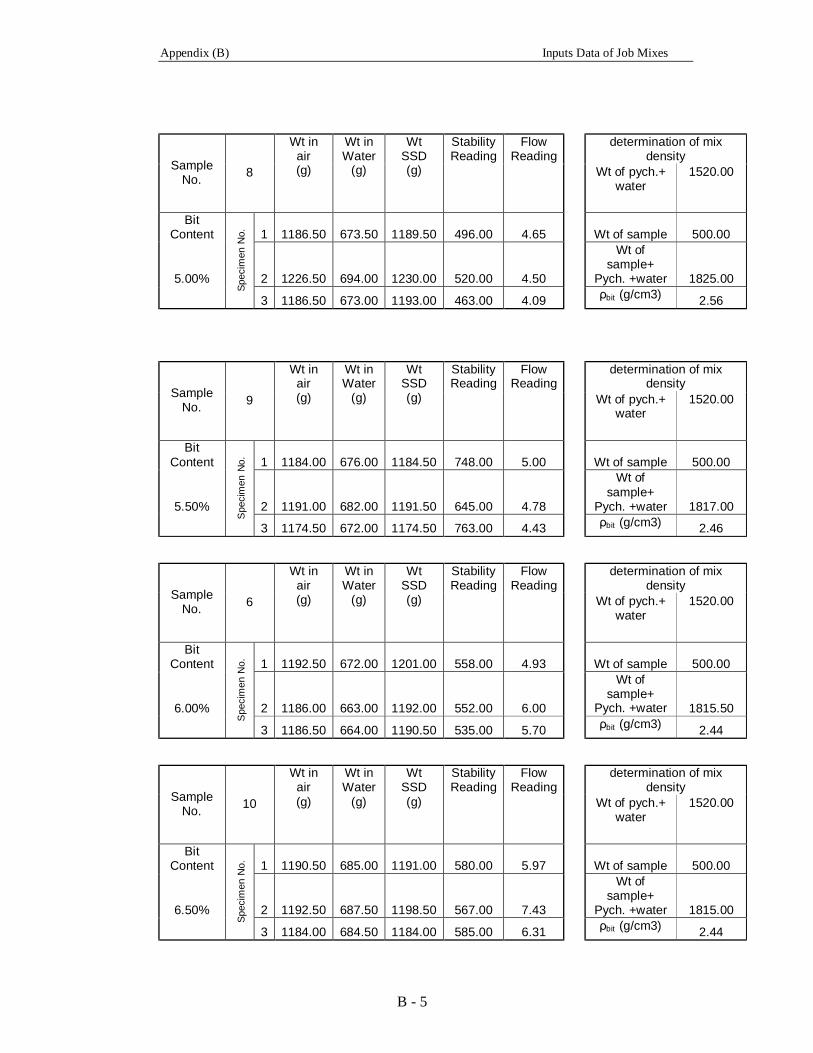
Table (6-1) Gradations for five selected curves -------------------------------------- 62
Table ( 6-2) Aggregate ratio in Min. mix. -------------------------------------------- 63
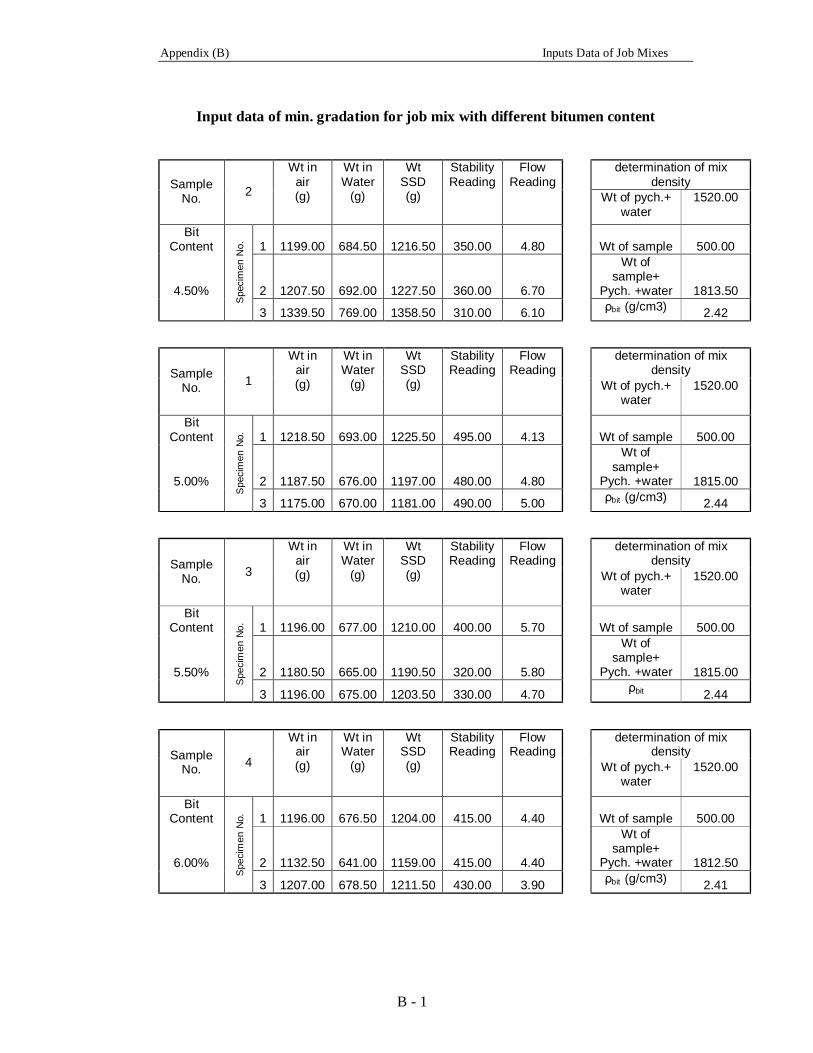
Table (6-3) Outputs of job mix for min gradation with 4.5% Bitumen Content. 64
Table (6-4) Outputs of job mix for min gradation with 5.0% Bitumen Content. 64
Table (6-5) Outputs of job mix for min gradation with 5.5% Bitumen Content. 65
Table (6-6) Outputs of job mix for min gradation with 6.0% Bitumen Content. 65
Table (6-7) Outputs of job mix for min gradation with 6.5% Bitumen Content. 65
Table (6-8) Conclusion of Job mix for min gradation.------------------------------- 65
Table ( 6-9 ) Aggregate ratio in Mid 1 mix. ----------------------------------------- 66
Page 13
xi
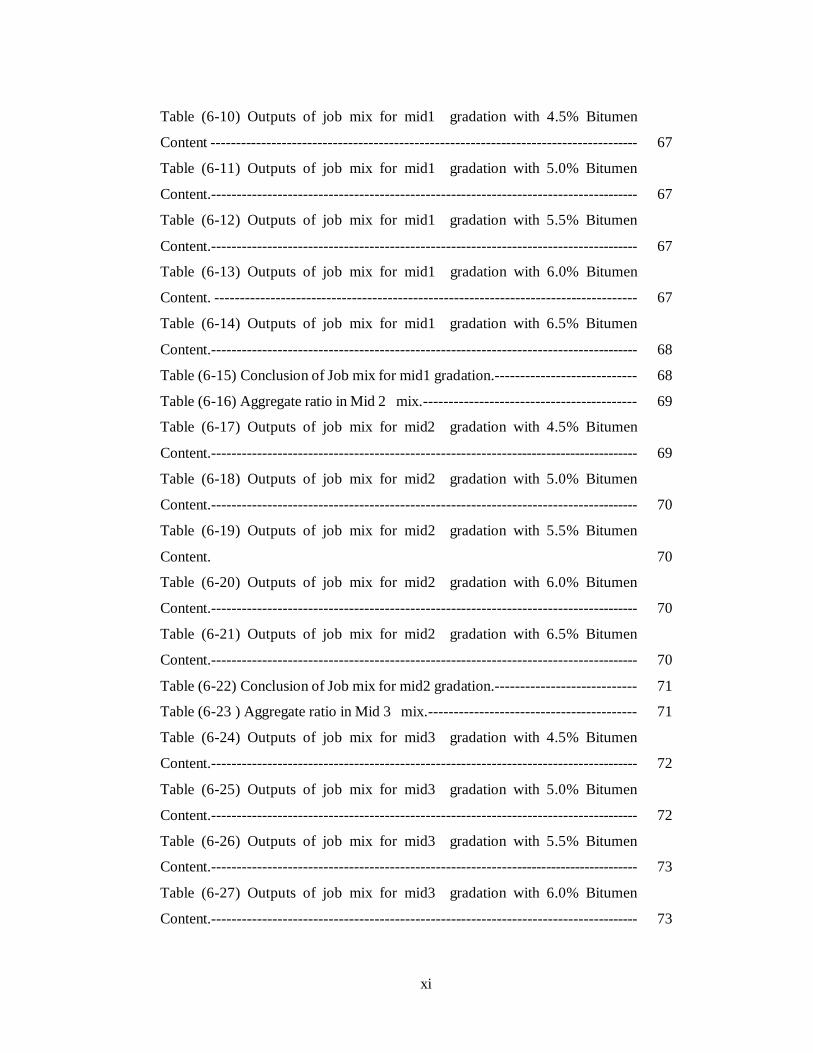
Table (6-10) Outputs of job mix for mid1 gradation with 4.5% Bitumen
Content ------------------------------------------------------------------------------------
67
Table (6-11) Outputs of job mix for mid1 gradation with 5.0% Bitumen
Content.------------------------------------------------------------------------------------
67
Table (6-12) Outputs of job mix for mid1 gradation with 5.5% Bitumen
Content.------------------------------------------------------------------------------------
67
Table (6-13) Outputs of job mix for mid1 gradation with 6.0% Bitumen
Content. -----------------------------------------------------------------------------------
67
Table (6-14) Outputs of job mix for mid1 gradation with 6.5% Bitumen
Content.------------------------------------------------------------------------------------
68
Table (6-15) Conclusion of Job mix for mid1 gradation.---------------------------- 68
Table (6-16) Aggregate ratio in Mid 2 mix.------------------------------------------ 69
Table (6-17) Outputs of job mix for mid2 gradation with 4.5% Bitumen
Content.-------------------------------------------------------------------------------------
69
Table (6-18) Outputs of job mix for mid2 gradation with 5.0% Bitumen
Content.------------------------------------------------------------------------------------
70
Table (6-19) Outputs of job mix for mid2 gradation with 5.5% Bitumen
Content.
70
Table (6-20) Outputs of job mix for mid2 gradation with 6.0% Bitumen
Content.------------------------------------------------------------------------------------
70
Table (6-21) Outputs of job mix for mid2 gradation with 6.5% Bitumen
Content.------------------------------------------------------------------------------------
70
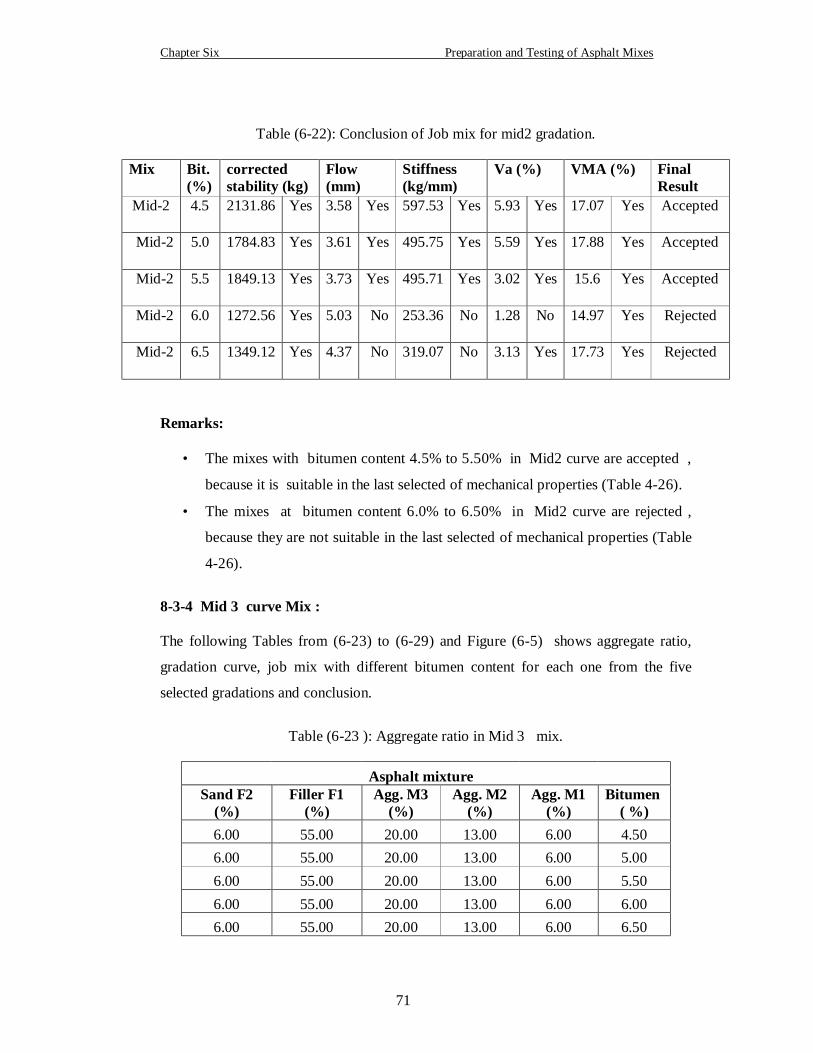
Table (6-22) Conclusion of Job mix for mid2 gradation.---------------------------- 71
Table (6-23 ) Aggregate ratio in Mid 3 mix.----------------------------------------- 71
Table (6-24) Outputs of job mix for mid3 gradation with 4.5% Bitumen
Content.------------------------------------------------------------------------------------
72
Table (6-25) Outputs of job mix for mid3 gradation with 5.0% Bitumen
Content.------------------------------------------------------------------------------------
72
Table (6-26) Outputs of job mix for mid3 gradation with 5.5% Bitumen
Content.-------------------------------------------------------------------------------------
73
Table (6-27) Outputs of job mix for mid3 gradation with 6.0% Bitumen
Content.------------------------------------------------------------------------------------
73
Page 14
xii
Table (6-28) Outputs of job mix for mid3 gradation with 6.5% Bitumen
Content.------------------------------------------------------------------------------------
73
Table (6-29) Conclusion of Job mix for mid3 gradation.---------------------------- 73
Table ( 6-30) Aggregate ratio in Max. mix.------------------------------------------- 74
Table (6-31) Outputs of job mix for max gradation with 4.5% Bitumen
Content.------------------------------------------------------------------------------------
75
Table (6-32) Outputs of job mix for max gradation with 5.0% Bitumen
Content.------------------------------------------------------------------------------------
75
Table (6-33) Outputs of job mix for max gradation with 5.5% Bitumen
Content.-----------------------------------------------------------------------------------
75
Table (6-34) Outputs of job mix for max gradation with 6.0% Bitumen
Content.------------------------------------------------------------------------------------
75
Table (6-35) Outputs of job mix for max gradation with 6.5% Bitumen
Content.-------------------------------------------------------------------------------------
76
Table (6-36) Conclusion of Job mix for max gradation.----------------------------- 76
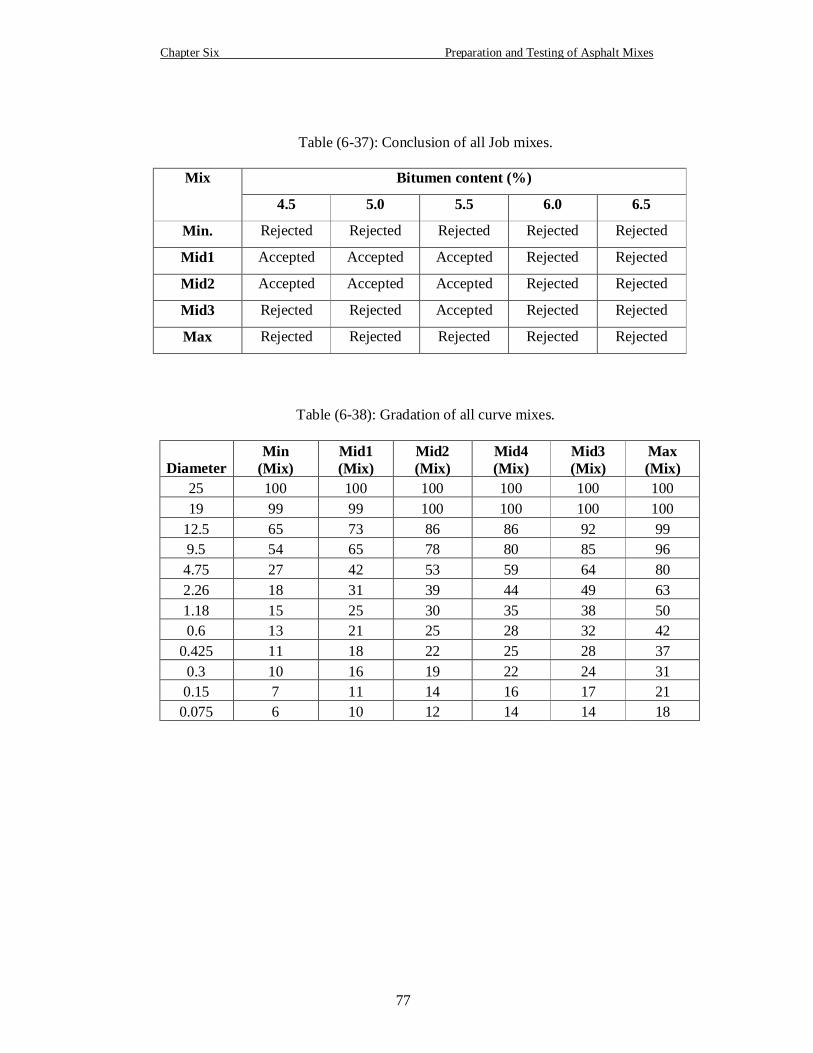
Table (6-37) Conclusion of all Job mixes.--------------------------------------------- 77
Table (6-38) Gradation of all curve mixes.-------------------------------------------- 77
Table (6-39) Aggregate ratio in Mid4 mix.------------------------------------------- 78
Table (6-40) Outputs of job mix for mid4 gradation with 4.5% Bitumen
Content.-----------------------------------------------------------------------------------
78
Table (6-41) Outputs of job mix for max gradation with 5.0% Bitumen
Content.------------------------------------------------------------------------------------
79
Table (6-42) Outputs of job mix for max gradation with 5.5% Bitumen
Content.------------------------------------------------------------------------------------
79
Table (6-43) Conclusion of Job mix for Mid4 gradation.---------------------------- 79
Table (6-44) Gradation of mid1 and mid3 ------------------------------------------- 80
Table (6-45) Gradation of the fitting curves mid1 and mid4 (Proposed
Specification)------------------------------------------------------------------------------
81
Table (6-46) Mechanical Properties of asphalt wearing course and bitumen 82
Table (6-47) Gradation of the proposed specification and MoG Requirements. 83
Table (6-48) Mechanical properties of the proposed specification and MoG
Requirements.------------------------------------------------------------------------------
84
Page 15
xiii
List of Figures: Figure (1-1) Stress distribution -------------------------------------------------------- 1
Figure (2-1) Flexible Pavement Typical pavement structure ----------------------- 14
Figure (4-1) Groups of asphalt wearing course--------------------------------------- 23
Figure (4-2) Gradation of ZTV 0/16S ------------------------------------------------- 25
Figure (4-3) Gradation of ZTV 0/11S ------------------------------------------------- 25
Figure (4-4) Gradation of ZTV 0/11 -------------------------------------------------- 26
Figure (4-5) Gradation of ZTV 0/8 ---------------------------------------------------- 26
Figure (4-6) Gradation of (ZTV – bit) 0/5 -------------------------------------------- 27
Figure (4-7 ) Gradation of asphalt wearing course for AASHTO T27 ------------ 28
Figure (4-8) Gradation of asphalt wearing course for AASHTO T11 ------------ 29
Figure (4-9) Gradation of asphalt wearing course for BS 594 , Layer thickness
25 to 50mm --------------------------------------------------------------------------------
30
Figure (4-10) Gradation of asphalt wearing course for(BS 594 , Layer
thickness 35 to 65mm -------------------------------------------------------------------
31
Figure (4-11) Gradation of asphalt wearing course (Ztv 0/11, AASHTO
T11,BS 594 , Layer thickness 35 to 65mm) -----------------------------------------
33
Figure (4-12 ) Frame of international specification.---------------------------------- 33
Figure (4-13 ) Gradation of asphalt wearing course for Egyptian Specification 35
Figure (4-14 ) Gradation of asphalt wearing course for Jordanian Specification 36
Figure (4-15) Gradation of asphalt wearing course for Iraqi specification 1983 38
Figure (4-16) Gradation of Asphalt Wearing Course (Iraqi 1983, Egyptian,
Jordanian Specifications and frame) --------------------------------------------------
39
Figure (4-17) Gradation of Asphalt Wearing Course (Frame of Regional
Specifications) ---------------------------------------------------------------------------
40
Figure (4-18) Gradation of asphalt wearing course for MoG Requirements ----- 41
Figure (4-19) Gradation of asphalt wearing course for PECDAR Requirements 43
Figure (4-20) Gradation of asphalt wearing course for UNRWA Requirements 44
Figure (4-21) Gradation of asphalt wearing course for PSI requirements -------- 46
Figure (4-22) Gradation of asphalt wearing course for MoPWH ----------------- 47
Figure (4-23) Gradation of asphalt wearing course (MoG, PECDAR, UNRWA,
PSI , M.o PWH and frame of local requirements) --------------------
49
Page 16
xiv
Figure (4-24) Gradation of asphalt wearing course (Frame of local
requirements ------------------------------------------------------------------------------
49
Figure (4-25) Gradation of International specifications, Regional
specifications, Local requirements and Frame of all specifications For asphalt
wearing course.----------------------------------------------------------------------------
50
Figure (4-26) Gradation of asphalt wearing course (Frame of all specifications) 51
Figure (5-1 ) Gradation of Coarse Aggregate M1 ----------------------------------- 54
Figure (5-2 ) Gradation of Coarse Aggregate M2 ----------------------------------- 55
Figure (5-3) Gradation of Coarse Aggregate M3 ------------------------------------ 56
Figure (5-4 ) Gradation of Fine Aggregate F1 ---------------------------------------- 57
Figure (5-5) Gradation of Fine Aggregate F2 (Sand) -------------------------------- 58
Figure (5-6) Gradation of all Aggregates. -------------------------------------------- 59
Figure (6-1) Gradations for five selected curves ------------------------------------ 63
Figure (6-2 ) Gradation of min. and mix curves. ------------------------------------ 64
Figure (6-3 ) Gradation of mid1. and mix curves. ----------------------------------- 66
Figure (6-4 ) Gradation of mid2. and mix curves.----------------------------------- 69
Figure ( 6-5 ) Gradation of mid 3 and mix curves. ---------------------------------- 72
Figure (6-6 ) Gradation of max. and mix curve.-------------------------------------- 74
Figure (6-7 ) Gradation of all curve mixes.-------------------------------------------- 78
Figure (6-8) Gradation of mid1 and mid3 --------------------------------------------- 80
figure (6-9) Gradation of the fitting curves mid1 and mid3 (Proposed
Specification) -----------------------------------------------------------------------------
81
Figure (6-10) Gradation of MoG and the Proposed Specification --------------- 83
Page 17
xv
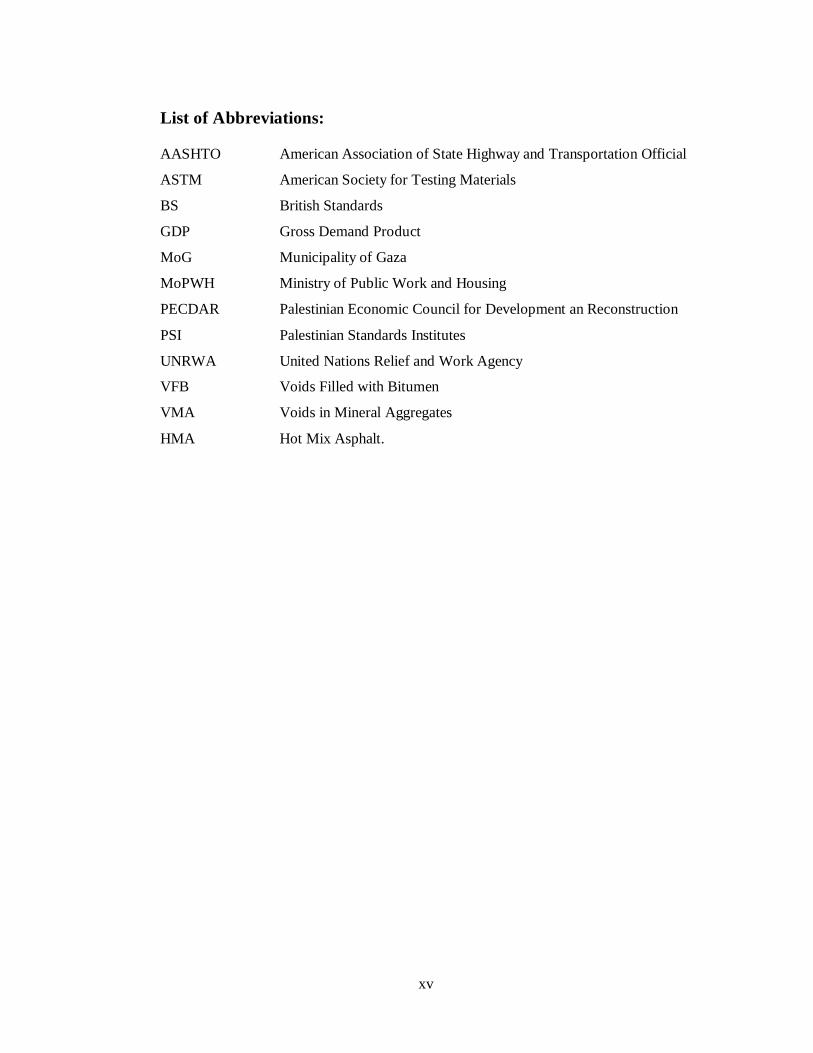
List of Abbreviations:
AASHTO American Association of State Highway and Transportation Official
ASTM American Society for Testing Materials
BS British Standards
GDP Gross Demand Product
MoG Municipality of Gaza
MoPWH Ministry of Public Work and Housing
PECDAR Palestinian Economic Council for Development an Reconstruction
PSI Palestinian Standards Institutes
UNRWA United Nations Relief and Work Agency
VFB Voids Filled with Bitumen
VMA Voids in Mineral Aggregates
HMA Hot Mix Asphalt.
Page 18
Chapter One Introduction
1
Chapter One Introduction
1-1 Introduction:
Roads transportation play an essential role in the life of any community today, it is
important to economic activities and communications. A good road system gives a
country a competitive edge in moving goods efficiently and economically (O'Flaherty,
1991). Given the dominance of the road transportation mode, civil engineers must
strive toward two goals, the provision of a high level of service (i.e., minimum travel
times and delay) and the provision of a high level of safety (Fred, 1990).
It has been recognized that pavement is an engineering structure designed and
constructed to provide a suitable surface for the operation of automobiles on highways
and streets or for aircrafts on airports. The complex system of stresses due to the vehicle
loads and various other factors are to be resisted by the pavement layers under varying
environmental conditions (Sood, 1995).
Flexible pavement is a layered system the essential characteristics of the materials used
for the construction of bituminous pavement depend to a large extent on their relative
position within the structure. The uppermost layer of an pavement is defined as the
wearing course and its function is to distribute the high stresses imposed at the tire road
surface interfaces as illustrated in Figure (1-1) (Salter, 1993)
.It must be waterproofed and sloped to shed surface water to the roadside and protect
the entire asphalt pavement structure and the natural formation from the erosive effects
of moisture. It must resist wear, caused by traffic, and still retain necessary anti-skid
properties. It must also be bonded to the layer or course beneath it (Salter,1993).
Figure (1-1): Stress distribution (Salter,1993)
Page 19
Chapter One Introduction
2
1-2 Statement of the problem:
Prior to Al Aqsa Intifada, the transportation sector contributed 5.4% of the Palestinian
gross demand product (GDP), in the meantime, it is paralyzed by 70% and total losses
have accumulated to over US$ 303 million (Pecdar, 2002).
Gaza Governorate manages about 295 km long of roads in which 66 km are only in a
good surface condition (Pecdar, 2002). These roads have the following threats:
• Improper design and not following the specifications at construction.
• Increase rate of deterioration.
• Limited resources (geometry, funds, Materials …etc)
• Israeli occupation.
There are special road specifications for each country and the most famous
specifications in the world are the American Association of State and Highway
Transportation Officials (AASHTO), British Specification (BS 594) and German
Specification (ZTV asphalt - StB 94). The roads specification in Palestine is taken from
the previous mentioned specifications or from the Arab Specifications which depend on
the international specifications.
The proposed asphalt wearing course specification is very important because it will be
assured that the asphalt concrete designed correctly and suited conventional local
materials.
If the involved organizations adopt the proposed specification, potential conflicts
between the organizations and contractors will be avoided and the problems among the
owners, supervisors, the implementing agencies, the owner of asphalt factories and the
laboratories will be decreased.
1-3 Research Aim and Objectives:
The aim of the research is propose a specification for asphalt wearing course in
Palestine using local materials.
The research work is intended to achieve the following objectives:
§ Studying the properties of the locally available materials as aggregate and
bitumen.
Page 20
Chapter One Introduction
3
§ Studying some of the international specifications, regional specifications and
local requirements used for wearing asphalt course.
1-4 Methodology:
The methodology consists of a theoretical study and a practical study.
a- Theoretical Study
1- Literature Review
• Study the asphalt technology.
• Study worldwide and local similar studies.
2- Specifications and local Requirements
• Study the international specifications as the American Specifications
(AASHTO), British Specification (BS 594) and German Specification (ZTV
asphalt - StB 94).
• Study the regional asphalt wearing course specification as Egyptian
Specification, Jordanian Specification and Iraqi Specification.
• Study the local requirements as municipalities requirements, PECDAR, and
UNRWA.
• Analyzing and comparing the mentioned specifications.
b- Practical Study:
• Select five types of aggregates from the local aggregates in Palestine and
conduct tests for each type.
• Conduct bitumen tests using bitumen available in factories in Gaza Strip.
• Make 28 trail mixes with different bitumen contents and prepare 112
specimens .
• Measure the stability, flow, stiffness, Va% , VMA (%) VFB (%) for each
specimen.
• Select the proposed specification for wearing asphalt course which suitable to
the Palestinian local materials
1-5 Report Organization:
The undertaken research consists of nine chapters that cover the proposed
subject as follows:
Page 21
Chapter One Introduction
4
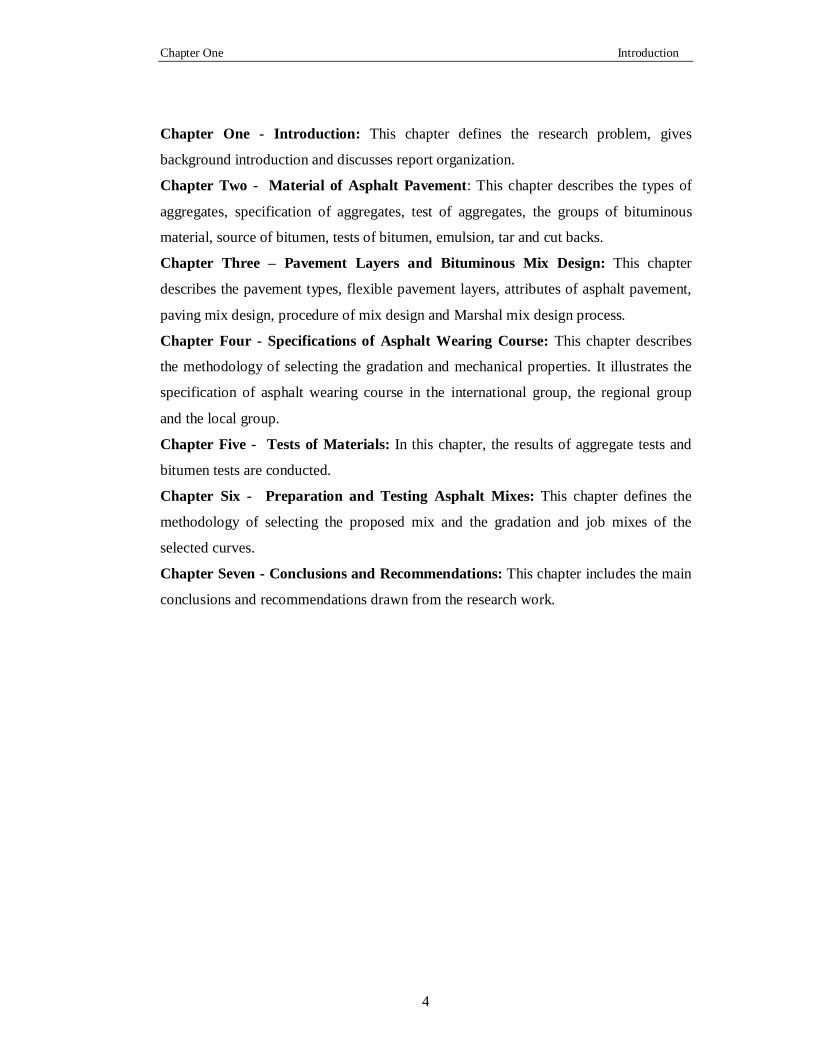
Chapter One - Introduction: This chapter defines the research problem, gives
background introduction and discusses report organization.
Chapter Two - Material of Asphalt Pavement: This chapter describes the types of
aggregates, specification of aggregates, test of aggregates, the groups of bituminous
material, source of bitumen, tests of bitumen, emulsion, tar and cut backs.
Chapter Three – Pavement Layers and Bituminous Mix Design: This chapter
describes the pavement types, flexible pavement layers, attributes of asphalt pavement,
paving mix design, procedure of mix design and Marshal mix design process.
Chapter Four - Specifications of Asphalt Wearing Course: This chapter describes
the methodology of selecting the gradation and mechanical properties. It illustrates the
specification of asphalt wearing course in the international group, the regional group
and the local group.
Chapter Five - Tests of Materials: In this chapter, the results of aggregate tests and
bitumen tests are conducted.
Chapter Six - Preparation and Testing Asphalt Mixes: This chapter defines the
methodology of selecting the proposed mix and the gradation and job mixes of the
selected curves.
Chapter Seven - Conclusions and Recommendations: This chapter includes the main
conclusions and recommendations drawn from the research work.
Page 22
Chapter Two Materials of Asphalt Pavement
5
`Chapter Two
Materials of Asphalt Pavement 2-1 Introduction:
Aggregates used in asphalt mixes are hard, inert materials such as crushed gravel and
stone. Properly selected and graded aggregates are mixed with the asphalt cement to
form asphalt mixes. Aggregates form the principal load carrying component of the mix
and total 90 to 95% of the mixture by weight (75 to 85% by volume) (www.apao.org,
2004).
There has been some confusion in regard to the terms 'Asphalt' and 'Bitumen'. In U.S.A.
the term 'asphalt' is used to refer to both the products manufactured from crude
petroleum in the refinery and also to the natural or artifficitual mixture in which it is
associated with inert mineral matter. But else where in the world the refinery product is
termed bitumen and the mixture of bitumen and inert mineral matter as asphalt.
Asphalt binders have been used in road construction for centuries. Although there are
natural deposits of asphalt, most asphalt used today is produced through refining crude
oil (Singh, 2001).
Asphalt is a strong cement that is very adhesive and highly waterproof. It is also highly
resistant to most acids, alkalis, and salts (www.apao.org, 2004) 2-2 Types of Aggregates:
Paving aggregates are often classified according to source or means of preparation. The
following are brief descriptions of the various classifications. (www.apao.org,2004)
1. Pit or bank-run aggregates: Both sand and gravel are pit or bank-run natural
aggregates. They are usually screened to proper size and washed before being
used in paving construction.
2. Processed aggregates: When natural or bank-run aggregate has been crushed
and screened to make it suitable for asphalt mixes, it is considered a processed
aggregate. Crushing typically improves the particle shape (by making the
rounded particles more angular) and the surface texture (by making the surface
rougher).
3. Quarry aggregates: Paving aggregates are also produced by removing sound
rock from the face of the quarry (by blasting or other means) and then crushing
Page 23
Chapter Two Materials of Asphalt Pavement
6
and sizing the materials to produce the desired construction material. Quarry
aggregates, because of their rough texture and angular shape, often result in
higher stability mixes.
4. Synthetic aggregates: Aggregates produced by altering both the physical and
chemical properties of the parent material are called synthetic (or artificial)
aggregates.
2-3 Classification of aggregates:
Based on strength properties, Aggregate may be classified as (Singh, 2001);
1- Hard aggregates are used to resist crushing effects and adverse weather effects.
Granite trap etc give hard type of aggregate. They should be used for superior
road wearing courses and intermediate courses.
2- Soft aggregates are usable in low cost roads. They can be used in lower layers
of good type of roads. Moorum, kankar, laterite, brick aggregates, shale, and
slag are the aggregates included under soft aggregates
2-4 Specification of aggregates:
Aggregates are specified according to their (Rao, 1996);
1- Grain size.
2- Shape.
3- Texture.
4- Gradation.
2-5 Test for Road Aggregates:
In order to determine the suitability of aggregate for road construction. The following
tests can be carried out; ( Singh, 2001)
1- Los-angles abrasion test. (for hardness)
2- Crushing test. (for crushing strength)
3- Impact test. (for toughness)
4- Soundness test. (for durability)
5- Specific gravity test.
6- Water absorption test.
7- Bitumen affinity or stripping test.
Page 24
Chapter Two Materials of Asphalt Pavement
7
8- Shape test.
9- Sieve analysis test.
10- Moisture content test.
2-6 Particle shape classification:
Roundness is a measure of the relative sharpness or angularity of the edges and corners
of a particle. BS812: Part I: 1975 recommends a particle shape classification.
Reproduced in Table (2-1) this gives a convenient classification of roundness (Rao,
1996).
Table (2-1): Particle shape classification (Rao, 1996)
No. Classification Description Examples
1- Rounded Fully water-worn or completely shaped
by attrition.
River or seashore grave;
desert, seashore and
wind-blown sand.
2- Irregular Naturally irregular, or partly shaped by
attention and having rounded edges.
Other gravel; land or dug
flint.
3- Flaky Material of which are thickness is small
relative to the other two dimensions.
Laminated rock
4- Angular Possessing well defined edges formed at
the intersection of roughly planar faces
Crushed rocks of all
types; talus; crushed slag
5- Elongated Material, usually angular, in which the
length is considerably larger than other
two dimensions
----
6- Flaky and
elongated
Material having the length considerably
larger than the width and the width
considerably larger than the thickness
----
2-7 Desirable Aggregate Properties:
Selection of an aggregate material for use in an asphalt concrete pavement depends on
the availability, cost, and quality of the material as well as the type of construction for
which it is intended. The suitability of aggregates used in asphalt construction are
evaluated in terms of the following properties (www.apao.org,2004);
Page 25
Chapter Two Materials of Asphalt Pavement
8
1- Size and grading: The maximum size of an aggregate is the smallest sieve
through which 100% of the material will pass. The asphalt concrete use
determines not only the maximum aggregate size, but also the desired gradation
(distribution of sizes smaller than the maximum). The nominal maximum size is
used to specify the aggregate gradation. It is the standard sieve at which 90-95%
of the aggregate passes this dimension.
2- Durability: Toughness or hardness is the ability of the aggregate to resist
crushing or disintegration during mixing, placing, compacting, and under traffic
loading.
3- Soundness: Although similar to durability, soundness is the aggregate’s ability
to resist deterioration caused by natural elements such as the weather.
4- Workability: The shape of aggregate particles influence the asphalt mixture’s
overall strength and workability as well as the density achieved during compac-
tion. When compacted, irregular particles such as crushed stone tend to “lock”
together and resisted displacement. and pavement strength are influenced by
surface texture. A rough, sandpapery texture results in a higher strength than a
smooth texture. Although smooth faced aggregates are easy to coat with an
asphalt film, they are generally not as good as rough surfaces. It is harder for
the asphalt to “grip” the smooth surface.
5- Cleanliness: Foreign or deleterious substances make some materials unsuitable
for paving mixtures.
6- Absorption: The porosity of an aggregate permits the aggregate to absorb
asphalt and form a bond between the particle and the asphalt. A degree of
porosity is desired, but aggregates that are highly absorbent are generally not
used.
7- Moisture sensitivity: When the asphalt film separates from the aggregate
because of the action of water, it is called stripping. Aggregates coated with too
much dust also can cause poor bonding which results in stripping. Aggregates
readily susceptible to stripping action usually are not suitable for asphalt paving
mixtures unless an anti-stripping agent is used.
2-8 Groups of Bituminous Materials
The Bituminous materials are divided to (Jendia, 2000),
Page 26
Chapter Two Materials of Asphalt Pavement
9
1. Road bitumen.
2. Cutback bitumen.
3. Emulsion.
4. Tar.
2-9 Sources of Bitumen:
There are two sources (www.engr.uconn.edu, 2004);
1- Natural Sources:
Lake asphalts (Place: Bermudez and Trinidad)
Gilsonite - occur in faults, large deposit in Utah, very hard substance, used in varnish
forms on roads.
Rock asphalts - sandstone or limestone impregnated with asphalt (0 to 20% asphalt).
2-Petroleum sources:
Most commercial asphalt is from petroleum refining. Asphalt is obtained from crude oil
by a process called fractional distillation.
Crude oil is a mixture of different hydrocarbons which are mutually soluble - fractional
distillation is used to separate the fractions based on boiling point.
The asphalt properties depend on the crude source and the manufacturing process. 2-10 Chemical composition of bitumen:
Bitumen's chemical composition is extremely complex. According to the most accepted
analysis, bitumen can be divided in to the following three main fractions (Singh, 2001);
1. Asphaltenes.
2. Maltenes.
3. Carbenes.
2-11 Tests of bitumen:
The various tests for bitumen are as follows (Singh, 2001);
1- Penetration test.
2- Furol viscosity test.
3- Float test.
4- Kinematic viscosity test.
5- Ductility test.
6- Softening point test.
Page 27
Chapter Two Materials of Asphalt Pavement
10
7- Specific gravity test.
8- Flash point and fire point test.
9- Spot test.
10- Loss on heating test.
11- Water content test.
12- Solubility test
13- Distillation test.
2-12 Cut back Bitumen:
Cut-back is defined as a bitumen whose viscosity has been reduced by the addition of a
volatile diluents. Volatile diluents are gasoline or Naphtha, kerosene and high boiling-
light oils. (Rao, 1996)
The important features of the cut-back are its viscosity at the temperature of its use and
also the rate at which it sets. 2-13 Types of Cut-backs:
Generally three types of cut-backs are commercially manufactured (Rao, 1996) ;
1-Rapid curing (R.C.).
2- Medium curing (M.C.)
3- Slow curing (S.C.)
Each of the three types of cut-backs are available in six different viscosities. The six
different viscosities are named by numbers from 0 to 5 in increasing order of viscosity.
The 0 grade has the lowest viscosity and 5 grade the highest. Also the viscosity of RC-
0, MC-0 and SC-0 is the same, so also that RC-1, MC-1 and SC-1 etc. 2-14 Test for cut-backs:
The various tests for cutbacks are follows (Singh,2001);
1. Viscosity test.
2. Distillation test.
3. Penetration test.
4. Ductility test.
5. Solubility test.
6. Flash point test.
Page 28
Chapter Two Materials of Asphalt Pavement
11
2-15 Emulsion:
Emulsion is a combination of water, bitumen, and an emulsifying agent. Bitumen does
not dissolve in water. But when heated bitumen and water are mixed together and
agitated the bitumen disperses in water in the form of spherical globules of about 2
micron diameter.
Depending upon the stability of the protective coating of emulsifying agent the
emulsion may be classified or termed as Rapid setting (RS), Medium setting (MS), and
slow setting (SS).
Bitumen/tar content of emulsions vary from 30% to 60%. Emulsifying agent is normally
0.5 to 1% and the remaining portion of the emulsion is water (Singh, 2001).
Emulsion can be used in soil stabilization and in patch repair works on bituminous
roads. The main feature of the emulsion is to be used in wet conditions also. 2-16 Tests for bitumen emulsions:
The following tests can be made on a bitumen emulsion. (Rao, 1996)
1- Demulsibility test.
2- Settlement test.
3- Sieve test
4- Mixing test
5- Distillation test.
6- Particle charge test.
7- Oil distillate test.
8- Tests for residue.
2-17 Tar:
Tar is a liquid obtained when natural organic materials such as wood and coal are
destructively distilled in the absence of air. A part from various other products, this
process yields crude tar, which is refined for us as road tar. It may also blend with some
distillate fractions again to produce the desired road tar. However, the tar not often used
in road work. (Rao, 1996)
Road tars are manufactured in five grades viz RT-1, RT-2,RT-3,RT-4,and RT-5, all the
grades vary in viscosity and other properties. To what use every grade of tar can be put
is given in Table (2-2).
Page 29
Chapter Two Materials of Asphalt Pavement
12
Table (2-2): Grade of Tar and uses (Singh, 2001)
Grade of Tar Uses
RT-1 Being of very low viscosity can be used for cold weather conditions.
RT-2 Used for surface dressing under normal climate conditions.
RT-3 Can be used for surface dressing renewal coat, premix top courses etc.
RT-4 Pemix tar Macadam in base courses.
RT-5 Grouting purpose.
2-18 Tar Tests:
Following tests can be made on road tars to test their properties (Singh 2001),
1- Specific gravity test.
2- Equi- viscous temperature (EVT).
3- Viscosity by standard tar viscometer.
4- Softening point.
5- Water content.
6- Amount of phenols by volume.
7- Naphthalene percent by weight.
8- Float test.
9- Insoluble matter in percent by weight in Toluene.
10- Distillation fraction on distillation up to 200Co to 270Co and 270Co to 330Co.
2-19 Conclusion:
1- The aggregate tests which available in the laboratory are;
• Sieve analysis test.
• Moisture content test.
• Water absorption test.
• Specific gravity test.
• Los Angles test.
2- The bitumen tests which available in the laboratory are;
• Penetration test.
• Ductility test.
• Softening point test.
• Specific gravity test.
Page 30
Chapter Three Pavement Layers and Bituminous Mix Design
13
Chapter Three
Pavement Layers and Bituminous Mix Design
3-1 Introduction:
Asphalt binders have been used in road construction for centuries. Although there are
natural deposits of asphalt, most asphalts used today is produced through refining crude
oil. Asphalt is a strong cement that is very adhesive and highly waterproof. It is also
highly resistant to most acids, alkalis, and salts (www.apao.org, 2004).
Hot-mix bituminous concrete for pavements is a mixture of blended aggregate filled
with bituminous cement binder. The design of a bituminous concrete mix consists of
the determination of aggregates gradation and the necessary content of bituminous
cement to produce a mixture that will be durable, have the stability to withstand traffic
loads, and be workable for placement and compaction with the construction 3-2 Desirable Characteristics of Pavements:
Owners of pavements are interested in having pavements which possess the following
characteristics (www.apao.org, 2004).
1. Smoothness: The public demands smooth pavements with a quiet ride. A
recent Federal Highway Administration (FHWA) survey (1996) indicated ride to
be the most important feature to users of pavements.
2. Durability: Agencies and private owners of pavements want them to withstand
the detrimental effects of traffic and environment for the expected service lives.
3. Safety: Users expect the pavements they operate on to be safe. They should
offer good skid resistance, be free of surface defects, provide contrast for lane
markings, minimize splash and spray and pavement glare, etc.
4. Aesthetics: Users of pavements are also concerned with the appearance of the
pavement surface. Patches and other irregularities in the surface, indicate the
pavement is not durable and often results in roughness/safety problems. 3-3 Pavement Types:
Pavements are generally asphalt or Portland cement concrete surfaced or interlock
pavement, these types are follow (www.engr.uconn.edu, 2004);
1. Flexible pavements: Those which are surfaced with bituminous (or asphalt)
materials. These types of pavements are called "flexible" since the total
Page 31
Chapter Three Pavement Layers and Bituminous Mix Design
14
pavement structure "bends" or "deflects" due to traffic loads. A flexible
pavement structure is generally composed of several layers of materials
which can accommodate this "flexing". Flexible pavements comprise about
93 percent of U.S. paved roads.
2. Rigid pavement: Those which are surfaced with Portland cement concrete
(PCC). These types of pavements are called "rigid" because they are
substantially stiffer than flexible pavements due to PCC's high stiffness.
Rigid pavements comprise 7 percent of U.S. paved roads.
3. Interlock Pavement: It is made using special stones interlocked with
specify shapes. 3-4 Flexible Pavement Layers:
A flexible pavement structure is typically composed of several layers of
material. Each layer receives the loads from the above layer, spreads them out,
then passes on these loads to the next layer below (see Figure 3-1).
_____________________ Asphalt wearing course
_____________________
Asphalt binder course _____________________
Base
______________________
Sub-base
________________________
Sub-grade
Figure ( 3-1 ): Flexible Pavement structure. (www.engr.uconn.edu, 2004)
3-4-1 Asphalt Covering Layers:
The covering layer is the layer in contact with traffic loads and normally
contains the highest quality materials. It provides characteristics such as friction,
Page 32
Chapter Three Pavement Layers and Bituminous Mix Design
15
smoothness, noise control, rut and shoving resistance and drainage. In addition,
it serves to prevent the entrance of excessive quantities of surface water into the
underlying base, subbase and subgrade. This top structural layer of material is
sometimes subdivided into two layers (www.washington.edu, 2004);
1- Wearing Course: This is the layer in direct contact with traffic loads. It is
meant to take the brunt of traffic wear and can be removed and replaced as it
becomes worn.
2- Binder Course: This layer provides the bulk of the HMA (Hot Mix Asphalt)
structure. Its chief purpose is to distribute load.
3.4.2 Base Course:
The base course is immediately beneath the binder course. It provides additional
load distribution and contributes to drainage and frost resistance. Base courses
are usually constructed out of (www.washington.edu, 2004);
1. Aggregate: Base courses are most typically constructed from durable
aggregates, that will not be damaged by moisture or frost action.
2. HMA: In certain situations where high base stiffness is desired, base
courses can be constructed using a variety of HMA (Hot Mix Asphalt) mixes.
3-4-3 Subbase Course:
The subbase course is between the base course and the subgrade. It functions
primarily as structural support but it can also (www.washington.edu, 2004);
1. Minimize the intrusion of fines from the subgrade into the pavement structure.
2. Improve drainage.
3. Minimize frost action damage.
The subbase generally consists of lower quality materials than the base course but better
than the subgrade soils. A subbase course is not always needed or used. For example, a
pavement constructed over a high quality, stiff subgrade may not need the additional
Page 33
Chapter Three Pavement Layers and Bituminous Mix Design
16
features offered by a subbase course so it may be omitted from design. However, a
pavement constructed over a low quality soil such as a swelling clay may require the
additional load distribution characteristic that a subbase course can offer. In this
scenario the subbase course may consist of high quality fill used to replace poor quality
subgrade (over excavation).
3-5 Attributes of asphalt pavements:
Paving with asphalt offers several advantages including (www.apao.org, 2004)
1- Stage construction: A major advantage of asphalt pavements is the potential
for stage construction. The asphalt base course can be placed and used under
traffic during initial construction and can then be overlaid with the final surface
courses. It also provides an opportunity to discover and correct unanticipated
problem areas such as weak subgrades, poor drainage, or poorly compacted
trenches which can be repaired before the asphalt course is placed.
2- Constructibility: Asphalt pavements are machine placed and no delay is
required to allow the pavement to cure. Repair and maintenance of asphalt
surfaces is also quick and relatively easy.
3- Economics: Asphalt pavements are cost effective. Their construction costs, as
well as long life (when properly designed and constructed), are important
attributes. In addition, the time required to rehabilitate asphalt pavements
reduces the user delays when compared with other pavement materials.
4- Recyclability: A major attribute of asphalt pavements is its ability to be
completely recycled. Not only can the aggregates be reused, but the asphalt
binder retains much of its cementing properties and can also be reused in a
mix. Both hot and cold recycling techniques have been used successfully.
5- Safety: Asphalt pavements provide safe walking or riding surfaces with good
surface friction for all users. Open-graded mixes offer additional advantages for
roads such as reduced splash and spray under wet conditions. 3-6 Desirable requirements of bituminous mixes:
A good bituminous paving mix should exhibit; (Singh, 2001)
1- Stability: It is resistance of road pavement to deformation, from imposed
vehicular loads. Unstable pavements exhibit rutting, shoving and deformation
Page 34
Chapter Three Pavement Layers and Bituminous Mix Design
17
under the tires of stationary vehicles. Stability is a function of friction and
cohesion. Density and stability are interrelated properties. Density of compacted
mixture is directly related to voids present in it.
2- Durability: It is the resistance against abrasion and weathering. Weathering
property is depending on loss of volatiles and oxidation and causes hardening of
the surface. Tensile strains are developed on the surface of bituminous pavement
due to contact of tires of the plying vehicles. If bitumen mix is not capable of
resisting the tensile strain so developed, bitumen surface may develop cracks
and plastic failure may occur.
3- Flexibility: This property of the mix measures the capability of the surface in
bending without shearing or cracking.
4- Skid resistance: This property of the bitumen mix is its capacity agent. It
mainly depends upon the surface texture of the aggregate particle and bitumen
content.
5- Workability: It is a measure of ease with which a bituminous mix can be laid
and compacted. This property is a function that aggregate grading, shape of
particles, texture of particles, type of bitumen used and bitumen content.
3-7 Basic Considerations for selecting mix type:
The user needs to consider a number of factors when selecting a mix type for a given
application. Factors which must be considered include the following (www.apao.org,
2004);
1- Surface appearance (texture): Depending on the application, the planner may
want a smooth (walkways, recreational areas) or a rough (streets,
highways) textured pavement surface. The finer dense-graded mixes (9.5 to
12.5 mm nominal size) will produce smoother pavement surfaces.
2- Mix stability: Certain applications (commercial and industrial facilities) will
require a highly stable mix to minimize rutting and shoving under heavy
loads. For others (e.g., recreational areas and private driveways), stability
requirements may be less.
3- Drainage: Depending on the requirements, drainage of the pavement surface
can be accomplished using either a dense- or open-graded mix. If a dense-
Page 35
Chapter Three Pavement Layers and Bituminous Mix Design
18
graded mix is used, the surface must be sloped to allow the water to travel to
drainage facilities. If open-graded (or porous) mixes are used, the water will
pass through the pavement and must be collected in underground drainage
facilities.
4- Structural contribution: Not all mix types provide equal resistance to cracking
and load related deformation. Mixes must be selected to match the expected
loadings on the facility being designed.
5- Thickness: Maximum nominal aggregate size generally controls the minimum
thickness which can be used. As a general guide, the minimum thickness should
be 2.6 to 3 times, the maximum nominal size of the aggregate selected. For
example, the minimum thickness for placement of the various aggregate sizes
considered in this manual shown in Table (3-1).
Table (3-1) Minimum thickness of asphalt layers (www.apao.org, 2004)
Aggregate Size Minimum Thickness
9.5 mm (3/8 in) 25 – 30 mm ( 1.0 – 1.2 in)
12.5 mm (1/2 in) 35 – 40 mm (1.3 – 1.5 in)
19.0 mm (3/4 in) 50 – 60 mm (2.0 – 2.3 in)
3-8 Objects of bituminous paving mix design:
To determine an economical blend and grading of aggregates and a corresponding
bitumen content which would yield a mix having the following characteristics (Singh
2001);
1- It should have sufficient bitumen content to coat the aggregate particles
thoroughly. This will ensure proper bond together with durable pavement under
suitable compaction.
2- Mix should exhibit sufficient stability to satisfy the traffic requirements without
distortion or displacement.
3- Bitumen mix should have sufficient voids in the total compacted mix to provide
space for the expansion of bitumen and also for slight amount of additional
compaction under traffic loading.
Page 36
Chapter Three Pavement Layers and Bituminous Mix Design
19
4- The mix should have sufficient workability so that it may be placed in pavement
with ease the efficiency. 3-9 Design procedure of bituminous mixes:
In the design procedure of a bituminous mix, the following steps are involved (Singh,
2001);
1- Selection of aggregate to be employed in the mix.
2- Selection of aggregate grading
3- Determination of the proportion of each aggregate required to develop the
design grading.
4- Determination of specific gravity of the aggregate blend.
5- Determination of S.G. o the bitumen.
6- Make up trial specimens with varying bitumen contents.
7- Determination of the specific gravity (S.G.) of each compacted specimen.
8- Make stability test on the specimen.
9- Determine the percentage of voids in each paving specimen and if the design
method in use requires it, calculate the VMA and percent voids filled with
bitumen.
10- Selection of the optimum bitumen content from the obtained data. 3-10 Mix design method:
Various methods of designing the mix proportions of dense bitumen concrete
have been evolved are the following (Jendia, 2000);
1- The Marshal method.
2- The Hubbard field method.
3- The HVeem method.
4- The Smith triaxial method.
The most widely used method is the Marshal method.
3-11 Marshall method:
This method is possibly the most widely used method. The basic conception was
originated by Mr. Bruce Marshall but perfection in the method was achieved through
the efforts of U.S. Corps of engineers and so many other agencies. This method is
Page 37
Chapter Three Pavement Layers and Bituminous Mix Design
20
applicable to hot mix pavements using penetration grade bitumen and maximum
aggregate size of 2.5 cm or less (Singh 2001).
There are two principal features of this test of mix design namely,
1- Density – void analysis.
2- Stability flow test.
Stability: Stability is defined as the maximum load carried by a compacted specimen at
a standard test temperature of 60 0C.
Flow: The flow is measured as a deformation in units of 0.25mm, occurring in the
specimen between no-load and maximum load conditions during stability test. Flow can
also be measured in deformation units of 0.1mm Three test procedures are normally employed to determine the properties of the mix
(www.apao.org, 2004);
1. Determination of the bulk specific gravity.
2. Measurement of Marshall stability and flow.
3. Analysis of specimen density and voids content.
Mixes which have low stability and high flow values are too plastic and tend to distort
(rut and shove) easily under load. Mixes which have very high stability and very low
flow values are brittle and may crack readily.
Density and voids analyses are conducted to determine the air void content, the amount
of voids in the mineral aggregate (VMA), the voids filled with bitumen (VFB), and the
unit weight of the material.
The “optimum” asphalt cement content of the mix is determined from a family of plots
based on mix properties measured at different asphalt contents. Unit weight, air void
content, and voids in mineral aggregate content are plotted against asphalt content. The
“optimum” asphalt cement content is usually calculated as the average asphalt content
at the point of maximum unit weight, and at an air void content of 3 to 6%. In addition,
the voids in mineral aggregate (VMA) content must be above a minimum value and the
voids filled with bitumen (VFB) must be between certain limits. In some cases, the
“optimum” asphalt cement content is selected based only on the amount needed to
achieve air voids in the mix and the other mix properties are checked at that asphalt
cement content to see if they comply with the specifications requirement
(www.apao.org, 2004).
Page 38
Chapter Three Pavement Layers and Bituminous Mix Design
21
To optimize pavement performance, it is important to select the correct compactive
effort. The higher compactive effort (75 blows), normally used for pavements with
heavy loads, will result in a lower optimum asphalt content in the mix for any given
aggregate gradation. The purpose of the mix design process is to select an asphalt type
and content together with an aggregate gradation which will yield the desired mix
properties for the specific job application.
3-11 Conclusion:
1- The importance of Asphalt Wearing Course is shown from the following:
• Good surface condition
• Able to sustain loads under varying environmental conditions
• Waterproof and sloped.
• Protect of asphalt pavement structure.
• Resist of wearing.
• Skid resistance
2- The Marshall method was used in the laboratory in preparing asphalt mixes.
Page 39
Chapter Four Specifications of Asphalt Wearing Course
22
Chapter Four Specifications of Asphalt Wearing Course
4-1 Introduction:
The specifications and requirements of the wearing course will be discussed. Eleven
specifications and requirements were selected and divided into three groups. These
groups are the international group, the regional group and the local requirements group.
The selected specifications were chosen depending on specific criteria. They were
selected because they are the most famous specifications around the world and in
Palestine or because they are used in the neighbor countries or because they are required
locally by the implementing agencies or the ministries and the institutions in Palestine.
The aggregate gradation and the mechanical properties will be illustrated.
4-2 Methodology of Selecting the Gradation and Mechanical Properties:
To determine the gradation of the proposed gradation, the researcher adopted the
following methodology (Researcher);
1. From the eleven selected specifications, one gradation must be selected
for each specification to be used in the wearing course. The researcher
adopted the gradation which is fitting the thickness of the wearing course
and the maximum aggregate size in Palestine.
2. The eleven specifications and requirements were divided into three
groups which were entitled depending on the geographical basic as
illustrated in Figure (4-1)
3. One gradation will be selected for each three mentioned groups by drawing
the gradation of specifications of each group together and selecting the
frame of these gradations.
4. The three selected gradations from the previous step will be drawn together
and one frame for the gradation will be selected to include all the
international, regional and local specifications.
5. The final frame will be divided to five gradations and will be selected to
make the trial mix on them.
6. From the eleven reviewed specifications, the mechanical properties for the
proposed mixture will be selected as the average of all mechanical
Page 40
Chapter Four Specifications of Asphalt Wearing Course
23
properties. The average will be selected as a first trial but it could be change
depending on the results of the trails mix.
Figure (4-1) Groups of asphalt wearing course
4-3 International Group:
4-3-1 German Specifications ZTV Asphalt – StB 94:
The German specifications have three gradations for the asphalt wearing course. They
are 0/16S, 0/11S, 0/11, 0/8 and 0/5 as drawn in Figures (4-2), (4-3), (4-4), (4-5) and (4-
Group Two Regional Specifications
SSpecifications
Group One International Specifications
Iraqi Jordanian Egyptian
German ZTV asphalt-StB 94
AASHTO T11 and T27
British BS 594
Group Three Local Requirements
MoPWH PSI UNRWA MoG PECDAR
Page 41
Chapter Four Specifications of Asphalt Wearing Course
24
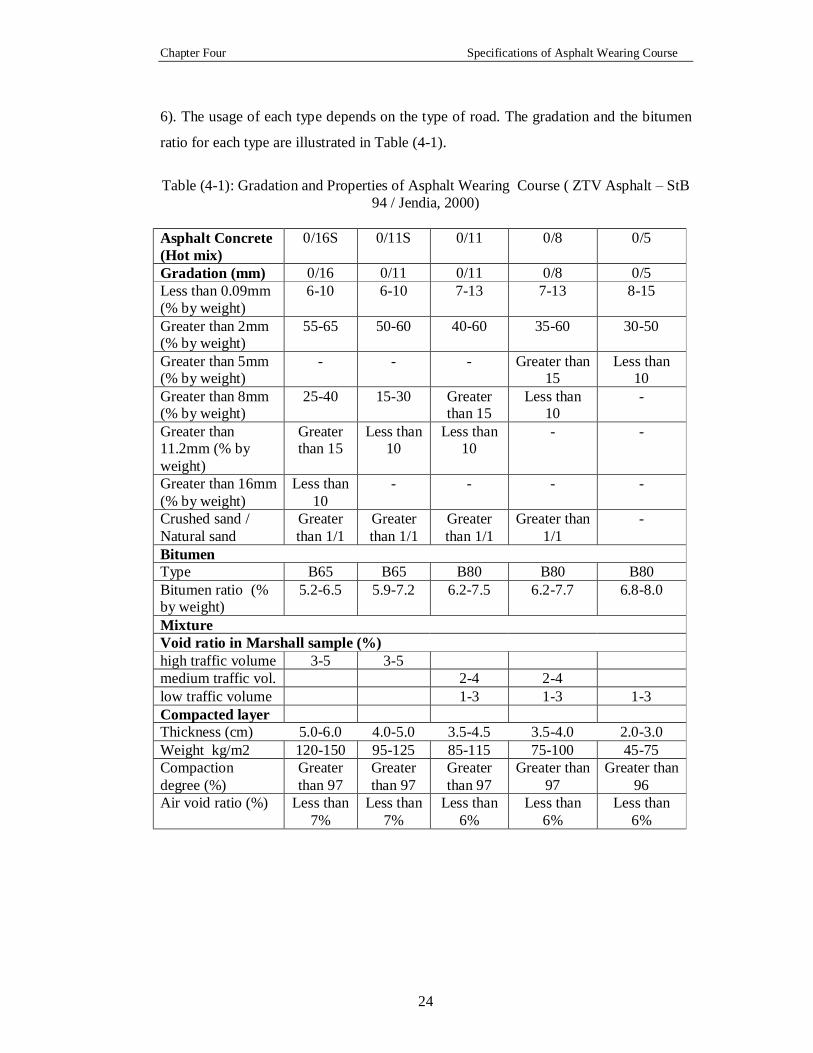
6). The usage of each type depends on the type of road. The gradation and the bitumen
ratio for each type are illustrated in Table (4-1).
Table (4-1): Gradation and Properties of Asphalt Wearing Course ( ZTV Asphalt – StB
94 / Jendia, 2000)
Asphalt Concrete (Hot mix)
0/16S
0/11S
0/11
0/8 0/5
Gradation (mm) 0/16 0/11 0/11 0/8 0/5 Less than 0.09mm (% by weight)
6-10 6-10 7-13 7-13 8-15
Greater than 2mm (% by weight)
55-65 50-60 40-60 35-60 30-50
Greater than 5mm (% by weight)
- - - Greater than 15
Less than 10
Greater than 8mm (% by weight)
25-40 15-30 Greater than 15
Less than 10
-
Greater than 11.2mm (% by weight)
Greater than 15
Less than 10
Less than 10
- -
Greater than 16mm (% by weight)
Less than 10
- - - -
Crushed sand / Natural sand
Greater than 1/1
Greater than 1/1
Greater than 1/1
Greater than 1/1
-
Bitumen Type B65 B65 B80 B80 B80 Bitumen ratio (% by weight)
5.2-6.5 5.9-7.2 6.2-7.5 6.2-7.7 6.8-8.0
Mixture Void ratio in Marshall sample (%) high traffic volume 3-5 3-5 medium traffic vol. 2-4 2-4 low traffic volume 1-3 1-3 1-3 Compacted layer Thickness (cm) 5.0-6.0 4.0-5.0 3.5-4.5 3.5-4.0 2.0-3.0 Weight kg/m2 120-150 95-125 85-115 75-100 45-75 Compaction degree (%)
Greater than 97
Greater than 97
Greater than 97
Greater than 97
Greater than 96
Air void ratio (%) Less than 7%
Less than 7%
Less than 6%
Less than 6%
Less than 6%
Page 42
Chapter Four Specifications of Asphalt Wearing Course
25
0102030405060708090
100
0.01 0.1 1 10 100
Diameter size (mm)
Pass
ing
%
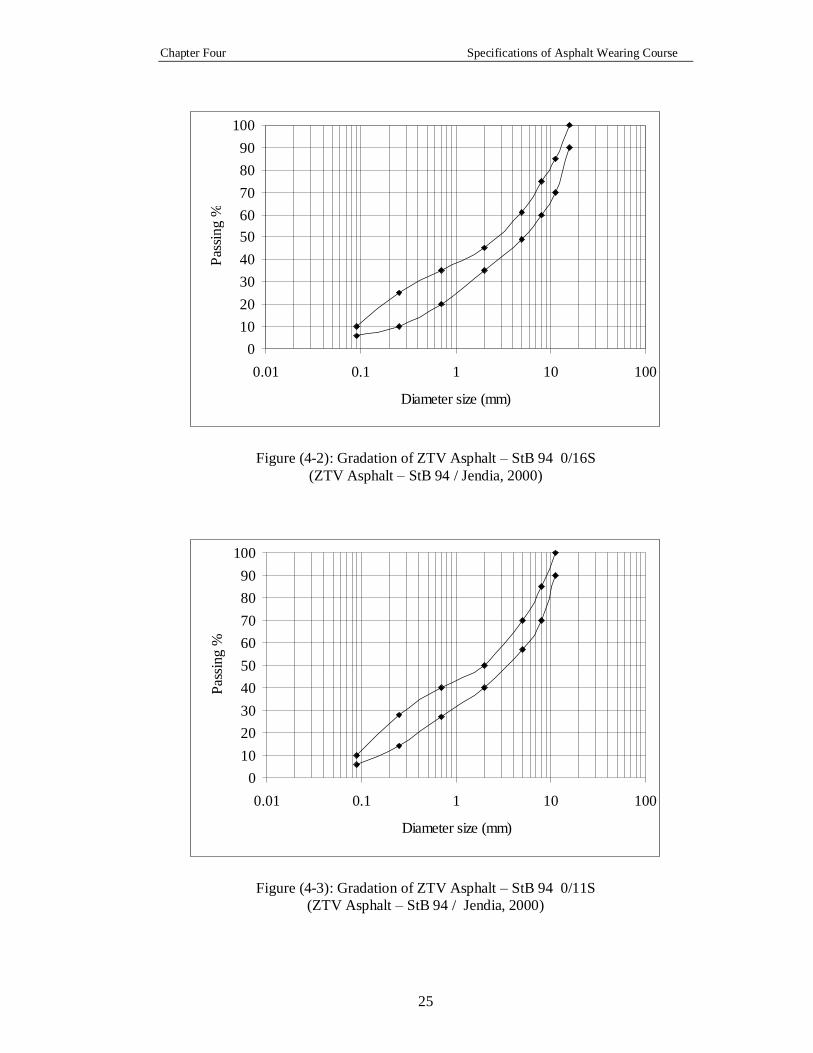
Figure (4-2): Gradation of ZTV Asphalt – StB 94 0/16S (ZTV Asphalt – StB 94 / Jendia, 2000)
0102030405060708090
100
0.01 0.1 1 10 100
Diameter size (mm)
Pass
ing
%
Figure (4-3): Gradation of ZTV Asphalt – StB 94 0/11S (ZTV Asphalt – StB 94 / Jendia, 2000)
Page 43
Chapter Four Specifications of Asphalt Wearing Course
26
0102030405060708090
100
0.01 0.1 1 10 100
Diameter size (mm)
Pass
ing
%
Figure (4-4): Gradation of ZTV Asphalt – StB 94 0/11 (ZTV Asphalt – StB 94 / Jendia, 2000)
0102030405060708090
100
0.01 0.1 1 10 100
Diameter size (mm)
Pass
ing
%
Figure (4-5): Gradation of ZTV Asphalt – StB 94 0/8 (ZTV Asphalt – StB 94 / Jendia, 2000)
Page 44
Chapter Four Specifications of Asphalt Wearing Course
27
0102030405060708090
100
0.01 0.1 1 10 100
Diameter size (mm)
Pass
ing
%
Figure (4-6): Gradation of ZTV Asphalt – StB 94 0/5 (ZTV Asphalt – StB 94 / Jendia 2000)
Remarks:
• From the mentioned five types of gradation for the asphalt wearing course ZTV
Asphalt – StB 94, the 0/11 gradation is selected because it is suitable for
highway roads and the gradations 0/16S and 0/11S are low resistant to wearing
surface, on the other hand, the gradations 0/8 and 0/5 are not resistant to sliding .
The mechanical properties and bitumen ratio for 0/11 gradation are as shown in
Table (4-1).
4-3-2 American Association of State Highway and Transportation Official
(AASHTO) Specifications:
The AASHTO gives two gradations for the asphalt wearing course. They are T27 and
T11. The gradations of the two types are shown in Table (4-2), Figure (4-7) and Figure
(4-8). The two gradations have the same mechanical specifications as illustrated in
Table (4-3).
Page 45
Chapter Four Specifications of Asphalt Wearing Course
28
Table (4-2 ): Gradation of asphalt wearing course (AASHTO T27 and T11)
AASHTO T27
Percentage by Weight Passing AASHTO T11
Percentage by Weight Passing Sieve size
(mm) Lower Level Upper Level Lower Level Upper Level 19.0 90 100 90 100 12.5 71 90 71 90 9.5 56 80 56 80 4.75 35 56 35 65 2.36 23 38 23 49 1.18 13 27 14 43
0.300 5 17 5 19 0.150 4 14 4 15 0.075 2 8 2 8
0102030405060708090
100
0.0 0.1 1.0 10.0 100.0
Diameter size (mm)
Pass
ing
%
Figure(4-7): Gradation of asphalt wearing course (AASHTO T27)
Page 46
Chapter Four Specifications of Asphalt Wearing Course
29
0102030405060708090
100
0.0 0.1 1.0 10.0 100.0
Diameter size (mm)
Pass
ing
%
Figure: (4-8 ) Gradation of asphalt wearing course (AASHTO T11)
Table: (4-3) Mechanical Properties and Bitumen content for AASHTO T27 and T11
Property Heavy Traffic Medium Traffic
Marshal stability at 60oC (kg) 1000 900
Flow (mm) 2 – 3.5 2 – 4
Void in Mineral aggregate (VMA) 14 (-1) 14 (-1)
Air voids (%) 4 - 6 3 – 5
Stiffness (kg/mm) 500 (Min) 400 (Min)
Loss of stability 25 (max) 25 (Max)
Bitumen Content: 5 – 7 % 5 – 7 % 5 – 7 %
Remarks: The range between lower and upper level in gradation T11 is wider than gradation T27;
therefore; the fineness increased in mix T11 greater than mix T27. So the gradation T11
was selected because its’ mixture will be denser than T27 due to the high percentage of
the fine aggregates.
Page 47
Chapter Four Specifications of Asphalt Wearing Course
30
4-3-3 British Standard (BS 594):
The British standards have two gradations for the asphalt wearing course which depend
on the thickness of the layer. The first gradation is for the layer thickness from 25 to 50
mm. The second gradation is for the layer thickness from 35 – 65 mm. The gradations
of the two types are shown in Table (4-4), Figure (4-9) and Figure (4-10). The two
gradations have the same mechanical specifications as illustrated in Table (4-5).
Table (4-4 ): Gradation of asphalt wearing course for BS 594 , Layer thickness 25 to
50mm and Layer thickness 35 to 65mm (BS594, 1992)
BS 594 , Layer thickness 25 to 50 mm Percentage by Weight Passing
BS 594, Layer thickness 35 to 65mm
Percentage by Weight Passing
Sieve size (mm) Lower Level Upper Level Lower Level Upper Level 14.0 100 100 90 100 10.0 90 100 65 100 2.36 35 55 35 55
0.600 15 55 15 55 0.212 5 30 5 30 0.075 2 9 2 9
0102030405060708090
100
0.0 0.1 1.0 10.0 100.0
Diameter size (mm)
Pass
ing
%
Figure (4-9 ) Gradation of asphalt wearing course for BS 594 , Layer thickness 25 to 50mm (BS594,1992)
Page 48
Chapter Four Specifications of Asphalt Wearing Course
31
0102030405060708090
100
0.01 0.1 1 10 100
Diameter size (mm)
Pass
ing
%
Figure (4-10): Gradation of asphalt wearing course for(BS 594 , Layer thickness 35 to
65mm (BS594, 1992)
Table (4-5): Mechanical Properties of Asphalt Wearing Course (BS 594, 1992 ) Traffic (in commercial vehicles per lane per day)
Stability of complete mix KN
Max Flow value (mm)
Bitumen Content (%)
Less than 1500 3 – 8 5 6.50
1500 to 6000 4 – 8 5 6.50
Over 6000 6 – 10 7 6.50
Remarks:
• The differences between Figure (4-9) and (4-10) in the course parts especially
in the maximum aggregate size. In the first curve 10mm but in the second curve
is 14 mm. Therefore the second gradation is coarser than the first gradation.
• When the thickness of layer increased , the maximum aggregate size will
increased.
• The gradation of the layer thickness from 35 – 65 mm was selected because it is
the will known used thickness of the wearing layer in Palestine and the first
gradation used in maintenance work.
Page 49
Chapter Four Specifications of Asphalt Wearing Course
32
4-3-4 Gradation of International Group:
In the international group, three gradations were selected. They are ZTV Asphalt – StB
94 0/11 from the German specifications, T11 from AASHTO and BS 594 layer
thickness from 35 to 65 mm from the British specifications. The gradations for the
mentioned three specifications are illustrated in Table (4-6) and Figure (4-11). The
lower limit and the upper limit was chosen to make the international group frame as
shown in Figure (4-12)
Table (4-6 ) Gradation of asphalt wearing course (ZTV Asphalt – StB 94 0/11,
AASHTO T11, BS 594 Layer Thickness 35-60mm and frame of International group )
ZTV Asphalt–StB 94 0/11
AASHTO T11
BS 594 (35-60mm)
Frame of International group
Diameter size
(mm) min. max. min. max. min. max. min. max. 19 100 100 90 100 100 100 90 100 14 100 100 76 92 90 100 73 100
12.5 100 100 71 90 82 100 68 100 11.2 90 100 62 84 73 100 62 100 10 80 92 57 82 65 100 57 97.5 9.5 78 90 56 80 63 98 56 97 8 70 85 49 74 58 92 49 93
4.75 58 72 35 65 47 76 35 80 2.36 43 63 23 49 35 55 23 67
2 40 60 20 47 32 55 20 63.5 1.18 32 50 14 43 25 55 14 54 0.7 26 40 10 32 17 55 10 47 0.6 24 37 8 29 15 55 8 45 0.3 16 30 5 19 7 38 5 35
0.25 14 28 4.5 18 6 34 4.5 30.5 0.212 12 25 4 17 5 30 4 28 0.15 10 20 3 15 4 22 3 22 0.09 7 13 2.5 10 3 10 2.5 12.5 0.075 2 8 2 9 2 9
Page 50
Chapter Four Specifications of Asphalt Wearing Course
33
0102030405060708090
100
0.01 0.1 1 10 100
Diameter size (mm)
Pass
ing
%
min(ztv)max(ztv)min(AASHTO)max(AASHTO)min(BS)max(BS)min(Frame)max(Frame)
Figure: (4-11 ) Gradation of asphalt wearing course (ZTV Asphalt – StB 94 0/11, AASHTO T11, BS 594 Layer Thickness 35-60mm and frame of International group)
0102030405060708090
100
0.01 0.1 1 10 100
Diameter size (mm)
Pass
ing
%
Figure (4-12 ): Frame of international group specification
Page 51
Chapter Four Specifications of Asphalt Wearing Course
34
Remarks:
Figure (4-11) shows the difference between the mentioned specifications (ZTV Asphalt
– StB 94 0/11, AASHTO T11 and BS 594 Layer thickness 35 to 65mm). It was noted
the following;
• The maximum aggregate size in ZTV Asphalt – StB 94 0/11 is 11.2mm,
19.00mm in AASHTO T11 and 14.00 in BS 594.
• The minimum aggregate size in ZTV Asphalt – StB 94 0/11 is 0.09mm, and
0.075mm in AASHTO T11 and BS594.
• After the merging of the international gradation, it seems that the range between
the lower and upper limit becomes bigger.
4-4 Regional Specifications:
The regional specification includes the Egyptian, Jordanian and Iraqi specifications
because they are close to Palestine.
4-4-1 Egyptian Specifications:
The Egyptian specification has one gradation for the asphalt wearing course. The size of
the aggregates has not to exceed than 1/2”. Table (4-7), Figure (4-13) show the
gradation of the Egyptian specifications and Table (4-8) illustrates the mechanical
properties.
Table (4-7 ): Gradation of asphalt wearing course for Egyptian Specification
(Egyptian 1998)
Percentage by Weight Passing `Sieve size
(mm) Lower Level Upper Level 12.5 85 100
4.750 65 80 2.26 50 65 1.18 37 52
0.600 25 40 0.300 18 30 0.150 10 20 0.075 3 10
Page 52
Chapter Four Specifications of Asphalt Wearing Course
35
0102030405060708090
100
0.0 0.1 1.0 10.0 100.0
Diameter size (mm)
Pass
ing
%
Figure (4-13 ): Gradation of asphalt wearing course for Egyptian Specification
(Egyptian 1998)
Table (4-8): Mechanical Properties of Asphalt Wearing Course for Egyptian Specification (Egyptian 1998)
Properties Low Traffic Medium Traffic Heavy Traffic Stability (Kg) 272 340 408 Flow (mm) 1.5 – 4.5 1.5 – 4.5 1.5 – 4.5 Stiffness (kg/mm) 181 227 272 Air void in mix (% ) 3 - 5 3 - 5 3 – 5 VMA (%) 14 15 15 No. of Marshal blows 35 50 75 Bitumen content 4 - 7.5 4 - 7.5 4 - 7.5 Remarks: 1. In the Egyptian gradation, the lower limit and the upper limit are very close to each
other. Therefore, the user of this gradation has to be very careful.
2. The stability value in this specification is very low compared with the other
specifications.
Page 53
Chapter Four Specifications of Asphalt Wearing Course
36
4-4-2 Jordanian Specifications:
The gradation of the Jordanian specification of the asphalt wearing course is illustrated
in Table (4-9) and Figure (4-14), and the mechanical properties are shown in Table (4-
10).
Table (4-9): Gradation of asphalt wearing course for Jordanian Specification
(MOPWH,1991)
Percentage by Weight Passing Sieve size
(mm) Lower Level Upper Level 19.0 90 100 12.5 71 90 9.5 56 80
4.75 35 65 2.36 23 49 1.18 14 43
0.300 5 19 0.150 4 15 0.075 2 8
0102030405060708090
100
0.0 0.1 1.0 10.0 100.0Diameter size (mm)
Pass
ing
%
Figure (4-14 ): Gradation of asphalt wearing course for Jordanian Specification (MOPWH,1991)
Page 54
Chapter Four Specifications of Asphalt Wearing Course
37
Table (4-10): Mechanical Properties of Asphalt Wearing Course for Jordanian Specifications (MOPWH,1991)
Property Heavy Traffic Medium Traffic
Marshal stability at 60oC (kg) 1000 900 Flow (mm) 2 – 3.5 2 – 4 Void in Mineral aggregate (VMA) 14 (-1) 14 (-1) Air voids (%) 4 - 6 3 – 5 Stiffness (kg/mm) 500 (Min) 400 (Min) Loss of stability 25 (max) 25 (Max) Bitumen content (%) 5-7 5-7
Remark:
The gradation and mechanical properties are taken from AASHTO T11 specification.
4-4-3 Iraqi Specification:
The gradation of the Iraqi specification of the asphalt wearing course is illustrated in
Table (4-11) and Figure (4-15), and the mechanical properties are shown in Table
(4-12).
Table (6-11): Gradation of asphalt wearing course for Iraqi Specification 1983
(Hwaies,1985)
Percentage by Weight Passing Sieve size
(mm) Lower Level Upper Level 25 100 100 19 75 95
12.5 65 88 9.5 50 75
4.750 32 55 2 24 42 1 18 35
0.60 10 25 0.25 8 20
0.125 6 12
Page 55
Chapter Four Specifications of Asphalt Wearing Course
38
0102030405060708090
100
0.01 0.1 1 10 100Diameter size (mm)
Pass
ing
%
Figure (6-15): Gradation of asphalt wearing course for Iraqi specification 1983 (Hwaies,1985)
Table (4-12): Mechanical Properties of Asphalt Wearing Course for Iraqi Specifications 1983 (Hwaies,1985)
Property Value
Marshal stability (kg) 100 Flow (mm) 2 – 4 Voids filled with Bitumen (VFB) 70 – 85 Stiffness (kg/mm) Min. 400 Air voids (%) 3 – 5 Bitumen content (%) 4.3 - 6.3
Remarks:
In this specification, Sieve 0.075mm do not exist compared with the other specifications.
4-4-4 Gradation of Regional Group: The gradation of the Egyptian, Jordanian and Iraqi specification of the asphalt wearing
course were drawn together as illustrated in Figure (4-16) and Table (6-13). The frame
of the regional group was drawn to include all the points in the three regional
specifications as shown in Figure (4-17).
Page 56
Chapter Four Specifications of Asphalt Wearing Course
39
Table (4-13): Gradation of Asphalt Wearing Course (Egyptian, Jordanian, Iraqi Specifications)
Diameter
size Egyptian
Specification Jordanian
Specification Iraqi
Specification Regional Group
Specification
mm Lower Level
Upper Level
Lower Level
Upper Level
Lower Level
Upper Level
Lower Level
Upper Level
19.0 100 100 90 100 75 95 90 100 12.5 85 100 71 90 65 88 60 100 9.5 78 93 56 80 50 75 49 93 4.75 65 80 35 65 32 55 32 80 2.26 50 65 23 49 24 42 23 65 1.18 37 52 14 43 18 35 14 52 0.6 25 40 8 29 10 25 8 40 0.3 18 30 5 19 8 20 5 30
0.125 10 20 4 15 6 12 3 20 0.075 3 10 2 8 -- -- 2 10
0102030405060708090
100
0.01 0.1 1 10 100Diameter size (mm)
Pass
ing
%
min(Egypt)max(Egypt)min(Jordan)max(Jordan)min(Iraq)max(Iraq)min(Frame)max(Frame)
Figure (4-16 ): Gradation of Asphalt Wearing Course (Iraqi 1983, Egyptian, Jordanian
Specifications and Frame of Regional Specifications)
Page 57
Chapter Four Specifications of Asphalt Wearing Course
40
0102030405060708090
100
0.01 0.1 1 10 100Diameter size (mm)
Pass
ing
%
Figure (4-17): Gradation of Asphalt Wearing Course (Frame of Regional Specifications) Remarks:
Figure (4-16) shows the difference among the mentioned specifications ( Egyptian ,
Jordanian and Iraqi specifications), from this figure we note the following;
• The Egyptian gradation is the finest mix when compared with Jordanian and
Iraqi specifications.
• The Jordanian gradation has the biggest range among the three regional
specifications.
• The maximum aggregate size in Egyptian specification is 12.50mm, but the
other specifications are 19.00mm.
• The minimum aggregate size in Iraqi specification is 0.125mm, but the other
specifications are 0.075mm.
4-5 Local Requirements:
The local group consists of five requirements which are required by the institutions in
Palestine. These requirements are the municipality of Gaza (MoG) , PECDAR,
UNRWA , Palestine Standards Institution (PSI) and Ministry of Public Works and
Housing ( MoPWH) requirements.
Page 58
Chapter Four Specifications of Asphalt Wearing Course
41
4-5-1 Municipality of Gaza (MoG) Requirements:
The gradation of the MoG requirements is shown in Table (4-14) and Figure (4-18), and
the mechanical properties are illustrated in Table (4-15).
Table (4-14 ): Gradation of asphalt wearing course for MoG Requirements (MoG, 2003)
Percentage by Weight Passing Sieve size
(mm) Lower Level Upper Level 12.5 100 100 9.5 70 100 4.75 50 70 2.0 32 52 0.42 16 30
0.180 10 20 0.075 4 9
0102030405060708090
100
0.01 0.1 1 10 100Diameter size (mm)
Pass
ing
%
Figure (4-18): Gradation of asphalt wearing course for MoG Requirements (MoG, 2003)
Page 59
Chapter Four Specifications of Asphalt Wearing Course
42
Table (4-15): Gradation of asphalt wearing course for MoG Requirements
(MoG 2003)
Property Value Marshal stability (kg) >900 Flow (mm) 2 – 4 Stiffness (kg/mm) Min. 400 Voids filled with Bitumen (VFB) 60 - 75 Air voids (%) 3 – 7 VMA ( % ) 14.50 Bitumen content (%) At least 5.5%
Remarks
• The MoG requirements depend on a narrow range of the gradation.
4-5-2 PECDAR Requirements: The gradation of the PECDAR requirements is shown in Table (4-16) and Figure (4-19),
and the mechanical properties are illustrated in Table (4-17).
Table (4-16): Gradation of asphalt wearing course for PECDAR Requirements (PECDAR,2003)
Percentage by Weight Passing Sieve size
(mm) Lower Level Upper Level 12.5 100 100 9.5 70 100 4.75 45 70 2.0 25 35 0.42 12 24
0.180 9 18 0.075 6 12
Page 60
Chapter Four Specifications of Asphalt Wearing Course
43
0102030405060708090
100
0.01 0.1 1 10 100Diameter size (mm)
Pass
ing
%
Figure (4-19): Gradation of asphalt wearing course for PECDAR Requirements ( PECDAR,2003)
Table (4-17): Gradation of asphalt wearing course for PECDAR Requirements ( PECDAR,2003)
Property Value
Marshal stability (kg) >900 Flow (mm) 2 – 4 Stiffness (kg/mm) 400 min Voids filled with Bitumen (VFB) % < 80 Air voids (%) 3 – 6 VMA ( % ) >13.50 Bitumen content (%) 5 - 7
Remarks:
The PECDAR requirements depend on a narrow range of the gradation. 4-5-3 UNRWA Requirements: The gradation of the UNRWA requirements is shown in Table (4-18) and Figure (4-20),
and the mechanical properties are illustrated in Table (4-19).
Page 61
Chapter Four Specifications of Asphalt Wearing Course
44
Table (4-18): Gradation of asphalt wearing course for UNRWA Requirements (UNRWA, 2003)
Percentage by Weight Passing Sieve size
(mm) Lower Level Upper Level 19 90 100
12.5 71 90 9.5 56 80 4.75 35 65 2.36 23 49 1.18 14 43
0.300 5 19 0.150 4 15 0.075 2 8
0102030405060708090
100
0.01 0.1 1 10 100Diameter size (mm)
Pass
ing
%
Figure (4-20): Gradation of asphalt wearing course for UNRWA Requirements (UNRWA, 2003)
Page 62
Chapter Four Specifications of Asphalt Wearing Course
45
Table (4-19): Mechanical Properties of Asphalt Wearing Course for UNRWA Requirements (UNRWA,2003)
Property Value
Marshal stability (kg) 1000 Flow (mm) 2 – 4 Number of blows 75 Air voids (%) 3 – 6 Voids in Mineral aggregates VMA ( % ) 14 min Loss of Marshal stability ( % ) 25 max Stiffness (kg/mm) 400 min Bitumen content (%) 4 - 6
Remarks:
• UNRWA requirements is similar to AASHTO T11 specifications in the
gradation curve.
• Also the mechanical properties are taken from medium and heavy traffic in
AASHTO specification.
4-5-4 Palestine Standard Institution (PSI) Requirements:
The gradation of the PSI requirements is shown in Table (4-20) and Figure (4-21), and
the mechanical properties are illustrated in Table (4-21).
Table (4-20 ): Gradation of asphalt wearing course for PSI requirements (PS 171,1998)
Percentage by Weight Passing Sieve size
(mm) Lower Level Upper Level 14.0 85 100 4.75 60 80 2.36 45 65 0.6 20 35
0.150 10 20 0.075 5 10
Page 63
Chapter Four Specifications of Asphalt Wearing Course
46
0102030405060708090
100
0.01 0.1 1 10 100Diameter size (mm)
Pass
ing
%
Figure (4-21): Gradation of asphalt wearing course for PSI requirements (PS 171,1998)
Table (4-21): Mechanical Properties of asphalt wearing course for PSI requirements (PS
171,1998)
Property Value Marshal stability (kg) 408 – 510 Flow (mm) 2 – 4 Air voids (%) 4 – 8 Stiffness (kg/mm) 250 min Voids in Mineral aggregates VMA ( % ) 14 min Loss of Marshal stability ( % ) 25 max Bitumen content (%) 4.5 – 7.0
Remarks:
• The gradation range is narrow.
• Stability value in mechanical properties is smaller than others.
4-5-5 Ministry of Public Works & Housing (MoPWH) Requirements: The gradation of the MoPWH requirements is shown in Table (4-22) and Figure (4-22),
and the mechanical properties are illustrated in Table (4-23).
Page 64
Chapter Four Specifications of Asphalt Wearing Course
47
Table ( 4-22): Gradation of asphalt wearing course for MoPWH (MoPWH,1995)
Percentage by Weight Passing Sieve sizeا
(mm) Lower Level Upper Level 19.0 100 100 12.5 80 100 9.5 70 90
4.75 50 70 2.380 35 50 0.84 21 33
0.297 13 23 0.18 10 18
0.075 4 10
0102030405060708090
100
0.01 0.1 1 10 100Diameter size (mm)
Pass
ing
%
Figure (4-22): Gradation of asphalt wearing course for MoPWH (MoPWH,1995)
Table (4-23): Mechanical Properties of Asphalt Wearing Course for MoPWH
(MoPWH,1995) Property Value
Marshal stability (kg) 900 Flow (mm) 2 – 4 Air voids (%) 3 – 5 Voids in Mineral aggregates VMA ( % ) 14 Loss of Marshal stability ( % ) 25 max Number of blows 75 Stiffness (kg/mm) 500 Bitumen content (%) 3.5 – 7.0
Page 65
Chapter Four Specifications of Asphalt Wearing Course
48
Remarks:
• The gradation range is narrow. 4-5-6 Gradation of local requirements: The gradation for all the local requirements (MoG, PECDAR, PSI, UNRWA and
MoPWH) were illustrated in Table (4-24) and Figure (4-23). One frame was selected
from the local requirement as shown in Figure (4-24).
Table (4-24): The Gradation of the Local Group Requirements MoG
Requirements PECDAR
Requirements UNRWA
Requirements PSI
Requirements MoPWH
Requirements Frame of Local
Group Diam. Lower Upper Lower Upper Lower Upper Lower Upper Lower Upper Lower Upper
19 100 100 100 100 90 100 100 100 100 100 90 100 14 100 100 100 100 77 94 85 100 100 100 75 100
12.5 100 100 100 100 71 90 82 98 80 100 67 100 9.5 70 100 70 100 56 80 75 93 70 90 56 100
4.75 50 70 45 70 35 65 60 80 50 70 36 80 2.36 35 55 29 40 23 49 45 65 35 50 22 65
2 32 52 25 35 20 46 42 62 32 45 20 60 1.18 25 42 19 30 14 43 30 48 25 37 13 48 0.84 21 37 17 27 10 37 25 40 21 33 10 42 0.6 18 33 14 26 8 30 20 35 18 29 8 37
0.42 16 30 12 24 6 20 17 30 15 26 6 31 0.300 12 25 10.5 22 5 19 14 27 13 23 5 27 0.180 10 20 9 18 4 17 11 22 10 18 3.5 21 0.150 8 17 8 15 4 15 10 20 8.5 16 3.5 20 0.075 4 9 6 12 2 8 5 10 4 10 2 12
Remarks:
• The range between the upper and lower level of the local frame is wide.
• The UNRWA requirements are similar to the MOPWH requirements in
lower level.
• The maximum aggregate size in UNRWA is 19.00mm, but in PSI is
14.00mm, MoPWH is 12.50mm and the other is 9.50mm.
• The minimum aggregate size in all requirements is 0.075mm.
Page 66
Chapter Four Specifications of Asphalt Wearing Course
49
0102030405060708090
100
0.01 0.1 1 10 100Diameter size (mm)
Pass
ing
%
min(MoG)max(MoG)min(PECDAR)max(PECDAR)min(UNRWA)max(UNRWA)min(PSI)max(PSI)min(MoPWH)max(MoPWH)min(Frame)max(Frame)
Figure (4-23): Gradation of asphalt wearing course (MoG, BECDAR, UNRWA, PSI ,
M.o PWWH and Frame of Local Group Requirements)
0102030405060708090
100
0.01 0.1 1 10 100Diameter size (mm)
Pass
ing
%
Figure (4-24): Gradation of asphalt wearing course (Frame of local group requirements) 4-6 Gradation and Mechanical Properties for the International, Regional and
Local Groups Together:
In this step three frames of the international group, the regional group, local group and
frame were illustrated in Table (4-25),Figure (4-25) and Figure (4-26).
Page 67
Chapter Four Specifications of Asphalt Wearing Course
50
Table (4-25): Gradation of International specifications, Regional specifications, Local
requirements and Frame of all specifications for asphalt wearing course.
Diameter International Specifications
Regional Specifications
Local Requirements
Frame for all Specifications
size Passing (%) Passing (%) Passing (%) Passing (%) (mm) Lower Upper Lower Upper Lower Upper Lower Upper
25 100 100 100 100 100 100 100 100 19 90 100 90 100 90 100 90 100
12.5 68 100 60 100 67 100 60 100 9.5 56 97 49 93 56 100 49 100
4.75 35 80 32 80 36 80 32 80 2.36 23 67 23 65 22 65 22 67 1.18 14 54 14 52 13 48 13 54 0.6 8 45 8 40 8 37 8 42
0.425 7 40 7 35 6 31 6 38 0.3 5 35 5 30 5 27 5 33
0.15 3 22 3 20 3.5 20 3 22 0.075 2 9 2 10 2 12 2 12
0102030405060708090
100
0.01 0.1 1 10 100Diameter size (mm)
Pass
ing
%
min (Inter.)max(Inter.)min(Reg.)max(Reg.)min(Local)max(Local)min(Frame)max(Frame)
Figure (4-25): Gradation of International group specifications, Regional group
specification , Local group requirements and Frame of all specifications for asphalt
wearing course
Page 68
Chapter Four Specifications of Asphalt Wearing Course
51
0102030405060708090
100
0.01 0.1 1 10 100Diameter size (mm)
Pass
ing
%
Figure (4-26): Gradation of asphalt wearing course for Frame of all specifications
(International group specification, Regional group specification and Local group
requirement)
To select the suitable gradation for the Palestinian local materials, it is needed to select
values for the mechanical properties and the bitumen content. The mechanical
properties were selected by using the average of all the mentions specifications and
requirements or the highest value as shown in Table (4-26).
Remarks:
1. The stability is equal 1000 kg , because it is the highest value from the
previous specifications.
2. The flow value is 2 to 4 mm because the most of the specifications and
requirements recommended it.
3. The stiffness is equal 400, because this value is average value in the
specifications.
4. The air voids is equal 3 to 6, because the minimum value in most
Specifications is 3 in and the average of maximum value is 6.
5. VMA (%) is equal 14, because it is most specifications.
6. VFB (%) is equal 60 to 85, because this is the widest range.
Page 69
Chapter Four Specifications of Asphalt Wearing Course
52
7. The bitumen content (%) equal 4.5 to 6.5, because the most specifications
and requirements recommended it.
Table (4-26): Mechanical properties of Asphalt wearing course for all specifications.
Specifications Stability (kg)
Flow (mm)
Stiffness (Kg/mm)
Air voids (%)
VMA (%)
VFB (%)
Bitumen (%)
AASHTO 1000 2 – 3.5 Min 500 4 – 6 14(-1) --- 5 – 7
ZTV --- --- --- 2 - 5 --- --- 6.2 – 7.5
B.S 400 – 800 Max 5 --- --- --- --- 6.5
Egyptian 408 1.5–4..5 Min.272 3 –5 15 --- 4 – 7.5
Jordanian 1000 2 – 3.5 Min 500 4 – 6 14(-1) --- 5 – 7
Iraqi 1000 2 – 4 --- 3 – 5 --- 60 - 75 4.3-6.3
MoG 900 2 - 4 Min 400 3 – 5 14.5 75 – 85 Min 5.5
BECDAR 900 2 - 4 Min 400 3 -6 --- --- 4 - 6
UNRWA 1000 2 – 4 Min 400 3 – 5 Min 14 --- 4 – 6
PSI 408-510 2 - 4 Min.250 4 – 8 Min 14 --- 4.5 – 7
M. o BWH 900 2 – 4 500 3 – 5 14 --- 3.5 – 7
Choose 1000 2 – 4 Min 400 3 - 6 14 60 - 85 4.5 –6.5
Page 70
Chapter Five Tests of Materials
53
Chapter Five Tests of Materials
5-1 Introduction
In this chapter, the tests of the aggregates and the bitumen will be illustrated. The
required materials of aggregates and bitumen were brought from NORCO factory for
asphalt after many field visits to the asphalt factories in Gaza Strip which proved that
the source of the materials is uniformed. The samples of the tested materials represented
the actual mix in the field.
5-2 Tests of Aggregates
Five types of aggregates were selected. They are coarse aggregate M1 (Folia 4) (0/19),
coarse aggregate M2 (Adasia) (0/19), coarse aggregate M3 (Simsimia) (0/9.5), fine
aggregate F1 (filler, Itrabiah) (0/4.75) and fine aggregate F2 (sand) (0/0.425).
These materials were tested in the Laboratory Materials Testing of the Islamic
University. The results of these tests are as follow:
Five tests were conducted on each types of these aggregates, they are as follows:
1. Sieve Analysis Test.
2. Specific Gravity Test.
3. Absorption Test.
4. Moisture Content Test.
5. Abrasion Test.
The results of these tests are as illustrated from Table (5-1) to (5-11) and Figures from
(5-1) to (5-6).
Table (5-1): Result of tests for coarse aggregate M1
Description of test Result
Moisture content (%), (ASTM C 566-96) 0.18
Absorption (%) , (ASTM C127) 2.29
Bulk specific gravity, (ASTM C127) 2.54
Abrasion test (%), (ASTM C 131) 22.0
Page 71
Chapter Five Tests of Materials
54
Table (5-2): Result of Sieve analysis test for coarse aggregate M1, (ASTM C 136)
Sieve Size Retained Cumulative % Cumulative % Passing (mm) Weight (g) Retained (g) Retained
25 0 0 0.0 100.0 19 114 114 2.3 97.7
12.5 4376 4490 92.0 8.0 9.5 240 4730 96.9 3.1
4.75 65 4795 98.3 1.7 2 2 4797 98.3 1.7
1.18 2 4799 98.3 1.7 0.6 2 4801 98.4 1.6
0.425 1 4802 98.4 1.6 0.3 1 4803 98.4 1.6
0.15 1 4804 98.4 1.6 0.075 2 4806 98.5 1.5 Pan 74 4880 100.0 0.0
0.010.020.030.040.050.060.070.080.090.0
100.0
0.01 0.1 1 10 100Diameter size (mm)
Pass
ing
%
Figure ( 5-1 ): Gradation of Coarse Aggregate M1
Page 72
Chapter Five Tests of Materials
55
Table (5-3): Result of tests for coarse aggregate M2 Description of test Result
Moisture content (%), (ASTM C 566-96) 0.12
Absorption (%) , (ASTM C127) 1.48
Bulk specific gravity, (ASTM C127) 2.58
Abrasion test (%), (ASTM C 131) 19.0
Table (5-4): Result of Sieve analysis test for coarse aggregate M2, (ASTM C 136)
Sieve Size Retained Cumulative % Cumulative % Passing (mm) Weight (g) Retained (g) Retained
25 0 0 0.0 100.0 19 32 32 1.0 99.0
12.5 694 726 22.3 77.7 9.5 1244 1970 60.4 39.6
4.75 1135 3105 95.2 4.8 2 65 3170 97.2 2.8
1.18 5 3175 97.4 2.6 0.6 5 3180 97.5 2.5
0.425 1 3181 97.6 2.4 0.3 1 3182 97.6 2.4
0.15 3 3185 97.7 2.3 0.075 2 3187 97.8 2.2 Pan 73 3260 100.0 0.0
0.010.020.030.040.050.060.070.080.090.0
100.0
0.01 0.1 1 10 100Diameter size (mm)
Pass
ing
%
Figure ( 5-2 ): Gradation of Coarse Aggregate M2
Page 73
Chapter Five Tests of Materials
56
Table (5-5): Result of tests for coarse aggregate M3 Description of test Result
Moisture content (%), (ASTM C 566-96) 0.24
Absorption (%) , (ASTM C127) 2.17
Bulk specific gravity, (ASTM C127) 2.55
Abrasion test (%), (ASTM C 131) 17.0
Table (5-6): Result of Sieve analysis test for coarse aggregate M3, (ASTM C 136) Sieve Size Retained Cumulative % Cumulative % Passing
(mm) Weight (g) Retained (g) Retained 25 0 0 0.0 100.0 19 0 0 0.0 100.0
12.5 0 0 0.0 100.0 9.5 42 42 1.3 98.7
4.75 2373 2415 74.3 25.7 2 610 3025 93.1 6.9
1.18 65 3090 95.1 4.9 0.6 10 3100 95.4 4.6
0.425 5 3105 95.5 4.5 0.3 5 3110 95.7 4.3
0.15 5 3115 95.8 4.2 0.075 10 3125 96.2 3.8 Pan 125 3250 100.0 0.0
0.010.020.030.040.050.060.070.080.090.0
100.0
0.01 0.1 1 10 100Diameter size (mm)
Pass
ing
%
Figure ( 5-3): Gradation of Coarse Aggregate M3
Page 74
Chapter Five Tests of Materials
57
Table (5-7): Result of tests for fine aggregate F1
Description of test Result
Moisture content (%), (ASTM C 566-96) 0.86
Absorption (%) , (ASTM C128) 1.26
Bulk specific gravity, (ASTM C128) 2.75
Table (5-8): Result of Sieve analysis test for fine aggregate F1, (ASTM C 136)
Sieve Size Retained Cumulative % Cumulative % Passing
(mm) Weight (g) Retained (g) Retained 25 0 0 0.0 100.0 19 0 0 0.0 100.0
12.5 0 0 0.0 100.0 9.5 24 24 1.5 98.5
4.75 66 90 5.7 94.3 2 322 412 26.0 74.0
1.18 286 698 44.1 55.9 0.6 186 884 55.9 44.1
0.425 74 958 60.6 39.4 0.3 52 1010 63.8 36.2
0.15 124 1134 71.7 28.3 0.075 72 1206 76.2 23.8 Pan 376 1582 100.0 0.0
0.010.020.030.040.050.060.070.080.090.0
100.0
0.01 0.1 1 10 100Diameter size (mm)
Pass
ing
%
Figure (5-4 ): Gradation of Fine Aggregate F1
Page 75
Chapter Five Tests of Materials
58
Table (5-9): Result of tests for fine aggregate (Sand) F2
Description of test Result
Moisture content (%), (ASTM C 566-96) 0.09
Absorption (%) , (ASTM C128) 6.10
Bulk specific gravity, (ASTM C128) 2.65
Table (5-10): Result of Sieve analysis test for fine aggregate F2, (ASTM C 136)
Sieve Size Retained Cumulative % Cumulative % Passing
(mm) Weight (g) Retained (g) Retained 25 0 0 0.0 100.0 19 0 0 0.0 100.0
12.5 0 0 0.0 100.0 9.5 0 0 0.0 100.0
4.75 0 0 0.0 100.0 2 0 0 0.0 100.0
1.18 0 0 0.0 100.0 0.6 6 6 0.4 99.6
0.425 244 250 16.7 83.3 0.3 534 784 52.3 47.7
0.15 674 1458 97.2 2.8 0.075 12 1470 98.0 2.0 Pan 30 1500 100.0 0.0
0.010.020.030.040.050.060.070.080.090.0
100.0
0.01 0.1 1 10 100Diameter size (mm)
Pass
ing
%
Figure (5-5): Gradation of Fine Aggregate F2 (Sand)
Page 76
Chapter Five Tests of Materials
59
Table (5-11): Result of Sieve analysis test for all aggregates
Sieve Size
Coarse Aggregates
M1
Coarse Aggregates
M1
Coarse Aggregates
M1
Fine Aggregates
F1
Fine Aggregates
F2 (mm) Passing % Passing % Passing % Passing % Passing %
25 100.0 100.0 100.0 100.0 100.0 19 97.7 99.0 100.0 100.0 100.0
12.5 8.0 77.7 100.0 100.0 100.0 9.5 3.1 39.6 98.7 98.5 100.0 4.75 1.7 4.8 25.7 94.3 100.0
2 1.7 2.8 6.9 74.0 100.0 1.18 1.7 2.6 4.9 55.9 100.0 0.6 1.6 2.5 4.6 44.1 99.6
0.425 1.6 2.4 4.5 39.4 83.3 0.3 1.6 2.4 4.3 36.2 47.7 0.15 1.6 2.3 4.2 28.3 2.8
0.075 1.5 2.2 3.8 23.8 2.0 Pan 0.0 0.0 0.0 0.0 0.0
0102030405060708090
100
0.01 0.1 1 10 100Diameter size (mm)
Pass
ing
%
Agg.M1Agg.M2
Agg.M3
Filler F1Sand F2
Figure (5-6): Gradation of all Aggregates.
5-3 Tests of Bitumen:
The bitumen were tested in the Laboratory Materials Testing of the Islamic University,
The tests are as follow;
Page 77
Chapter Five Tests of Materials
60
1- Penetration test.
2- Ductility test
3- Softening point test.
4- Density test.
The results of these tests are as illustrated in Table (5-12)
Table (5-12): Test of bitumen.
Description of test Results
Penetration (Co) (ASTM D5) 69 Ductility (cm) (ASTM D 113) 100 Softening point (Co) (ASTM D36 ) 53 Density (g/cm3) (ASTM D 70) 1.0295
Page 78
Chapter Six Preparation and Testing of Asphalt Mixes
61
Chapter Six Preparation and Testing of Asphalt Mixes
6-1 Introduction:
The materials of asphalt mixture were tested and they were valid to be used according
to the special conditions of these materials. In this chapter, the mixture which achieves
the best mechanical properties with least bitumen content will be proposed. To achieve
this several steps were followed as explained in the methodology.
6- 2 Methodology of Selecting the Proposed Mix:
To propose the best mix for the asphalt wearing course which suits the Palestinian local
materials and achieve the best mechanical properties and the least bitumen content, the
researcher made the following steps:
1. The frame of the gradations of the three groups, international specifications,
regional specifications and local requirements, was adopted as shown in Table (4-25)
and Figure (4-26).
2. Five gradation curves were selected within the frame in the previous step. These
five gradations were the minimum limit of the frame, the maximum level of the
frame and the other three gradations are between the minimum and the maximum
limits and entitled “mid1, mid2 and mid3” as illustrates in Table (6-1) and Figure
(6-1).
3. Preparation of the aggregates blending. To obtain any gradation of asphalt mix,
several kinds of aggregates should be mixed together. There are many methods to
make the mix in order to fit specific range or gradation. In this research the
experimentalism mathematical method was adopted because it is suitable for mixing
two types or more of the aggregates (see Appendix 1). The mixes were composed
from the aggregates which were selected and experienced in Chapter Five ( M1, M2,
M3, F1, and F2) (Jendia, 2000). As a result of the experimentalism mathematical
method, a new curve for every mix was obtained as example Figure (6-2 ) where
there are two curves, one for the original gradation which was selected by the
researcher from the frame of all the specifications and the other which obtained
from the experimentalism mathematical method called the mix curve.
Page 79
Chapter Six Preparation and Testing of Asphalt Mixes
62
4. Trial mixes for the five gradations were carried out in the laboratory with using
several percentages of bitumen 4.5%, 5%, 5.5%,6% and 6.5% for each gradation.
Marshall method was adopted.
5. The samples were tested and their mechanical properties were determined. The
results of the mechanical properties were compared with the selected mechanical
properties in Chapter Four, Table (4-26).
6. Propose the gradation or the range which achieve the best mechanical properties
with least bitumen content.
Table (6-1): Gradations for five selected curves
Diameter Passing (%)
(mm) min. mid1 mid2 mid3 max. 25 100 100 100 100 100 19 90 92.5 95 97.5 100
12.5 60 70 80 90 100 9.5 49 61.75 74.5 87.25 100 4.75 32 44 56 68 80 2.36 22 33.25 44.5 55.75 67 1.18 13 23.25 33.5 43.75 54 0.6 8 16.5 25 33.5 42
0.425 6 14 22 30 38 0.3 5 12 19 26 33 0.15 3 7.75 12.5 17.25 22
0.075 2 4.5 7 9.5 12
Page 80
Chapter Six Preparation and Testing of Asphalt Mixes
63
0102030405060708090
100
0.01 0.1 1 10 100Diameter size (mm)
Pass
ing
%
MinMid1Mid2Mid3Max
Figure (6-1): Gradations for five selected curves
6-3 Gradations and Job Mixes:
Five gradations were selected as first trials. They are min, max, mid1, mid2 and mid3.
6-3-1 Min. Curve Mix:
The following Tables from (6-2) to (6-8) and Figure (6-2) shows aggregate ratio,
gradation curve, job mix with different bitumen content for each one from the five
selected gradations and conclusion.
Table (6-2): Aggregate ratio in Min. mix.
Asphalt mixture Sand F2
(%) Filler F1
(%) Agg. M3
(%) Agg. M2
(%) Agg. M1
(%) Bitumen
(%) 3.00 17.00 25.00 22.00 33.00 4.50 3.00 17.00 25.00 22.00 33.00 5.00 3.00 17.00 25.00 22.00 33.00 5.50 3.00 17.00 25.00 22.00 33.00 6.00 3.00 17.00 25.00 22.00 33.00 6.50
Page 81
Chapter Six Preparation and Testing of Asphalt Mixes
64
0102030405060708090
100
0.01 0.1 1 10 100Diameter size (mm)
Pass
ing
%
min.mix
Figure (6-2 ): Gradation of min. and mix curves.
Table (6-3): Outputs of job mix for min gradation with 4.5% Bitumen Content.
Volume (cm3)
Stability Correction
Factor
corrected stability
(kg)
Flow (mm)
Stiffness (kg/mm)
ρA (g/cm3)
ρBit (g/cm3)
Va (%)
Vb (%)
VMA (%)
VFB (%)
532.00 1.00 921.19 4.00 230.30 2.25 2.42 6.92 9.85 16.77 58.74 535.50 1.00 947.28 5.58 169.66 2.25 2.42 6.87 9.86 16.73 58.92 589.50 1.00 816.82 5.08 160.69 2.27 2.42 6.16 9.93 16.09 61.74
Average 895.10 4.89 186.88 2.26 2.42 6.65 9.88 16.53 59.80
Table (6-4): Outputs of job mix for min gradation with 5.0% Bitumen Content.
Volume (cm3)
Stability Correction
Factor
corrected stability
(kg)
Flow (mm)
Stiffness (kg/mm)
ρA (g/cm3)
ρBit (g/cm3)
Va (%)
Vb (%)
VMA (%)
VFB (%)
532.50 0.96 1247.54 3.44 362.48 2.29 2.44 6.18 11.11 17.29 64.26 521.00 1.00 1260.38 4.00 315.10 2.28 2.44 6.55 11.07 17.62 62.83 511.00 0.96 1235.02 4.17 296.40 2.30 2.44 5.72 11.17 16.89 66.11
Average 1247.65 3.87 324.66 2.29 2.44 6.15 11.12 17.27 64.40
Page 82
Chapter Six Preparation and Testing of Asphalt Mixes
65
Table (6-5): Outputs of job mix for min gradation with 5.5% Bitumen Content.
Volume (cm3)
Stability Correction Factor
corrected stability (kg)
Flow (mm)
Stiffness (kg/mm)
ρA (g/cm3)
ρBit (g/cm3)
Va (%)
Vb (%)
VMA (%)
VFB (%)
533.00 1.00 1051.65 4.75 221.40 2.24 2.44 8.00 11.99 19.99 59.98 525.50 0.96 809.20 4.83 167.42 2.25 2.44 7.90 12.00 19.90 60.32 528.50 0.96 834.24 3.92 213.00 2.26 2.44 7.22 12.09 19.31 62.62 Average 898.36 4.50 200.61 2.25 2.44 7.70 12.03 19.73 60.97
Table (6-6): Outputs of job mix for min gradation with 6.0% Bitumen Content.
Volume (cm3)
Stability Correction
Factor
corrected stability
(kg)
Flow (mm)
Stiffness (kg/mm)
ρA (g/cm3)
ρBit (g/cm3)
Va (%)
Vb (%)
VMA (%)
VFB (%)
527.50 0.96 1047.15 3.67 285.59 2.27 2.41 5.91 13.21 19.12 69.11 518.00 0.96 1047.15 3.67 285.59 2.19 2.41 9.27 12.74 22.01 57.89 533.00 0.96 1084.73 3.25 333.76 2.26 2.41 6.02 13.20 19.22 68.67
Average 1059.68 3.53 301.65 2.24 2.41 7.07 13.05 20.12 65.22
Table (6-7): Outputs of job mix for min gradation with 6.5% Bitumen Content.
Volume (cm3)
Stability Correction
Factor
corrected stability
(kg)
Flow (mm)
Stiffness (kg/mm)
ρA (g/cm3)
ρBit (g/cm3)
Va (%)
Vb (%)
VMA (%)
VFB (%)
532.00 0.96 1097.25 4.00 274.31 2.18 2.37 7.83 13.79 21.62 63.80 531.50 0.96 997.06 2.75 362.57 2.23 2.37 5.83 14.09 19.92 70.72 514.00 0.96 1042.14 2.63 397.01 2.35 2.37 0.74 14.85 15.59 95.26
Average 1045.48 3.13 344.63 2.26 2.37 4.80 14.24 19.04 76.59
Table (6-8): Conclusion of Job mix for min gradation.
Mix Bit. (%)
corrected stability (kg)
Flow (mm)
Stiffness (kg/mm)
Va (%) VMA (%) Final Result
Min. 4.50 885.1 No 4.89 No 186.88 No 6.65 No 16.53 Yes Rejected
Min. 5.00 1247.65 Yes 3.87 Yes 324.66 No 6.15 No 17.27 Yes Rejected
Min. 5.50 898.36 No 4.5 No 200.61 No 7.7 No 19.73 Yes Rejected
Min. 6.00 1059.68 Yes 3.53 Yes 301.65 No 7.07 No 20.12 Yes Rejected
Min. 6.50 1045.48 Yes 3.13 Yes 344.63 No 4.8 Yes 19.04 Yes Rejected
Page 83
Chapter Six Preparation and Testing of Asphalt Mixes
66
Remarks: 1. In general, All mixes with different bitumen content in Min. curve are rejected,
because they are not achieve the selected mechanical properties (Table 4-26), and
they are very coarse and very viscous.
6-3-2 Mid1 curve Mix : The following Tables from (6-9) to (6-15) and Figure (6-3) shows aggregate ratio,
gradation curve, job mix with different bitumen content for each one from the five
selected gradations and conclusion.
Table ( 6-9 ): Aggregate ratio in Mid 1 mix.
Asphalt mixture Sand F2
(%) Filler F1
(%) Agg. M3
(%) Agg. M2
(%) Agg. M1
(%) Bitumen
(%) 4.00 34.00 20.00 17.00 25.00 4.50 4.00 34.00 20.00 17.00 25.00 5.00 4.00 34.00 20.00 17.00 25.00 5.50 4.00 34.00 20.00 17.00 25.00 6.00 4.00 34.00 20.00 17.00 25.00 6.50
0102030405060708090
100
0.01 0.1 1 10 100Diameter size (mm)
Pass
ing
%
mid1mid2
Figure (6-3 ): Gradation of mid1. and mix curves.
Page 84
Chapter Six Preparation and Testing of Asphalt Mixes
67
Table (6-10): Outputs of job mix for mid1 gradation with 4.5% Bitumen Content.
Volume (cm3)
Stability Correction
Factor
corrected stability
(kg)
Flow (mm)
Stiffness (kg/mm)
ρA (g/cm3)
ρBit (g/cm3)
Va (%)
Vb (%)
VMA (%)
VFB (%)
507.30 1.04 2577.12 3.10 831.33 2.35 2.44 3.91 10.27 14.18 72.43 515.30 1.00 2786.00 3.00 928.67 2.33 2.44 4.66 10.19 14.85 68.61 509.70 1.04 2453.36 2.90 845.99 2.33 2.44 4.69 10.18 14.87 68.47
Average 2605.49 3.00 868.66 2.34 2.44 4.42 10.21 14.63 69.83
Table (6-11): Outputs of job mix for mid1 gradation with 5.0% Bitumen Content.
Volume (cm3)
Stability Correction
Factor
corrected stability
(kg)
Flow (mm)
Stiffness (kg/mm)
ρA (g/cm3)
ρBit (g/cm3)
Va (%)
Vb (%)
VMA (%)
VFB (%)
519.10 1.00 2576.00 2.90 888.28 2.32 2.43 4.51 11.29 15.80 71.43 519.90 1.00 2254.00 2.60 866.92 2.30 2.43 5.38 11.18 16.56 67.52 518.50 1.00 2590.00 3.10 835.48 2.29 2.43 5.88 11.13 17.00 65.43
Average 2473.33 2.87 863.56 2.31 2.43 5.26 11.20 16.46 68.13
Table (6-12): Outputs of job mix for mid1 gradation with 5.5% Bitumen Content.
Volume (cm3)
Stability Correction
Factor
corrected stability
(kg)
Flow (mm)
Stiffness (kg/mm)
ρA (g/cm3)
ρBit (g/cm3)
Va (%)
Vb (%)
VMA (%)
VFB (%)
511.80 1.04 1820.00 3.36 541.67 2.35 2.43 3.19 12.55 15.74 79.74 513.40 1.00 1806.00 3.60 501.67 2.34 2.43 3.63 12.49 16.12 77.51 513.60 1.00 1904.00 3.72 511.83 2.34 2.43 3.37 12.53 15.90 78.78
Average 1843.33 3.56 518.39 2.34 2.43 3.40 12.52 15.92 78.68 Table (6-13): Outputs of job mix for mid1 gradation with 6.0% Bitumen Content.
Volume (cm3)
Stability Correction
Factor
corrected stability
(kg)
Flow (mm)
Stiffness (kg/mm)
ρA (g/cm3)
ρBit (g/cm3)
Va (%)
Vb (%)
VMA (%)
VFB (%)
512.50 1.00 1512.00 3.75 403.20 2.35 2.42 2.74 13.71 16.45 83.32 512.90 1.00 1484.00 3.75 395.73 2.35 2.42 2.99 13.68 16.67 82.06 513.60 1.00 1470.00 3.75 392.00 2.35 2.42 2.67 13.72 16.39 83.70
Average 1488.67 3.75 396.98 2.35 2.42 2.80 13.70 16.50 83.03
Page 85
Chapter Six Preparation and Testing of Asphalt Mixes
68
Table (6-14): Outputs of job mix for mid1 gradation with 6.5% Bitumen Content.
Volume (cm3)
Stability Correction
Factor
corrected stability
(kg)
Flow (mm)
Stiffness (kg/mm)
ρA (g/cm3)
ρBit (g/cm3)
Va (%)
Vb (%)
VMA (%)
VFB (%)
504.50 1.04 1601.60 4.10 390.63 2.38 2.41 1.14 15.06 16.19 92.99 503.70 1.04 1630.72 4.20 388.27 2.37 2.41 1.85 14.95 16.80 88.98 508.70 1.00 1806.00 3.80 475.26 2.37 2.41 1.90 14.94 16.84 88.70
Average 1679.44 4.03 418.05 2.37 2.41 1.63 14.98 16.61 90.22
Table (6-15): Conclusion of Job mix for mid1 gradation.
Mix Bit. (%)
corrected stability (kg)
Flow (mm)
Stiffness (kg/mm)
Va (%) VMA (%) Final Result
Mid-1 4.50 2605.44 Yes 3 Yes 868.66 Yes 4.42 Yes 14.63 Yes Accepted
Mid -1 5.00 2473.33 Yes 2.87 Yes 863.56 Yes 5.26 Yes 16.46 Yes Accepted
Mid -1 5.50 1843.33 Yes 3.56 Yes 518.39 Yes 3.4 Yes 15.92 Yes Accepted
Mid -1 6.00 1488.67 Yes 3.75 Yes 396.98 No 2.8 No 16.50 Yes Rejected
Mid -1 6.50 1679.44 Yes 4.03 No 418.05 Yes 1.63 No 16.61 Yes Rejected
Remarks:
• The mixes at bitumen content 4.5% to 5.50% in Mid1 curve are suitable ,
because it is suitable in the last of mechanical properties (Table 4-26).
• The mixes at bitumen content 6.0% to 6.50% in Mid1 curve are rejected ,
because they are not suitable in stiffness and air voids compared with the
proposed specifications (Table 4-26).
8-3-3 Mid 2 curve Mix : The following Tables from (6-16) to (6-22) and Figure (6-4) shows aggregate ratio,
gradation curve, job mix with different bitumen content for each one from the five
selected gradations and conclusion.
Page 86
Chapter Six Preparation and Testing of Asphalt Mixes
69
Table (6-16) Aggregate ratio in Mid 2 mix.
Asphalt mixture Sand F2
(%) Filler F1
(%) Agg. M3
(%) Agg. M2
(%) Agg. M1
(%) Bitumen
(%) 4.00 44.00 25.00 15.00 12.00 4.50 4.00 44.00 25.00 15.00 12.00 5.00 4.00 44.00 25.00 15.00 12.00 5.50 4.00 44.00 25.00 15.00 12.00 6.00 4.00 44.00 25.00 15.00 12.00 6.50
0102030405060708090
100
0.01 0.1 1 10 100Diameter size (mm)
Pass
ing
%
mid2mix
Figure (6-4 ): Gradation of mid2. and mix curves.
Table (6-17): Outputs of job mix for mid2 gradation with 4.5% Bitumen Content.
Volume (cm3)
Stability Correction
Factor
corrected stability
(kg)
Flow (mm)
Stiffness (kg/mm)
ρA (g/cm3)
ρBit (g/cm3)
Va (%)
Vb (%)
VMA (%)
VFB (%)
511.50 1.00 1983.13 3.57 556.02 2.34 2.48 5.61 10.24 15.85 64.59 514.50 1.00 2082.28 3.70 562.78 2.34 2.48 5.77 10.22 15.99 63.91 517.00 1.00 2330.16 3.46 673.78 2.32 2.48 6.42 10.15 16.57 61.25
Average 2131.86 3.58 597.53 2.33 2.48 5.93 10.20 16.14 63.25
Page 87
Chapter Six Preparation and Testing of Asphalt Mixes
70
Table (6-18): Outputs of job mix for mid2 gradation with 5.0% Bitumen Content.
Volume (cm3)
Stability Correction
Factor
corrected stability
(kg)
Flow (mm)
Stiffness (kg/mm)
ρA (g/cm3)
ρBit (g/cm3)
Va (%)
Vb (%)
VMA (%)
VFB (%)
517.50 1.00 1758.74 3.78 465.89 2.32 2.48 6.16 11.28 17.44 64.67 514.50 1.00 1782.22 3.38 526.77 2.34 2.48 5.34 11.38 16.72 68.06 512.00 1.00 1813.53 3.67 494.60 2.34 2.48 5.27 11.39 16.66 68.35
Average 1784.83 3.61 495.75 2.34 2.48 5.59 11.35 16.94 67.03
Table (6-19): Outputs of job mix for mid2 gradation with 5.5% Bitumen Content.
Volume (cm3)
Stability Correction
Factor
corrected stability
(kg)
Flow (mm)
Stiffness (kg/mm)
ρA (g/cm3)
ρBit (g/cm3)
Va (%)
Vb (%)
VMA (%)
VFB (%)
514.00 1.00 1792.66 3.75 478.04 2.35 2.43 3.25 12.55 15.80 79.41 512.50 1.00 1860.50 3.69 503.97 2.36 2.43 2.85 12.60 15.45 81.56 508.00 1.04 1894.22 3.75 505.12 2.36 2.43 2.96 12.58 15.54 80.95
Average 1849.13 3.73 495.71 2.35 2.43 3.02 12.58 15.60 80.64
Table (6-20) Outputs of job mix for mid2 gradation with 6.0% Bitumen Content.
Volume (cm3)
Stability Correction
Factor
corrected stability
(kg)
Flow (mm)
Stiffness (kg/mm)
ρA (g/cm3)
ρBit (g/cm3)
Va (%)
Vb (%)
VMA (%)
VFB (%)
514.00 1.00 1129.92 4.97 227.50 2.34 2.38 1.78 13.63 15.41 88.44 510.00 1.00 1359.53 5.42 250.99 2.36 2.38 0.93 13.75 14.68 93.67 513.50 1.00 1328.22 4.72 281.60 2.35 2.38 1.11 13.72 14.84 92.49
Average 1272.56 5.03 253.36 2.35 2.38 1.28 13.70 14.97 91.53
Table (6-21): Outputs of job mix for mid2 gradation with 6.5% Bitumen Content.
Volume (cm3)
Stability Correction
Factor
corrected stability
(kg)
Flow (mm)
Stiffness (kg/mm)
ρA (g/cm3)
ρBit (g/cm3)
Va (%)
Vb (%)
VMA (%)
VFB (%)
515.00 1.00 1346.49 4.12 327.08 2.33 2.39 2.17 14.74 16.91 87.19 541.00 0.93 1487.61 3.73 399.36 2.25 2.39 5.67 14.21 19.88 71.50 517.00 1.00 1213.42 5.26 230.76 2.35 2.39 1.57 14.83 16.40 90.42
Average 1349.17 4.37 319.07 2.31 2.39 3.13 14.60 17.73 83.04
Page 88
Chapter Six Preparation and Testing of Asphalt Mixes
71
Table (6-22): Conclusion of Job mix for mid2 gradation.
Mix Bit.
(%) corrected stability (kg)
Flow (mm)
Stiffness (kg/mm)
Va (%) VMA (%) Final Result
Mid-2 4.5 2131.86 Yes 3.58 Yes 597.53 Yes 5.93 Yes 17.07 Yes Accepted
Mid-2 5.0 1784.83 Yes 3.61 Yes 495.75 Yes 5.59 Yes 17.88 Yes Accepted
Mid-2 5.5 1849.13 Yes 3.73 Yes 495.71 Yes 3.02 Yes 15.6 Yes Accepted
Mid-2 6.0 1272.56 Yes 5.03 No 253.36 No 1.28 No 14.97 Yes Rejected
Mid-2 6.5 1349.12 Yes 4.37 No 319.07 No 3.13 Yes 17.73 Yes Rejected
Remarks:
• The mixes with bitumen content 4.5% to 5.50% in Mid2 curve are accepted ,
because it is suitable in the last selected of mechanical properties (Table 4-26).
• The mixes at bitumen content 6.0% to 6.50% in Mid2 curve are rejected ,
because they are not suitable in the last selected of mechanical properties (Table
4-26).
8-3-4 Mid 3 curve Mix : The following Tables from (6-23) to (6-29) and Figure (6-5) shows aggregate ratio,
gradation curve, job mix with different bitumen content for each one from the five
selected gradations and conclusion.
Table (6-23 ): Aggregate ratio in Mid 3 mix.
Asphalt mixture
Sand F2 (%)
Filler F1 (%)
Agg. M3 (%)
Agg. M2 (%)
Agg. M1 (%)
Bitumen ( %)
6.00 55.00 20.00 13.00 6.00 4.50 6.00 55.00 20.00 13.00 6.00 5.00 6.00 55.00 20.00 13.00 6.00 5.50 6.00 55.00 20.00 13.00 6.00 6.00 6.00 55.00 20.00 13.00 6.00 6.50
Page 89
Chapter Six Preparation and Testing of Asphalt Mixes
72
0102030405060708090
100
0.01 0.1 1 10 100Diameter size (mm)
Pass
ing
%
mid3mix
Figure ( 6-5 ): Gradation of mid 3 and mix curves.
Table (6-24): Outputs of job mix for mid3 gradation with 4.5% Bitumen Content.
Volume (cm3)
Stability Correction
Factor
corrected stability
(kg)
Flow (mm)
Stiffness (kg/mm)
ρA (g/cm3)
ρBit (g/cm3)
Va (%)
Vb (%)
VMA (%)
VFB (%)
536.00 0.93 655.30 3.78 173.59 2.21 2.53 12.53 9.66 22.18 43.53 495.00 1.09 642.90 3.75 171.44 2.21 2.53 12.60 9.65 22.25 43.36 528.50 0.96 779.14 4.32 180.50 2.25 2.53 10.83 9.84 20.68 47.60
Average 692.45 3.95 175.18 2.22 2.53 11.99 9.71 21.70 44.83
Table (6-25): Outputs of job mix for mid3 gradation with 5.0% Bitumen Content.
Volume (cm3)
Stability Correction
Factor
corrected stability
(kg)
Flow (mm)
Stiffness (kg/mm)
ρA (g/cm3)
ρBit (g/cm3)
Va (%)
Vb (%)
VMA (%)
VFB (%)
516.00 1.00 1302.13 3.88 336.03 2.30 2.56 10.32 11.17 21.49 51.97 536.00 0.93 1269.22 3.75 338.46 2.29 2.56 10.76 11.11 21.87 50.81 520.00 1.00 1216.03 3.41 356.78 2.28 2.56 11.01 11.08 22.09 50.16
Average 1262.46 3.68 343.76 2.29 2.56 10.70 11.12 21.82 50.98
Page 90
Chapter Six Preparation and Testing of Asphalt Mixes
73
Table (6-26): Outputs of job mix for mid3 gradation with 5.5% Bitumen Content.
Volume (cm3)
Stability Correction
Factor
corrected stability
(kg)
Flow (mm)
Stiffness (kg/mm)
ρA (g/cm3)
ρBit (g/cm3)
Va (%)
Vb (%)
VMA (%)
VFB (%)
508.50 1.04 2038.04 4.17 489.13 2.33 2.46 5.47 12.44 17.91 69.47 509.50 1.00 1690.90 3.98 424.49 2.34 2.46 5.09 12.49 17.58 71.03 502.50 1.04 2078.74 3.69 563.09 2.34 2.46 5.11 12.49 17.59 70.98
Average 1935.89 3.95 492.24 2.33 2.46 5.22 12.47 17.69 70.49
Table (6-27): Outputs of job mix for mid3 gradation with 6.0% Bitumen Content.
Volume (cm3)
Stability Correction
Factor
corrected stability
(kg)
Flow (mm)
Stiffness (kg/mm)
ρA (g/cm3)
ρBit (g/cm3)
Va (%)
Vb (%)
VMA (%)
VFB (%)
529.00 0.96 1405.35 4.11 342.07 2.25 2.44 7.80 13.14 20.94 62.74 529.00 0.96 1390.32 5.00 278.06 2.24 2.44 8.30 13.07 21.37 61.14 526.50 0.96 1347.73 4.75 283.73 2.25 2.44 7.83 13.13 20.96 62.65
Average 1381.13 4.62 301.29 2.25 2.44 7.98 13.11 21.09 62.18
Table (6-28): Outputs of job mix for mid3 gradation with 6.5% Bitumen Content.
Volume (cm3)
Stability Correction
Factor
corrected stability
(kg)
Flow (mm)
Stiffness (kg/mm)
ρA (g/cm3)
ρBit (g/cm3)
Va (%)
Vb (%)
VMA (%)
VFB (%)
506.00 1.04 1582.16 4.98 318.02 2.35 2.44 3.54 14.85 18.39 80.77 511.00 1.00 1487.38 6.19 240.22 2.33 2.44 4.32 14.73 19.05 77.33 499.50 1.04 1595.72 5.26 303.47 2.37 2.44 2.81 14.97 17.78 84.17
Average 1555.09 5.48 287.24 2.35 2.44 3.56 14.85 18.41 80.76
Table (6-29): Conclusion of Job mix for mid3 gradation.
Mix Bit. (%)
corrected stability (kg)
Flow (mm)
Stiffness (kg/mm)
Va (%) VMA (%) Final Result
Mid-3 4.5 692.45 Yes 3.95 Yes 175.18 No 12 No 21.7 Yes Rejected
Mid-3 5.0 1262.46 Yes 3.68 Yes 343.76 No 10.7 No 21.82 Yes Rejected
Mid-3 5.5 1935.89 Yes 3.95 Yes 492.24 Yes 5.22 Yes 17.69 Yes Accepted
Mid-3 6.0 1381.13 Yes 4.62 No 301.29 No 7.98 No 21 Yes Rejected
Mid-3 6.5 1555.09 Yes 5.48 No 287.24 No 3.56 Yes 18.41 Yes Rejected
Page 91
Chapter Six Preparation and Testing of Asphalt Mixes
74
Remarks:
• The mixes with bitumen content 5.50% in Mid3 curve are suitable , because it
is suitable in the last selected of mechanical properties (Table 4-26).
• The mixes of bitumen content 4.5%, 5.0% , 6.00% and 6.5% in Mid3 curve
are rejected , because they are not suitable in the last selected of mechanical
properties (Table 4-26).
6-3-5 Max. curve Mix : The following Tables from (6-30) to (6-36) and Figure (6-6) shows aggregate ratio,
gradation curve, job mix with different bitumen content for each one from the five
selected gradations and conclusion.
Table ( 6-30): Aggregate ratio in Max. mix.
Asphalt mixture Sand F2
(%) Filler F1
(%) Agg. M3
(%) Agg. M2
(%) Agg. M1
(%) Bitumen
( %) 10.00 70.00 15.00 5.00 0.00 4.50 10.00 70.00 15.00 5.00 0.00 5.00 10.00 70.00 15.00 5.00 0.00 5.50 10.00 70.00 15.00 5.00 0.00 6.00 10.00 70.00 15.00 5.00 0.00 6.50
0102030405060708090
100
0.01 0.1 1 10 100Diameter size (mm)
Pass
ing
%
maxmix
Figure (6-6 ): Gradation of max. and mix curve.
Page 92
Chapter Six Preparation and Testing of Asphalt Mixes
75
Table (6-31): Outputs of job mix for max gradation with 4.5% Bitumen Content.
Volume (cm3)
Stability Correction
Factor
corrected stability
(kg)
Flow (mm)
Stiffness (kg/mm)
ρA (g/cm3)
ρBit (g/cm3)
Va (%)
Vb (%)
VMA (%)
VFB (%)
575.50 0.83 740.76 3.54 209.16 2.15 2.53 15.05 9.38 24.43 38.38 535.50 0.96 754.09 3.50 215.45 2.16 2.53 14.37 9.45 23.82 39.68 497.50 1.04 803.36 3.18 253.03 2.16 2.53 14.59 9.43 24.02 39.25
Average 766.07 3.41 225.88 2.15 2.53 14.67 9.42 24.09 39.10
Table (6-32): Outputs of job mix for max gradation with 5.0% Bitumen Content.
Volume (cm3)
St Corr. Factor
corrected stability
Flow (mm)
Stiffness (kg/mm)
ρA (g/cm3)
ρBit (g/cm3)
Va (%)
Vb (%)
VMA (%)
VFB (%)
549.00 0.89 1005.63 4.50 223.47 2.18 2.53 13.70 10.61 24.31 43.65 553.00 0.89 901.13 4.01 224.82 2.17 2.53 14.46 10.52 24.98 42.10 561.00 0.86 965.00 4.01 240.75 2.10 2.53 16.99 10.21 27.19 37.53
Average 957.26 4.17 229.68 2.15 2.53 15.05 10.45 25.49 41.10
Table (6-33): Outputs of job mix for max gradation with 5.5% Bitumen Content.
Volume (cm3)
St Corr. Factor
corrected stability
Flow (mm)
Stiffness (kg/mm)
ρA (g/cm3)
ρBit (g/cm3)
Va (%)
Vb (%)
VMA (%)
VFB (%)
575.50 0.83 768.92 2.92 263.63 2.03 2.46 17.53 10.85 28.38 38.24 544.50 0.93 1293.48 4.82 268.54 2.20 2.46 10.71 11.75 22.46 52.31 528.00 0.96 1042.14 2.92 357.31 2.22 2.46 10.00 11.84 21.84 54.23
Average 1034.85 3.55 296.49 2.15 2.46 12.75 11.48 24.23 48.26
Table (6-34): Outputs of job mix for max gradation with 6.0% Bitumen Content.
Volume (cm3)
Stability Correction
Factor
corrected stability
(kg)
Flow (mm)
Stiffness (kg/mm)
ρA (g/cm3)
ρBit (g/cm3)
Va (%)
Vb (%)
VMA (%)
VFB (%)
532.00 0.96 2019.03 4.68 431.11 2.30 2.45 6.17 13.40 19.57 68.49 520.00 1.00 1938.78 4.07 476.75 2.31 2.45 5.89 13.44 19.33 69.55 511.00 1.00 2077.06 4.58 453.18 2.31 2.45 5.70 13.47 19.17 70.25
Average 2011.62 4.44 453.68 2.31 2.45 5.92 13.44 19.36 69.43
Page 93
Chapter Six Preparation and Testing of Asphalt Mixes
76
Table (6-35): Outputs of job mix for max gradation with 6.5% Bitumen Content.
Volume (cm3)
Stability Correction
Factor
corrected stability
(kg)
Flow (mm)
Stiffness (kg/mm)
ρA (g/cm3)
ρBit (g/cm3)
Va (%)
Vb (%)
VMA (%)
VFB (%)
520.50 1.00 1957.04 4.72 414.92 2.31 2.39 3.39 14.59 17.98 81.15 519.00 1.00 1894.42 4.73 400.23 2.30 2.39 3.80 14.53 18.33 79.29 514.00 1.00 1821.36 4.66 390.99 2.31 2.39 3.55 14.57 18.12 80.40
Average 1890.94 4.70 402.05 2.31 2.39 3.58 14.56 18.14 80.28
Table (6-36) Conclusion of Job mix for max gradation.
Mix Bit. (%)
corrected stability (kg)
Flow (mm)
Stiffness (kg/mm)
Va (%) VMA (%) Final Result
Max 4.5 766.07 No 3.41 Yes 225.88 No 14.7 No 24.09 Yes Rejected
Max 5.0 957.26 No 4.17 No 229.68 No 15.1 No 25.49 Yes Rejected
Max 5.5 1034.85 Yes 3.55 Yes 296.49 No 12.8 No 24.23 Yes Rejected
Max 6.0 2011.62 Yes 4.44 No 453.68 Yes 5.92 yes 19.36 Yes Rejected
Max 6.5 1890.94 Yes 4.7 No 402.05 Yes 3.58 yes 18.14 Yes Rejected
Remarks:
The Max. mixes with bitumen content from 4.5 - 6.5% are rejected because they
are not suitable in the last selected of mechanical properties (Table 4-26)..
Conclusion:
From the previous remarks it is concluded that Mid1 mix curve to Mid2 mix curve with
bitumen content from 4.5 – 5.50 % was suitable, and Mid3 mix curve with bitumen
content 5.50% was suitable (see Table 6-37) and it was noted from Figure (6-7) the
range between mid1 to mid2 is narrow., then this range don’t take as specification.
A new gradation (Mid4) will be added in order to check of the range between Mid2
and Mid3.as illustrated in Table ( 6-38 ) and Figure (6-7 ).
Page 94
Chapter Six Preparation and Testing of Asphalt Mixes
77
Table (6-37): Conclusion of all Job mixes.
Mix Bitumen content (%)
4.5 5.0 5.5 6.0 6.5
Min. Rejected Rejected Rejected Rejected Rejected
Mid1 Accepted Accepted Accepted Rejected Rejected
Mid2 Accepted Accepted Accepted Rejected Rejected
Mid3 Rejected Rejected Accepted Rejected Rejected
Max Rejected Rejected Rejected Rejected Rejected
Table (6-38): Gradation of all curve mixes.
Diameter Min
(Mix) Mid1 (Mix)
Mid2 (Mix)
Mid4 (Mix)
Mid3 (Mix)
Max (Mix)
25 100 100 100 100 100 100 19 99 99 100 100 100 100
12.5 65 73 86 86 92 99 9.5 54 65 78 80 85 96 4.75 27 42 53 59 64 80 2.26 18 31 39 44 49 63 1.18 15 25 30 35 38 50 0.6 13 21 25 28 32 42
0.425 11 18 22 25 28 37 0.3 10 16 19 22 24 31 0.15 7 11 14 16 17 21
0.075 6 10 12 14 14 18
Page 95
Chapter Six Preparation and Testing of Asphalt Mixes
78
0102030405060708090
100
0.01 0.1 1 10 100Diameter size (mm)
Pass
ing
%
min.mid1mid2mid4mid3max
Figure (6-7 ): Gradation of all curve mixes.
6-3-6 Mid4 curve mix: The following Tables from (6-39) to (6-43) shows aggregate ratio, gradation curve, job
mix with bitumen content 4.5% to 5.5% and conclusion.
Table (6-39): Aggregate ratio in Mid4 mix.
Asphalt mixture Sand F2
(%) Filler F1
(%) Agg. M3
(%) Agg. M2
(%) Agg. M1
(%) Bitumen
(%) 4.00 52.00 19.00 13.00 12.00 4.50 4.00 52.00 19.00 13.00 12.00 5.00
4.00 52.00 19.00 13.00 12.00 5.50
Table (6-40): Outputs of job mix for mid4 gradation with 4.5% Bitumen Content.
Volume (cm3)
Stability Correction
Factor
corrected stability
(kg)
Flow (mm)
Stiffness (kg/mm)
ρA (g/cm3)
ρBit (g/cm3)
Va (%)
Vb (%)
VMA (%)
VFB (%)
517.70 1.00 3008.55 3.33 902.56 2.31 2.46 5.87 10.11 15.98 63.26 515.00 1.00 2677.18 4.21 636.16 2.31 2.46 5.79 10.12 15.91 63.61 514.10 1.00 2721.54 4.23 644.15 2.31 2.46 5.91 10.11 16.01 63.10
Average 2802.42 3.92 727.63 2.31 2.46 5.86 10.11 15.97 63.32
Page 96
Chapter Six Preparation and Testing of Asphalt Mixes
79
Table (6-41): Outputs of job mix for max gradation with 5.0% Bitumen Content.
Volume (cm3)
Stability Correction
Factor
corrected stability
(kg)
Flow (mm)
Stiffness (kg/mm)
ρA (g/cm3)
ρBit (g/cm3)
Va (%)
Vb (%)
VMA (%)
VFB (%)
507.30 1.04 2111.30 4.02 525.64 2.33 2.46 5.39 11.32 16.71 67.72 511.20 1.00 2142.29 3.63 589.62 2.33 2.46 5.24 11.34 16.58 68.37 509.00 1.00 2144.90 3.97 540.73 2.35 2.46 4.61 11.41 16.02 71.23
Average 2132.83 3.87 552.00 2.34 2.46 5.08 11.35 16.44 69.11
Table (6-42): Outputs of job mix for max gradation with 5.5% Bitumen Content.
Volume (cm3)
Stability Correction
Factor
corrected stability
(kg)
Flow (mm)
Stiffness (kg/mm)
ρA (g/cm3)
ρBit (g/cm3)
Va (%)
Vb (%)
VMA (%)
VFB (%)
450.90 1.25 1895.11 3.71 511.04 2.33 2.45 4.81 12.46 17.27 72.16 516.30 1.00 1594.36 3.40 468.93 2.33 2.45 4.91 12.45 17.36 71.72 516.70 1.00 1667.42 4.13 403.41 2.32 2.45 5.32 12.40 17.71 69.99
Average 1718.96 3.75 461.13 2.33 2.45 5.01 12.44 17.45 71.29
Table (6-43): Conclusion of Job mix for Mid4 gradation.
Mix Bit. (%)
corrected stability (kg)
Flow (mm)
Stiffness (kg/mm)
Va (%) VMA (%) Final Result
Mid4 4.5 2802.42 Yes 3.92 Yes 727.63 Yes 5.86 Yes 15.97 Yes Accepted
Mid4 5.0 2132.83 Yes 3.87 Yes 552 Yes 5.08 Yes 16.44 Yes Accepted
Mid4 5.5 1718.96 Yes 3.75 Yes 461.13 Yes 5.01 Yes 17.45 Yes Accepted
Remarks:
• The mixes with bitumen content 4.5% to 5.5% in Mid4 curve are suitable ,
because it is suitable in the last selected of mechanical properties (Table 4-26).
6-4 Proposal Specification of Asphalt Wearing Course:
The following Tables (6-44) and Figure (6-8) shows the gradation of the mix which
achieve the mechanical properties and mechanical properties of asphalt wearing course.
Page 97
Chapter Six Preparation and Testing of Asphalt Mixes
80
Table (6-44): Gradation of mid1 and mid3
Diameter size
(mm) Lower level
(Mid1) Upper level
(Mid3 ) 19 100 100
12.5 73 92 9.5 65 85
4.75 42 64 2.26 31 49 1.18 25 38 0.6 21 32
0.425 18 28 0.3 16 24
0.15 11 17 0.075 10 14
0102030405060708090
100
0.01 0.1 1 10 100Diameter size (mm)
Pass
ing
%
min (Mid1)max (Mid3)
Figure (6-8): Gradation of mid1 and mid3
The following Tables (6-45) and Figure (6-9) shows the fitting gradation of the mix
curve of asphalt wearing course.
Page 98
Chapter Six Preparation and Testing of Asphalt Mixes
81
Table (6-45): Gradation of the fitting curves mid1 and mid3 (Proposed Specification)
Diameter size (mm)
Lower level (Mid1)
Upper level (Mid3 )
19 90 100 12.5 73 92 9.5 63 85
4.75 42 64 2.26 31 49 1.18 25 38 0.6 19 30
0.425 17 27 0.3 15 24
0.15 11 17 0.075 10 13
0102030405060708090
100
0.01 0.1 1 10 100Diameter size (mm)
Pass
ing
%
min (Mid1)max (Mid2)
Figure (6-9): Gradation of the fitting curves mid1 and mid3 (Proposed Specification)
Remarks:
1. The Min curve is rejected because it did not achieve the selected mechanical
properties with all the bitumen content.
2. The Mid1 curve is accepted with bitumen content from 4.5 – 5.5% because it
achieved the selected mechanical properties, but at bitumen content from
6.0% to 6.5% was rejected, because the air voids are lower than 3.0%.
Page 99
Chapter Six Preparation and Testing of Asphalt Mixes
82
3. The Mid2 curve is accepted with bitumen content from 4.5 – 5.5% because it
achieved the selected mechanical properties, but at bitumen content from
6.0% to 6.5% was rejected, because the value of the flow is high which
makes the stiffness low and the air voids are lower than 3.0%.
4. The Mid3 curve is accepted with bitumen content 5.5% because it achieved
the selected mechanical properties. but at bitumen content from 4.50, 5.0 ,6.0
and 6.5% was rejected, because the value of the flow is high which makes
the stiffness low and the air voids is higher than 6.0%.
5. The Max curve is rejected with bitumen content 4.5% to 6.5 because it did
not achieve the selected mechanical properties.
6. The experimental Mid4 curve which was supposed between Mid2
and Mid3 is acceptable with 4.5% and 5.5% bitumen content.
7. The best asphalt mix for the asphalt wearing course is which has Mid1 curve
as a minimum gradation and Mid4 curve as a maximum gradation with
bitumen content 4.5% to 5.50%. The gradation of the proposed specification
for the asphalt wearing course in Palestine was illustrated in Figure (6-9)
and Table (6-45) and the mechanical properties as shown in Table (6-46)
Table (6-46): Mechanical Properties of asphalt wearing course and bitumen content
Stability (kg) 1000
Flow (mm) 2 – 4
Stiffness (kg/mm) Min 400
Air Void Va (%) 3 – 6
Void in Mineral Aggregate VMA (%) Min 14
Void filled in bitumen VFB (%) 60-85
Bitumen content (%) 4.5 -5.5
6-5 Comparison between the Proposed Specifications and the most popular
requirements “MoG Requirements”:
The following Table (6-47), Table (6-48) and Figure (6-10) shows the gradation and
mechanical properties of the proposed specification and the MoG requirements of
asphalt wearing course.
Page 100
Chapter Six Preparation and Testing of Asphalt Mixes
83
Table (6-47): Gradation of the proposed specifications and MoG Requirements
Diameter MoG Requirements Proposed Gradation mm Lower Level Upper Level Lower Level Upper Level 19 100 100 90 100
12.5 100 100 73 92 9.5 70 100 63 85
4.75 50 70 42 64 2.26 35 55 31 49 1.18 25 42 25 38 0.6 18 33 19 30
0.425 15 30 17 27 0.3 12 25 15 24
0.15 8 17 11 17 0.075 4 9 10 13
0102030405060708090
100
0.01 0.1 1 10 100Diameter size (mm)
Pass
ing
%
min (Proposed)max (Proposed)min (MoG)max (MoG)
Figure (6-10) Gradation of MoG and the Proposed Specification
From Figure (6-10), it is clear that:
1. The percentage of passing aggregate in the fine portion in the proposed
specification is less than the MoG Requirements.
2. The proposed specification is coarser than the MoG requirement.
Page 101
Chapter Six Preparation and Testing of Asphalt Mixes
84
Table (6-48): Mechanical properties of the proposed specifications and MoG
Requirements Properties Proposed
Specification
MoG
Requirements
Stability (kg) 1000 > 900
Flow (mm) 2 – 4 2- 4
Stiffness (kg/mm) Min 400 Min 400
Air Void Va (%) 3 – 6 3 – 7
Void in Mineral Aggregate VMA (%) Min 14 14.5
Void filled in bitumen VFB (%) 60-85 60-75
Bitumen content (%) 4.5 -5.5 At least 5.5%
From Table (6-48), it is clear that:
The most values are similar, but the main different in the bitumen content. The bitumen
content play an essential role in the cost of asphalt mixes.
Then the proposed specification gave a good result from the economical side more than
the MoG requirements..
Page 102
Chapter Seven Conclusions and Recommendations
85
Chapter Seven
Conclusions and Recommendations 7-1 Introduction:
The Palestinians need to develop their own specification for the roads which suits the
local materials of the aggregate and bitumen. The developed specification provided the
roads stakeholders with a unified and suitable specification for the asphalt wearing
course in Palestine.
7-2 Description of Developed Specification:
The proposed specification for the asphalt wearing course has been developed to help
the implementing agencies, the engineers, the asphalt factories, the engineering
consultant offices and the contractors to overcome the obstacles which are caused by the
lack of a Palestinian specification for the asphalt wearing course. The developed
specification includes the following:
1. The Minimum and Maximum percentage of passing aggregate with bitumen content
from 4.5% to 5.5% as illustrated in Table (6-45) and Figure (6-9).
2. The selected mechanical properties were selected after studying the eleven
specifications. The mix is workable, able to be compacted, flexible and has a high
resistance. The achieved mechanical properties by the proposed gradation as
illustrated in Table (6-46)
7-3 Conclusions:
1. The proposed specification gave a good result from the economical side, because the
amount of bitumen used is from 4.5% to 5.5% , on the other hand, all the roads
stakeholders especially Municipality of Gaza uses at least 5.5 % of bitumen
2. There is a large difference between the all specifications in the gradation ranges and
mechanical properties values, because the material in each country and climate are
different.
3. The stability value (1000kg) is approved easy, but flow, stiffness and air voids are
difficult to be approved.
4. The mechanical properties of hot mix asphalt (HMA) is various with amount of
bitumen content and gradation of aggregates.
Page 103
Chapter Seven Conclusions and Recommendations
86
5. The developed approach will solve the problem and decrease the mistakes which are
caused by the differences of the specifications from project to project. This
difference pushes the asphalt factories to change the specification of the asphalt
mixes several times a day to cover the supervision requirements.
7-4 Recommendations:
1. It is recommended to unify the specification of the asphalt wearing course.
2. Further researches are recommended to investigate the mechanical properties
and their impact on the asphalt mix. A research for every mechanical property is
recommended.
3. It is recommended to conduct researches to measure the effect of the bitumen
types on the asphalt mix.
4. Further research is recommended to develop specification for base and sub-base
layers.
5. It is recommended to apply the developed specifications by all the road
stakeholders and the adaptation of the developed specification will give it
opportunity to be improved.
Page 104
References
87
References: 1. AASHTO T27, American Association State Highway and Transportation Official,
Standards Specifications of Fine and Coarse Aggregate.
2. AASHTO T11, American Association of State Highway and Transportation
Official, Standards Specifications of Fine and Coarse Aggregate
3. ASTM, (2002). Annual Book. D692-00 Standards Specification for Coarse
aggregate of Bituminous Paving.
4. ASTM, (2002). Annual Book. D1073-01 Standards Specification for Fine
aggregate of Bituminous Paving Mixtures.
5. ASTM, (2002). Annual Book. D5-97 Test Method of Penetration of Bituminous
Materials.
6. ASTM, (2002). Annual Book. D113-99 Test Method of Ductility of Bituminous
Materials.
7. ASTM, (2002). Annual Book. D70 Test Method of Theoretical Maximum
Specific Gravity and Density Bituminous Paving Mixtures.
8. ASTM, (2002). Annual Book. D5581-96 (2000). Test Method for Resistance to
Plastic Flow of Bituminous Mixtures Using Marshall Apparatus.
9. ASTM, (2002). Annual Book. D36 Softening Point of Bitumen.
10. ASTM, (2002). Annual Book. C136-96a Sieve Analysis of Fine and Coarse
Aggregates.
11. ASTM, (2002). Annual Book. C127 Absorption and Specific Gravity of Fine and
Coarse Aggregates.
12. ASTM, (2002). Annual Book. C566-96a Moisture Content of Fine and Coarse
Aggregates.
13. ASTM, (2002). Annual Book. C131 Loss Angelus Test (Abrasion Test) of Coarse
Aggregates.
14. BS 594, (1992). British Standards. Hot Rolled Asphalt for Roads and Other
Paved, Areas. Part1. Specification for constituent Materials and Asphalt
Mixtures, Second Edition.
15. Fred L. M., Walter P.K., (1990) Highway Engineering and Traffic Analysis, John
Wiley & Sons, New York.
16. Hwaies, N. & Rasool H., (1985). Paving Asphalt Engineering Book. Iraq.
Page 105
References
88
17. Jendia, (2000). The Roads Engineering – The Structural Design. Islamic
University of Gaza, Palestine.
18. MOH, (1998) Egyptian Specifications Road Materials and Testing Volume(VI)
19. MOPWH, (1991). Ministry of Public Works and Housing. Specifications for
Highway and Bridge Construction. Volume (II). Jordan.
20. MoG, (2003). General Specifications, Special Specifications and Technical
Specifications. Projects Preparation Department, Municipality of Gaza, Gaza.
21. MoPWH, (1995). The Palestinian Ministry of Public Work and Housing.
Palestine.
22. O'Flaherty CA, (1991), Highway Engineering, Vol.1,3rd Edition, London.
23. Pecdar, People Under sege (April 2002), Palestainian Economic Losses.
24. PECDAR, (2003). Technical Specifications for Projects, Palestinian Economic
Council for Development and Reconstruction, Palestine.
25. PS 171 , (1998). Hot Asphalt Mixture Composition, Production, Transport,
Laying and Compaction. Palestinian Standards Institutes, Palestine.
26. Rao G.V., (1996). Transportation and Highway Engineering. Tata MacGraw –
Hill Publishing Company Limited, New Delhi.
27. .Salter R.J, (1993) Highway Design and Construction, 2nd Edition, Macamilan.
28. Singh G. , Singh J. (2001). Highway Engineering. N.C. Jain, Standard Publishers
Distributors, Delhi
29. Sood V. K., (1995 December 11-14) Emerging Trends in Materials and Design of
Bituminous Pavement System – An Overview, in Proceedings International
Conference on New Horizons in Roads and Road Transport, Vol. 1, ICORT-95.
30. UNRWA, (2003). Road & Infrastructure Specifications. United Nations Relief
and Work Agency for Palestine Refugees in the Near east.
31. http://www.apao.org/ education. htm, (6/1/2004)
32. http://www.engr.uconn.edu/garrick/notess222.htm (17/1/2004)
33. http://washington.edu (25/2/2004)
Page 107
Appendix (A) Mathematical Trial Method to Merge Aggregate Mixes
0- A
Page 108
Appendix (A) Mathematical Trial Method to Merge Aggregate Mixes
1- A
Min. Mixture
Aggregate
Grain size (mm)
Ratio of Available
Mixture < 0.075 0.075/0.15 0.15/0.30 0.30/0.425 0.425/0.6 0.6/1.18 1.18/2 2/4.75 4.75/9.5 9.5/12.5 12.5/19 19/25 aggregates Filler 23.77 4.55 7.84 3.29 4.68 11.76 18.08 20.35 4.17 1.52 0.00 0.00 0.17
4.04 0.77 1.33 0.56 0.80 2.00 3.07 3.46 0.71 0.26 0.00 0.00 Natural Sand 2.00 0.80 44.93 35.60 16.27 0.40 0.00 0.00 0.00 0.00 0.00 0.00 0.03
0.06 0.02 1.35 1.07 0.49 0.01 0.00 0.00 0.00 0.00 0.00 0.00 Coarse Agg. 3.85 0.31 0.15 0.15 0.15 0.31 2.00 18.77 73.02 1.29 0.00 0.00 0.25
M3 0.96 0.08 0.04 0.04 0.04 0.08 0.50 4.69 18.26 0.32 0.00 0.00 Coarse Agg. 2.24 0.06 0.09 0.03 0.03 0.15 0.15 1.99 34.82 38.16 21.29 0.98 0.22
M2 0.49 0.01 0.02 0.01 0.01 0.03 0.03 0.44 7.66 8.40 4.68 0.22 Coarse Agg. 1.52 0.04 0.02 0.02 0.02 0.04 0.04 0.04 1.33 4.92 89.67 2.34 0.33
M1 0.50 0.01 0.01 0.01 0.01 0.01 0.01 0.01 0.44 1.62 29.59 0.77
Summation 6.1 0.9 2.7 1.7 1.3 2.1 3.6 8.6 27.1 10.6 34.3 1.0 100.0 Gradation
curve 6.1 7.0 9.7 11.4 12.7 14.9 18.5 27.1 54.1 64.7 99.0 100.0 Required
curve 2.00 3.00 5.00 6.00 8.00 13.00 22.00 32.00 49.00 60.00 90.00 100.00
Page 109
Appendix (A) Mathematical Trial Method to Merge Aggregate Mixes
2- A
Mid1 Mixture
Aggregate
Grain size (mm)
Ratio of Available
Mixture < 0.075 0.075/0.15 0.15/0.30 0.30/0.425 0.425/0.6 0.6/1.18 1.18/2 2/4.75 4.75/9.5 9.5/12.5 12.5/19 19/25 aggregates Filler 23.77 4.55 7.84 3.29 4.68 11.76 18.08 20.35 4.17 1.52 0.00 0.00 0.34
8.08 1.55 2.67 1.12 1.59 4.00 6.15 6.92 1.42 0.52 0.00 0.00 Natural Sand 2.00 0.80 44.93 35.60 16.27 0.40 0.00 0.00 0.00 0.00 0.00 0.00 0.04
0.08 0.03 1.80 1.42 0.65 0.02 0.00 0.00 0.00 0.00 0.00 0.00 Coarse Agg. 3.85 0.31 0.15 0.15 0.15 0.31 2.00 18.77 73.02 1.29 0.00 0.00 0.20
M3 0.77 0.06 0.03 0.03 0.03 0.06 0.40 3.75 14.60 0.26 0.00 0.00 Coarse Agg. 2.24 0.06 0.09 0.03 0.03 0.15 0.15 1.99 34.82 38.16 21.29 0.98 0.17
M2 0.38 0.01 0.02 0.01 0.01 0.03 0.03 0.34 5.92 6.49 3.62 0.17 Coarse Agg. 1.52 0.04 0.02 0.02 0.02 0.04 0.04 0.04 1.33 4.92 89.67 2.34 0.25
M1 0.38 0.01 0.01 0.01 0.01 0.01 0.01 0.01 0.33 1.23 22.42 0.59
Summation 9.7 1.7 4.5 2.6 2.3 4.1 6.6 11.0 22.3 8.5 26.0 0.8 100.0 Gradation
curve 9.7 11.4 15.9 18.4 20.7 24.8 31.4 42.4 64.7 73.2 99.3 100.0 Required
curve 4.50 7.75 12.00 14.00 16.50 23.25 33.25 44.00 61.75 70.00 92.50 100.00
Page 110
Appendix (A) Mathematical Trial Method to Merge Aggregate Mixes
3- A
Mid2 Mixture
Aggregate
Grain size (mm)
Ratio of Available
Mixture < 0.075 0.075/0.15 0.15/0.30 0.30/0.425 0.425/0.6 0.6/1.18 1.18/2 2/4.75 4.75/9.5 9.5/12.5 12.5/19 19/25 aggregates Filler 23.77 4.55 7.84 3.29 4.68 11.76 18.08 20.35 4.17 1.52 0.00 0.00 0.44
10.46 2.00 3.45 1.45 2.06 5.17 7.96 8.95 1.83 0.67 0.00 0.00 Natural Sand 2.00 0.80 44.93 35.60 16.27 0.40 0.00 0.00 0.00 0.00 0.00 0.00 0.04
0.08 0.03 1.80 1.42 0.65 0.02 0.00 0.00 0.00 0.00 0.00 0.00 Coarse Agg. 3.85 0.31 0.15 0.15 0.15 0.31 2.00 18.77 73.02 1.29 0.00 0.00 0.25
M3 0.96 0.08 0.04 0.04 0.04 0.08 0.50 4.69 18.26 0.32 0.00 0.00 Coarse Agg. 2.24 0.06 0.09 0.03 0.03 0.15 0.15 1.99 34.82 38.16 21.29 0.98 0.15
M2 0.34 0.01 0.01 0.00 0.00 0.02 0.02 0.30 5.22 5.72 3.19 0.15 Coarse Agg. 1.52 0.04 0.02 0.02 0.02 0.04 0.04 0.04 1.33 4.92 89.67 2.34 0.12
M1 0.18 0.00 0.00 0.00 0.00 0.00 0.00 0.00 0.16 0.59 10.76 0.28
Summation 12.0 2.1 5.3 2.9 2.8 5.3 8.5 13.9 25.5 7.3 14.0 0.4 100.0 Gradation
curve 12.0 14.1 19.4 22.4 25.1 30.4 38.9 52.8 78.3 85.6 99.6 100.0 Required
curve 7.00 12.50 19.00 22.00 25.00 33.50 44.50 56.00 74.50 80.00 95.00 100.00
Page 111
Appendix (A) Mathematical Trial Method to Merge Aggregate Mixes
4- A
Mid3 Mixture
Aggregate
Grain size (mm)
Ratio of Available
Mixture < 0.075 0.075/0.15 0.15/0.30 0.30/0.425 0.425/0.6 0.6/1.18 1.18/2 2/4.75 4.75/9.5 9.5/12.5 12.5/19 19/25 aggregates Filler 23.77 4.55 7.84 3.29 4.68 11.76 18.08 20.35 4.17 1.52 0.00 0.00 0.55
13.07 2.50 4.31 1.81 2.57 6.47 9.94 11.19 2.29 0.84 0.00 0.00 Natural Sand 2.00 0.80 44.93 35.60 16.27 0.40 0.00 0.00 0.00 0.00 0.00 0.00 0.06
0.12 0.05 2.70 2.14 0.98 0.02 0.00 0.00 0.00 0.00 0.00 0.00 Coarse Agg. 3.85 0.31 0.15 0.15 0.15 0.31 2.00 18.77 73.02 1.29 0.00 0.00 0.20
M3 0.77 0.06 0.03 0.03 0.03 0.06 0.40 3.75 14.60 0.26 0.00 0.00 Coarse Agg. 2.24 0.06 0.09 0.03 0.03 0.15 0.15 1.99 34.82 38.16 21.29 0.98 0.13
M2 0.29 0.01 0.01 0.00 0.00 0.02 0.02 0.26 4.53 4.96 2.77 0.13 Coarse Agg. 1.52 0.04 0.02 0.02 0.02 0.04 0.04 0.04 1.33 4.92 89.67 2.34 0.06
M1 0.09 0.00 0.00 0.00 0.00 0.00 0.00 0.00 0.08 0.30 5.38 0.14
Summation 14.3 2.6 7.1 4.0 3.6 6.6 10.4 15.2 21.5 6.4 8.1 0.3 100.0 Gradation
curve 14.3 17.0 24.0 28.0 31.6 38.2 48.5 63.7 85.2 91.6 99.7 100.0 Required
curve 9.50 17.25 26.00 30.00 33.50 43.75 55.75 68.00 87.25 90.00 97.50 100.00
Page 112
Appendix (A) Mathematical Trial Method to Merge Aggregate Mixes
5- A
Mid 4 Mixture
Aggregate
Grain size (mm)
Ratio of Available
Mixture < 0.075 0.075/0.15 0.15/0.30 0.30/0.425 0.425/0.6 0.6/1.18 1.18/2 2/4.75 4.75/9.5 9.5/12.5 12.5/19 19/25 aggregates Filler 23.77 4.55 7.84 3.29 4.68 11.76 18.08 20.35 4.17 1.52 0.00 0.00 0.52
12.36 2.37 4.08 1.71 2.43 6.12 9.40 10.58 2.17 0.79 0.00 0.00 Natural Sand 2.00 0.80 44.93 35.60 16.27 0.40 0.00 0.00 0.00 0.00 0.00 0.00 0.04
0.08 0.03 1.80 1.42 0.65 0.02 0.00 0.00 0.00 0.00 0.00 0.00 Coarse Agg. 3.85 0.31 0.15 0.15 0.15 0.31 2.00 18.77 73.02 1.29 0.00 0.00 0.19
M3 0.73 0.06 0.03 0.03 0.03 0.06 0.38 3.57 13.87 0.25 0.00 0.00 Coarse Agg. 2.24 0.06 0.09 0.03 0.03 0.15 0.15 1.99 34.82 38.16 21.29 0.98 0.13
M2 0.29 0.01 0.01 0.00 0.00 0.02 0.02 0.26 4.53 4.96 2.77 0.13 Coarse Agg. 1.52 0.04 0.02 0.02 0.02 0.04 0.04 0.04 1.33 4.92 89.67 2.34 0.12
M1 0.18 0.00 0.00 0.00 0.00 0.00 0.00 0.00 0.16 0.59 10.76 0.28
Summation 13.6 2.5 5.9 3.2 3.1 6.2 9.8 14.4 20.7 6.6 13.5 0.4 100.0 Gradation
curve 13.60 16.10 22.00 25.20 28.30 34.50 44.30 58.75 79.50 86.07 99.60 100.00 Required
curve 13.60 16.10 22.00 25.20 28.30 34.50 44.30 58.75 79.48 86.07 99.60 100.00
Page 113
Appendix (A) Mathematical Trial Method to Merge Aggregate Mixes
6- A
Max. Mixture
Aggregate Grain size (mm) Ratio of Available
Mixture < 0.075 0.075/0.15 0.15/0.30 0.30/0.425 0.425/0.6 0.6/1.18 1.18/2 2/4.75 4.75/9.5 9.5/12.5 12.5/19 19/25 aggregates Filler 23.77 4.55 7.84 3.29 4.68 11.76 18.08 20.35 4.17 1.52 0.00 0.00 0.70
16.64 3.19 5.49 2.30 3.28 8.23 12.66 14.25 2.92 1.06 0.00 0.00 Natural Sand 2.00 0.80 44.93 35.60 16.27 0.40 0.00 0.00 0.00 0.00 0.00 0.00 0.10
0.20 0.08 4.49 3.56 1.63 0.04 0.00 0.00 0.00 0.00 0.00 0.00 Coarse Agg. 3.85 0.31 0.15 0.15 0.15 0.31 2.00 18.77 73.02 1.29 0.00 0.00 0.15
M3 0.58 0.05 0.02 0.02 0.02 0.05 0.30 2.82 10.95 0.19 0.00 0.00 Coarse Agg. 2.24 0.06 0.09 0.03 0.03 0.15 0.15 1.99 34.82 38.16 21.29 0.98 0.05
M2 0.11 0.00 0.00 0.00 0.00 0.01 0.01 0.10 1.74 1.91 1.06 0.05 Coarse Agg. 1.52 0.04 0.02 0.02 0.02 0.04 0.04 0.04 1.33 4.92 89.67 2.34 0.00
M1 0.00 0.00 0.00 0.00 0.00 0.00 0.00 0.00 0.00 0.00 0.00 0.00
Summation 17.5 3.3 10.0 5.9 4.9 8.3 13.0 17.2 15.6 3.2 1.1 0.0 100.0 Gradation
curve 17.5 20.8 30.9 36.7 41.7 50.0 63.0 80.1 95.7 98.9 100.0 100.0 Required
curve 12.00 22.00 33.00 38.00 42.00 54.00 67.00 80.00 100.00 100.00 100.00 100.00
Page 114
Appendix (B) Inputs Data of Job Mixes
B - 0
Page 115
Appendix (B) Inputs Data of Job Mixes
B - 1
Input data of min. gradation for job mix with different bitumen content
determination of mix
density Sample No. 2
Wt in air (g)
Wt in Water
(g)
Wt SSD (g)
Stability Reading
Flow Reading
Wt of pych.+ water
1520.00
Bit Content 1 1199.00 684.50 1216.50 350.00 4.80 Wt of sample 500.00
4.50% 2 1207.50 692.00 1227.50 360.00 6.70
Wt of sample+
Pych. +water 1813.50
Spe
cim
en N
o.
3 1339.50 769.00 1358.50 310.00 6.10 ρbit (g/cm3) 2.42
determination of mix
density Sample No. 1
Wt in air (g)
Wt in Water
(g)
Wt SSD (g)
Stability Reading
Flow Reading
Wt of pych.+ water
1520.00
Bit Content 1 1218.50 693.00 1225.50 495.00 4.13 Wt of sample 500.00
5.00% 2 1187.50 676.00 1197.00 480.00 4.80
Wt of sample+
Pych. +water 1815.00
Spe
cim
en N
o.
3 1175.00 670.00 1181.00 490.00 5.00 ρbit (g/cm3) 2.44
determination of mix
density Sample No. 3
Wt in air (g)
Wt in Water
(g)
Wt SSD (g)
Stability Reading
Flow Reading
Wt of pych.+ water
1520.00
Bit Content 1 1196.00 677.00 1210.00 400.00 5.70 Wt of sample 500.00
5.50% 2 1180.50 665.00 1190.50 320.00 5.80
Wt of sample+
Pych. +water 1815.00
Spe
cim
en N
o.
3 1196.00 675.00 1203.50 330.00 4.70 ρbit 2.44
determination of mix
density Sample No. 4
Wt in air (g)
Wt in Water
(g)
Wt SSD (g)
Stability Reading
Flow Reading
Wt of pych.+ water
1520.00
Bit Content 1 1196.00 676.50 1204.00 415.00 4.40 Wt of sample 500.00
6.00% 2 1132.50 641.00 1159.00 415.00 4.40
Wt of sample+
Pych. +water 1812.50
Spe
cim
en N
o.
3 1207.00 678.50 1211.50 430.00 3.90 ρbit (g/cm3) 2.41
Page 116
Appendix (B) Inputs Data of Job Mixes
B - 2
determination of mix
density Sample No. 5
Wt in air (g)
Wt in Water
(g)
Wt SSD (g)
Stability Reading
Flow Reading
Wt of pych.+ water
1520.00
Bit Content 1 1162.00 683.00 1215.00 435.00 4.80 Wt of sample 500.00
6.50% 2 1186.00 666.00 1197.50 395.00 3.30
Wt of sample+
Pych. +water 1809.00
Spe
cim
en N
o.
3 1209.00 660.50 1174.50 413.00 3.15 ρbit (g/cm3) 2.37
Input data of mid1 gradation for job mix with different bitumen content
determination of mix
density Sample No.
Wt in air (g)
Wt in Water
(g)
Wt SSD (g)
Stability Reading
Flow Reading
Wt of pych.+ water
1653.40
Bit Content 1 1191.70 687.70 1195.00 946.66 3.72 Wt of sample 788.40
4.50% 2 1201.00 689.80 1205.10 1064.71 3.60
Wt of sample+
Pych. +water 2119.30
Spe
cim
en N
o.
3 1187.60 684.60 1194.30 901.05 3.48 ρbit (g/cm3) 2.44
determination of mix
density Sample No.
Wt in air (g)
Wt in Water
(g)
Wt SSD (g)
Stability Reading
Flow Reading
Wt of pych.+ water
1653.80
Bit Content 1 1206.40 695.40 1214.50 984.22 3.48 Wt of sample 681.00
5.00% 2 1197.30 682.60 1202.50 860.81 3.12
Wt of sample+
Pych. +water 2055.00
Spec
imen
No.
3 1187.80 677.10 1195.60 989.59 3.72 ρbit (g/cm3) 2.43
determination of mix
density Sample No.
Wt in air (g)
Wt in Water
(g)
Wt SSD (g)
Stability Reading
Flow Reading
Wt of pych.+ water
1652.30
Bit Content 1 1202.30 693.00 1204.80 667.65 3.36 Wt of sample 774.30
5.50% 2 1200.60 690.00 1203.40 689.11 3.60
Wt of sample+
Pych. +water 2107.50
Spe
cim
en N
o.
3 1204.20 694.00 1207.60 726.67 3.72 ρbit (g/cm3) 2.43
Page 117
Appendix (B) Inputs Data of Job Mixes
B - 3
determination of mix
density Sample No.
Wt in air (g)
Wt in Water
(g)
Wt SSD (g)
Stability Reading
Flow Reading
Wt of pych.+ water
1653.80
Bit Content 1 1205.60 694.50 1207.00 576.43 4.50 Wt of sample 726.60
6.00% 2 1203.50 693.10 1206.00 565.70 4.50
Wt of sample+
Pych. +water 2080.00
Spe
cim
en N
o.
3 1209.10 697.70 1211.30 560.34 4.50 ρbit (g/cm3) 2.42
determination of mix
density Sample No.
Wt in air (g)
Wt in Water
(g)
Wt SSD (g)
Stability Reading
Flow Reading
Wt of pych.+ water
1652.30
Bit Content 1 1203.00 699.30 1203.80 587.17 4.92 Wt of sample 643.50
6.50% 2 1192.40 689.80 1193.50 597.90 5.04
Wt of sample+
Pych. +water 2029.00
Spe
cim
en N
o.
3 1203.60 696.20 1204.90 689.11 4.56 ρbit (g/cm3) 2.41
Input data of mid2 gradation for job mix with different bitumen content
determination of mix
density Sample No. 14
Wt in air (g)
Wt in Water
(g)
Wt SSD (g)
Stability Reading
Flow Reading
Wt of pych.+ water
1520.00
Bit Content 1 1198.00 689.00 1200.50 757.00 4.28 Wt of sample 500.00
4.50% 2 1203.00 690.00 1204.50 795.00 4.44 1818.50
Spec
imen
No.
3 1200.50 690.50 1207.50 890.00 4.15 ρbit (g/cm3) 2.48
determination of mix
density Sample
No. 15
Wt in air (g)
Wt in Water
(g)
Wt SSD (g)
Stability Reading
Flow Reading
Wt of pych.+ water
1520.00
Bit Content 1 1202.00 693.00 1210.50 671.00 4.53 Wt of sample 500.00
5.00% 2 1205.50 696.00 1210.50 680.00 4.06
Wt of sample+
Pych. +water 1818.00
Spe
cim
en N
o.
3 1200.50 696.50 1208.50 692.00 4.40 ρbit (g/cm3) 2.48
Page 118
Appendix (B) Inputs Data of Job Mixes
B - 4
determination of mix
density Sample
No. 19
Wt in air (g)
Wt in Water
(g)
Wt SSD (g)
Stability Reading
Flow Reading
Wt of pych.+ water
1520.00
Bit Content 1 1207.00 696.00 1210.00 684.00 4.50 Wt of sample 500.00
5.50% 2 1208.50 697.50 1210.00 710.00 4.43
Wt of sample+
Pych. +water 1814.00
Spe
cim
en N
o.
3 1196.50 690.00 1198.00 695.00 4.50 ρbit (g/cm3) 2.43
determination of mix
density Sample
No. 13
Wt in air (g)
Wt in Water
(g)
Wt SSD (g)
Stability Reading
Flow Reading
Wt of pych.+ water
1520.00
Bit Content 1 1202.00 691.50 1205.50 430.00 5.96 Wt of sample 500.00
6.00% 2 1203.00 694.50 1204.50 518.00 6.50
Wt of sample+
Pych. +water 1810.00
Spe
cim
en N
o.
3 1209.00 698.00 1211.50 506.00 5.66 ρbit (g/cm3) 2.38
determination of mix
density Sample
No. 12
Wt in air (g)
Wt in Water
(g)
Wt SSD (g)
Stability Reading
Flow Reading
Wt of pych.+ water
1520.00
Bit Content 1 1202.50 689.00 1204.00 513.00 4.94 Wt of sample 500.00
6.50% 2 1218.00 683.00 1224.00 610.00 4.47
Wt of sample+
Pych. +water 1810.50
Spec
imen
No.
3 1214.50 699.50 1216.50 462.00 6.31 ρbit (g/cm3) 2.39
Input data of mid3 gradation for job mix with different bitumen content
determination of mix
density Sample No. 7
Wt in air (g)
Wt in Water
(g)
Wt SSD (g)
Stability Reading
Flow Reading
Wt of pych.+ water
1520.00
Bit Content 1 1184.00 653.50 1189.50 267.00 4.53 Wt of sample 500.00
4.50% 2 1092.50 603.50 1098.50 223.00 4.50
Wt of sample+
Pych. +water 1822.00
Spe
cim
en N
o.
3 1190.00 667.50 1196.00 308.00 5.18 ρbit (g/cm3) 2.53
Page 119
Appendix (B) Inputs Data of Job Mixes
B - 5
determination of mix
density Sample
No. 8
Wt in air (g)
Wt in Water
(g)
Wt SSD (g)
Stability Reading
Flow Reading
Wt of pych.+ water
1520.00
Bit Content 1 1186.50 673.50 1189.50 496.00 4.65 Wt of sample 500.00
5.00% 2 1226.50 694.00 1230.00 520.00 4.50
Wt of sample+
Pych. +water 1825.00
Spec
imen
No.
3 1186.50 673.00 1193.00 463.00 4.09 ρbit (g/cm3) 2.56
determination of mix
density Sample
No. 9
Wt in air (g)
Wt in Water
(g)
Wt SSD (g)
Stability Reading
Flow Reading
Wt of pych.+ water
1520.00
Bit Content 1 1184.00 676.00 1184.50 748.00 5.00 Wt of sample 500.00
5.50% 2 1191.00 682.00 1191.50 645.00 4.78
Wt of sample+
Pych. +water 1817.00
Spe
cim
en N
o.
3 1174.50 672.00 1174.50 763.00 4.43 ρbit (g/cm3) 2.46
determination of mix
density Sample
No. 6
Wt in air (g)
Wt in Water
(g)
Wt SSD (g)
Stability Reading
Flow Reading
Wt of pych.+ water
1520.00
Bit Content 1 1192.50 672.00 1201.00 558.00 4.93 Wt of sample 500.00
6.00% 2 1186.00 663.00 1192.00 552.00 6.00
Wt of sample+
Pych. +water 1815.50
Spe
cim
en N
o.
3 1186.50 664.00 1190.50 535.00 5.70 ρbit (g/cm3) 2.44
determination of mix
density Sample
No. 10
Wt in air (g)
Wt in Water
(g)
Wt SSD (g)
Stability Reading
Flow Reading
Wt of pych.+ water
1520.00
Bit Content 1 1190.50 685.00 1191.00 580.00 5.97 Wt of sample 500.00
6.50% 2 1192.50 687.50 1198.50 567.00 7.43
Wt of sample+
Pych. +water 1815.00
Spec
imen
No.
3 1184.00 684.50 1184.00 585.00 6.31 ρbit (g/cm3) 2.44
Page 120
Appendix (B) Inputs Data of Job Mixes
B - 6
Input data of mid4 gradation for job mix with different bitumen content
determination of mix
density Sample No.
Wt in air (g)
Wt in Water
(g)
Wt SSD (g)
Stability Reading
Flow Reading
Wt of pych.+ water
1524.00
Bit Content 1 1197.30 682.00 1199.70 1150.00 4.00 Wt of sample 500.00
4.50% 2 1192.10 681.70 1196.70 1023.00 5.05
Wt of sample+
Pych. +water 1820.50
Spe
cim
en N
o.
3 1188.50 677.60 1191.70 1040.00 5.07 ρbit (g/cm3) 2.46
determination of mix
density Sample
No.
Wt in air (g)
Wt in Water
(g)
Wt SSD (g)
Stability Reading
Flow Reading
Wt of pych.+ water
1524.00
Bit Content 1 1182.10 677.40 1184.70 775.00 4.82 Wt of sample 500.00
5.00% 2 1193.10 685.20 1196.40 818.00 4.36
Wt of sample+
Pych. +water 1821.00
Spe
cim
en N
o.
3 1195.90 688.40 1197.40 819.00 4.76 ρbit (g/cm3) 2.46
determination of mix
density Sample
No.
Wt in air (g)
Wt in Water
(g)
Wt SSD (g)
Stability Reading
Flow Reading
Wt of pych.+ water
1524.00
Bit Content 1 1052.00 604.50 1055.40 578.00 4.45 Wt of sample 500.00
5.50% 2 1203.30 691.50 1207.80 608.00 4.08
Wt of sample+
Pych. +water 1820.00
Spe
cim
en N
o.
3 1199.10 686.80 1203.50 636.00 4.96 ρbit (g/cm3) 2.45
Input data of max gradation for job mix with different bitumen content
determination of mix
density Sample No. 16
Wt in air (g)
Wt in Water
(g)
Wt SSD (g)
Stability Reading
Flow Reading
Wt of pych.+ water
1520.00
Bit Content 1 1234.50 662.50 1238.00 339.00 4.25 Wt of sample 500.00
4.50% 2 1158.00 626.00 1161.50 298.00 4.20
Wt of sample+
Pych. +water 1822.00
Spe
cim
en N
o.
3 1073.00 580.50 1078.00 293.00 3.81 ρbit (g/cm3) 2.53
Page 121
Appendix (B) Inputs Data of Job Mixes
B - 7
determination of mix
density Sample
No.
Wt in air (g)
Wt in Water
(g)
Wt SSD (g)
Stability Reading
Flow Reading
Wt of pych.+ water
1520.00
Bit Content 1 1199.50 654.00 1203.00 430.00 5.40 Wt of sample 500.00
5.00% 2 1197.50 649.00 1202.00 385.00 4.81
Wt of sample+
Pych. +water 1822.50
Spe
cim
en N
o.
3 1179.00 620.00 1181.00 427.00 4.81 ρbit (g/cm3) 2.53
determination of mix
density Sample
No. 11
Wt in air (g)
Wt in Water
(g)
Wt SSD (g)
Stability Reading
Flow Reading
Wt of pych.+ water
1520.00
Bit Content 1 1169.00 596.00 1171.50 352.00 3.50 Wt of sample 500.00
5.50% 2 1197.50 656.00 1200.50 530.00 5.78
Wt of sample+
Pych. +water 1817.00
Spe
cim
en N
o.
3 1170.50 647.50 1175.50 413.00 3.50 ρbit (g/cm3) 2.46
determination of mix
density Sample
No. 20
Wt in air (g)
Wt in Water
(g)
Wt SSD (g)
Stability Reading
Flow Reading
Wt of pych.+ water
1520.00
Bit Content 1 1223.50 693.00 1225.00 803.00 5.62 Wt of sample 500.00
6.00% 2 1199.50 681.00 1201.00 740.00 4.88
Wt of sample+
Pych. +water 1816.00
Spec
imen
No.
3 1181.00 671.00 1182.00 793.00 5.50 ρbit (g/cm3) 2.45
determination of mix
density Sample
No. 18
Wt in air (g)
Wt in Water
(g)
Wt SSD (g)
Stability Reading
Flow Reading
Wt of pych.+ water
1520.00
Bit Content 1 1203.00 683.50 1204.00 747.00 5.66 Wt of sample 500.00
6.50% 2 1194.50 677.00 1196.00 723.00 5.68
Wt of sample+
Pych. +water 1811.00
Spec
imen
No.
3 1186.00 673.00 1187.00 695.00 5.59 ρbit (g/cm3) 2.39
Page 122
Appendix (C) Mechanical Properties Curves
0C -
Page 123
Appendix (C) Mechanical Properties Curves
1C -
Curves of Mechanical Properties for Min. Mix in Asphalt Wearing Course
AC (%) Stability (kg) AC (%) Flow(mm) 4.5 895.1 4.5 4.89 5.0 1247.65 5.0 3.87 5.5 898.36 5.5 4.5 6.0 1059.68 6.0 3.53 6.5 1045.48 6.5 3.13
AC (%) Stiffness (kg/mm) AC (%) Va (%)
4.5 186.88 4.5 6.65 5.0 324.66 5.0 6.15 5.5 200.61 5.5 7.7 6.0 301.65 6.0 7.07 6.5 344.63 6.5 4.8
800
900
1000
1100
1200
1300
4.0 4.5 5.0 5.5 6.0 6.5 7.0
AC (%)
Stab
ility
(kg)
3
3.5
4
4.5
5
4.0 4.5 5.0 5.5 6.0 6.5 7.0
AC (%)
Flow
(mm
)
100150200250300350400
4.0 4.5 5.0 5.5 6.0 6.5 7.0
AC (%)
Stiff
ness
(kg/
mm
)
4
5
6
7
8
4.0 4.5 5.0 5.5 6.0 6.5 7.0
AC (%)
Va(
%)
Page 124
Appendix (C) Mechanical Properties Curves
2C -
AC (%) VMA (%) AC (%) VFB (%) 4.5 16.53 4.5 59.8 5.0 17.27 5.0 64.4 5.5 19.73 5.5 60.97 6.0 20.12 6.0 65.22 6.5 19.04 6.5 76.59
AC (%) Density (g/cm3) 4.5 2.26 5.0 2.29 5.5 2.25 6.0 2.24 6.5 2.26
2.232.242.252.262.272.282.292.3
4.0 4.5 5.0 5.5 6.0 6.5 7.0
AC (%)
Den
sity
(g/c
m3 )
16
17
18
19
20
21
4.0 4.5 5.0 5.5 6.0 6.5 7.0
AC (%)
VM
A (%
)
55
60
65
70
75
80
4.0 4.5 5.0 5.5 6.0 6.5 7.0
AC (%)
VFB
(%)
Page 125
Appendix (C) Mechanical Properties Curves
3C -
Curves of Mechanical Properties for Mid1 Mix in Asphalt Wearing Course
AC (%) Stability (kg) AC (%) Flow(mm) 4.5 2605.49 4.5 3 5.0 2473.33 5.0 2.87 5.5 1843.33 5.5 3.56 6.0 1488.67 6.0 3.75 6.5 1679.44 6.5 4.03
AC (%) Stiffness (kg/mm) AC (%) Va (%)
4.5 868.66 4.5 4.42 5.0 863.56 5.0 5.26 5.5 518.39 5.5 3.4 6.0 396.48 6.0 2.8 6.5 418.05 6.5 1.63
14001600180020002200240026002800
4.0 4.5 5.0 5.5 6.0 6.5 7.0
AC (%)
Stab
ility
(kg)
2.83
3.23.43.63.8
4
4.0 4.5 5.0 5.5 6.0 6.5 7.0
AC (%)
Flow
(mm
)
300400
500600
700
800900
4.0 4.5 5.0 5.5 6.0 6.5 7.0
AC (%)
Stiff
ness
(kg/
mm
)
1.52
2.53
3.54
4.55
5.5
4.0 4.5 5.0 5.5 6.0 6.5 7.0
AC (%)
Va(
%)
Page 126
Appendix (C) Mechanical Properties Curves
4C -
AC (%) VMA (%) AC (%) VFB (%) 4.5 14.63 4.5 69.83 5.0 16.46 5.0 68.13 5.5 15.92 5.5 78.68 6.0 16.5 6.0 83.03 6.5 16.61 6.5 90.22
AC (%) Density (g/cm3) 4.5 2.34 5.0 2.31 5.5 2.34 6.0 2.35 6.5 2.37
2.32.312.322.332.342.352.362.372.38
4.0 4.5 5.0 5.5 6.0 6.5 7.0
AC (%)
Den
sity
(g/c
m3 )
1414.5
1515.5
1616.5
17
4.0 4.5 5.0 5.5 6.0 6.5 7.0
AC (%)
VM
A (%
)
65707580859095
4.0 4.5 5.0 5.5 6.0 6.5 7.0
AC (%)V
FB(%
)
Page 127
Appendix (C) Mechanical Properties Curves
5C -
Curves of Mechanical Properties for Mid2 Mix in Asphalt Wearing Course
AC (%) Stability (kg) AC (%) Flow(mm) 4.5 2131.86 4.5 3.58 5.0 1784.83 5.0 3.61 5.5 1849.13 5.5 3.73 6.0 1272.56 6.0 5.03 6.5 1349.17 6.5 4.37
AC (%) Stiffness (kg/mm) AC (%) Va (%)
4.5 597.53 4.5 5.93 5.0 495.75 5.0 5.59 5.5 495.71 5.5 3.02 6.0 253.36 6.0 1.28 6.5 319.07 6.5 3.13
1200
1400
1600
1800
2000
2200
4.0 4.5 5.0 5.5 6.0 6.5 7.0
AC (%)
Stab
ility
(kg)
3
3.5
4
4.5
5
5.5
4.0 4.5 5.0 5.5 6.0 6.5 7.0
AC (%)
Flow
(mm
)
200
300
400
500
600
700
4.0 4.5 5.0 5.5 6.0 6.5 7.0
AC (%)
Stiff
ness
(kg/
mm
)
1
2
3
4
5
6
4.0 4.5 5.0 5.5 6.0 6.5 7.0
AC (%)
Va(
%)
Page 128
Appendix (C) Mechanical Properties Curves
6C -
AC (%) VMA (%) AC (%) VFB (%) 4.5 16.14 4.5 63.25 5.0 16.94 5.0 67.03 5.5 15.6 5.5 80.64 6.0 14.97 6.0 91.53 6.5 17.73 6.5 83.04
AC (%) Density (g/cm3) 4.5 2.33 5.0 2.34 5.5 2.35 6.0 2.35 6.5 2.31
2.3
2.31
2.32
2.33
2.34
2.35
2.36
4.0 4.5 5.0 5.5 6.0 6.5 7.0
AC (%)
Den
sity
(g/c
m3 )
14
15
16
17
18
4.0 4.5 5.0 5.5 6.0 6.5 7.0
AC (%)
VM
A (%
)
6065707580859095
4.0 4.5 5.0 5.5 6.0 6.5 7.0
AC (%)
VFB
(%)
Page 129
Appendix (C) Mechanical Properties Curves
7C -
Curves of Mechanical Properties for Mid3 Mix in Asphalt Wearing Course
AC (%) Stability (kg) AC (%) Flow(mm) 4.5 692 4.5 3.95 5.0 1262.46 5.0 3.68 5.5 1925.89 5.5 3.95 6.0 1381.13 6.0 4.62 6.5 1555.09 6.5 5.48
AC (%) Stiffness (kg/mm) AC (%) Va (%)
4.5 175.18 4.5 11.99 5.0 343.76 5.0 10.7 5.5 492.24 5.5 5.22 6.0 301.29 6.0 7.98 6.5 287.24 6.5 3.56
0
100200300
400500
600
4.0 4.5 5.0 5.5 6.0 6.5 7.0
AC (%)
Stiff
ness
(kg/
mm
)
02468
101214
4.0 4.5 5.0 5.5 6.0 6.5 7.0
AC (%)
Va(
%)
600800
100012001400160018002000
4.0 4.5 5.0 5.5 6.0 6.5 7.0
AC (%)
Stab
ility
(kg)
33.5
44.5
55.5
6
4.0 4.5 5.0 5.5 6.0 6.5 7.0
AC (%)
Flow
(mm
)
Page 130
Appendix (C) Mechanical Properties Curves
8C -
AC (%) VMA (%) AC (%) VFB (%)
4.5 21.7 4.5 44.83 5.0 21.82 5.0 50.98 5.5 17.69 5.5 70.49 6.0 21.09 6.0 62.18 6.5 18.41 6.5 80.76
AC (%) Density (g/cm3) 4.5 2.22 5.0 2.29 5.5 2.33 6.0 2.25 6.5 2.35
2.212.232.252.272.292.312.332.35
4.0 4.5 5.0 5.5 6.0 6.5 7.0
AC (%)
Den
sity
(g/c
m3 )
17
18
19
20
21
22
4.0 4.5 5.0 5.5 6.0 6.5 7.0
AC (%)
VM
A (%
)
40
50
60
70
80
90
4.0 4.5 5.0 5.5 6.0 6.5 7.0
AC (%)V
FB(%
)
Page 131
Appendix (C) Mechanical Properties Curves
9C -
Curves of Mechanical Properties for Max. Mix in Asphalt Wearing Course
AC (%) Stability (kg) AC (%) Flow(mm) 4.5 766.07 4.5 3.41 5.0 957.26 5.0 4.17 5.5 1034.85 5.5 3.55 6.0 2011.62 6.0 4.44 6.5 1890.94 6.5 4.7
AC (%) Stiffness (kg/mm) AC (%) Va (%)
4.5 225.88 4.5 14.67 5.0 229.68 5.0 15.05 5.5 296.49 5.5 12.75 6.0 453.68 6.0 5.95 6.5 402.05 6.5 3.58
600800
1000120014001600180020002200
4.0 4.5 5.0 5.5 6.0 6.5 7.0
AC (%)
Stab
ility
(kg)
3
3.5
4
4.5
5
4.0 4.5 5.0 5.5 6.0 6.5 7.0
AC (%)Fl
ow (m
m)
200250300350
400450
500
4.0 4.5 5.0 5.5 6.0 6.5 7.0
AC (%)
Stiff
ness
(kg/
mm
)
0
5
10
15
20
4.0 4.5 5.0 5.5 6.0 6.5 7.0
AC (%)
Va(
%)
Page 132
Appendix (C) Mechanical Properties Curves
10C -
AC (%) VMA (%) AC (%) VFB (%) 4.5 24.09 4.5 39.1 5.0 25.49 5.0 41.1 5.5 24.23 5.5 48.26 6.0 19.36 6.0 69.43 6.5 18.14 6.5 80.28
AC (%) Density (g/cm3) 4.5 2.15 5.0 2.15 5.5 2.15 6.0 2.31 6.5 2.31
2.12
2.16
2.2
2.24
2.28
2.32
2.36
4.0 4.5 5.0 5.5 6.0 6.5 7.0
AC (%)
Den
sity
(g/c
m3 )
17
19
21
23
25
27
4.0 4.5 5.0 5.5 6.0 6.5 7.0
AC (%)
VM
A (%
)
30405060708090
4.0 4.5 5.0 5.5 6.0 6.5 7.0
AC (%)
VFB
(%)
Page 133
Appendix (C) Mechanical Properties Curves
11C -
Curves of Mechanical Properties for Mid4 Mix in Asphalt Wearing Course
AC (%) Stability (kg) AC (%) Flow(mm) 4.5 2802.42 4.5 3.92 5.0 2132.83 5.0 3.87 5.5 1718.96 5.5 3.75
AC (%) Stiffness (kg/mm) AC (%)
Va (%)
4.5 727.63 4.5 5.86 5.0 552 5.0 5.08 5.5 461.13 5.5 5.01
16001800200022002400260028003000
4.0 4.5 5.0 5.5 6.0
AC (%)
Stab
ility
(kg)
3.723.753.783.813.843.873.9
3.93
4.0 4.5 5.0 5.5 6.0
AC (%)
Flow
(mm
)
400450500550600650700750
4.0 4.5 5.0 5.5 6.0
AC (%)
Stiff
ness
(kg/
mm
)
4.85
5.25.45.65.8
6
4.0 4.5 5.0 5.5 6.0
AC (%)
Va(
%)
Page 134
Appendix (C) Mechanical Properties Curves
12C -
AC (%) VMA (%) AC (%) VFB (%) 4.5 15.97 4.5 63.22 5.0 16.44 5.0 69.11 5.5 17.45 5.5 71.29
AC (%) Density (g/cm3) 4.5 2.31 5.0 2.34 5.5 2.33
2.3
2.31
2.32
2.33
2.34
2.35
4.0 4.5 5.0 5.5 6.0
AC (%)
Den
sity
(g/c
m3 )
15.5
16
16.5
17
17.5
18
4.0 4.5 5.0 5.5 6.0
AC (%)
VM
A (%
)
30405060708090
4.0 4.5 5.0 5.5 6.0
AC (%)
VFB
(%)
Page 135
Appendix (D) Photos Show Method of Working in the Laboratory
0D -
Page 136
Appendix (D) Photos Show Method of Working in the Laboratory
1D -
Figure (D- 1) Drying of aggregates after washing .
Figure (D-2 ) Weighting of aggregate for sieve analysis test .
Page 137
Appendix (D) Photos Show Method of Working in the Laboratory
2D -
Figure (D-3) Pycnometer test
Figure (D-4 ) Specific Gravity of aggregates
Page 138
Appendix (D) Photos Show Method of Working in the Laboratory
3D -
Figure ( D-5 ) Place of Bitumen in containers.
Figure (D-6 ) Place of Bitumen and aggregates in oven
Page 139
Appendix (D) Photos Show Method of Working in the Laboratory
4D -
Figure ( D-7 ) Place of Bitumen and aggregate in a large container.
Figure ( D-8 ) Weighting of a sample mix..
Page 140
Appendix (D) Photos Show Method of Working in the Laboratory
5D -
Figure ( D-9 ) Mix of a sample in the mold
Figure ( D-10 ) Dividing of the mixture.
Page 141
Appendix (D) Photos Show Method of Working in the Laboratory
6D -
Figure ( D-11 ) Place of the mixture in containers
Figure ( D-12 ) Compact of the samples
Page 142
Appendix (D) Photos Show Method of Working in the Laboratory
7D -
Figure (D-13) Marshal test