A quantitative approach to spring hydrograph decomposition Attila Kova ´cs a, * , Pierre Perrochet b,1 a geokovacs.com, 15 Gyorgyhegy utca, 2083 Solymar, Hungary b CHYN, University of Neuchaˆtel, Rue Emile-Argand 11, CH-2007 Neuchaˆtel, Switzerland Received 12 June 2007; received in revised form 1 December 2007; accepted 7 December 2007 KEYWORDS Karst springs; Spring hydrographs; Hydrograph decomposition; Recession coefficient Summary A combined analytical–numerical study for the characterization of spring hydrographs is presented. Two-dimensional analytical solutions for diffusive flux from rectangular blocks of arbitrary shape facilitate a quantitative characterization of expo- nential hydrograph components. Together with analytical solutions for block discharge, a systematic analysis of numerically simulated spring hydrographs of synthetic karst sys- tems provides an insight into karst hydrodynamics. Different hydrograph components do not represent different classes of rock permeabil- ity. Hydrographs of individual homogeneous blocks can be decomposed into several expo- nential components. Discharge hydrographs of symmetric rectangular blocks can be reconstructed by the sum of only three exponential components. Increasing block asym- metry results in an increasing number of exponential components contributing signifi- cantly to total discharge. Spring hydrographs represent a sum of individual block discharges originating from diffuse infiltration and conduit discharge originating from concentrated recharge. Beyond the inflection of the recession limb, a spring hydrograph can be decomposed in a similar manner to that of individual homogeneous blocks. The presented hydrograph analytical method facilitates the estimation of hydraulic and geometric parameters of karst hydro- geological systems. ª 2007 Elsevier B.V. All rights reserved. Introduction Karst aquifers differ from other types of hydrogeological systems in their complex behavior originating from strong heterogeneity. Heterogeneity manifests in the duality (diffuse and concentrated nature) of each hydraulic process taking place in karst aquifers (Kira´ly,1994). These hydraulic 0022-1694/$ - see front matter ª 2007 Elsevier B.V. All rights reserved. doi:10.1016/j.jhydrol.2007.12.009 * Corresponding author. Tel./fax: +36 1 3872793. E-mail addresses: [email protected](A. Kova ´cs), Pierre. [email protected](P. Perrochet). 1 Tel.: +41 32 718 2577; fax: +41 32 718 2603. Journal of Hydrology (2008) 352, 16– 29 available at www.sciencedirect.com journal homepage: www.elsevier.com/locate/jhydrol
Transcript
Journal of Hydrology (2008) 352, 16–29
ava i lab le at www.sc iencedi rec t . com
journal homepage: www.elsevier .com/ locate / jhydro l
A quantitative approach to spring hydrographdecomposition
Attila Kovacs a,*, Pierre Perrochet b,1
a geokovacs.com, 15 Gyorgyhegy utca, 2083 Solymar, Hungaryb CHYN, University of Neuchatel, Rue Emile-Argand 11, CH-2007 Neuchatel, Switzerland
Received 12 June 2007; received in revised form 1 December 2007; accepted 7 December 2007
Summary A combined analytical–numerical study for the characterization of springhydrographs is presented. Two-dimensional analytical solutions for diffusive flux fromrectangular blocks of arbitrary shape facilitate a quantitative characterization of expo-nential hydrograph components. Together with analytical solutions for block discharge,a systematic analysis of numerically simulated spring hydrographs of synthetic karst sys-tems provides an insight into karst hydrodynamics.
Different hydrograph components do not represent different classes of rock permeabil-ity. Hydrographs of individual homogeneous blocks can be decomposed into several expo-nential components. Discharge hydrographs of symmetric rectangular blocks can bereconstructed by the sum of only three exponential components. Increasing block asym-metry results in an increasing number of exponential components contributing signifi-cantly to total discharge.
Spring hydrographs represent a sum of individual block discharges originating fromdiffuse infiltration and conduit discharge originating from concentrated recharge. Beyondthe inflection of the recession limb, a spring hydrograph can be decomposed in a similarmanner to that of individual homogeneous blocks. The presented hydrograph analyticalmethod facilitates the estimation of hydraulic and geometric parameters of karst hydro-geological systems.ª 2007 Elsevier B.V. All rights reserved.
7 Elsevier B.V. All rights reserved
6 1 3872793.nine.ch (A. Kovacs), Pierre.
718 2603.
Introduction
Karst aquifers differ from other types of hydrogeologicalsystems in their complex behavior originating from strongheterogeneity. Heterogeneity manifests in the duality(diffuse and concentrated nature) of each hydraulic processtaking place in karst aquifers (Kiraly, 1994). These hydraulic
A quantitative approach to spring hydrograph decomposition 17
processes include infiltration, groundwater flow anddischarge.
The quantitative characterization of the hydrodynamicfunctioning of karst systems requires the definition of real-istic hydraulic and geometric parameters (Kiraly and Morel,1976a; Kiraly, 1998a, 2002). Information on these parame-ters is far more difficult to obtain to karst systems thanother kinds of hydrogeological systems. Classical geologicaland hydrogeological surveys, borehole tests, tracing exper-iments, speleological and geophysical observations provideonly a limited information on the spatial configuration andhydraulic properties of a conduit network. However, in mostcases spring discharge time series data, coupled with infor-mation on the hydraulic properties of the low-permeabilityrock matrix are available, or possible to obtain. Hydrographanalytical techniques have the potential of estimatingeffective hydraulic parameters and geometric characteris-tics of karst systems using this information.
Some hydrograph analytical techniques are based on theanalysis of slow hydrograph recession segments (Maillet,1905; Rorabaugh, 1964; Berkaloff, 1967; Bagaric, 1978; Kov-acs, 2003; Kovacs et al., 2005). These methods are based onphysical principles governing the emptying of simple reser-voirs, and thus assume that slow hydrograph recessionpurely reflects the drainage of low-permeability matrixblocks.
Other studies attempt to describe the entire recessionprocess (including both fast and slow recessions) by fittinga series of exponential curves to different hydrograph seg-ments (Forkasiewicz and Paloc, 1967; Atkinson, 1977; Mila-novic, 1981; White, 1988; Sauter, 1992; Padilla et al., 1994;Shevenell, 1996; Baedke and Kroethe, 2001). Alternatively,they assume an exponential baseflow recession, and charac-terize steep recession segments by a different function(Mangin, 1975), or attempt to describe the entire recessionprocess by one mathematical formula (Drogue, 1972).
The hydrograph decomposition technique based on expo-nential curve fitting generally includes three exponentialcomponents. These have been interpreted as dischargecomponents from three individual reservoirs, representingthe conduit network, an intermediate system of karstified
Figure 1 A schematic model of spring hydrographs. The first inflesecond inflexion point represents the end of the infiltration event.
fractures and the low-permeability matrix (Forkasiewiczand Paloc, 1967; White, 1988; Shevenell, 1996; Baedkeand Kroethe, 2001). Although the numerical studies of Kiralyand Morel (1976b) and Eisenlohr et al. (1997) demonstratedthat different exponential hydrograph segments do not nec-essarily correspond to aquifer volumes with differenthydraulic conductivities, they did not provide an adequateexplanation of the several exponential segments identifiedon spring hydrographs.
The aim of this study is to investigate the hydraulicbehavior of karst systems during recession stages in orderto provide a quantitative characterization of the entirerecession process. We also aim to provide a critical reviewon decomposition techniques.
Precedents
Hydraulic processes taking place in a karst aquifer manifestin the temporal variations in spring discharge. The plots ofspring discharge versus time are referred to as spring hydro-graphs. Hydrographs consist of a succession of individualpeaks, each of which represents the global response ofthe aquifer given to a precipitation event (Fig. 1). Hydro-graph peaks consist of a rising and a falling limb. The risinglimb comprises of a concave segment and a convex segmentseparated by an inflexion point. This inflexion point repre-sents the maximum infiltration state (Kiraly, 1998b). Thefalling limb comprises a steep and a slightly sloped segment.The former is called flood recession, while the latter is re-ferred to as baseflow recession, which is the most stablesection of any hydrograph. The flood recession limb is alsodivided into a convex segment and a concave segment bya second inflexion point, which represents the end of aninfiltration event. Baseflow recession is the most represen-tative feature of an aquifer’s global response because it isthe less influenced by the temporal and spatial variationsof infiltration.
The first mathematical characterization of the baseflowrecession was provided by Maillet (1905). This interpreta-tion was based on the drainage of a simple reservoir andpresumes that spring discharge is a function of the volume
xion point corresponds to the maximum infiltration state. The(Modified from Kovacs et al., 2005).
18 A. Kovacs, P. Perrochet
of water held in storage. This behavior is described by anexponential equation as follows:
Q ðtÞ ¼ Q 0e�at ð1Þ
where Qt is the discharge [L3T�1] at time t, and Q0 is the ini-tial discharge [L3T�1], a is the recession coefficient [T�1]usually expressed in days. Plotted on a semi-logarithmicgraph, this function is represented as a straight line withthe slope �a. This equation is usually adequate for describ-ing baseflow recession of karst systems, and is believed toreflect the drainage of individual matrix blocks.
Rorabaugh (1964) and Berkaloff (1967) provided a quan-titative link between the recession coefficient and aquifercharacteristics. According to the one-dimensional analyticalsolution of these authors, the recession coefficient can beexpressed as follows:
ab ¼p2T
4SL2ð2Þ
where L [L] is the length of the one-dimensional domain, T[L2T�1] is hydraulic transmissivity and S [–] is storativity.
Kovacs (2003) and Kovacs et al. (2005) provided atwo-dimensional analytical solution to the problem, andsuggested that the baseflow recession coefficient may beexpressed as follows:
ab ¼2p2T
SL2ð3Þ
where L2 is the 2D block area.
Figure 2 Decomposition of recession curves according to Forkintermediate recession and ‘‘C’’ is baseflow recession. Recessiohydraulic conductivities according to Forkasiewicz and Paloc (1967
The above authors also investigated the applicability ofEq. (3) for deriving hydraulic parameters from karst systemsof various configurations. This will be discussed in the fol-lowing chapters.
Hydrograph decomposition
Decreasing limb of hydrograph peaks can usually be decom-posed into several exponential segments. Forkasiewicz andPaloc (1967) assumed that different hydrograph segmentsrepresent different parallel reservoirs, all contributing tospring discharge (Fig. 2). They argued that such behavior re-flects the existence of three reservoirs, representing theconduit network, an intermediate system of well integratedkarstified fissures, and a low-permeability network of poresand narrow fissures. According to this model spring dis-charge can be described by the following formula:
Q ðtÞ ¼ Q 1e�a1t þ Q 2e
�a2t þ Q 3e�a3t ð4Þ
Despite the simplicity of this interpretation, the analysisof spring hydrographs simulated by numerical models per-formed by Kiraly and Morel (1976b) and later by Eisenlohret al. (1997) showed that different exponential hydrographsegments do not necessarily correspond to aquifer volumeswith different hydraulic conductivities. Three exponentialreservoirs can be fitted on the hydrograph of a system con-sisting of only two classes of hydraulic conductivities.According to these authors, the intermediate exponentialcould simply be the result of transient phenomena in thevicinity of the high conductivity channels.
asiewicz and Paloc (1967). ‘‘A’’ is flood recession, ‘‘B’’ isn components correspond to aquifer volumes with different).
A quantitative approach to spring hydrograph decomposition 19
According to the analytical solution of Kovacs (2003) andKovacs et al. (2005) for diffusive flux from a two-dimen-sional square block of size L encircled by uniform headboundary conditions:
Q ðtÞ ¼ H0128
p2TX1n¼0
e�ð2nþ1Þ2p2 Tt
SL2
X1n¼0
e�ð2nþ1Þ2p2 Tt
SL2
ð2nþ 1Þ2ð5Þ
where initial conditions comprise uniform hydraulic headsover the block surface. Assuming that
a ¼ p2Tt
SL2ð6Þ
it follows from Eq. (5) that
Q ðtÞ ¼ H0128
p2T e�2a þ 10
9e�10a þ 1
9e�18a
�
þ 26
25e�26a þ 34
225e�34a þ 1
25e�50a þ :::
�ð7Þ
The comparison between the above analytical expressionand numerical simulations shows that a sum of six seriesmembers (n = 2 in Eq. (5)) provides a good approximationof homogeneous block discharge (Fig. 3).
According to Eq. (7), the diffusive discharge of a singlehomogeneous block can be expressed as a superposition ofan infinite number of exponential components. However,higher order components manifest themselves only at earlytimes of the recession process and became negligible over alonger period of time. This explains why they cannot usuallybe identified on spring hydrographs based on hourly dis-
Figure 3 Analytical decomposition of discharge from a homogeneoQ2, Q4) provides a satisfactory approximation of the recession curv
charge data. Also, the diminution of higher order seriesmembers over time is responsible for the imaginary expo-nential behavior of baseflow discharge. In reality, spring dis-charge never exhibits perfect exponential behavior; thisphenomenon is clearly experienced when numerically simu-lating spring hydrographs. The recession coefficient calcu-lated for each timestep never stabilizes perfectly, butmonotonously decreases with time.
The discharge hydrograph of a homogeneous squareblock can be decomposed into an infinite number of expo-nential components of which only the first six componentsare listed in Eq. (7). However, the weight of the differentcomponents and their temporal diminution is strongly vary-ing. This is best seen when plotting all the exponential com-ponents together. Fig. 3 clearly indicates that components1, 2 and 4 of the series are significant, while the remainingcomponents 3, 5 and 6 have very little contribution to totaldischarge. As a matter of fact, only three exponentialcomponents contribute significantly to the total dischargeof a square shaped homogeneous block. This explains whyspring hydrographs are usually decomposed into threecomponents.
However, according to this observation different hydro-graph components do not represent different classes of rockpermeability. Hydrographs of simple homogeneous blockscan equally be decomposed into three or more exponentialsegments. For a symmetric block shape however, the sum ofonly three exponential components provides an adequateapproximation of total spring discharge (Fig. 3). The result-
us square block. The sum of three exponential components (Q1,e (T = 10�5 m2 s�1, S = 10�4, L = 600 m, H0 = 100 m).
Figure 5 Dependence of the baseflow recession coefficienton conduit frequency. f* is the threshold value between CIFRand MRFR type baseflow. Modified after Kovacs (2003) andKovacs et al. (2005).
20 A. Kovacs, P. Perrochet
ing composite formula satisfies the hydrograph decomposi-tion approach of Forkasiewicz and Paloc (1967):
Q ðtÞ �128
p2H0Te
�2p2TtSL2 þ 1280
9p2H0Te
�10p2TtSL2
þ 3328
25p2H0Te
�26p2TtSL2 ð8Þ
According to this simplification, the three hydrographrecession coefficients generally identified on spring hydro-graphs can be expressed as follows:
a1 ¼ 2p2T
SL2; a2 ¼ 10
p2T
SL2; a3 ¼ 26
p2T
SL2ð9Þ
The numbering of recession coefficients in this study be-gins from the baseflow recession, and not from the floodrecession as previously suggested by Forkasiewicz and Paloc(1967). Consequently, a1 is baseflow recession coefficient,a2 is intermediate recession coefficient, and a3 is floodrecession coefficient.
Recession of heterogeneous domains
The previous studies of Kovacs (2003) and Kovacs et al.(2005) demonstrated that the recession of strongly hetero-geneous systems cannot be described using a single formula,but that it follows two significantly different physical princi-ples depending on the overall configuration of the hydraulicand geometric parameter fields (Figs. 4 and 5).
The baseflow recession of mature karst systems is con-trolled by the recession of individual matrix blocks. Thisflow condition was referred to as matrix restrained flow re-gime (MRFR). The baseflow recession coefficient of maturekarst systems can thus be expressed making use of Eq. (3)when assuming regular conduit networks with symmetricmatrix block shapes.
Figure 4 Dependence of the baseflow recession coefficienton conduit conductancy. Kc* is the threshold value betweenMRFR and CIFR type baseflow. Modified after Kovacs (2003) andKovacs et al. (2005).
The baseflow recession of fissured systems and poorlykarstified systems is influenced by the hydraulic parametersof fractures/conduits, low-permeability blocks, fracturespacing, and aquifer extent. This flow condition was definedas conduit-influenced flow regime (CIFR). The baseflowrecession of fractured systems can be expressed as follows:
ah ¼2
3
Kcf
SmAð10Þ
where Kc is conduit conductancy [L3T�1], f is conduit fre-quency [L�1], Sm is matrix storativity [–] and A is the blockarea.
A threshold value for conduit conductancy betweenthese two domains can be expressed as follows:
K�c � 3p2TmAf ð11Þ
where Tm [L2T�1] is matrix transmissivity.If the conduit conductancy of a strongly heterogeneous
system exceeds the above threshold value (MRFR systems),Eq. (3) can be applied for the estimation of aquifer param-eters. If conduit conductancy is inferior to the threshold va-lue (CIFR systems), then Eq. (10) must be applied forestimating aquifer parameters.
As we intend to extend the hydrograph analytical ap-proach to several hydrograph components of mature karstsystems, only Matrix Restrained Systems (exhibiting MRFRbaseflow) will be considered in this study. Our followingobservations are not valid for weakly karstified or fissuredsystems (those exhibiting CIFR baseflow).
In order to be able to extend the hydrograph analyticalapproach to the entire recession limb of hydrograph peaks,several model configurations have been tested by numericalmodels. Karstified domains containing 8 times 8 pieces ofsquare shaped porous blocks with L = 600 m size have beensimulated. A uniform initial hydraulic head of H0 = 100 mwas applied over the simulation domains. The hydraulic
Figure 6 Comparison between analytical and numerically simulated block and spring discharges (T = 10�5 m2 s�1, S = 10�4,L = 600 m, H0 = 100 m). Spring discharges have been divided by the number of matrix blocks within the simulation domain. The goodcorrespondence between block and spring discharges indicates that the baseflow recession of Matrix Restrained systems does notdepend on the hydraulic conductancy of karst conduits; it reflects the sum of total fluxes from individual matrix blocks.
A quantitative approach to spring hydrograph decomposition 21
conductancy of karst conduits was modified by an order ofmagnitude in order to demonstrate the insensitivity ofspring discharge to this parameter during the entire reces-sion process. For the sake of comparability between simula-tion results, the total spring discharge was divided by thenumber of porous blocks within the simulation domain. Asdemonstrated in Fig. 6, the numerically simulated springdischarges properly fit to the numerically simulated blockdischarge. No difference can be observed between thetwo spring discharge curves. Similarly, numerical and ana-lytical block discharges show a good correspondence.
Numerical simulations confirmed that in the case ofMRFR systems (Kc > Kc* in Eq. (11)) the recession processdoes not depend on the hydraulic conductancy of karst con-duits; it reflects the sum of total fluxes from individual ma-trix blocks. Matrix Restrained heterogeneous systemsbehave similarly to a single porous block during the entirerecession process, and thus hydrograph decomposition tech-niques developed for porous blocks can be applied to karstsystems. This assumption applies when no infiltration is as-sumed along the conduit network.
Effect of block shape on hydrographcomponents
The above-discussed analytical solution (Eq. (5)) was devel-oped for two-dimensional square blocks. As it was demon-
strated by Kovacs (2003) and Kovacs et al. (2005), the sizeand the shape of a karstic water catchment do not influencethe recession coefficient in the case of mature karst aqui-fers (Matrix Restrained Systems), nor does the hydraulicconductancy of the conduit network.
However, block shape influences the recession coeffi-cients of MR type systems. Consequently, hydrographcomponents will deviate from those that were analyticallyexpressed assuming square block shapes.
An analytical solution for diffusive flux from a two-dimensional asymmetric rectangular block encircled byuniform head boundary conditions can be expressed asfollows:
Q ðtÞ ¼64TH0
p2bX1n¼0
e�ab2ð2nþ1Þ2
X1n¼0
e�að2nþ1Þ2
ð2nþ 1Þ2
(
þ 1
b
X1n¼0
e�að2nþ1Þ2 X1
n¼0
e�ab2ð2nþ1Þ2
ð2nþ 1Þ2
)ð12Þ
where initial conditions comprise uniform hydraulic headdistribution over the block surface, and
a ¼ p2Tt
SL2xand b ¼ Lx
Lyð13Þ
Lx and Ly are block sizes in the x and y directions. It followsfrom Eq. (12) that
Q ðtÞ ¼64
p2H0T
bþ 1b
� �e�að1þb2Þ þ bþ 1
9b
� �e�að1þ9b
2Þ þ b9þ 1
b
� �e�að9þb2Þ þ b
9þ 1
9b
� �e�9að1þb2Þ
þ b25þ 1
25b
� �e�25að1þb2Þ þ b
9þ 1
25b
� �e�að9þ25b
2Þ þ b25þ 1
9b
� �e�að25þ9b
2Þ
þ bþ 125b
� �e�að1þ25b
2Þ þ b25þ 1
b
� �e�að25þb2Þ þ :::
8>>>><>>>>:
9>>>>=>>>>;
ð14Þ
22 A. Kovacs, P. Perrochet
From which the baseflow recession coefficient of anasymmetric block can be expressed as follows:
ab ¼p2T
S
1
L2xþ 1
L2y
!ð15Þ
The sum of nine series members provide a satisfactoryapproximation of the total discharge (n = 2 in Eq. (13)) asshown in Figs. 7 and 8.
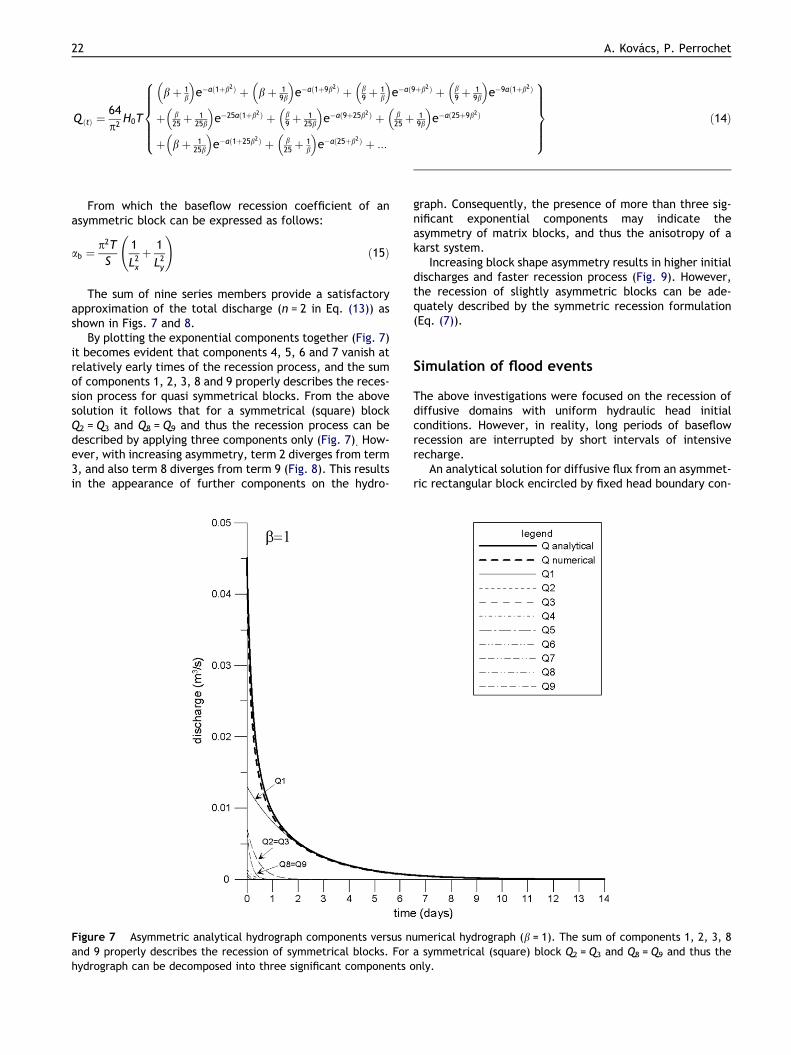
By plotting the exponential components together (Fig. 7)it becomes evident that components 4, 5, 6 and 7 vanish atrelatively early times of the recession process, and the sumof components 1, 2, 3, 8 and 9 properly describes the reces-sion process for quasi symmetrical blocks. From the abovesolution it follows that for a symmetrical (square) blockQ2 = Q3 and Q8 = Q9 and thus the recession process can bedescribed by applying three components only (Fig. 7). How-ever, with increasing asymmetry, term 2 diverges from term3, and also term 8 diverges from term 9 (Fig. 8). This resultsin the appearance of further components on the hydro-
Figure 7 Asymmetric analytical hydrograph components versus nand 9 properly describes the recession of symmetrical blocks. Forhydrograph can be decomposed into three significant components o
graph. Consequently, the presence of more than three sig-nificant exponential components may indicate theasymmetry of matrix blocks, and thus the anisotropy of akarst system.
Increasing block shape asymmetry results in higher initialdischarges and faster recession process (Fig. 9). However,the recession of slightly asymmetric blocks can be ade-quately described by the symmetric recession formulation(Eq. (7)).
Simulation of flood events
The above investigations were focused on the recession ofdiffusive domains with uniform hydraulic head initialconditions. However, in reality, long periods of baseflowrecession are interrupted by short intervals of intensiverecharge.
An analytical solution for diffusive flux from an asymmet-ric rectangular block encircled by fixed head boundary con-
umerical hydrograph (b = 1). The sum of components 1, 2, 3, 8a symmetrical (square) block Q2 = Q3 and Q8 = Q9 and thus thenly.
Figure 8 Asymmetric analytical hydrograph components versus numerical hydrograph (b = 0.5). With increasing asymmetry, term2 diverges from term 3, and also term 8 diverges from term 9. This results in the appearance of further components on thehydrograph.
A quantitative approach to spring hydrograph decomposition 23
ditions during and following a constant recharge period overthe block surface can be formulated as follows:
Where s is the time corresponding to the end of the constantrecharge, i0 is the recharge rate (LT�1) and H(a�as) is theHeaviside function that takes the value H = 0 for a 6 as
Q ðtÞ ¼64i0LxLy
p4
�e�að1þb2Þ � 19e�að1þ9b
2Þ � 19e�að9þb2Þ � 1
81e�9að1þb
�� 1
625e�25að1þb2Þ � 1
225e�að9þ25b
2Þ � 1225
e�að25þ9b2Þ
� 125 e
�að1þ25b2Þ � 125 e
�að25þb2Þ � :::�
þ e�ða�asÞð1þb2Þ þ 19e�ða�asÞð1þ9b2Þ þ 1
9e�ða�asÞð9þb2Þ
�þ 1
625e�25ða�asÞð1þb2Þ þ 1
225e�ða�asÞð9þ25b2Þ þ 1
225e�ða�
þ 125e�ða�asÞð1þ25b2Þ þ 1
25e�ða�asÞð25þb2Þ þ :::
�
8>>>>>>>>>>>>>><>>>>>>>>>>>>>>:
and H = a-as for a > as. From Eq. (16) if follows that the ris-ing limb discharge is:
Q ðtÞ ¼64i0LxLy
p4
�
6708150625� e�að1þb2Þ � 1
9 e�að1þ9b2Þ � 1
9 e�að9þb2Þ � 1
81 e�9að1þb2Þ
� 1625
e�25að1þb2Þ � 1225
e�að9þ25b2Þ � 1
225e�að25þ9b
2Þ
� 125e�að1þ25b
2Þ � 125e�að25þb2Þ � :::
8>><>>:
9>>=>>;ð17Þ
and the recession limb discharge is
2Þ
þ 181e�9ða�asÞð1þb2Þ
asÞð25þ9b2Þ
9>>>>>>>>>>>>>>=>>>>>>>>>>>>>>;
ð18Þ
Figure 9 Analytical block discharges for different asymmetry factors. Increasing block shape asymmetry results in higher initialdischarges and faster recession process.
Figure 10 Comparison between analytical and numerical flood discharges. This Figure indicates the importance of high orderexponential components at early times of the recharge process. The satisfactory analytical simulation of the rising limb of springhydrographs requires the application of a large number of exponential components.
24 A. Kovacs, P. Perrochet
A quantitative approach to spring hydrograph decomposition 25
where
a ¼ p2Tt
SL2xand as ¼
p2Ts
SL2xð19Þ
The numerical simulation of flood discharge indicates thathigh order exponential components that manifest at earlytimes of the recharge process represent a significant portionof spring discharge (Fig. 10). Consequently, the satisfactoryanalytical simulation of the rising limb of spring hydrographsrequires the application of a large number (n = 50) of expo-nential components. At the same time similarly to therecession of simulation domains with uniform fixed head ini-tial conditions, a sum of only nine series members (n = 2)provides a satisfactory approximation of the recession limb.
Effects of concentrated infiltration on springhydrographs
The duality concept introduced by Kiraly (1994) revealedthe co-existence of diffuse and concentrated recharge dur-ing infiltration events. A part of recharge takes place in adiffusive form throughout matrix blocks, while another partoriginates from direct infiltration taking place at sinkholesor delivered by the high permeability epikarstic skin towardsthe conduit system (Mangin, 1975). According to the calcu-
Figure 11 Numerical hydrographs showing the effect of differenthigher proportion of concentrated recharge compared to diffusedischarges. However, different proportion between concentrated acoefficient. Constant recharge has been applied.
lations of Jeannin and Grasso (1995), about 50% of totalinfiltration occurs in concentrated form.
Our investigations showed that if infiltration to a karstsystem takes place entirely in diffuse form, spring dischargecan be calculated by simply summing individual block dis-charges (Figs. 11 and 12). However, if concentrated re-charge is present, significantly higher peak discharges willdevelop. The higher proportion of concentrated rechargecompared to diffuse infiltration entails higher peak dis-charges, but lower baseflow recession discharges. However,baseflow recession coefficient is exclusively dependent onblock hydraulic characteristics and block geometry, andthus a different proportion between concentrated and dif-fuse discharge does not influence the value of baseflowrecession coefficient.
In the case of both concentrated and diffuse rechargesinto an aquifer, the spring hydrograph can be reconstructedas a sum of individual block discharges and the dischargeoriginating from the conduit network. Fig. 13 indicates theresults of three different numerical simulations. In case 1total recharge was equally distributed over matrix blocksand the conduit system. In case 2 only concentrated re-charge was applied, and diffuse recharge was skipped. Incase 3 only diffuse recharge was applied, and no concen-trated recharge took place into the conduit system. Ournumerical investigations indicate that the total discharge
proportions between concentrated and diffuse infiltration. Theinfiltration entails higher peak discharges, but lower baseflownd diffuse discharges does not influence the baseflow recession
Figure 12 Numerical hydrographs showing the effect of different proportions between concentrated and diffuse infiltration.Triangular recharge function has been applied.
26 A. Kovacs, P. Perrochet
of case 1 (both diffuse and concentrated recharge) can becalculated by simply summing the discharge from case 2and case 3.
The hydrograph analytical methods presented in thisstudy are based on two-dimensional geometries. This im-plies semi-horizontal flow directions, and the lack ofphreatic karst conduits. These assumptions are valid formost shallow karst systems. In such systems, conduit stor-age is generally negligible compared to the storage in ma-trix blocks. Among such conditions, conduit flow only hasinfluence on the spring hydrograph until the end of therecharge event. During this period conduit discharge canbe approximated by the concentrated recharge functionapplied and spring discharge can be evaluated as a super-position of concentrated recharge on the sum of individ-ual block discharges. The end of an infiltration eventmanifests as an inflection point on hydrograph floodrecession limbs (Kiraly, 1998b). Consequently, followingthe inflexion of the flood recession curve, spring hydro-graphs can be decomposed according to the analyticalsolutions developed for homogeneous blocks (Eqs. (7)and (14)).
In order to prove the applicability of the above-intro-duced hydrograph decomposition methods, a numericallysimulated spring hydrograph with known geometry, hydrau-lic parameters and infiltration rates has been manuallydecomposed using a visual curve fitting method (Fig. 14).
The manually obtained recession coefficients were thencompared with the analytical values (Table 1).
The comparison between manually obtained and analyt-ically calculated results indicates a good correspondence.A negligible difference between these figures may resultfrom numerical errors and also from the imperfect curve fit-ting on the baseflow recession segment. This latter issue isespecially critical, since baseflow recession never manifestsa perfectly exponential behavior. As lower order exponen-tial components are successively subtracted from the dis-charge curve, any error in curve fitting would modify theresidual discharges and thus the value of higher order reces-sion coefficients.
Our numerical simulations suggest that the concaverecession segment of any arbitrary spring hydrograph canbe decomposed according to Eq. (9) when assuming sym-metric block shapes. The deviation of the proportionbetween the recession coefficients of different hydrographsegments from those expressed in Eq. (9) may indicate blockasymmetry. While aquifer parameters can be simply esti-mated from baseflow recession coefficient (Eqs. (3) and(15)), hypotheses on block shape can be verified, and blockgeometry can be estimated by applying Eq. (14). However,significant discrepancies in the proportion between therecession coefficients of different hydrograph segmentsmay indicate not only block asymmetry but the variationsof block shape or block size over the catchment area.
Figure 13 Numerically simulated spring discharges originating from dual, concentrated and diffuse infiltrations. Dischargeoriginating from dual infiltration can be expressed by summing discharges originating from concentrated and diffuse recharges. Incase 1 total recharge was equally distributed over matrix blocks and the conduit system. In case 2 only concentrated recharge wasapplied. In case 3 only diffuse recharge was applied.
A quantitative approach to spring hydrograph decomposition 27
Furthermore, the recession of multilevel karst systems canbe a strongly nonlinear phenomenon that manifests in an er-ratic behavior of spring hydrographs.
Conclusions
Two-dimensional analytical solutions for diffusive flux fromsymmetric and asymmetric rectangular blocks have beenprovided. These solutions serve to analytically simulatespring hydrographs of shallow karst systems for constant re-charge conditions. The same analytical solutions revealedthe complex nature of diffusive discharge and suggest thathydrographs of individual homogeneous blocks can bedecomposed into three or more exponential components.Consequently, different exponential components do notcorrespond to aquifer volumes with different hydraulicconductivities.
A systematic analysis of numerically simulated spring dis-charges made the extension of the analytical formulae toentire karst systems possible. When no infiltration is pres-ent, the entire recession process is controlled by the reces-sion of individual blocks. Consequently, the hydraulicproperties of a karst conduit system has no influence onspring discharge, and spring hydrographs can be simulatedby summing individual block discharges.
In the case of both concentrated and diffuse rechargesinto an aquifer, the spring hydrograph can be reconstructedas a sum of individual block discharges and the dischargeoriginating from the conduit network.
In the case of temporarily varying recharge, the end ofthe influence of conduit flow on a hydrograph manifests asan inflection point on the recession limb. Beyond this point,a hydrograph can be decomposed in a similar manner to thatof an individual homogeneous block.
The hydrograph decomposition technique presented inthis paper provides an insight into the hydraulic behaviorof karst hydrogeological systems. Furthermore, the pre-sented method enables the estimation of hydraulic parame-ters and conduit network geometry of karst aquifers. Thedeviation of field measurements from analytical hydro-graphs introduced in this study might indicate variationsof block shape and size, or the presence of multi-level con-duit networks.
Acknowledgement
This work was supported, in part, by the Hungarian Scholar-ship Board under the Eotvos Scholarship Program. The
Figure 14 Manual decomposition of a numerically simulated spring hydrograph. Domain size: 4800 · 4800 m, L = 600 m,Tm = 10�5 m2/s, Sm = 10�4, Kc = 100 m3/s, Sc = 2.14 · 10�7. A triangular recharge function with imax = 20 mm/d over 24 h has beenapplied. Concentrated infiltration was 50% of total recharge.
Table 1 Comparison between numerical and analyticalrecession coefficients
Numerical values result from manual decomposition and curvefitting of a numerically simulated hydrograph.
28 A. Kovacs, P. Perrochet
authors would like to thank L. Bell for a review of the draftof this work.
References
Atkinson, T.C., 1977. Diffuse flow and conduit flow in limestoneterrain in the Mendip Hills, Somerset (Great Britain). Journal ofHydrology 35, 93–103.
Baedke, S.J., Kroethe, N.C., 2001. Derivation of effective hydraulicparameters of a karst aquifer from discharge hydrographanalysis. Water Resources Research 37, 13–19.
Bagaric, I., 1978. Determination of storage and transportationcharacteristics of karst aquifers. In: Milanovic, P.T. (Ed.), Karsthydrogeology. Water Resources Publications, Littleton, CO, USA,434 p.
Berkaloff, E., 1967. Limite de validite des formules courantes detarissement de debit. Chronique d’Hydrogeologie 10, 31–41.
Drogue, C., 1972. Analyse statistique des hydrogrammes dedecrues des sources karstiques. Journal of Hydrology 15, 49–68.
Eisenlohr, L., Kiraly, L., Bouzelboudjen, M., Rossier, I., 1997. Anumerical simulation as a tool for checking the interpreta-tion of karst springs hydrographs. Journal of Hydrology 193,306–315.
Forkasiewicz, J., Paloc, H., 1967. Le regime de tarissement de laFoux-de-la-Vis. Etude preliminaire. Chronique d’Hydrogeologie,BRGM 3 (10), 61–73.
Jeannin, P.-Y., Grasso, A.D., 1995. Estimation des infiltrationsefficaces journalieres sur le bassin karstique de la Milandrine(Ajoie, JU, Suisse). Bulletin d’Hydrogeologie de l’Universite deNeuchatel 14, 83–89.
Kiraly, L., 1994. Groundwater flow in fractures rocks: models andrealityProceedings of the 14th Mintrop Seminar uber Interpre-tationsstrategien in Exploration und Produktion, vol. 159. RuhrUniversitat Bochum, pp. 1–21.
Kiraly, L., 1998a. Modeling karst aquifers by the combined discretechannel and continuum approach. Bulletin d’Hydrogeologie,Neuchatel 16, 77–98.
Kiraly, L., 1998b. Introduction a l’hydrogeologie des roches fissur-ees et karstiques. Bases theoriques a l’intention des hydrogeo-logues. Manuscrit, Universite de Neuchatel.
Kiraly, L., 2002. Karstification and Groundwater Flow. In: Proceed-ings of the Conference on Evolution of Karst: From Prekarst toCessation. Postojna-Ljubljana, pp. 155–190.
Kiraly, L., Morel, G., 1976a. Etude de regularisation de l’Areuse parmodele mathematique. Bulletin d’Hydrogeologie, Neuchatel 1,19–36.
A quantitative approach to spring hydrograph decomposition 29
Kiraly, L., Morel, G., 1976b. Remarques sur l’hydrogramme dessources karstiques simule par modeles mathematiques. Bulletind’Hydrogeologie, Neuchatel 1, 37–60.
Kovacs, A., 2003. Geometry and hydraulic parameters of karstaquifers: a hydrodynamic modeling approach. Doctoral Thesis,University of Neuchatel, Switzerland, 131 p.
Kovacs, A., Perrochet, P., Kiraly, L., Jeannin, P.-Y., 2005. Aquantitative method for the characterization of karst aquifersbased on spring hydrograph analysis. Journal of Hydrology 303,152–164.
Maillet, E., 1905. Essais d‘hydraulique souterraine et fluviale.Hermann, Paris.
Mangin, A., 1975. Contribution a l‘etude hydrodynamique desaquiferes karstiques. These, Institut des Sciences de la Terre del‘Universite de Dijon.
Padilla, A., Pulido-Bosch, A., Mangin, A., 1994. Relative importanceof baseflow and quickflow from hydrographs of karst springs.Ground Water 32 (2), 267–277.
Rorabaugh, M.I., 1964. Changes in bank storage. Publication No. 63,IASH, Gentbrugge, 432–441.
Sauter, M., 1992. Quantification and forecasting of regionalgroundwater flow and transport in a karst aquifer (gallusquelle,malm, SW. Germany). Ph.D. thesis, University of Tubingen.
Shevenell, L., 1996. Analysis of well hydrographs in a karst aquifer:estimates of specific yields and continuum transmissivities.Journal of Hydrology 174, 331–355.
White, W.B., 1988. Geomorphology and hydrology of karst terrains.Oxford University Press, New York, 464p.