TITLE: A QUANTITATIVE RISK MANAGEMENT FRAMEWORK FOR DUST AND HYBRID MIXTURE EXPLOSIONS
DEPARTMENT OR SCHOOL: Process Engineering and Applied Science
DEGREE: PhD CONVOCATION: October YEAR: 2012
Permission is herewith granted to Dalhousie University to circulate and to have copied for non-commercial purposes, at its discretion, the above title upon the request of individuals or institutions. I understand that my thesis will be electronically available to the public. The author reserves other publication rights, and neither the thesis nor extensive extracts from it may be printed or otherwise reproduced without the author’s written permission. The author attests that permission has been obtained for the use of any copyrighted material appearing in the thesis (other than the brief excerpts requiring only proper acknowledgement in scholarly writing), and that all such use is clearly acknowledged.
_______________________________ Signature of Author
iv
DEDICATION PAGE
To Father and Mother
v
TABLE OF CONTENTS
LIST OF TABLES viii
LIST OF FIGURES xii
ABSTRACT xvii
LIST OF ABBREVIATIONS AND SYMBOLS USED xviii
ACKNOWLEDGMENTS xxiv
CHAPTER 1 INTRODUCTION 1
1.1 THESIS OVERVIEW 1
1.2 DEFINITIONS and TERMINOLOGY 4
1.3 SCOPE OF RESEARCH AND OBJECTIVES 5
1.4 QUALITATIVE AND QUANTITATIVE RISK ANALYSIS 6
1.5 DUST AND HYBRID MIXTURE EXPLOSIONS 8
1.5.1 Dust and hybrid mixture explosions in the process industries 10
1.5.2 Dust explosibility 11
1.5.3 Domino effect 12
1.5.4 Illustrative case histories of dust and hybrid mixture explosions 13
1.6 LEGISLATION AND DUST EXPLOSIONS 14
1.6.1 U.S. Occupational Safety & Health Administration (OSHA) 15
1.6.2 National Fire Protection Association (NFPA) 15
1.7 DUST AND HYBRID MIXTURE EXPLOSION PREVENTION, MITIGATION, AND CONTROL 16
1.7.1 The risk management process 17
1.8 ORIGINAL CONTRIBUTIONS OF THE RESEARCH 25
CHAPTER 2 BACKGROUND 26
2.1 INTRODUCTION 26
2.2 QUANTITATIVE RISK ASSESSMENT RESEARCH 26
vi
2.3 DUST EXPLOSION PREVENTION TOOLS 27
2.3.1 SCAP 27
2.3.2 Quantitative Risk Assessment methodology for industrial processes
handling dust 30
2.3.3 Dust explosion prevention and mitigation approach based on
Table 1.6 A hierarchical view of various means of preventing and mitigating dust explosions. 24
Table 3.1 Fatal accident rates in Australian industry. 57
Table 3.2 The decision matrix risk assessment technique. 60
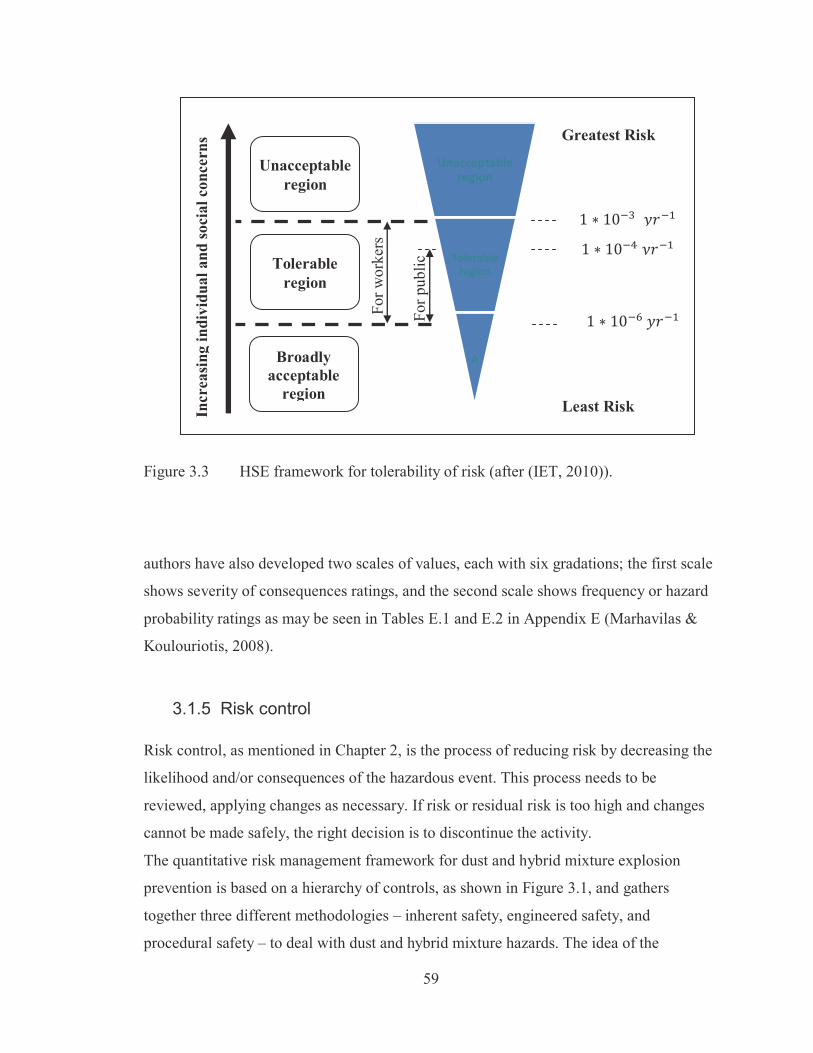
Table 3.3 Inherent safety checklist. 62
Table 4.1 20-L explosibility data for polyethylene/hybrid mixture samples. 68
Table 4.2 20-L explosibility data for icing sugar powder. 69
Table 4.3 20-L explosibility data for granulated sugar powder. 70
Table 4.4 DESC scenario input data for 400 m3 polyethylene silo geometry. 72
Table 4.5 The percent error of dust explosion Pmax between the experimental and DESC of different materials in 20-L chamber. 73
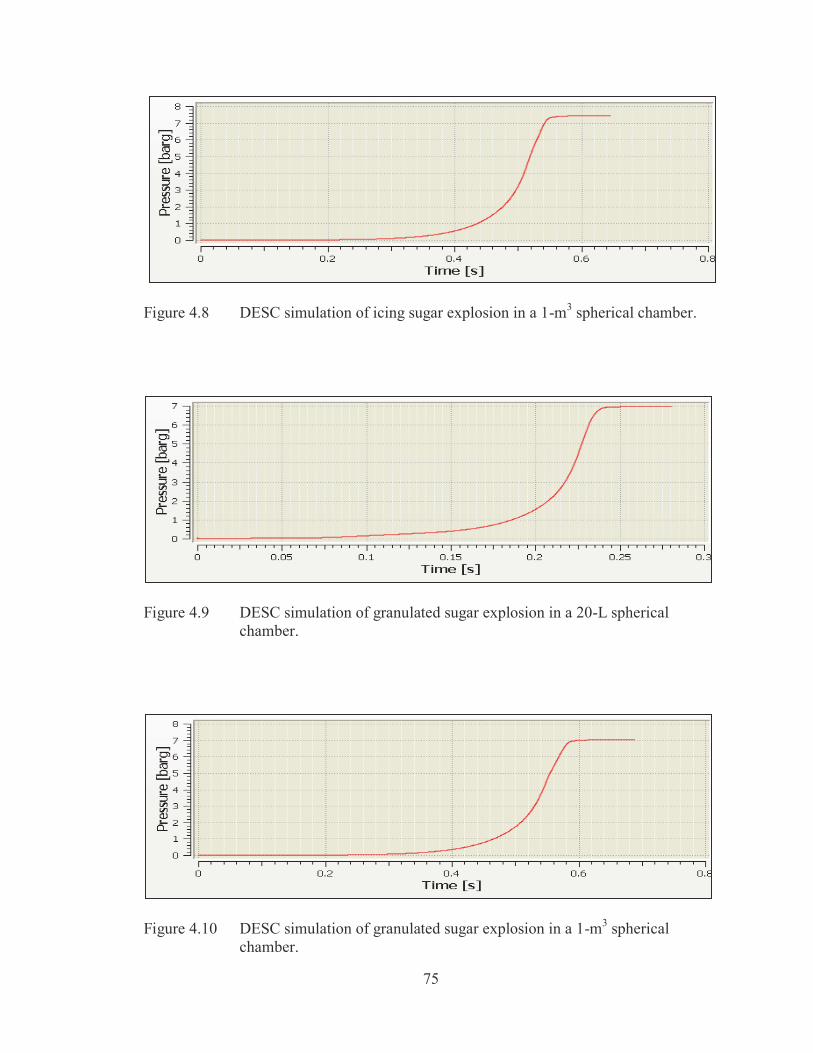
Table 4.6 Comparison between different materials at different explosion volumes in terms of DESC Pmax and tmax. 74
Table 5.1 The number of injured, deceased, and uninjured workers at the Imperial Sugar refinery explosion. 81
Table 5.2 Opening pressures values of pressure panels and their sizes in the Imperial Sugar refinery. 85
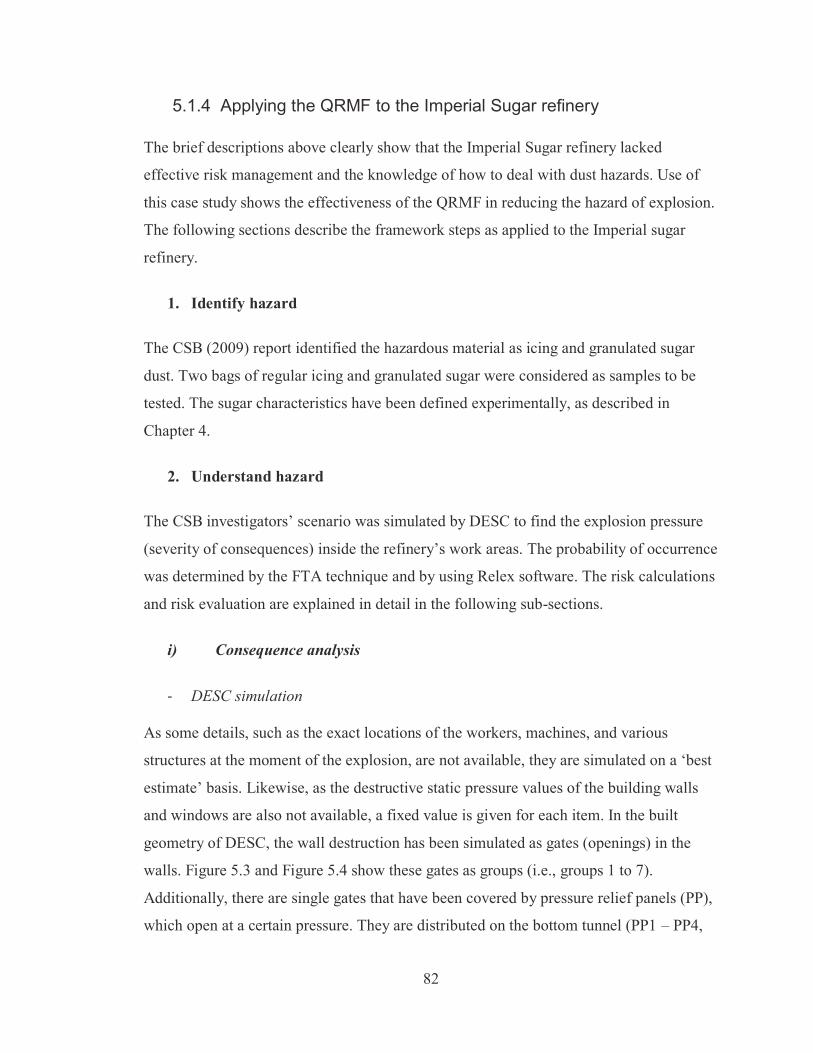
Table 5.3 DESC scenario input data for Imperial Sugar refinery geometry. 86
Table 5.4 Estimated Probit damage percentages caused by explosion 92
ix
overpressure of incident outcome cases at Module (2,1).
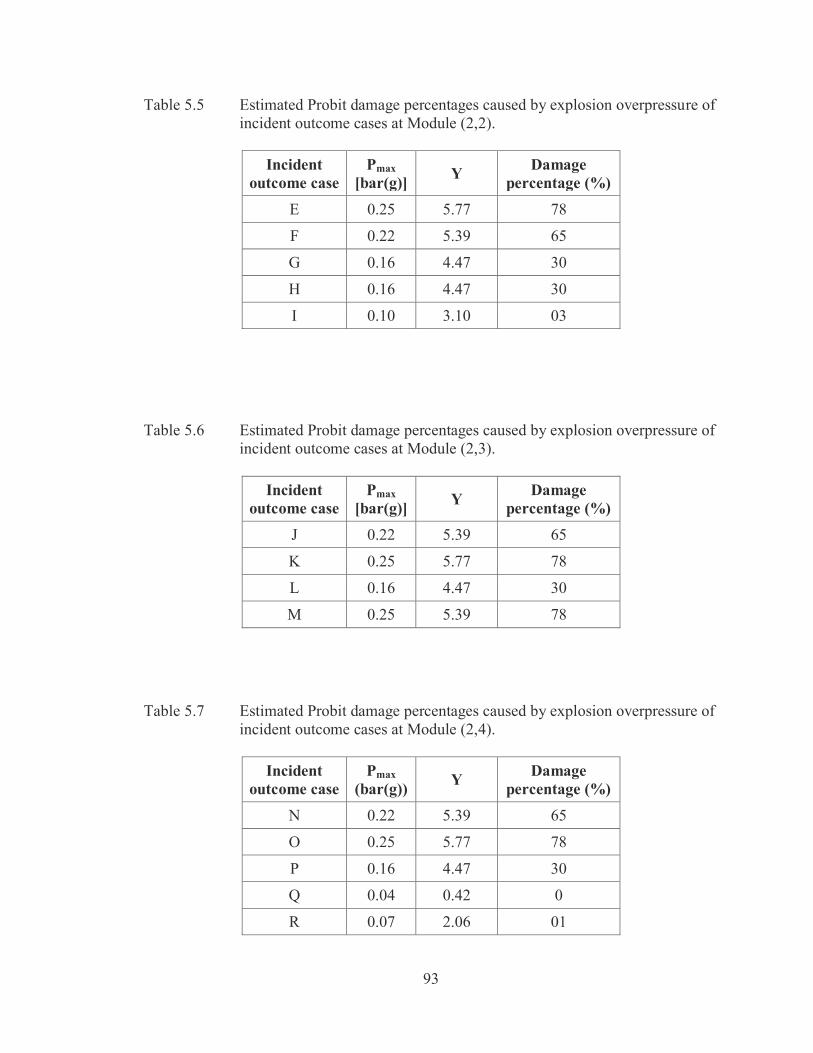
Table 5.5 Estimated Probit damage percentages caused by explosion overpressure of incident outcome cases at Module (2,2). 93
Table 5.6 Estimated Probit damage percentages caused by explosion overpressure of incident outcome cases at Module (2,3). 93
Table 5.7 Estimated Probit damage percentages caused by explosion overpressure of incident outcome cases at Module (2,4). 93
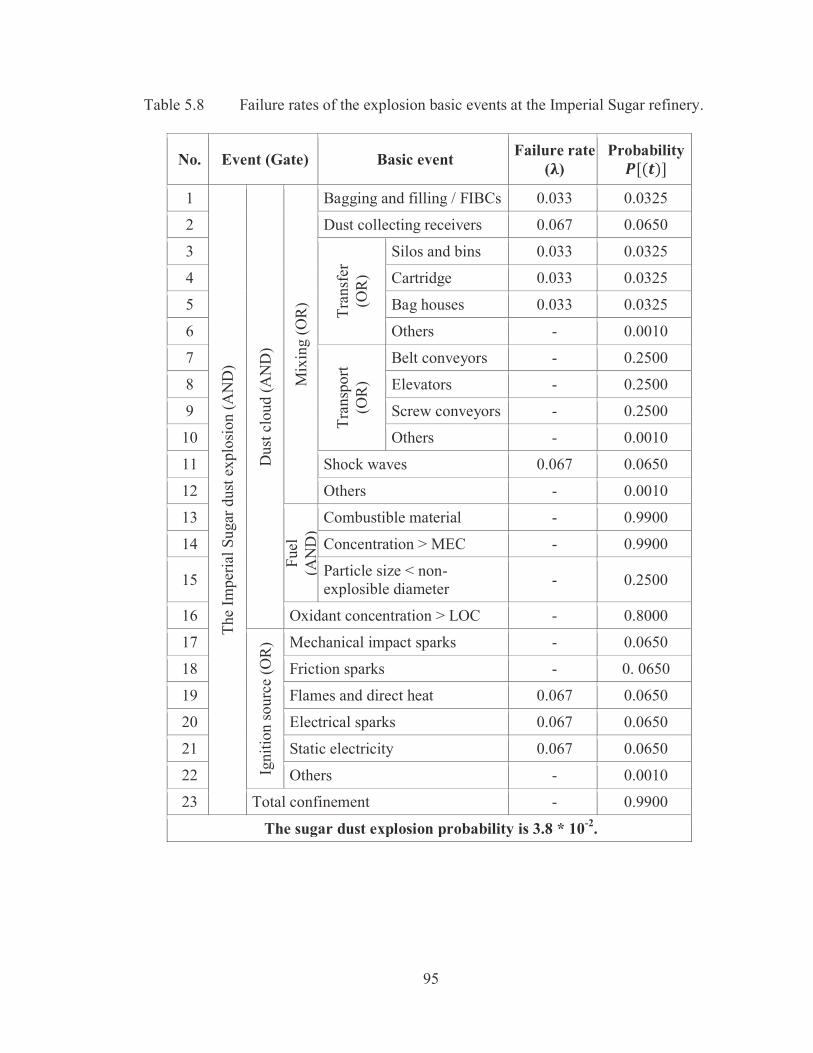
Table 5.8 Failure rates of the explosion basic events at the Imperial Sugar refinery. 95
Table 5.9 Individual risk calculations for the first floor, Module (2,1). 100
Table 5.10 Individual risk calculations for the second floor, Module (2,2). 101
Table 5.11 Individual risk calculations for the third floor, Module (2,3). 101
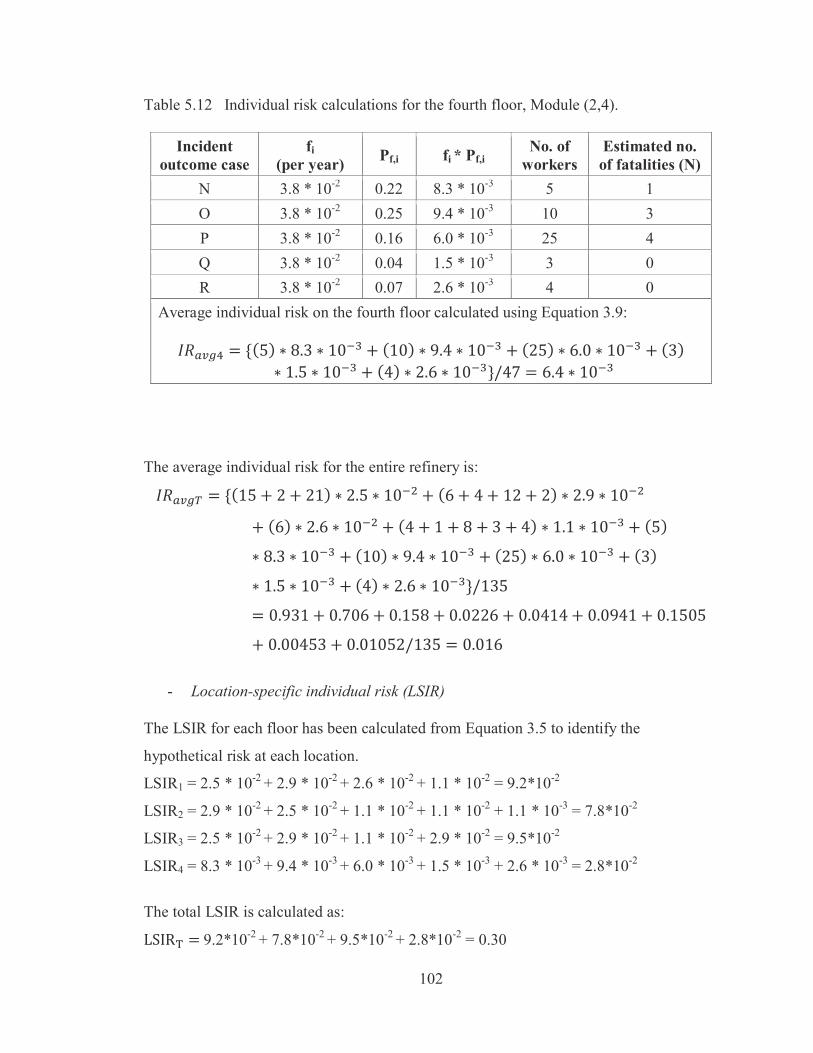
Table 5.12 Individual risk calculations for the fourth floor, Module (2,4). 102
Table 5.13 Estimated number of fatalities at each frequency of the incident outcome cases. 104
Table 5.14 Cumulative frequency data for F-N curve of the Imperial Sugar refinery explosion. 104
Table 5.15 Summary of the individual risk results for the Imperial Sugar refinery explosion, before applying the QRMF. 105
Table 5.16 Applying inherent safety principles on the units, and wrong actions that contributed to the Imperial Sugar refinery explosion. 107
Table 5.17 Opening pressure values of pressure panels and their sizes in the Imperial Sugar refinery, after applying the QRMF. 108
Table 5.18 Estimated Probit damage percentages caused by explosion overpressure of incident outcome cases in the simulated refinery. 114
Table 5.19 The estimated failure rate of the explosion’s basic events at the Imperial Sugar refinery before and after applying the QRMF. 115
Table 5.20 Individual risk calculations after applying the QRMF for the first floor. 120
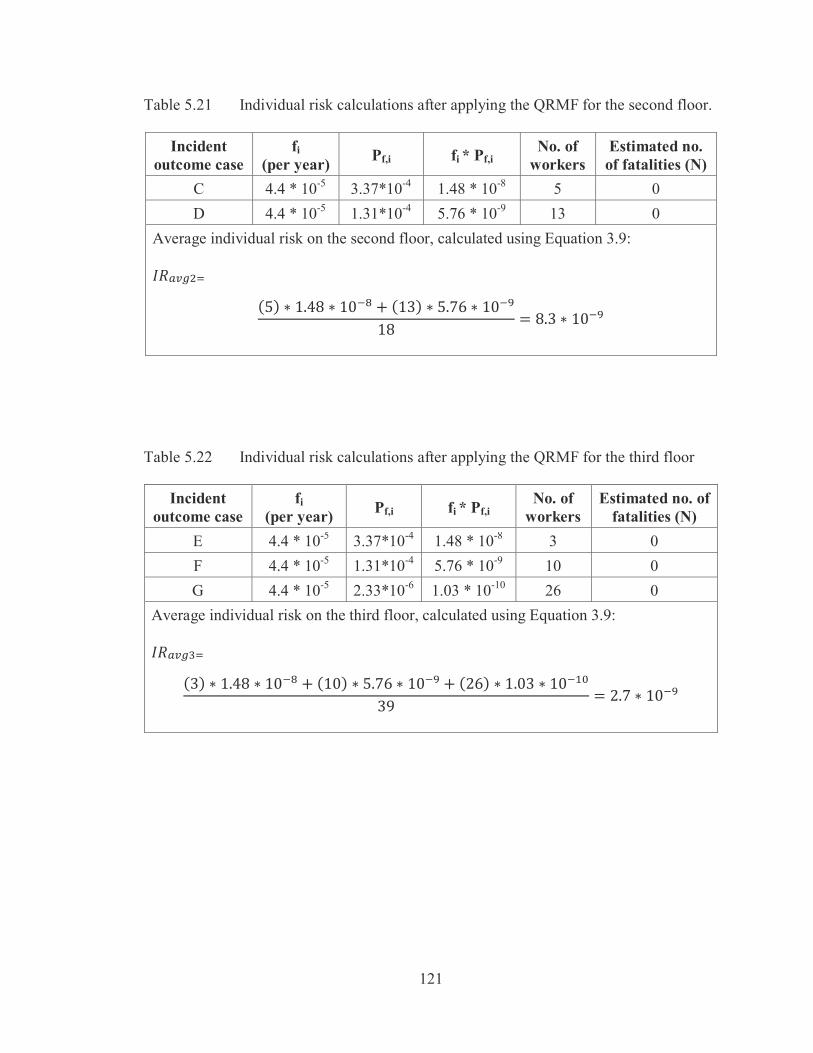
Table 5.21 Individual risk calculations after applying the QRMF for the second floor. 121
x
Table 5.22 Individual risk calculations after applying the QRMF for the third floor 121
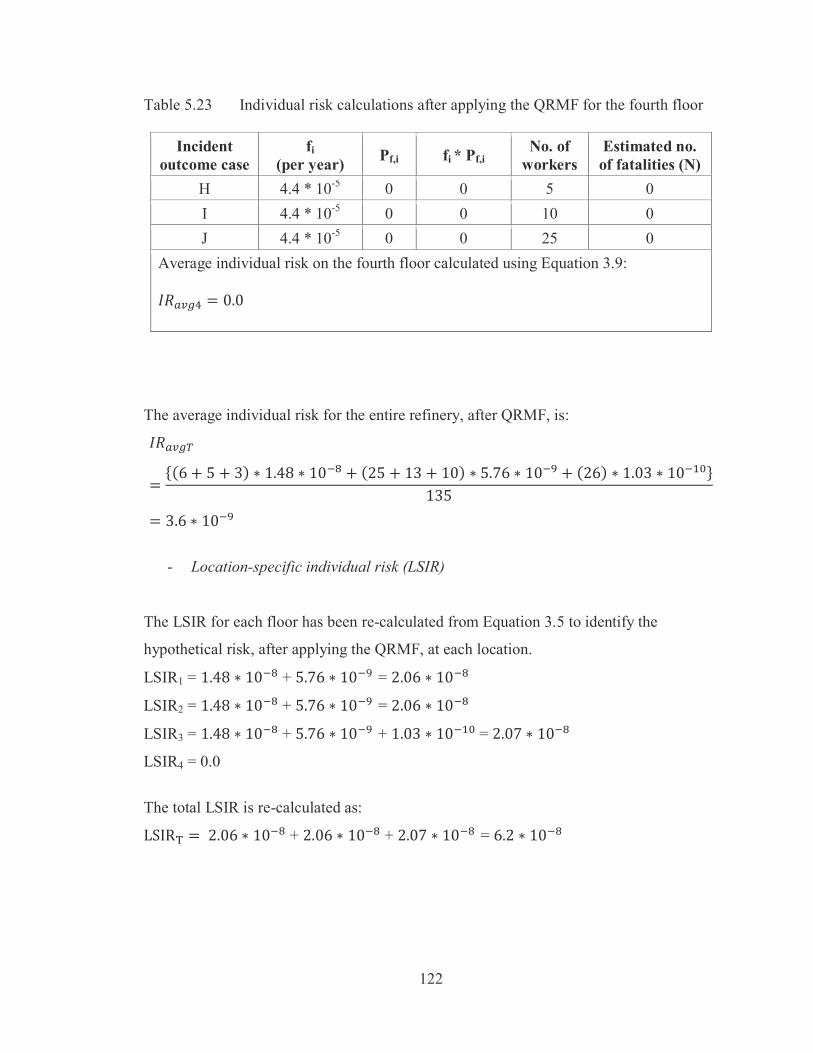
Table 5.23 Individual risk calculations after applying the QRMF for the fourth floor 122
Table 5.24 Summary of the individual risk results for the Imperial Sugar refinery explosion. 124
Table 5.25 The number of injured, deceased and uninjured people at the storage grain silo explosion. 128
Table 5.26 Opening pressure values of pressure panels and their sizes in the Semabla storage silo. 131
Table 5.27 DESC scenario input data for Semabla silo geometry. 133
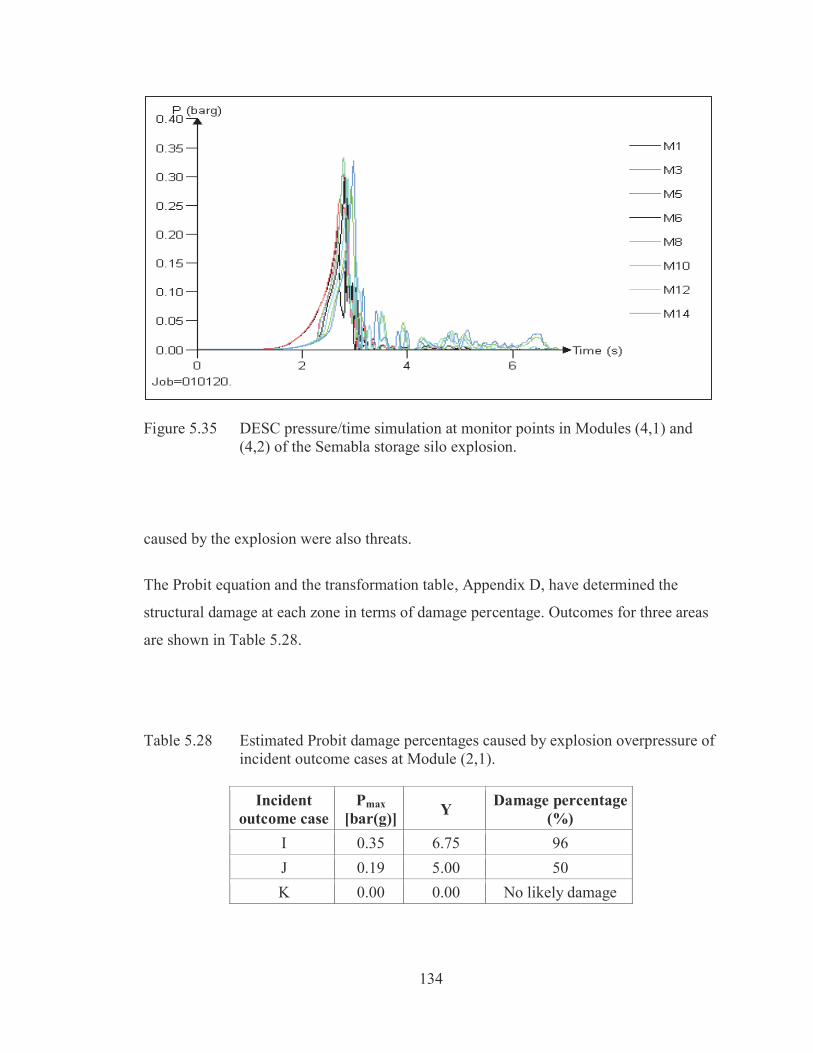
Table 5.28 Estimated Probit damage percentages caused by explosion overpressure of incident outcome cases at Module (2,1). 134
Table 5.29 Individual risk calculations for the Semabla silo, Module (4,1). 141
Table 5.30 Cumulative frequency data for the F-N curve of the Semabla explosion. 142
Table 5.31 Cumulative frequency data for F-N curve of the Semabla explosion. 143
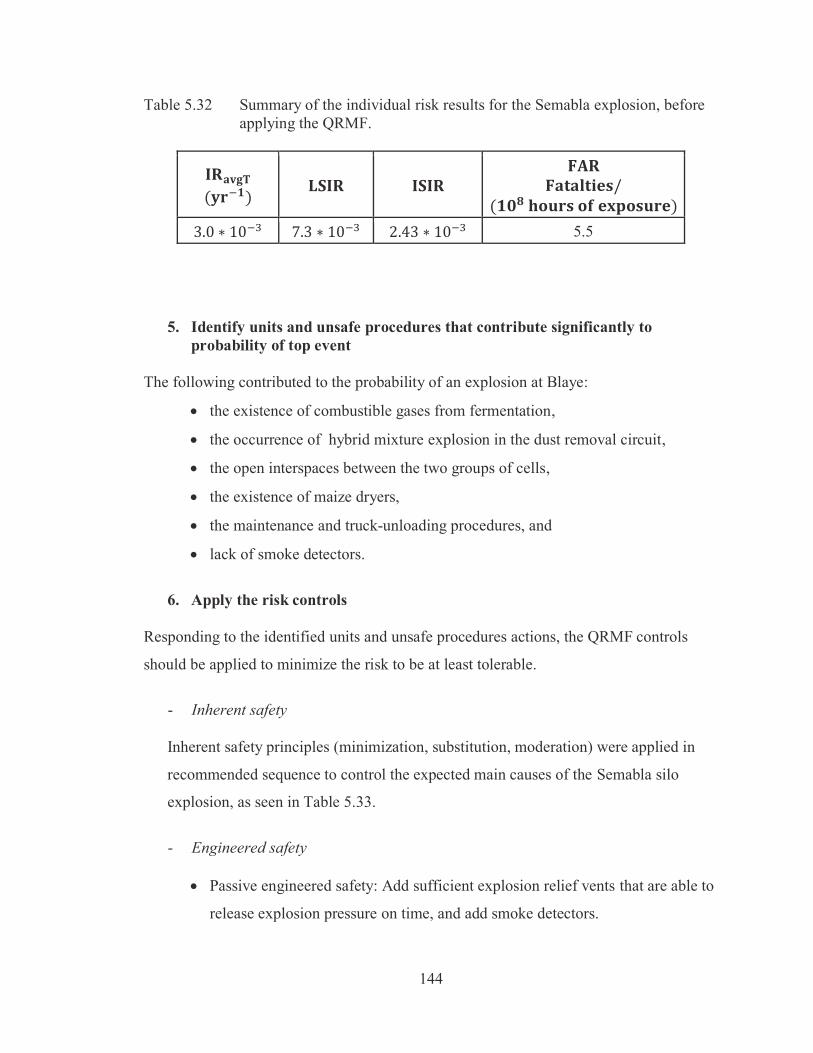
Table 5.32 Summary of the individual risk results for the Semabla explosion, before applying the QRMF. 144
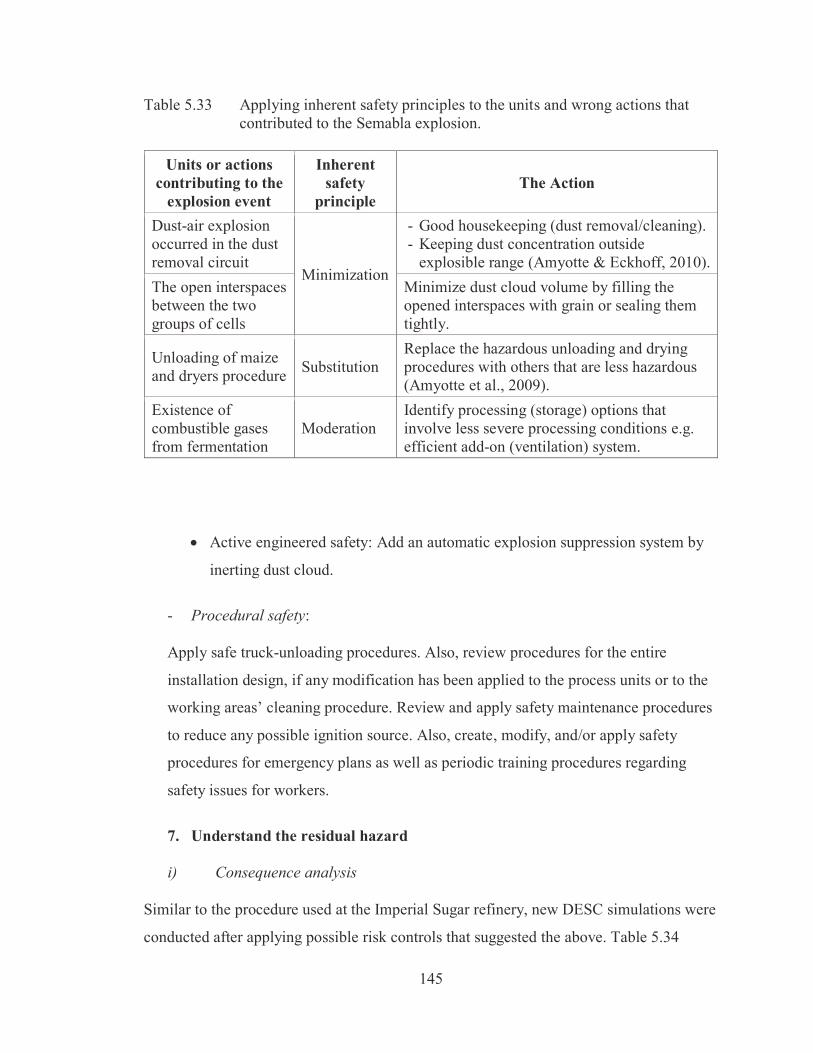
Table 5.33 Applying inherent safety principles to the units and wrong actions that contributed to the Semabla explosion. 145
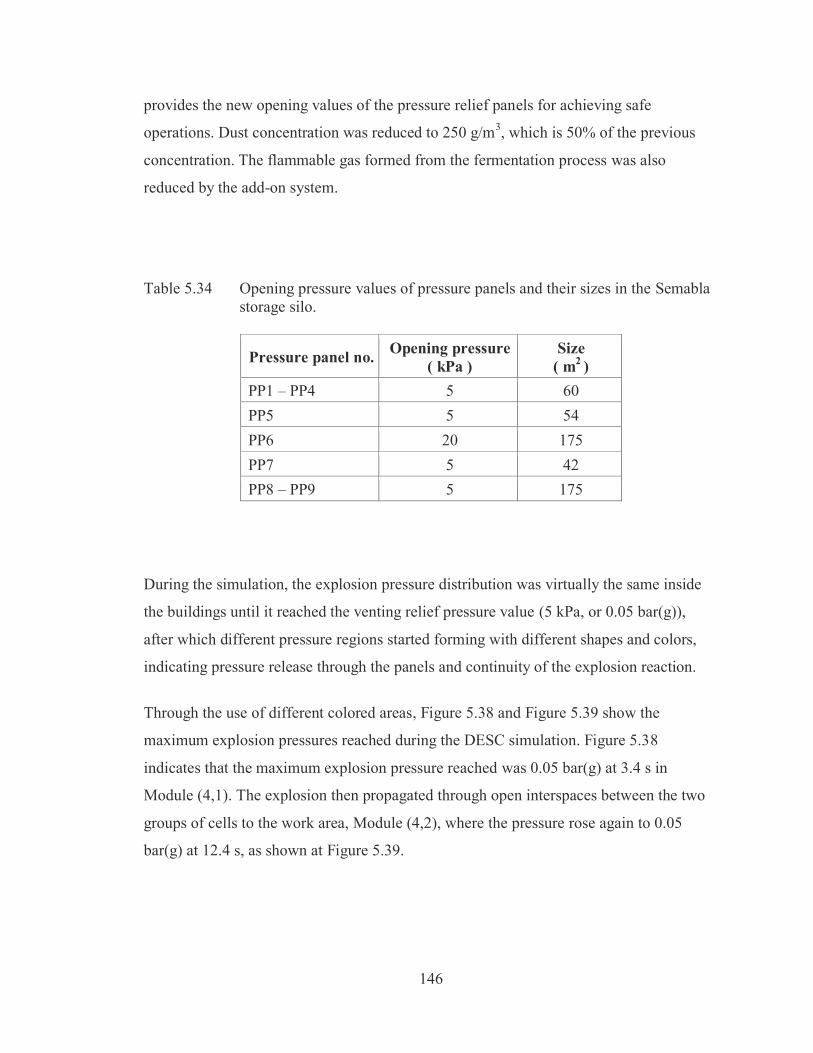
Table 5.34 Opening pressures values of pressure panels and their sizes in the Semabla storage silo. 146
Table 5.35 Estimated Probit damage percentages caused by explosion overpressure of incident outcome cases in the simulated Semabla grain silo, after applying the QRMF. 149
Table 5.36 Estimated failure rate of the explosion’s basic events at Semabla, before and after applying the QRMF. 150
Table 5.37 Individual risk calculations for the Semabla silo, Module (4,1). 156
Table 5.38 Summary of the individual risk results for the Semabla storage silo explosion. 157
xi
Table 5.39 Potential dust explosion scenarios for case study. 158
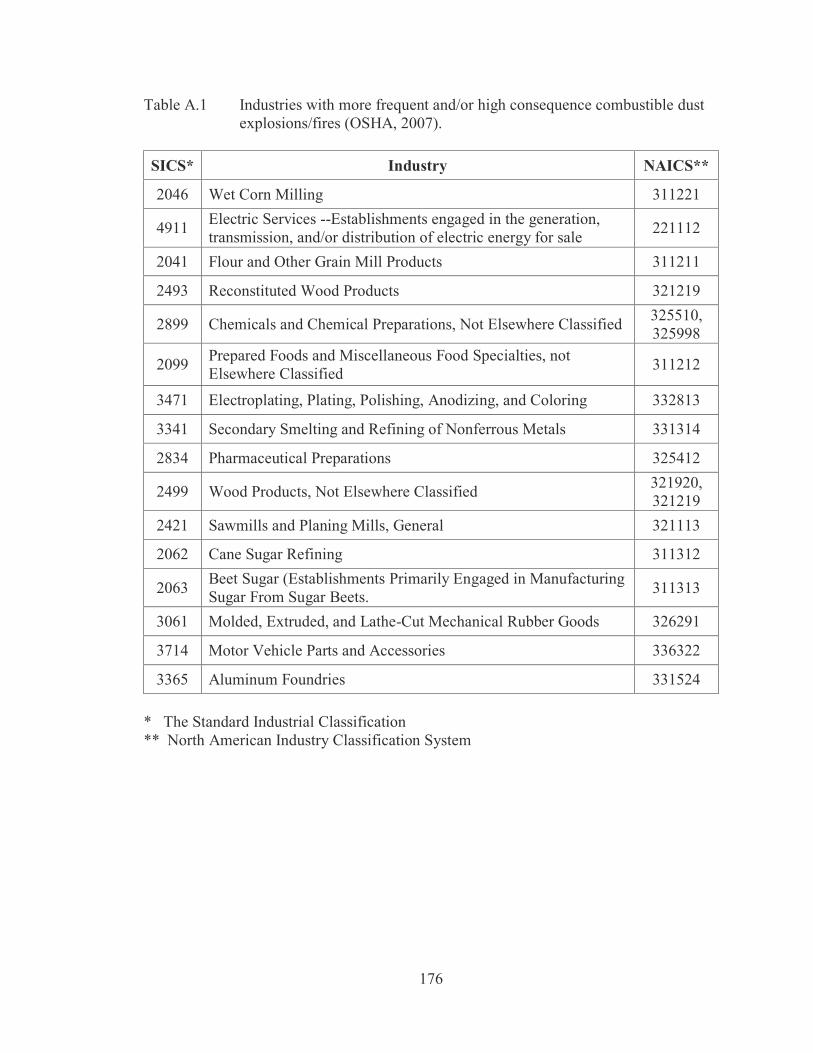
Table A.1 Industries with more frequent and/or high consequence combustible dust explosions / fires. 176
Table A.2 Industries that may have combustible dusts. 177
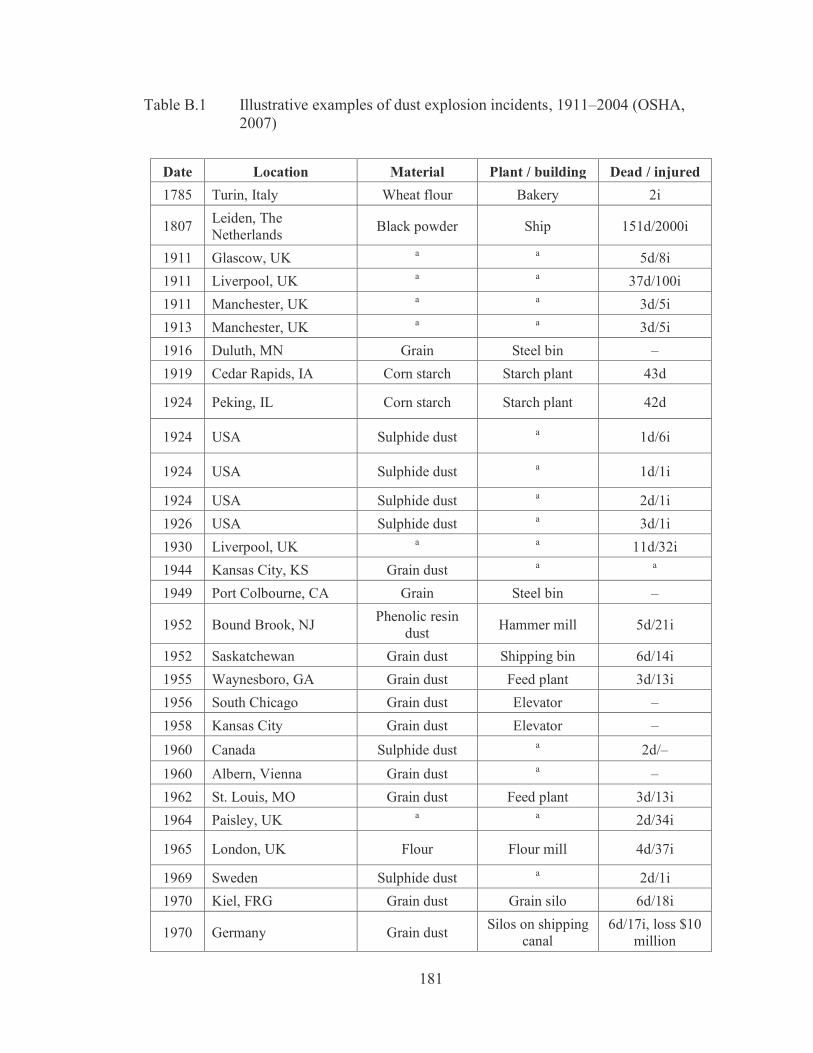
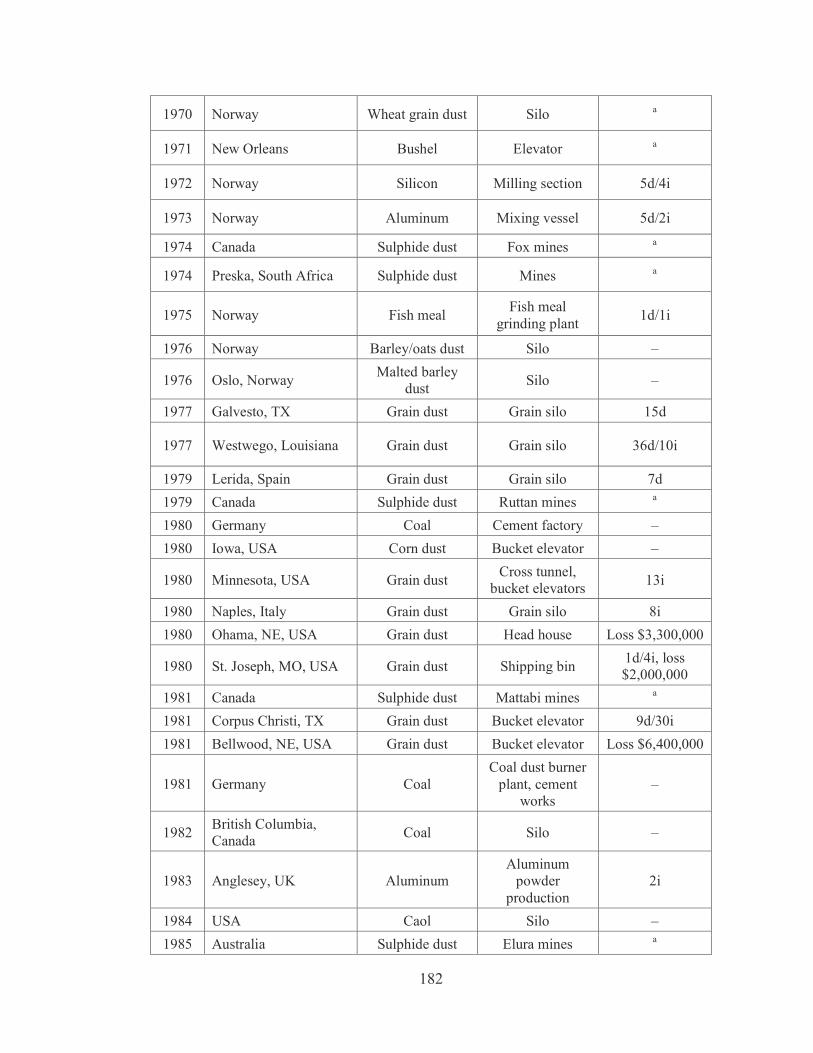
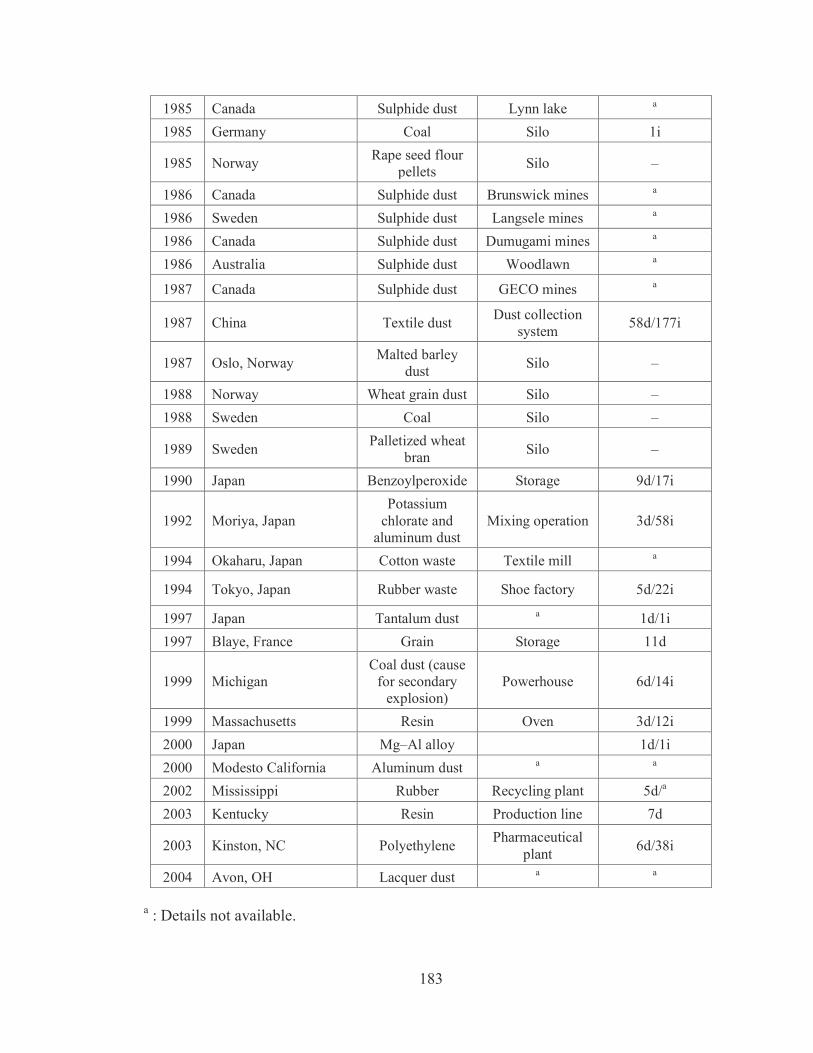
Table B.1 Illustrative examples of dust explosion incidents, 1911–2004. 181
Table C.1 Process Safety Management elements. 185
Table D.1 Probit correlations for a variety of exposures (the causative variable is representative of the magnitude of the exposure). 187
Table D.2 Transformation from percentages to Probits. 188
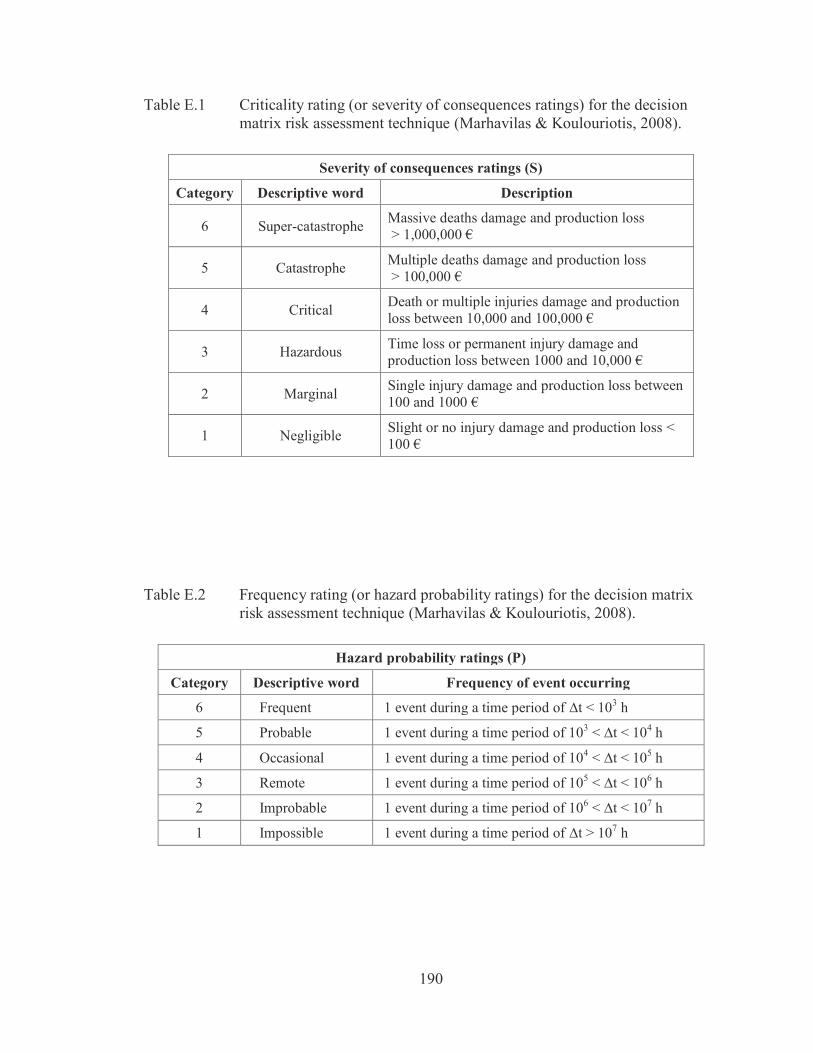
Table E.1 Criticality rating (or severity of consequences ratings) for the decision matrix risk assessment technique. 190
Table E.2 Frequency rating (or hazard probability ratings) for the decision matrix risk assessment technique. 190
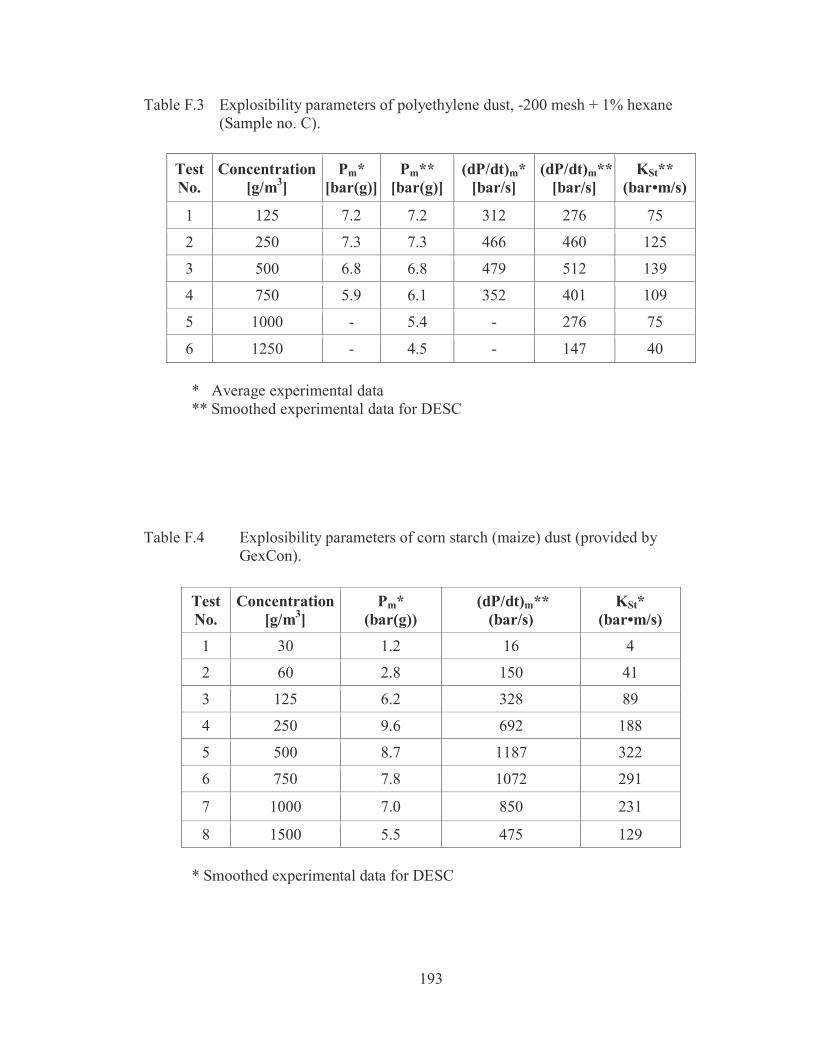
Table F.4 Explosibility parameters of corn starch (maize) dust (provided by GexCon). 193
xii
LIST OF FIGURES
Figure 1.1 Thesis overview. 3
Figure 1.2 Overview of the QRM framework process. 7
Figure 1.3 The domino effect in dust explosions. 13
Figure 1.4 The risk management process. 18
Figure 1.5 Inherent safety is not an isolated change but, rather, part of a package of improvements needed by the process industries. 21
Figure 2.1 The SCAP algorithm. 28
Figure 2.2 Overview of the QRA tool. 31
Figure 2.3 Illustration of a fictional industrial facility, divided into groups of modules. 32
Figure 2.4 A systematic approach to loss prevention. 34
Figure 2.5 The fire triangle. 35
Figure 2.6 The fire triangle for dust. 35
Figure 2.7 The explosion pentagon. 35
Figure 2.8 3D plot showing flame propagation inside a typical module. 36
Figure 2.9 A Relex architect platform sample with fault tree data displayed. 39
Figure 3.1 A Quantitative Risk Management Framework for dust and hybrid mixture explosion prevention based on the hierarchy of controls. 42
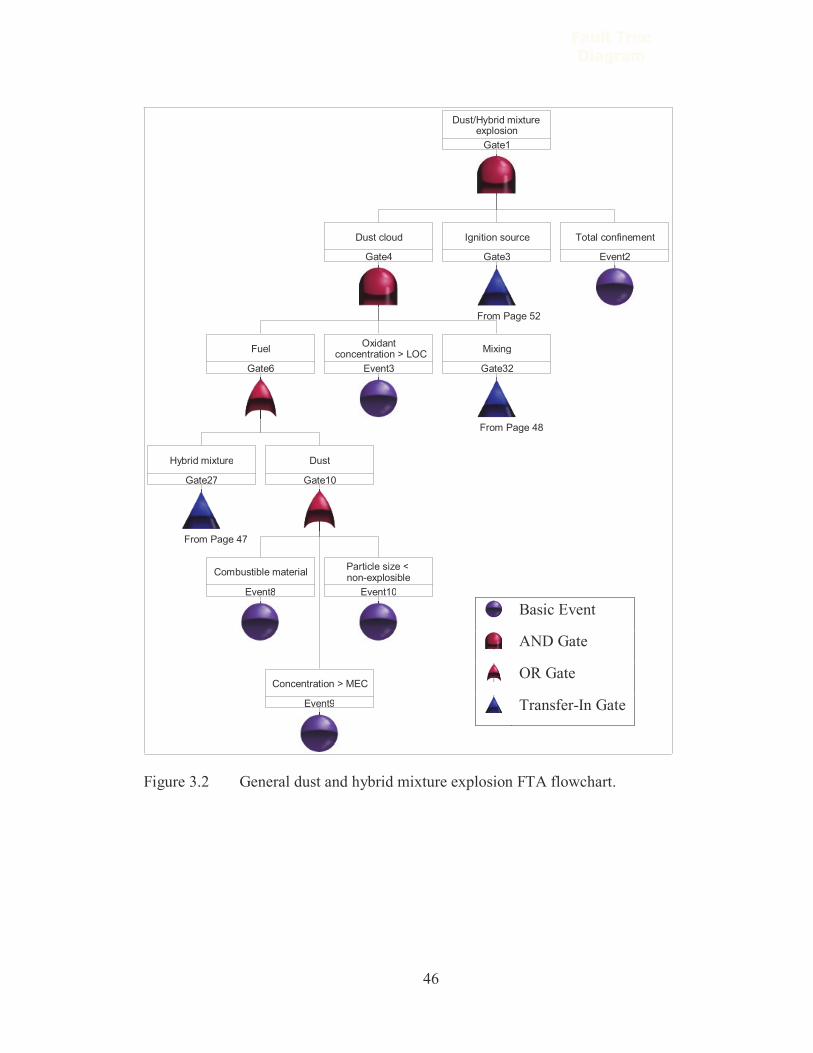
Figure 3.2 General dust and hybrid mixture explosion FTA flowchart. 46
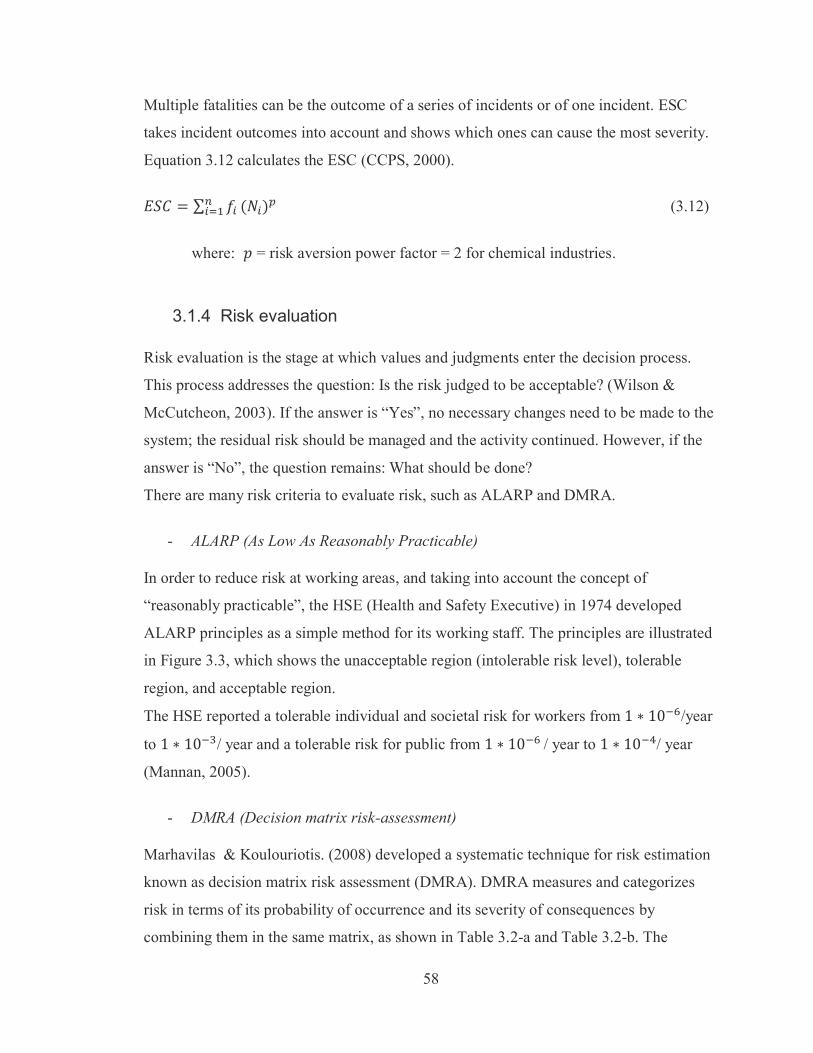
Figure 3.3 HSE framework for tolerability of risk. 59
Figure 3.4 An inherent safety-based management of change protocol. 63
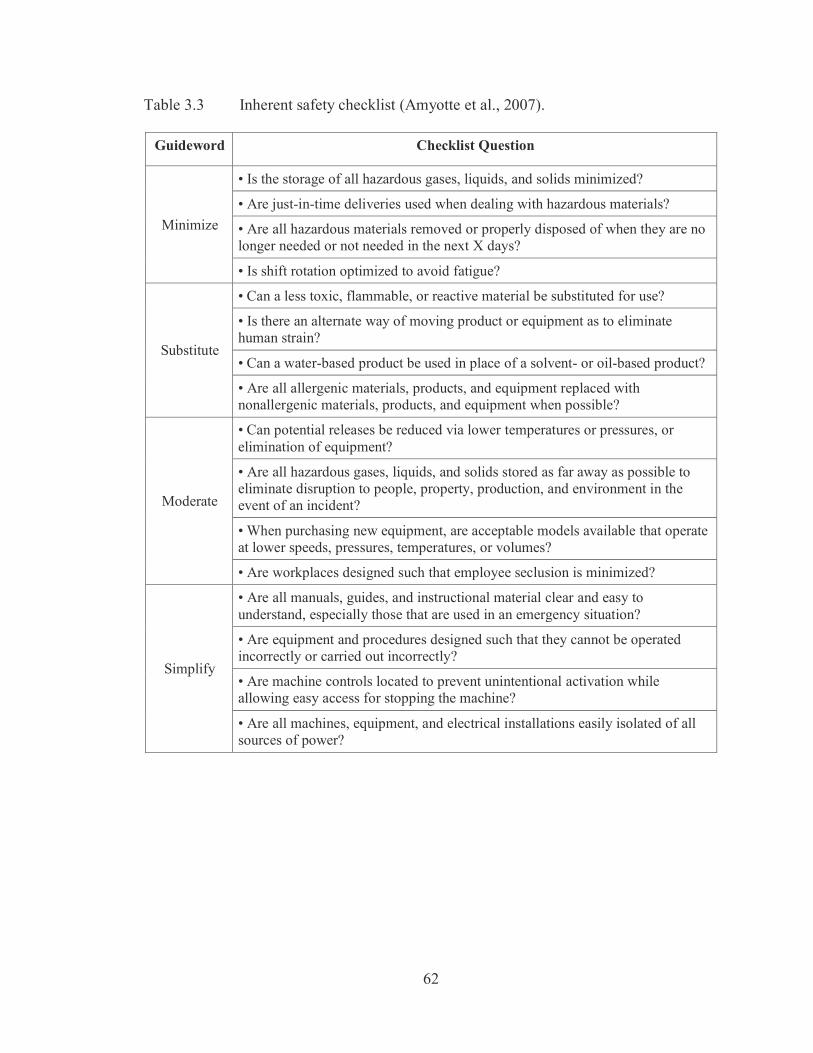
Figure 3.5 Flowchart for implementation of conceptual risk management framework for dust and hybrid mixture explosions. 64
Figure 4.1 Experimental, validation, and simulation link 66
Figure 4.2 Scheme of Siwek 20-L sphere. 67
xiii
Figure 4.3 KSEP pressure-time curve during polyethylene (-200 mesh) dust explosion in a 20-L chamber. 68
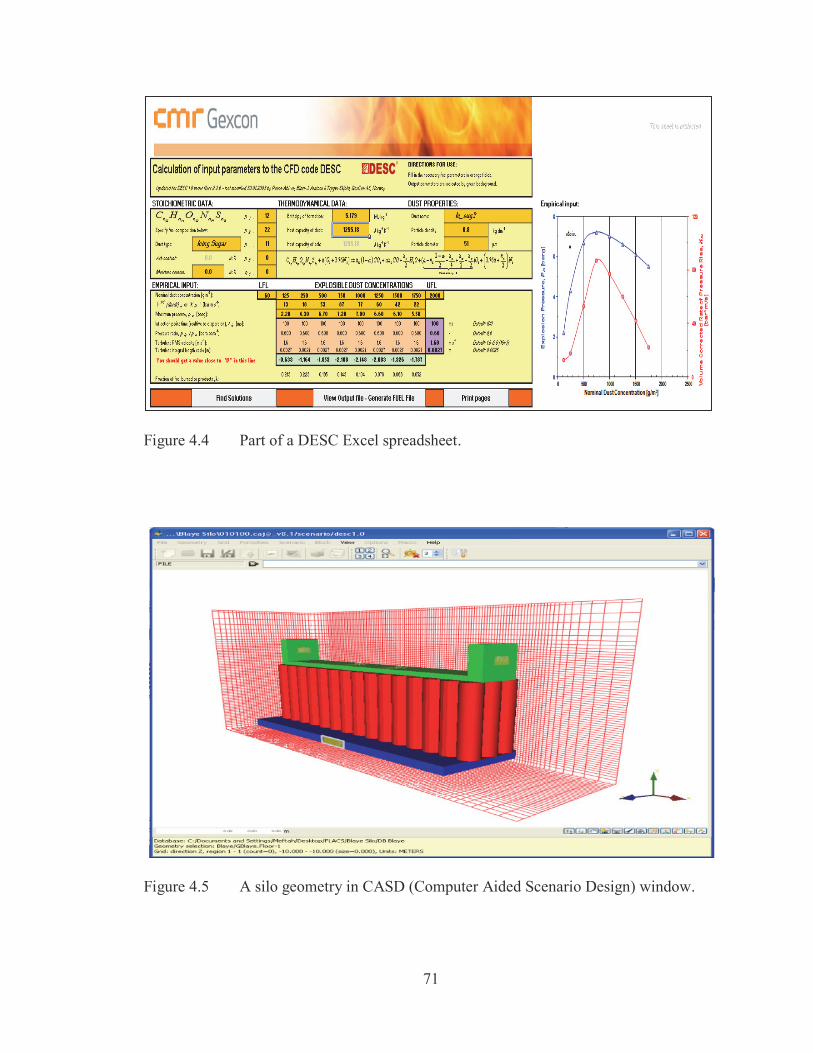
Figure 4.4 Part of a DESC Excel spreadsheet. 71
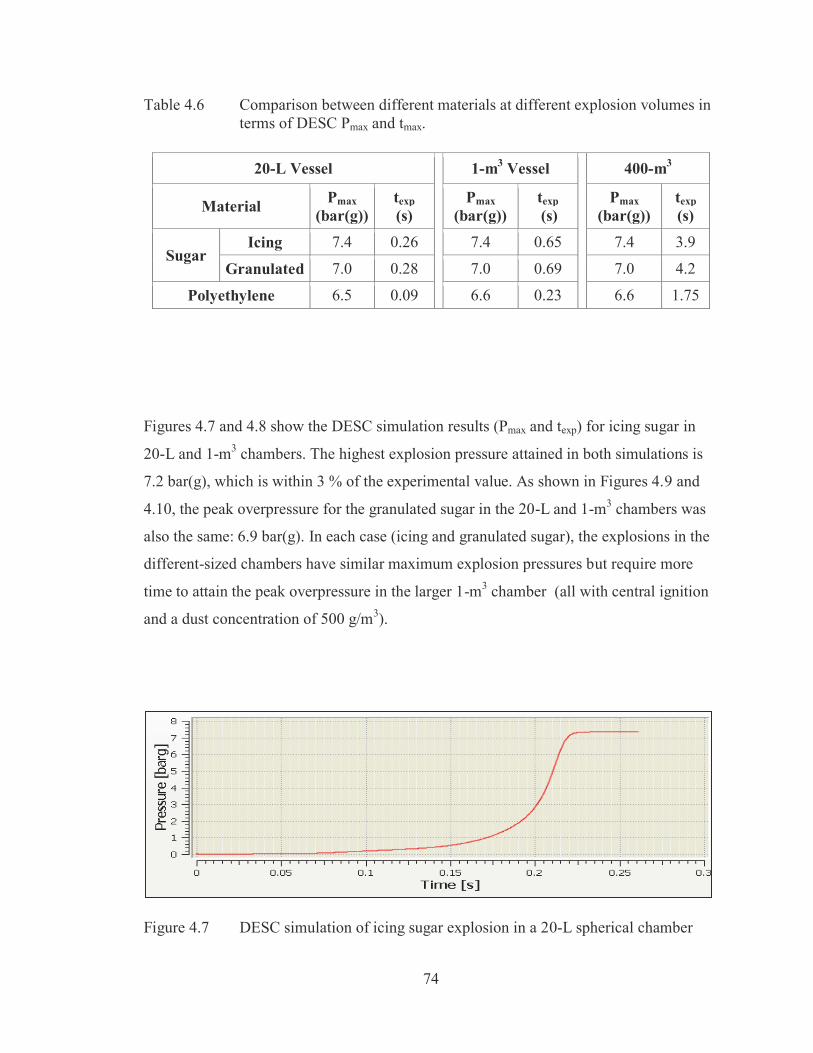
Figure 4.5 A silo geometry at CASD (Computer Aided Scenario Design) window. 71
Figure 4.6 DESC run manager window. 72
Figure 4.7 DESC simulation of an icing sugar explosion in a 20-L spherical chamber. 74
Figure 4.8 DESC simulation of an icing sugar explosion in a 1-m3 spherical chamber. 75
Figure 4.9 DESC simulation of a granulated sugar explosion in a 20-L spherical chamber. 75
Figure 4.10 DESC simulation of a granulated sugar explosion in a 1-m3 spherical chamber. 75
Figure 4.11 DESC simulation of an icing sugar explosion in a 400-m3 cylindrical silo without explosion vents. 76
Figure 4.12 DESC simulation of a granulated sugar explosion in a 400-m3 cylindrical silo without explosion vents. 76
Figure 4.13 DESC simulation of 48-μm polyethylene explosion in a 20-L spherical chamber. 77
Figure 5.1 Granulated sugar supply and discharge through the silos. 79
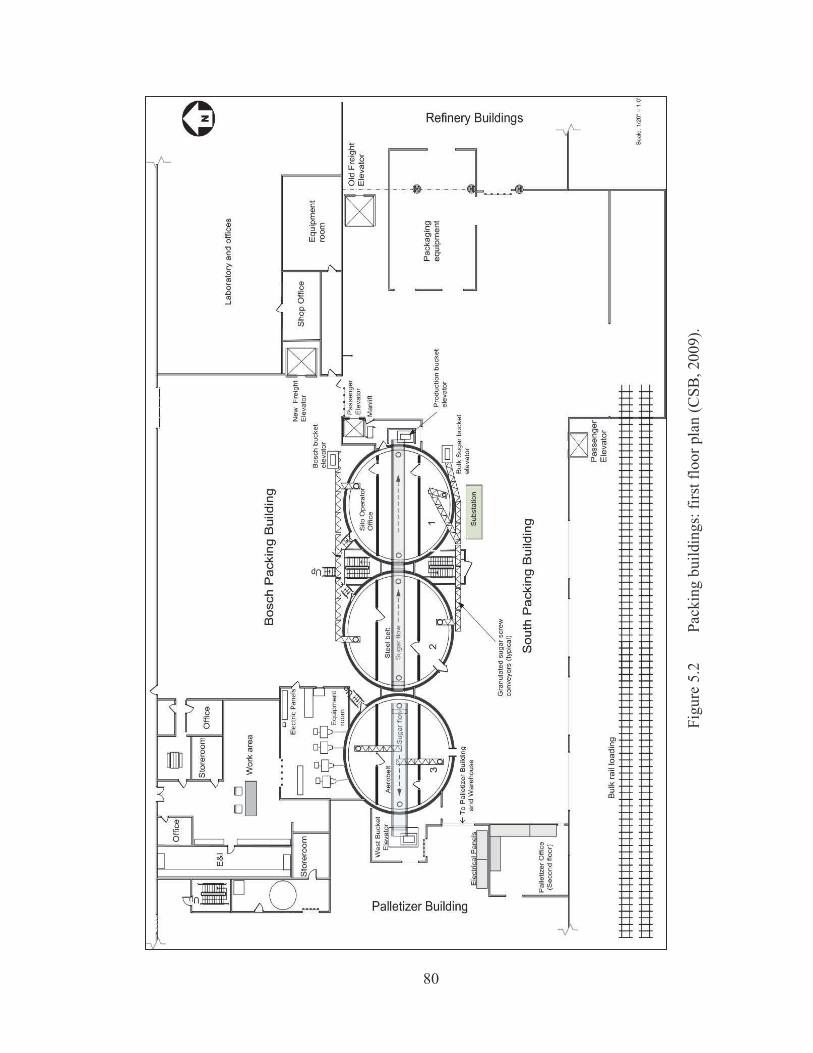
Figure 5.2 Packing buildings: first floor plan. 80
Figure 5.3 CASD image (3D front view) of the Imperial Sugar refinery with the pressure relief panels (PPs). 83
Figure 5.4 CASD image (3D back view) and grid cells of the Imperial Sugar refinery with the pressure relief panels (PPs). 83
Figure 5.5 Side view of the module distributions of the Imperial Sugar refinery geometry. 84
Figure 5.6 DESC representation of interconnected 3700-m3 silos and the monitoring points (M1 – M80) at the Imperial Sugar refinery. 86
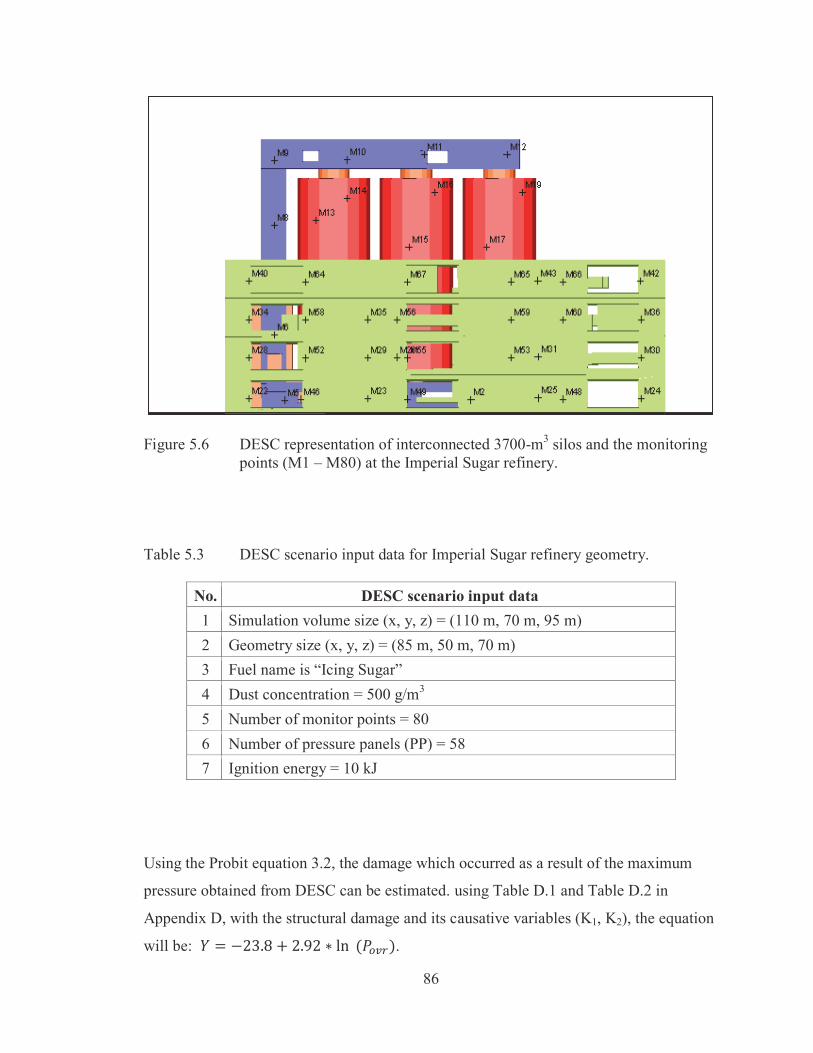
Figure 5.7 DESC pressure simulation from a plane view of the first floor, Module (2,1), of the Imperial Sugar refinery explosion. 87
xiv
Figure 5.8 DESC pressure simulation from a plane view of the second floor, Module (2,2), of the Imperial Sugar refinery explosion. 88
Figure 5.9 DESC pressure simulation from a plane view of the third floor, Module (2,3), of the Imperial Sugar refinery explosion. 88
Figure 5.10 DESC pressure simulation from a plane view of the fourth floor, Module (2,4), of the Imperial Sugar refinery explosion. 89
Figure 5.11 DESC pressure/time simulation at the monitor points on the first floor, Module (2,1), of the Imperial Sugar refinery explosion. 90
Figure 5.12 DESC pressure/time simulation at the monitor points on the second floor, Module (2,2), of the Imperial Sugar refinery explosion. 90
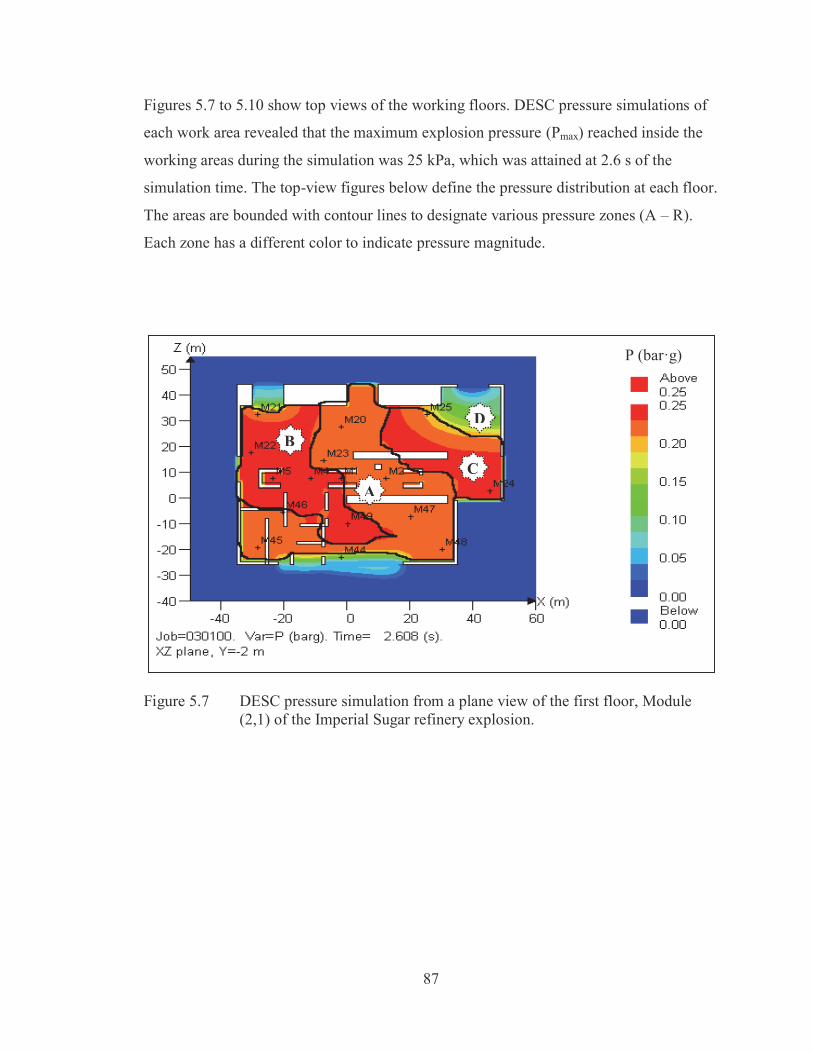
Figure 5.13 DESC pressure/time simulation at the monitor points on the third floor, Module (2,3), of the Imperial Sugar refinery explosion. 91
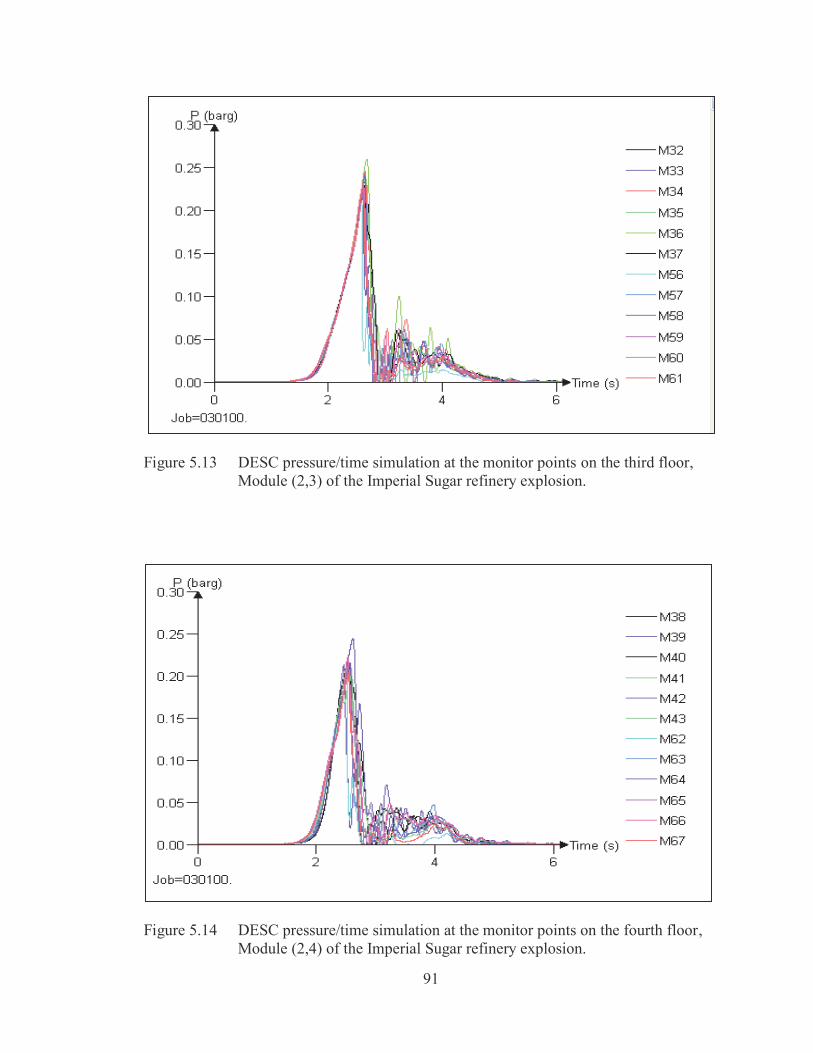
Figure 5.14 DESC pressure/time simulation at the monitor points on the fourth floor, Module (2,4), of the Imperial Sugar refinery explosion. 91
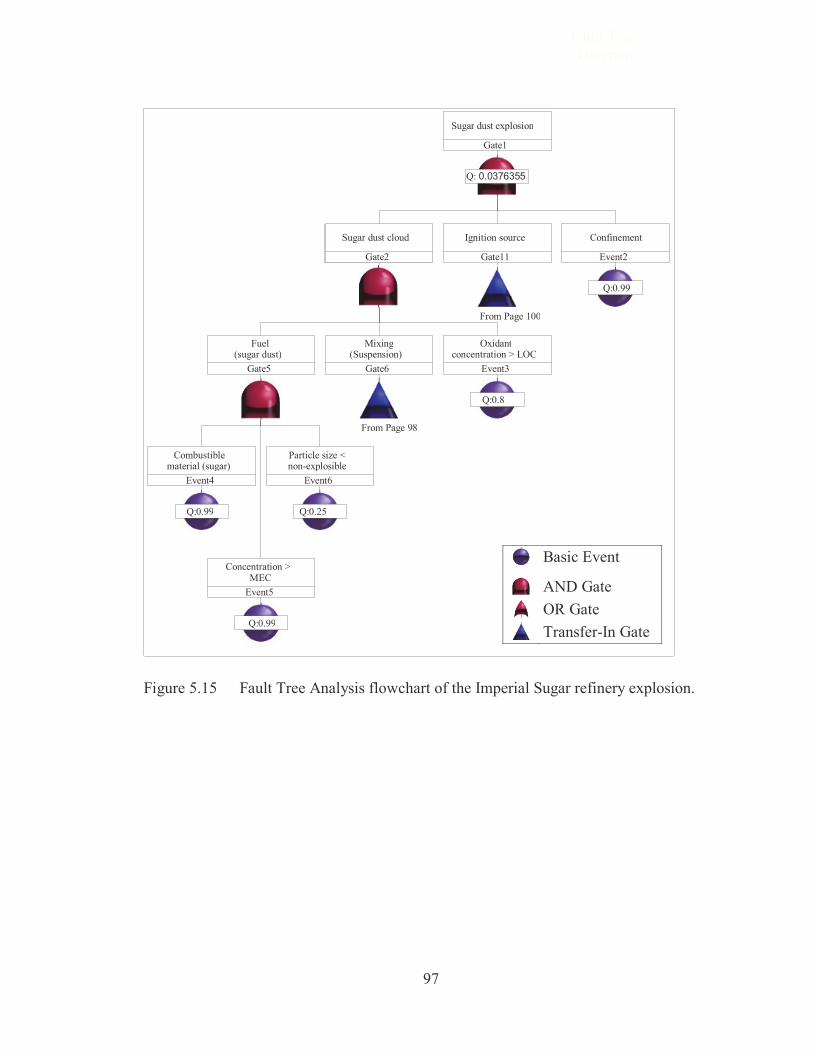
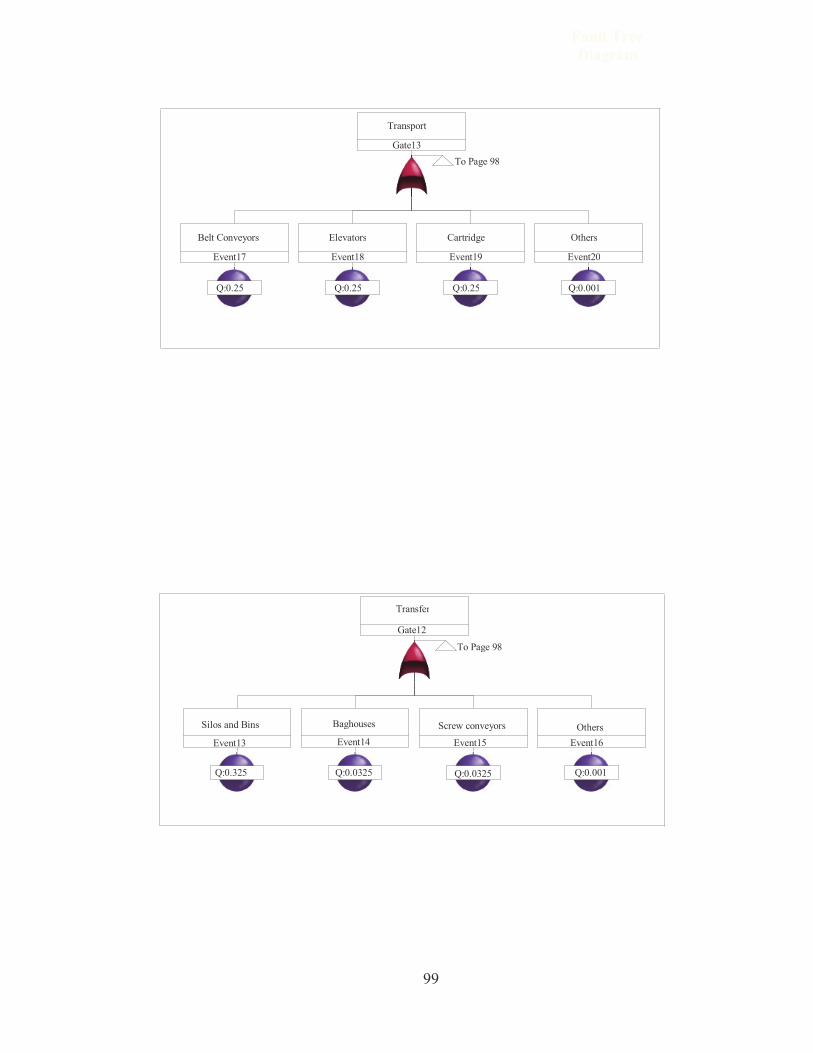
Figure 5.15 Fault Tree Analysis flowchart of the Imperial Sugar refinery explosion. 97
Figure 5.16 The estimated social risk F-N curve for the Imperial Sugar refinery before the explosion. 105
Figure 5.17 DESC pressure simulation from a plane view of the first floor, Module (2,1), of the Imperial Sugar refinery explosion, after applying the QRMF. 109
Figure 5.18 DESC pressure simulation from a plane view of the second floor, Module (2,2), of the Imperial Sugar refinery explosion, after applying the QRMF. 109
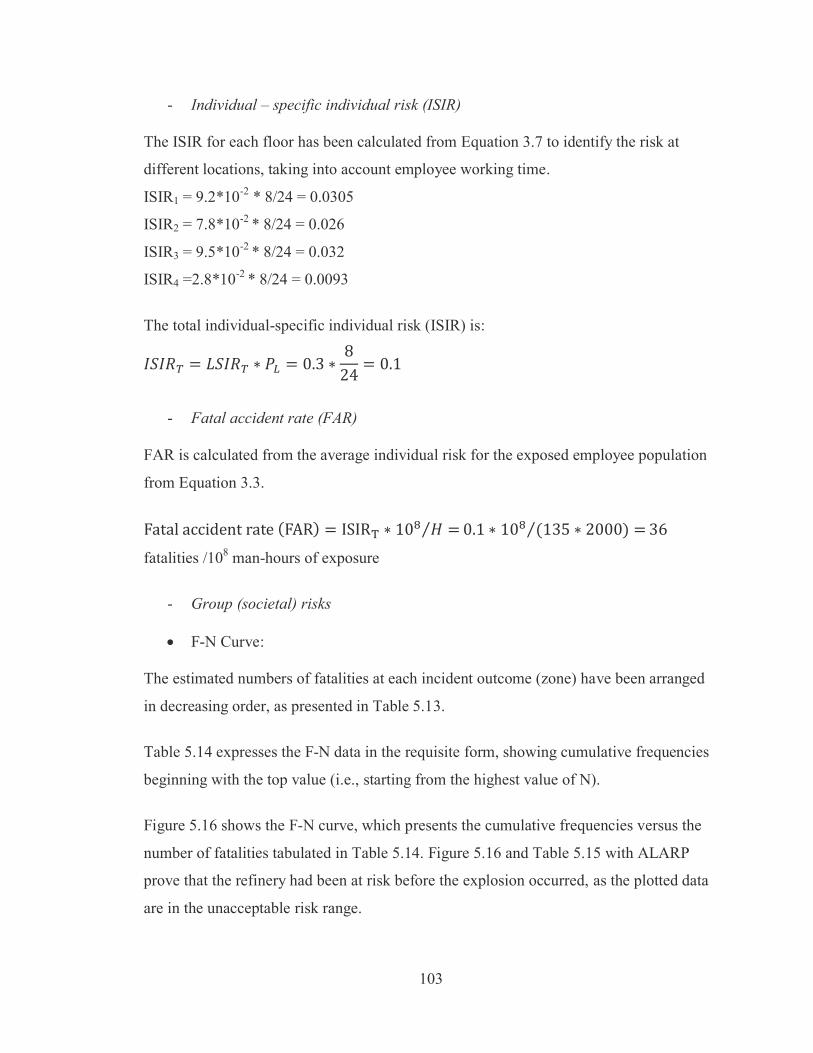
Figure 5.19 DESC pressure simulation from a plane view of the third floor, Module (2,3), of the Imperial Sugar refinery explosion, after applying the QRMF.
110
Figure 5.20 DESC pressure simulation on a plane view of the fourth floor, Module (2,4), of the Imperial Sugar refinery explosion after applying the QRMF. 110
Figure 5.21 DESC pressure/time simulation at monitor points on the first floor, Module (2,1), of the Imperial Sugar refinery explosion, after applying the QRMF. 111
Figure 5.22 DESC pressure/time simulation at monitor points on the second 112
xv
floor, Module (2,2), of the Imperial Sugar refinery explosion, after applying the QRMF.
Figure 5.23 DESC pressure / time simulation at the monitor points in the third floor, Module (2,3), of the Imperial Sugar refinery explosion, after applying the QRMF. 112
Figure 5.24 DESC pressure/time simulation at monitor points on the fourth floor, Module (2,4), of the Imperial Sugar refinery explosion, after applying the QRMF. 113
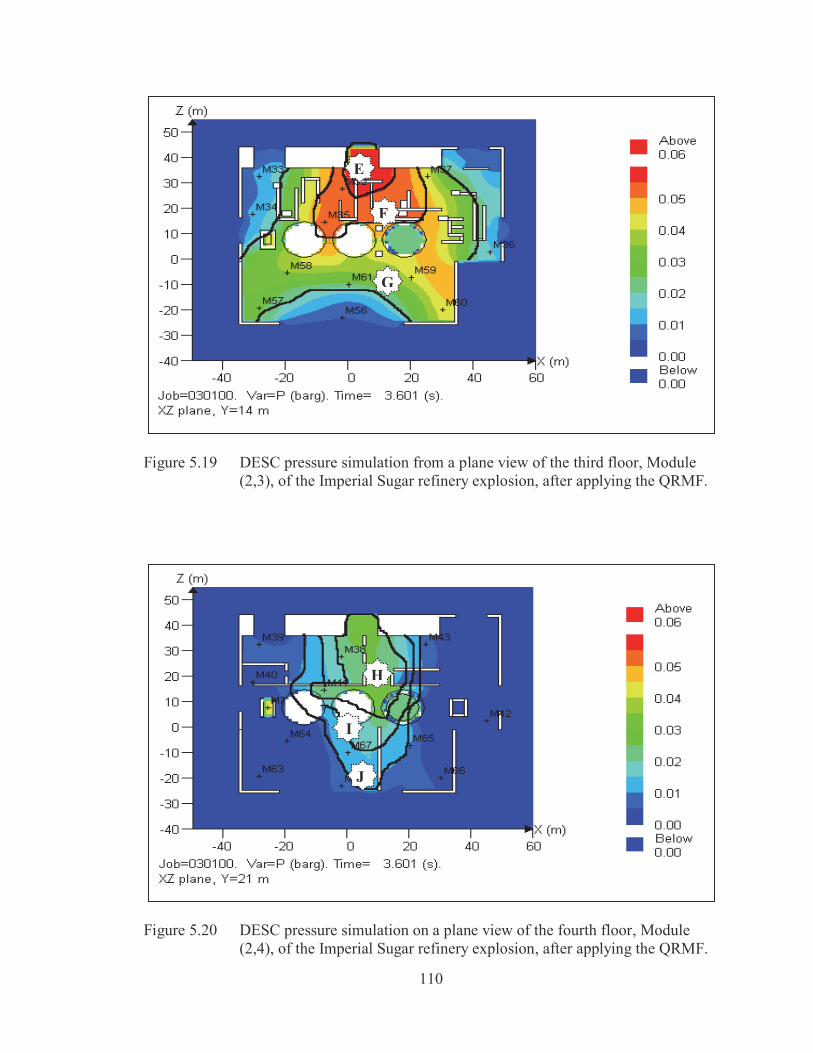
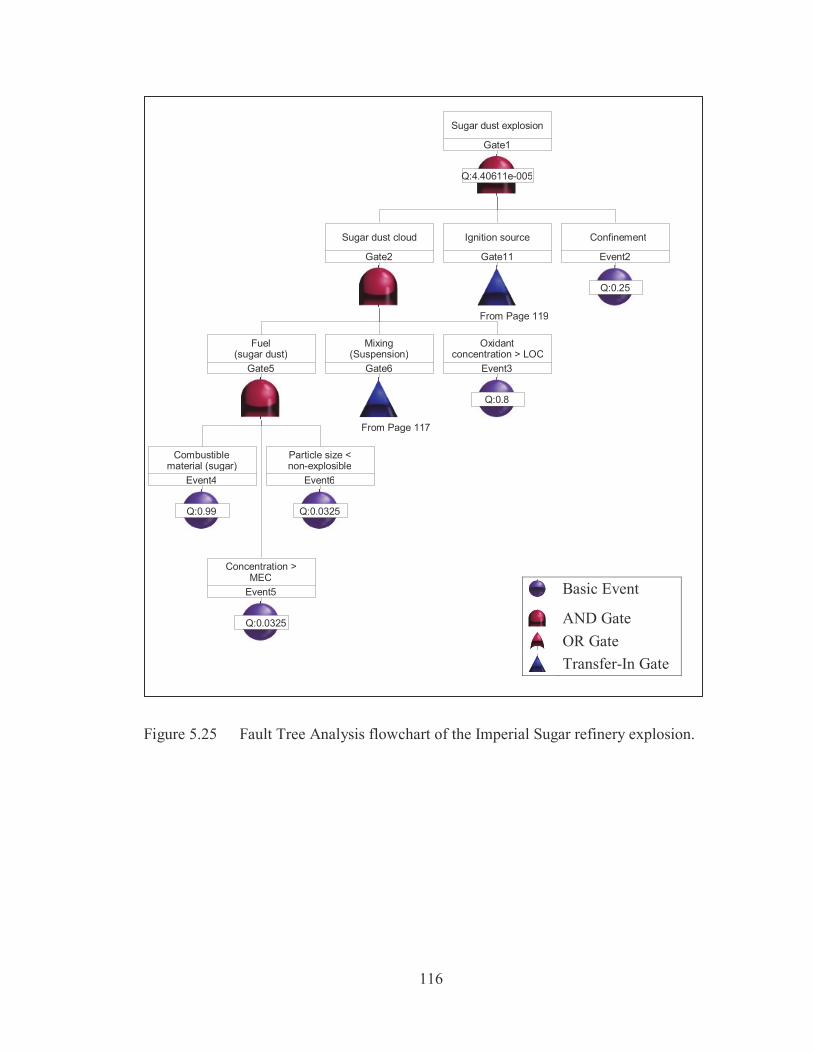
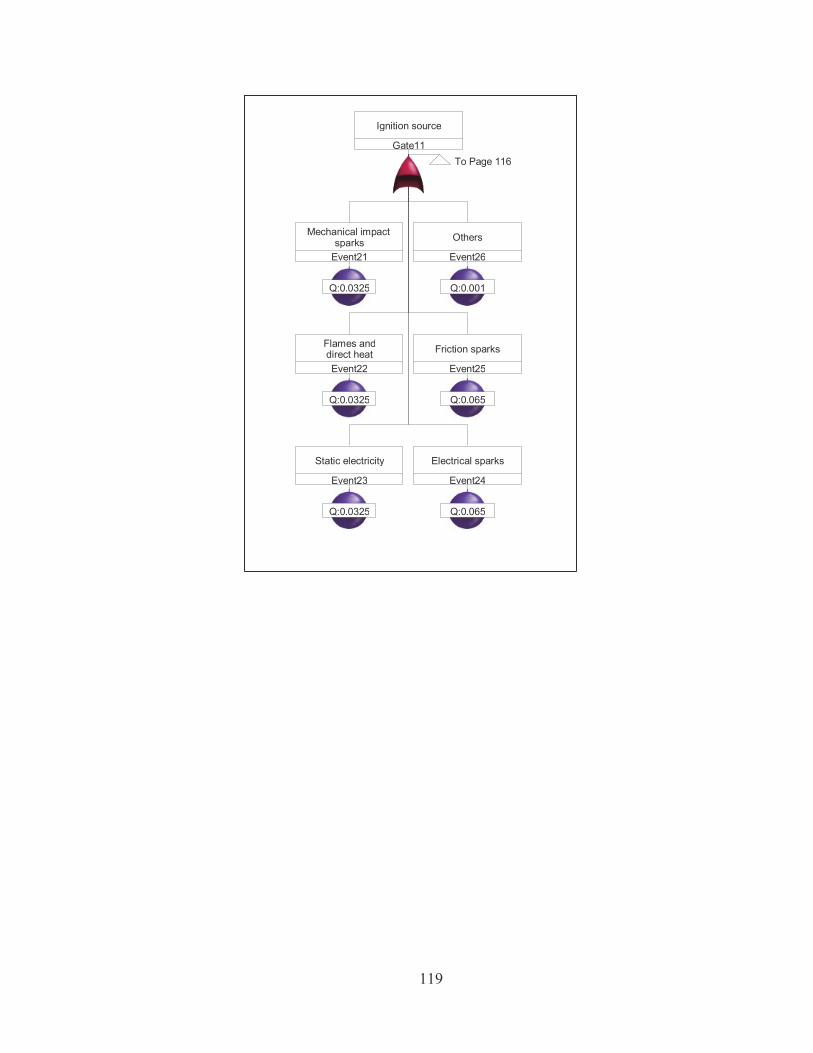
Figure 5.25 Fault Tree Analysis flowchart of the Imperial Sugar refinery explosion. 116
Figure 5.26 HSE frameworks for tolerability of risk. 124
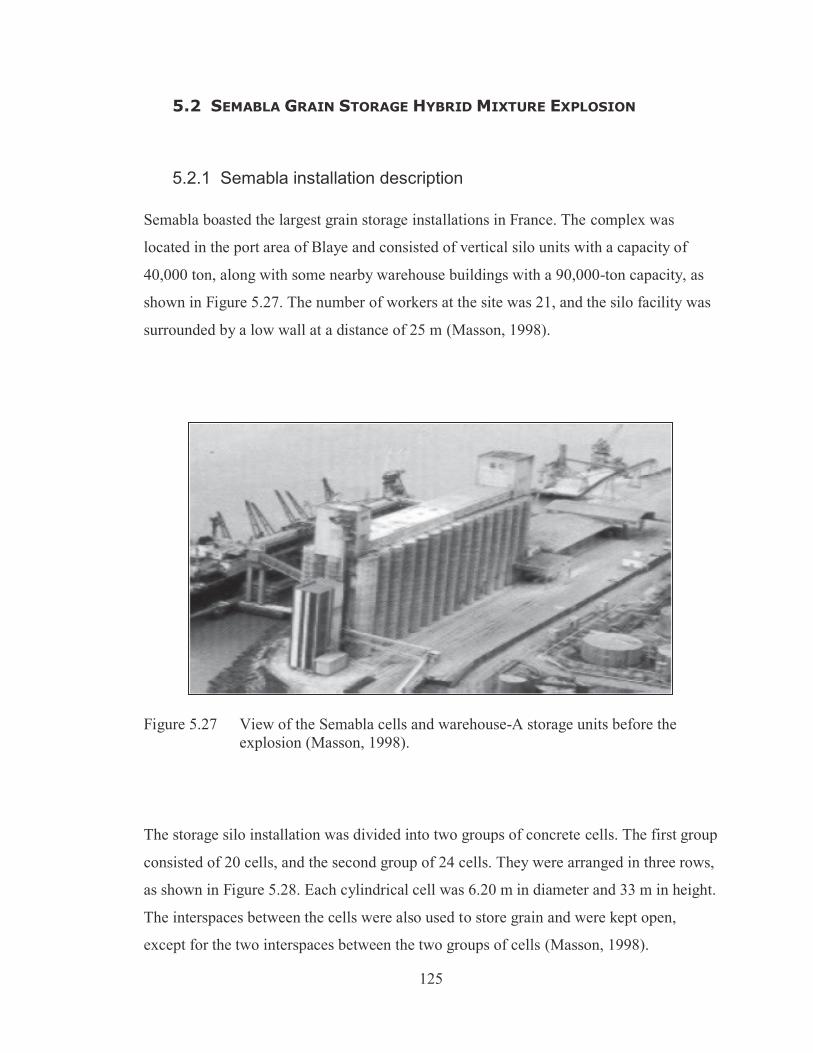
Figure 5.27 View of the Semabla cells and warehouse-A storage units before the explosion. 125
Figure 5.28 The Semabla identification of storage cells. 126
Figure 5.29 A view of the Semabla silo and warehouse-A storage facilities after the explosion. 127
Figure 5.30 CASD image (3D view) of the Semabla storage silo with the pressure relief panels (PPs). 130
Figure 5.31 Module distribution: a side view of the Semabla silo geometry. 130
Figure 5.32 DESC pressure simulation of the Semabla silo explosion geometry (top view). 131
Figure 5.33 DESC pressure simulation of the Semabla silo explosion geometry (side view). 132
Figure 5.34 A plane view of the Semabla silo geometry in Blaye, France. 133
Figure 5.35 DESC pressure/time simulation at monitor points in Modules (4,1) and (4,2) of the Semabla storage silo explosion. 134
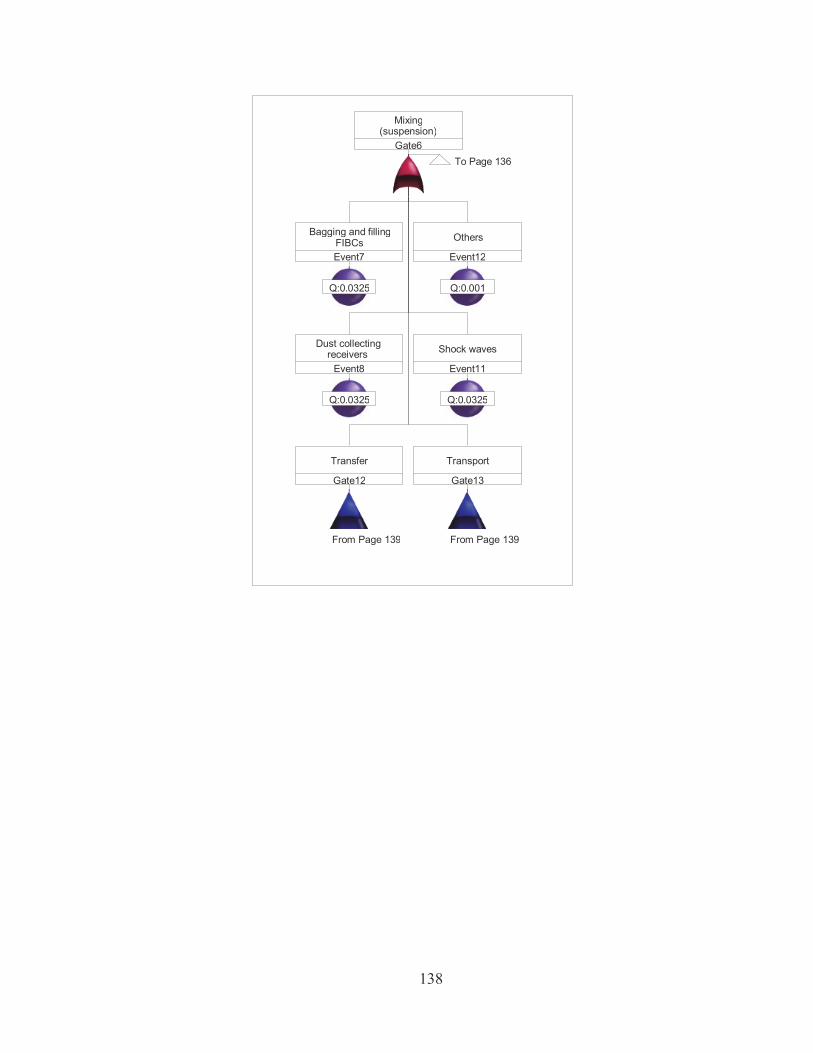
Figure 5.36 Fault Tree Analysis flowchart of the Semabla silo explosion. 136
Figure 5.37 Social risk F-N curves for the Semabla explosion. 143
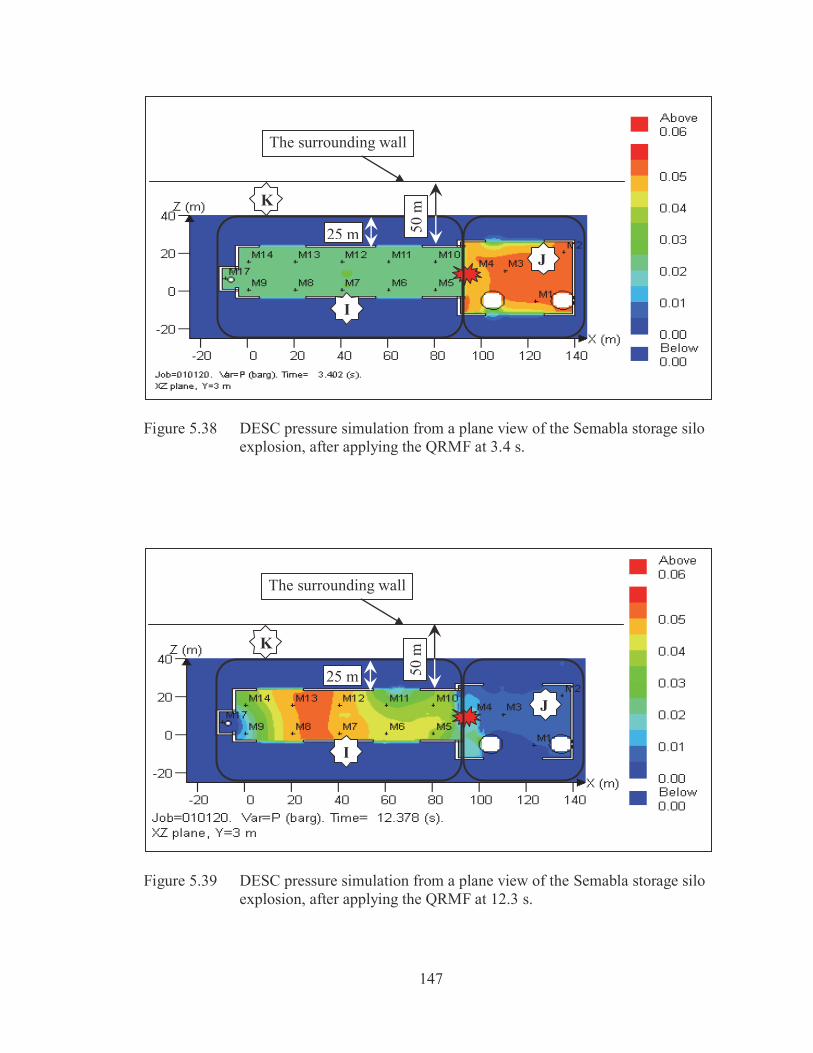
Figure 5.38 DESC pressure simulation from a plane view of the Semabla storage silo explosion, after applying the QRMF at 3.228 s. 147
Figure 5.39 DESC pressure simulation from a plane view of the Semabla storage silo explosion, after applying the QRMF at 12.378 s. 147
xvi
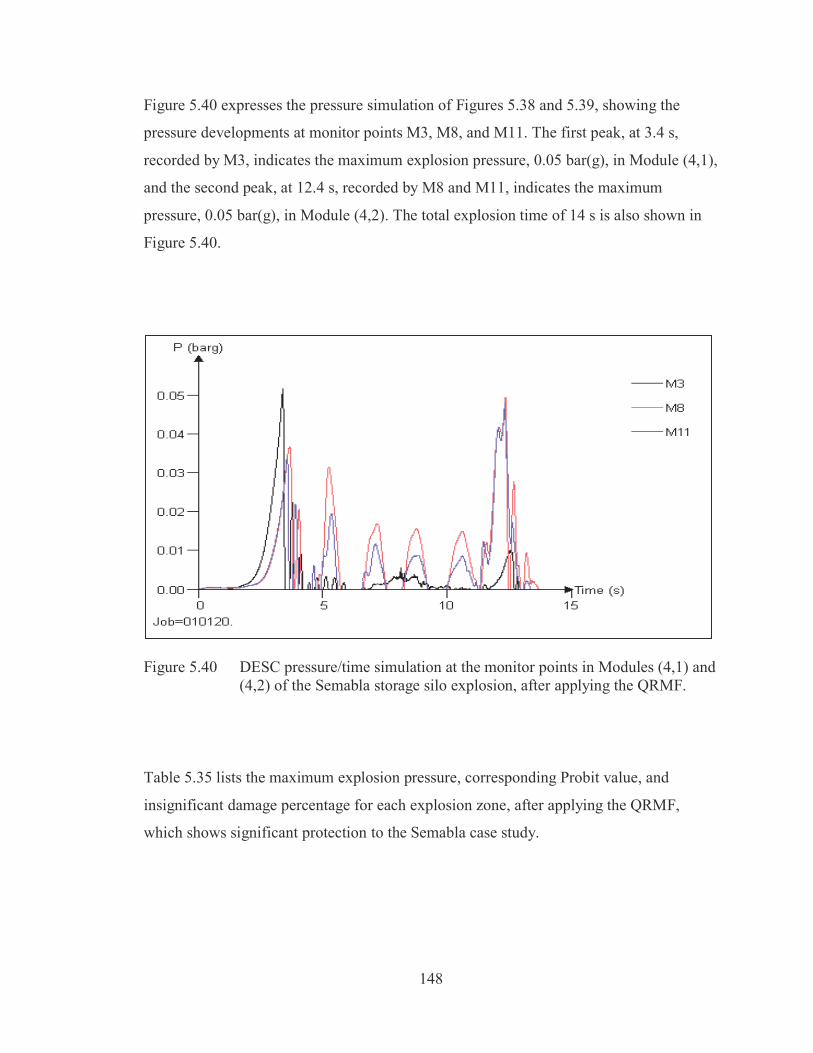
Figure 5.40 DESC pressure/time simulation at the monitor points in Modules (4,1) and (4,2) of the Semabla storage silo explosion, after applying the QRMF. 148
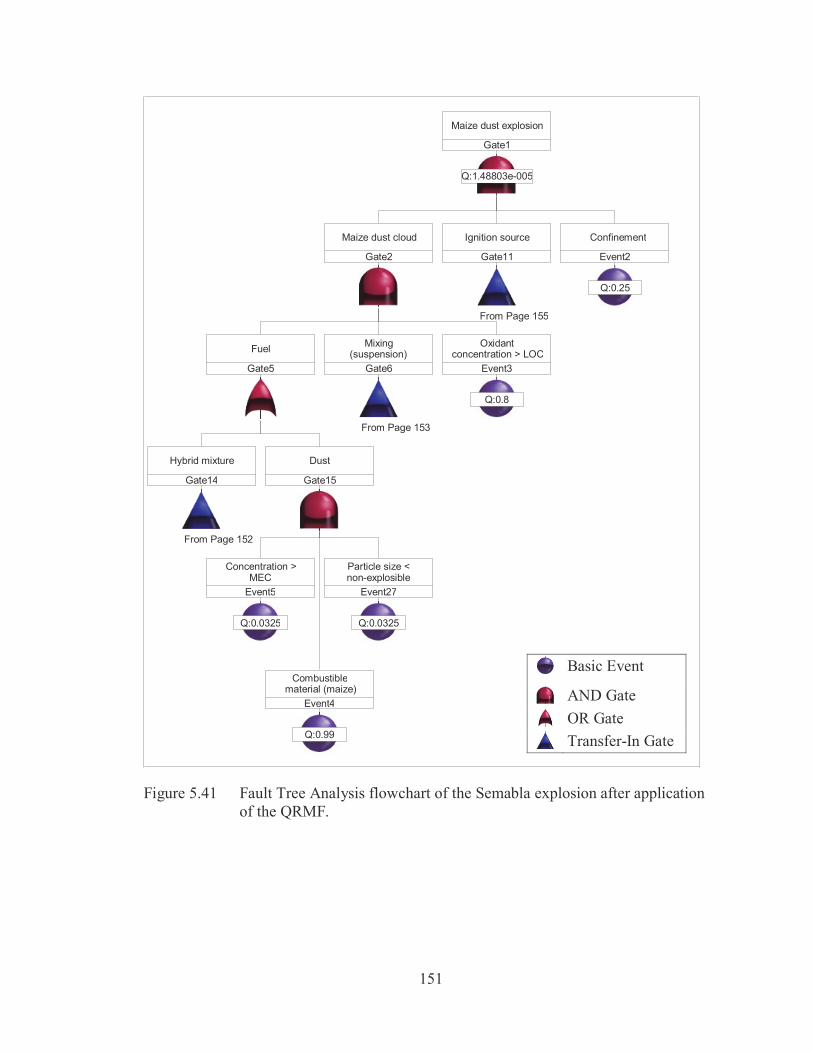
Figure 5.41 Fault Tree Analysis flowchart of the Semabla explosion after application of the QRMF. 151
Figure 5.42 HSE frameworks for tolerability of risk. 157
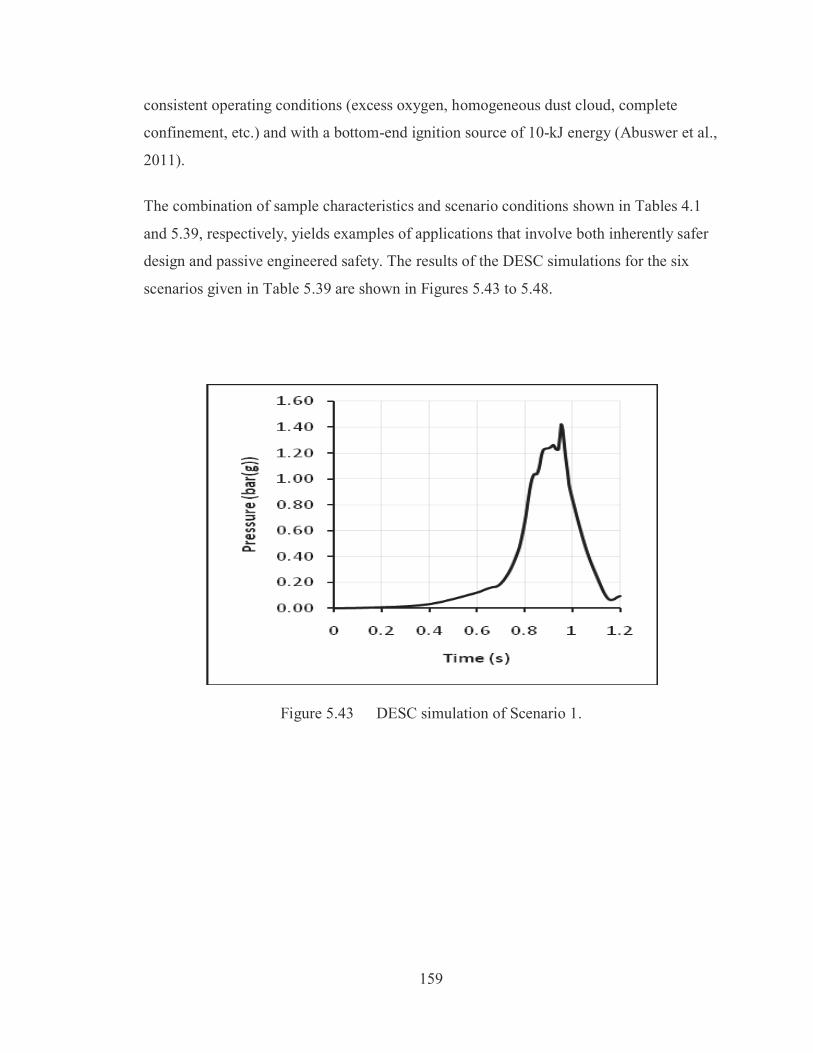
Figure 5.43 DESC simulation of Scenario 1. 159
Figure 5.44 DESC simulation of Scenario 2. 160
Figure 5.45 DESC simulation of Scenario 3. 160
Figure 5.46 DESC simulation of Scenario 4. 161
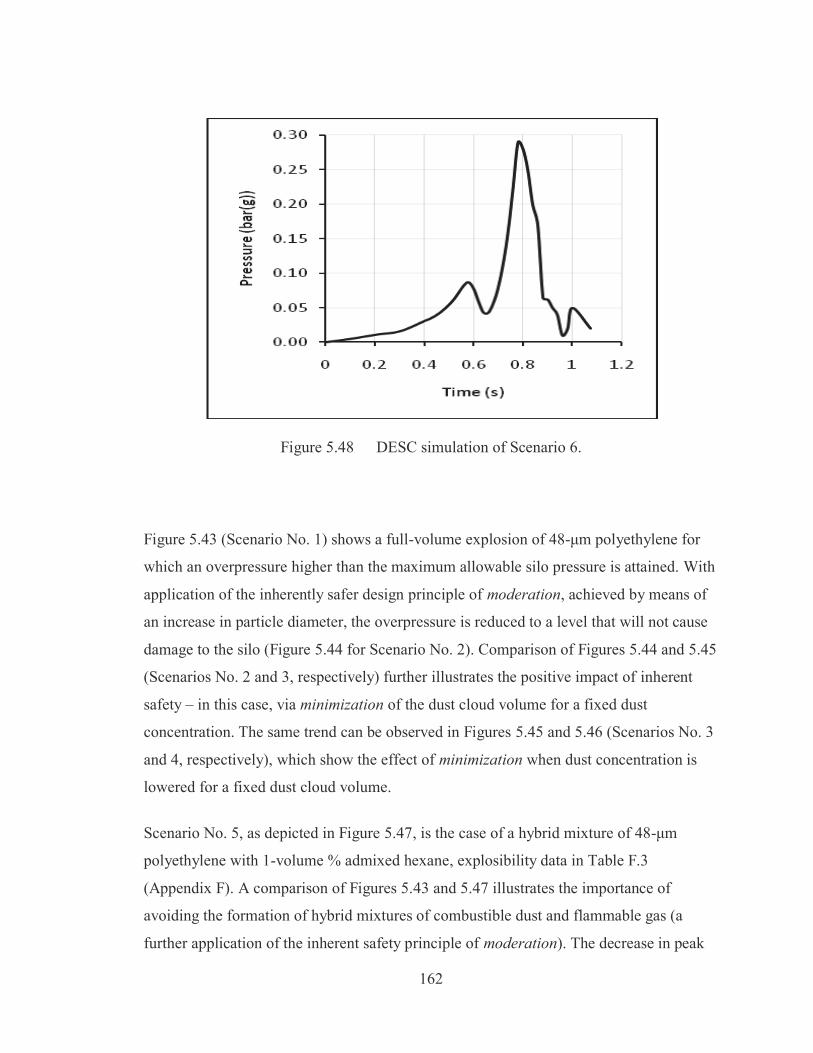
Figure 5.47 DESC simulation of Scenario 5. 161
Figure 5.48 DESC simulation of Scenario 6. 162
xvii
ABSTRACT
Dust and hybrid mixture explosions continue to occur in industrial processes that
handle fine powders and flammable gases. Considerable research is therefore conducted throughout the world with the objective of both preventing the occurrence and mitigating the consequences of such events. In the current work, research has been undertaken to help advance the field of dust explosion prevention and mitigation from an emphasis on hazards to a focus on risk. Employing the principles of quantitative risk assessment (QRA) of dust and hybrid mixture explosions, a methodological framework for the management of these risks has been developed.
The Quantitative Risk Management Framework (QRMF) is based on hazard identification via credible accident scenarios for dust explosions, followed by probabilistic Fault Tree Analysis (FTA) (using Relex – Reliability Excellence – software) and consequence severity analysis, represented by maximum explosion pressure, (using DESC – Dust Explosion Simulation Code – software). Identification of risk reduction measures in the framework is accomplished in a hierarchical manner by considering inherent safety measures, passive and active engineered devices, and procedural measures.
Dust explosion tests to determine icing and granulated sugar dust explosibility characteristics have been achieved in a 20-L Siwek chamber, and, accordingly, DESC fuel files were built and DESC was validated. Three industrial case studies are presented to show how the QRMF could have been helpful in reducing dust and hybrid mixture explosion risk at the Imperial Sugar refinery, the Semabla grain storage silo, and a hypothetical 400-m3 polyethylene storage silo. DESC simulations and Probit equation determined the destructive percentage of each pressure zone in the simulations, followed by probabilistic FTA that were achieved for the first two case studies, before and after applying the framework. Detailed individual and societal risks calculations were made and F-N (Frequency of occurrence – Number of fatalities) curves plotted for the two processes. The polyethylene silo case study is presented to show how inherent safety measures can be helpful in reducing dust and hybrid mixture explosion risk. The framework showed significant risk reduction to the point where the residual risks are acceptable for the both processes.
xviii
LIST OF ABBREVIATIONS AND SYMBOLS USED
Abbreviations
ADF annual damage friction
AFR annual fatalities rate
AIT auto ignition temperature
ALARP as low as reasonably practicable
ARAMIS Accidental Risk Assessment Methodology for Industries
AWCBC Association of Workers’ Compensation Boards of Canada
BDD binary decision diagram
CASD Computer Aided Scenario Design
CCF common Cause Failure model
CCOHS Canadian Centre for Occupational Health and Safety
CCPS Center for Chemical Process Safety
CFD computational fluid dynamic
CPI chemical process industries
CPQRA Chemical Process Quantitative Risk Analysis
CSB Chemical Safety Board
DESC Dust Explosion Simulation Code (software)
DMRA decision matrix risk assessment
ESC equivalent social cost
ESD event sequence diagram
ETA Event Tree Analysis
F Frequency (y-1)
xix
FAR fatal accident rate
FEDI Fire and Explosion Damage Index
F&EI Fire and Explosion Index
FIBC flexible intermediate bulk container
FMEA Failure Modes and Effects Analysis
F-N cumulative frequences of an event versus number of fatalities
FT fault tree
FTA Fault Tree Analysis
G Toxic Damage Index estimation factor
HAZOP Hazard and Operability Analysis
HEPI Human Error Probability Index
HIRA Hazard Identification and Ranking Analysis system
HRSDC Human Resources and Skills Development Canada
HSE Health and Safety Executive
HSL Health and Safety Laboratory (UK)
IET Institute of Engineering and Technology
ISIR individual – specific individual risk
LFL lower flammable limit
LOC lowest oxidant concentration
LOPA Layer of Protection Analysis
LSIR location – specific individual risk
MAXCRED Maximum Credibility Accident Analysis
MCAA Maximum Credible Accident Analysis
MCS Minimal Cut Set (for FTA)
xx
MEC minimum explosible concentration
MIE minimum ignition energy
MIT minimum dust cloud ignition temperature
MOC management of change
MSHA Mine Safety and Health Administration (USA)
N number of fatalities
NFPA National Fire Protection Association
NIOSH National Institute for Occupational Safety and Health (USA)
NORA National Occupation Research Agenda
NS OH&S Nova Scotia Occupational Health and Safety
OH&S Occupational Health and Safety
OSHA Occupational Safety & Health Administration (USA)
PP pressure panel
PRA Probabilistic Risk Assessment (software)
PROFAT Probabilistic Fault Tree Analysis
PSM Process Safety Management
QRA Quantitative Risk Assessment
QRAS Quantitative Risk Assessment System (software)
QRM quantitative risk management
QRMF Quantitative Risk Management Framework
Relex Reliability Excellence (software)
ROD Rate of Death
TDI Toxic Damage Index
xxi
TORAP Tool for Rapid Risk Assessment in Petroleum Refinery and Petrochemical
Industries (software)
SCAP management based on a safety credible accident, probabilistic algorithm
SDOF single degree of freedom
SMS safety management system
SWIFT structured what if technique
WIFT What If Technique
WP work packages
Symbols
Cm/Cp cost of module as fraction of platform cost
DF platform damage friction
Dm fraction of module damaged
(dP/dt)m maximum rate of pressure rise due to an explosion test (bar/s)
(dP/dt)max maximum rate of pressure rise (bar/s)
frequency of incident outcome, case (
FS frequency of scenarios (y-1)
H hours of work per year
k constant
K turbulent Kinetic energy
K1, K2 probit correlation causative variables
Kst dust deflagration index (dust cloud explosion violence) (bar•m/s)
L liter
m3 cubic meter
ms milliseconds
xxii
failure rate
NF total number of fatalities
the number of fatalities resulting from outcome, case
NL average number of people at the location
P pressure (N/m2)
P probability
frequency of ignition
correlation matrix with the probabilities of propagation from module i to j
total probabilities of ignition in domino scenario
PF probability of death
Pfe probability of fatality during evacuation
probability of fatality of incident outcome, case
Pfl probability of local fatality in the fire/explosion
Pfm probability of fatality during escalation/mustering
PL proportion of time an individual spends in a location
Pm maximum pressure reached due to an explosion test (bar)
Pmax maximum explosion pressure (bar)
probabilities of ignition in mono scenario at cell gallery
overpressure (N/m2)
total predetermined population for average risk
number of people at location
R Risk
individual risk
S severity of consequences
xxiii
t time (s)
texp total explosion time
V 20-L chamber volume (m3)
Y probit variable (unit-less)
μm microns (10-6 meters)
xxiv
ACKNOWLEDGMENTS
I am sincerely and heartily grateful to my supervisor, Dr. Paul Amyotte, who was
endlessly helpful and offered generous support and guidance. The thesis would have not
have been possible or completed without his help. My deepest gratitude also goes to Dr.
Faisal Khan and Dr. Michael Pegg for their technical guidance and support as my
supervisory committee. In addition, I would like to thank the Libyan Ministry of Higher
Education for the scholarship, and the Natural Sciences and Engineering Research
Council of Canada for their financial support. It is also an honor for me to thank
Trygve Skjold from GexCon, Norway, for his help and guidance in using the DESC
software. Finally, I owe sincere and heartfelt gratitude to my father (Ali Abuswer), my
mother (Halima Abufanas), my wife and children, and my siblings for their moral support
and encouragement.
1
CHAPTER 1 INTRODUCTION
1.1 THESIS OVERVIEW
This first chapter provides basic information about industrial dust and hybrid mixture
explosions. It describes the explosion pentagon and discusses the importance of dust
characteristics and their influence on the likelihood and severity of dust explosions. As
well, the main parameters affecting dust explosibility (such as dust particle size and
moisture) are reviewed and an overview of secondary dust explosions is given. The
chapter also discusses hybrid mixtures and details their effect on dust explosion severity
and likelihood. In addition, dust and hybrid mixture risk management is introduced and
some reasons why process industries use quantitative and not qualitative risk assessment
are investigated. The chapter also includes illustrative case histories of well-known
explosions and provides information on industrial safety agencies and their standards and
legislation.
The main goal of this work is to investigate the management of dust and hybrid mixture
explosions in the process industries. This goal is approached through the building of a
framework whose steps are sequentially arranged for maximum effectiveness. The
framework uses specific methodologies to analyze risk consequences: Dust Explosion
Simulation Code (DESC) software and likelihood Fault Tree Analysis (FTA).
The second chapter provides important background information related to dust and
hybrid mixture explosions, investigating the work of other researchers and then
comparing it with the developed framework. Chapter 2 also reviews various
methodologies and tools that deal with dust explosion prevention and mitigation.
Chapter 3 consists of two main sections. The first is the framework methodology section,
which presents the developed risk management framework steps. It explains in detail the
developed conceptual framework, which is a quantitative risk management framework
(QRMF) to prevent and mitigate dust and hybrid mixture explosions during industrial
2
processing. This section also identifies risk reduction measures in the framework in a
hierarchical manner by considering inherent safety measures, passive and active
engineered safety add-on devices, and procedural safety measures. The second section of
Chapter 3 demonstrates the implementation of the conceptual framework. It shows the
methodology flowchart and includes all the steps and the framework’s logic gates.
Chapter 4 provides details of the experimental work performed to validate and build the
fuel file of the DESC software, DESC preparation, and some DESC simulations for
validation. This chapter consists of: (1) experimental work performed in the dust
explosion laboratory at Dalhousie University, using the Siwek 20-L chamber to identify
dust characteristics for icing sugar, granulated sugar, and polyethylene; and (2) DESC
simulations of the above materials at 20-L, 1-m3, and 400-m3 geometries, and a
comparison of the experimental and simulation results.
Chapter 5 reviews three case studies of dust and hybrid mixture explosions; two occurred
in the past (the dust explosion at the Imperial Sugar Company at Port Wentworth,
Georgia, in 2008, and the Semabla grain silo explosion at Blaye, France in 1997). The
third case study is a hypothetical dust explosion in a 400-m3 polyethylene storage silo.
DESC was used to simulate the explosion accidents, and a probit model has been used to
estimate the severity of the consequences and calculate the probability of the analyzed
basic events. As well, in this chapter, Relex (Reliability Excellence) FTA software was
used to determine the overall probability of each top event. Total risk has been estimated,
and risk evaluation (to judge the proper safeguards) has been applied. Finally, some
appropriate safeguards have also been used, and the results (both before and after
applying the framework) have been compared.
Chapter 6 provides conclusions and recommendations for future work. The appendices
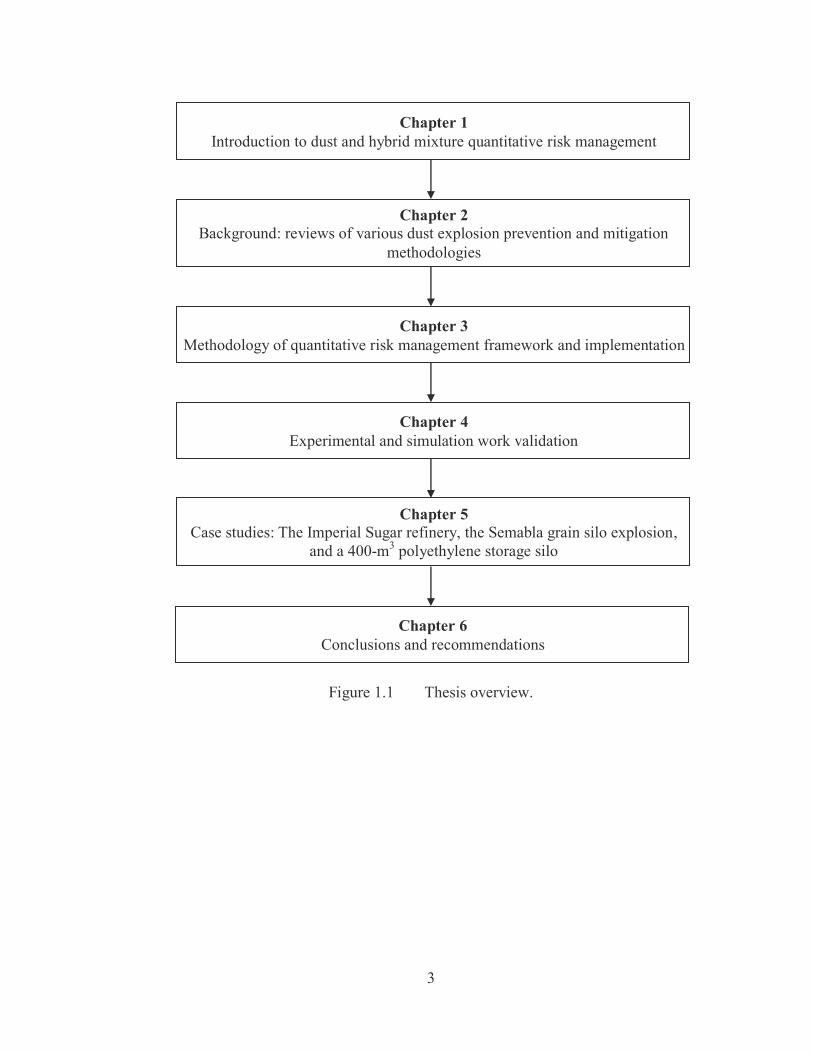
offer supporting documentation. Figure 1.1 summarizes the overview given above.
3
Figure 1.1 Thesis overview.
Chapter 1 Introduction to dust and hybrid mixture quantitative risk management
Chapter 2 Background: reviews of various dust explosion prevention and mitigation
methodologies
Chapter 3 Methodology of quantitative risk management framework and implementation
Chapter 4 Experimental and simulation work validation
Chapter 5 Case studies: The Imperial Sugar refinery, the Semabla grain silo explosion,
and a 400-m3 polyethylene storage silo
Chapter 6 Conclusions and recommendations
4
1.2 DEFINITIONS and TERMINOLOGY
As the area of industrial safety and risk management has evolved, a specialized
terminology has developed. The following terms and definitions have come into use:
Hazard: “The potential of a machine, equipment, process, material or physical factor in
the working environment to cause harm to people” (Wilson & McCutcheon, 2003).
Risk: “The possibility of human injury or death, production and/or property loss, and/or
environmental damage created by a hazard. The significance of a risk is a function of the
probability of an unwanted incident and the severity of the consequences” (Wilson &
McCutcheon, 2003).
Hazard identification: “A systematic procedure for finding all of the hazards associated
with unit operations and equipment. It is a process of determining what, why, and how
things can happen” (Rogers, 2000).
Risk assessment: “A series of logical steps to enable a systematic examination of the
hazards associated with unit operations and equipment” (Rogers, 2000).
Risk estimation: “Determination of the frequency at which the identified hazards could
occur and give rise to specific levels of severity” (Rogers, 2000).
Risk evaluation: “Comparison of the risk estimated with criteria in order to decide
whether a risk is acceptable or whether the unit operations and/or equipment design must
be modified in order to reduce the risk” (Rogers, 2000).
Residual risk: “The remaining level of risk, after all actions have been taken to reduce
the probability and consequences of a risk” (Rogers, 2000).
Risk management: “The systematic application of management policies, procedures and
practices to the tasks of identifying, analyzing, monitoring, and controlling risk” (Rogers,
2000).
5
1.3 SCOPE OF RESEARCH AND OBJECTIVES
There is an urgent need in the process industry to develop a tool that combines various
safety methodologies, software, procedures, etc., to prevent dust and hybrid mixture
explosions. Unfortunately, few published papers in the explosion area deal with
dust/hybrid mixture explosion risk assessment, mainly due to the complex nature of these
phenomena (Markowski, 2007).
Consequently, this research has been developed with the following scope, motivation,
and objective to cover the industrial problem of dust and hybrid mixture explosions:
i. Scope: The development of a quantitative risk management framework:
For dust and hybrid mixture explosion prevention and mitigation.
Explicitly incorporating hierarchy of controls principles via DESC and
FTA
ii. Motivation:
Protection of people, assets, production, and environment.
Promotion of a hierarchical approach to loss prevention.
Inherent safety focus within research group.
iii. Objective:
To manage the risks of any expected dust or hybrid mixture explosion in
industrial complexes (large-scale).
This research uses the Computational Fluid Dynamics (CFD) modeling technique, which
is represented in DESC software, to assess accidental consequences arising from dust
explosions, and the FTA technique to estimate dust explosion frequencies in process
industries. The research goals are:
To develop a conceptual framework and an implementation flowchart to
facilitate management of the dust and hybrid mixture hazard.
6
To develop a Fault Tree Analysis flowchart that identifies the likelihood
of any expected dust or hybrid mixture explosion for a given scenario.
To use DESC for the prediction of dust and/or hybrid mixture explosion
consequences for industrial-scale process units.
To simulate different (large-scale) industrial dust explosions as case
studies to analyze the severity of consequences of different scenarios.
The thesis uses QRA (Quantitative Risk Assessment), which includes both explosion
likelihood and consequences. These are the key features of the framework, together with
explicit consideration of the hierarchy of safety controls. Figure 1.2 shows an overview
of the QRMF (Quantitative Risk Management framework) for explosion prevention.
However, the question arises as to why the framework uses quantitative and not
qualitative risk analysis. The answer is simple – while qualitative risk analysis has the
ability to identify and control hazardous events in many instances, quantitative risk
analysis is the better method when the risk is excessive and safeguards are required
(Grossel, 2001)
1.4 QUALITATIVE AND QUANTITATIVE RISK ANALYSIS
As shown in Table 1.1, risk analysis can be divided into two major approaches:
qualitative risk analysis and quantitative risk analysis. Qualitative risk analysis is more
subjective and gives data in the form of words, while quantitative risk analysis is more
objective, explains what is observed, and produces more efficient data.
In their comprehensive and comparative study of three risk analysis and
assessment techniques (qualitative, quantitative, and a hybrid of quantitative and
qualitative), Marhavilas et al. (2011) revealed that the most frequently used technique
was the quantitative one (at 66%), and that its major use was in the industrial field.
Dust and hybrid mixture explosion prevention and mitigation is the main
objective of this thesis, and the following sections provide basic information and an
overall description of the subject.
7
Figure 1.2 Overview of the QRM framework process.
Identify Hazards
Understand Hazards
Probability Analysis
Consequence Analysis
Apply Inherent Safety
Principles
Apply Procedural Safeguards
Apply Management
of Change
Apply Engineered Safety
Develop Potential Explosion Scenario
Risk Estimation
Minimization
Substitution
Moderation
Simplification
Passive
Active
8
Table 1.1 Features of qualitative and quantitative research (James, 2007).
Qualitative Quantitative
"All research ultimately has a qualitative grounding." - Donald Campbell
"There's no such thing as qualitative data. Everything is either 1 or 0." - Fred Kerlinger
The aim is a complete and detailed description.
The aim is to classify features, count them, and construct statistical models in an attempt to explain what is observed.
Researcher may only know roughly in advance what he/she is looking for.
Researcher knows clearly in advance what he/she is looking for.
Recommended during earlier phases of research projects.
Recommended during latter phases of research projects.
The design emerges as the study unfolds. All aspects of the study are carefully designed before data is collected.
Data is in the form of words, pictures or objects.
Data is in the form of numbers and statistics.
Subjective – individual interpretation of events is important (e.g., uses participant observation, in-depth interviews, etc.).
Objective – seeks precise measurement and analysis of target concepts (e.g., uses surveys, questionnaires, etc.).
Qualitative data is more “rich” and time-consuming, and less able to be generalized.
Quantitative data is more efficient and able to test hypotheses, but may lack contextual detail.
Researcher tends to become subjectively immersed in the subject matter.
Researcher tends to remain objectively separated from the subject matter.
1.5 DUST AND HYBRID MIXTURE EXPLOSIONS
According to British Standard Institute code BS2955:1958, dust is a material with a
particle diameter of less than 76 μm (Abbasi & Abbasi, 2007), but the National Fire
Protection Association code NFPA 654 defines dust as “any finely divided solid, 420 μm
9
or less in diameter”, which is equivalent to a U.S. No. 40 standard sieve (Amyotte &
Eckhoff, 2010). A dust explosion can be defined as the rapid combustion of flammable
particulates suspended in air (Abbasi & Abbasi, 2007).
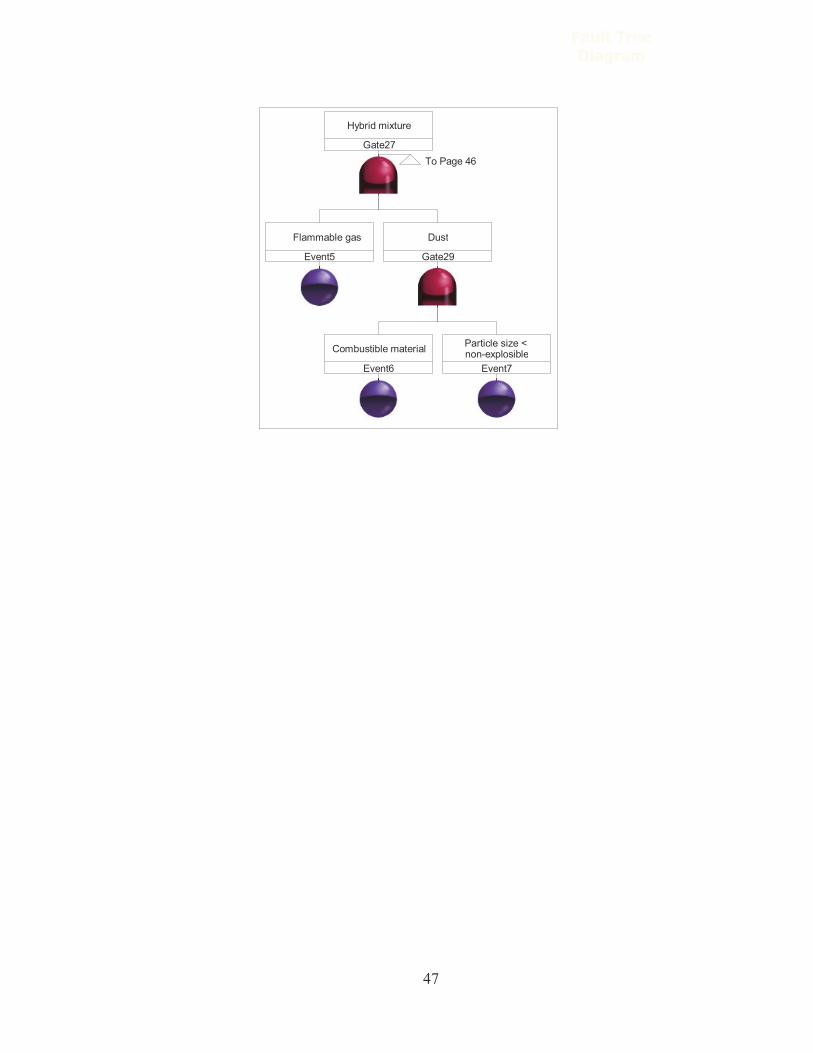
A hybrid mixture is a combination of a flammable gas and a combustible dust, where gas
may be present in an amount less than its lower flammable limit (LFL) and also an
amount of dust less than its minimum explosible concentration (MEC). Nevertheless,
they may, in combination, create an explosible mixture (Amyotte & Eckhoff, 2010).
Eckhoff (2003) demonstrated that the addition of flammable gas to a dust cloud
significantly increases the explosion violence. Likewise, Amyotte et al. (2010) showed
experimentally the increased maximum explosion pressure (Pmax) and maximum rate of
pressure rise in constant-volume (KSt) for ethylene/polyethylene, hexane/polyethylene,
and propane/polyethylene mixtures. The methane/coal dust system is the most dangerous
and volatile hybrid mixture in underground coal mines. In addition, there are several
examples of hybrid mixture formations in the process industries, such as the natural
gas/fly ash system in fossil fuel-burning power plants and various hydrocarbon/resin
combinations arising from the production of plastic powders (Amyotte et al., 2010).
To occur, dust and hybrid mixture explosions require the following five basic
components: (i) fuel, (ii) oxidant, (iii) ignition source, (iv) mixing of the fuel and oxidant,
and (v) confinement (Amyotte, Kahn, & Dastidar, 2003). Most often, explosion events
In addition, one or more secondary explosions may occur following primary explosion
pressure waves. These strong shock waves can suspend settled dust in the area, forming a
dust cloud which can then be ignited by the released energy of the primary explosion
(Abbasi & Abbasi, 2007). Secondary explosions may actually be worse than the initial
ones due to increases in the quantity and concentration of combustible dust/hybrid
mixtures. Nonetheless, it is theoretically possible to prevent or mitigate a dust or hybrid
mixture explosion by disabling at least one of the explosion pentagon elements.
10
Practically, however, a number of different measures are usually implemented to
minimize the risk of explosion to a tolerable level.
In responding to a query as to why dust explosions continue to happen, given our current
level of knowledge about preventing them, Amyotte (2010) suggested that many people
still believe in unicorns, meaning they still do not think scientifically. He outlined twelve
basic and persistent false beliefs about dust explosions:
(i) Dust does not explode. (ii) Dust explosions only happen in coal mines and
grain elevators. (iii) A lot of dust is needed to create an explosion. (iv) Gas
explosions are much worse than dust explosions. (v) It’s up to the explosibility
testing lab to specify which particle size to test. (vi) Any amount of suppressant is
better than none. (vii) There’s no problem if dust is not visible in the air. (viii)
Venting is the only/best solution to the dust explosion problem. (ix) The
vocabulary of dust explosions is difficult to understand. (x) Dust explosion
parameters are fundamental material properties. (xi) It makes sense to combine
explosion parameters in a single index. (xii) It won’t happen to me. (Amyotte,
2010)
1.5.1 Dust and hybrid mixture explosions in the process industries Many industries handle combustible dust or hybrid mixtures during at least one of their
processing stages. Therefore, dust and hybrid mixture explosions present an explosion
hazard that can threaten processing plants and harm people as well as damage the
environment, production, and/or processing equipment. Frank (2004) and Amyotte &
Eckhoff (2010) show that dust explosions occur in a wide range of industries and
industrial applications involving numerous and varied products such as coal, grain, paper,
foodstuffs, metals, rubber, pharmaceuticals, plastics, textiles, etc. Table A.1 (Appendix
A) provides a list of common industries that have more frequent and or high consequence
dust explosions, while Table A.2 (Appendix A) lists chemical industries that may have
combustible dusts. The next sub-sections give basic knowledge to understand dust and
hybrid mixture explosion phenomena.
11
1.5.2 Dust explosibility Identification of dust explosion hazards involves answering questions such as: (1) Can a
given material yield dust explosions when dispersed as a cloud in air? and (2) What
concentration of airborne dust is needed for an explosion? Finding the basic explosibility
parameters, as described in Table 1.2, helps to answers these and other questions
(Amyotte & Eckhoff, 2010). Dust explosibility is different for each material and depends
upon the dust’s parameters. Some of these parameters influence the likelihood of
occurrence, while others influence the severity of explosion (Dastidar et al., 2005).
MIE mJ Minimum ignition energy of dust cloud (electric spark)
Likelihood of occurrence
MIT °C Minimum ignition temperature of dust cloud
Likelihood of occurrence
MOC (LOC)
volume %
Minimum (or limiting) oxygen concentration in the atmosphere for flame propagation in dust cloud
Likelihood of occurrence
12
Explosion strength and violence have been classified and ranked in terms of the dust KSt,
as seen in Table 1.3. It is important to understand that each specific dust sample has just
one KSt value that is calculated from the maximum value of (dP/dt) over a sample of dust
concentrations, and it is dependent on the explosion chamber volume, as shown in
Equation 1.1 (Amyotte & Eckhoff, 2010):
Where: V = the explosion chamber volume.
Table 1.3 The explosibility rank (OSHA, 2011).
Dust explosion class KSt (bar•m/s)
St 0 0 St 1 > 0 and ≤ 200 St 2 >200 and ≤ 300 St 3 > 300
1.5.3 Domino effect The expected first explosion could disturb settled dust lying nearby, building suitable
conditions for a secondary dust explosion. Domino effect calculations can reveal the total
risk by considering all the explosion consequences, as shown in Figure 1.3.
13
Figure 1.3 The domino effect in dust explosions (Abbasi & Abbasi, 2007).
1.5.4 Illustrative case histories of dust and hybrid mixture explosions Statistics and numerous literature reviews confirm that, since 1785, dust and hybrid
mixture explosions have frequently occurred in industrial processes (Abbasi & Abbasi,
2007). Every year, these explosions kill and cause severe injuries to hundreds of people,
destroy assets, damage production, and contaminate the environment. For example, 43
people were killed in Iowa, USA, in a dust explosion accident which occurred in 1919 in
a corn processing plant. A similar explosion happened five years later in another plant in
the USA, resulting in the death of 42 workers. Other examples of dust explosions are: the
Saskatchewan grain pools explosion accident in 1952 (6 killed and 14 injured); the grain
silo explosion in Kampffmeyer, Austria, in 1960; the silicon powder grinding plant
explosion at Bremanger, Norway, in 1972 (5 dead and 4 injured); the catastrophic
explosion at the Harbin linen textile plant, China, in 1987 (58 dead and 177 injured); the
dust explosion of the Daido Kako Enka fireworks factory in Moriya, Japan, in 1992 (3
14
dead and 58 injured); the Blaye, France, hybrid mixture explosion in 1997 (11 killed); the
mould fabrication station explosion in Massachusetts, USA, in 1999 (3 killed and 12
injured); the explosion at West Pharmaceutical (polyethylene dust) in 2003 at Kinston,
North Carolina, USA (6 killed and 38 wounded) (CSB, 2004); the dust explosion at CTA
Acoustics in Corbin, Kentucky, USA in 2003 (7 killed and 37 injured) (CSB, 2005); the
lacquer dust explosion at Avon, Ohio, USA, in 2004; and the Imperial Sugar Company
dust explosion in 2008 at Port Wentworth, Georgia, USA, resulting in 14 deaths and 38
injuries (Abbasi & Abbasi, 2007). Over the past decade alone, dust explosion incidents
have been responsible for hundreds of injuries and fatalities in North America as well as
billions of dollars in property damage (Abbasi & Abbasi, 2007). Table B.1 (Appendix B)
provides a tabulated review of notable of dust explosion incidents between 1911 and
2004 (OSHA, 2007).
To avoid dust explosions and keep people, the environment, assets, and production safe
from harm, countries have created their own agencies that are responsible for developing
policies to manage risk. These policies encourage and force employers and employees to
reduce or prevent risks in the workplace by following certain rules.
1.6 LEGISLATION AND DUST EXPLOSIONS
As industry has become increasingly complex, many countries have modified and
developed their systems and methods, and have passed workplace legislation. Safety has
become not just an industry but a government concern. For instance, in Canada, the
Canadian health and safety system has multiple governance bodies and falls under federal
and provincial statutes. Each province has its own legislation based on a federal code that
enables legislation and regulation for the Canadian workplace (NOHSAC, 2007). Two of
the main federal agencies are HRSDC (Human Resources and Skills Development
Canada), which has federal responsibility for Occupational Health and Safety, and
AWCBC (Association of Workers’ Compensation Boards of Canada), which serves as a
bridge between provincial workers’ compensation boards. There are also ten provincial
and three territorial agencies, each with their own Occupational Health and Safety
15
(OH&S) legislation, such as the Nova Scotia Occupational Health and Safety (NS
OH&S) act (CCOHS, 2011).
1.6.1 U.S. Occupational Safety & Health Administration (OSHA) OSHA was created by the United States Department of Labor to set and enforce safety
standards to protect people, assets, production, and the natural environment. For example,
OHSA safety standard number 1910.109 is for explosives and blasting agents. The main
duty of OSHA is to ensure a healthy and safe workplace, both inside facilities and in the
surrounding area. OSHA is also responsible to ensure that workers have been adequately
trained and know their rights (OSHA, 2007).
After the Bhopal toxic gas release tragedy in 1984, OSHA released, in 1992, their highly
61 Standard for the Prevention of Fires and Dust Explosions in Agricultural and Food Processing Facilities 2002
68 Guide for Venting of Deflagrations 2002 69 Standard on Explosion Prevention Systems 2002 70 National Electrical Code 2005 77 Recommended Practice on Static Electricity 2000 85 Boiler and Combustion Systems Hazards Code 2007 86 Standard for Ovens and Furnaces 2007
91 Standard for Exhaust Systems for Air Conveying of Vapors, Gases, Mists, and Noncombustible Particulate Solids 2004
484 Standard for Combustible Metals 2006
499 Recommended Practice for the Classification of Combustible Dusts and of Hazardous (Classified) Locations for Electrical Installations in Chemical Process Areas
2004
654 Standard for the Prevention of Fire and Dust Explosions from the Manufacturing, Processing, and Handling of Combustible Particulate Solids
2006
655 Standard for Prevention of Sulfur Fires and Explosions 2007
664 Standard for the Prevention of Fires and Explosions in Wood Processing and Woodworking Facilities 2007
1.7 DUST AND HYBRID MIXTURE EXPLOSION PREVENTION, MITIGATION, AND CONTROL
Actions to prevent and mitigate dust and hybrid mixture explosions involve breaking
down the five basic components to prevent them from coming together in a specific
process, thus disabling one or more elements of the explosion pentagon. Furthermore, it
is important to evaluate dust characteristics – MIE, MIT, Pmax, KSt, and MEC – in
addition to considering the influence of dust explosion affecting factors (particle size and
17
agglomeration, moisture, flammable gas content, inert content, etc.). In order to avoid
primary or secondary dust explosions, proper housekeeping, following safety agency
regulations, and limiting dust locations are very important. Also, there are many
generally effective safety management methods and tools that can be applied to industrial
processes that pose a threat of dust and/or hybrid mixture explosions.
1.7.1 The risk management process Risk management is the complete process of understanding risk, risk assessment, and
decision making to ensure that effective risk controls are in place and implemented. Risk
management begins with actively identifying possible hazards, leading to ongoing
management of those risks deemed to be acceptable. The major hazards that the chemical
industry is concerned with are fire, explosion, and toxic release (Amyotte &
McCutcheon, 2006). Risk management consists of steps for identifying hazards and
analyzing, evaluating, and controlling risks associated with the hazards. It proceeds as
follows: hazard identification, risk analysis (frequency and consequence), risk estimation,
risk control, and monitoring the residual risk by going over the steps again to identify
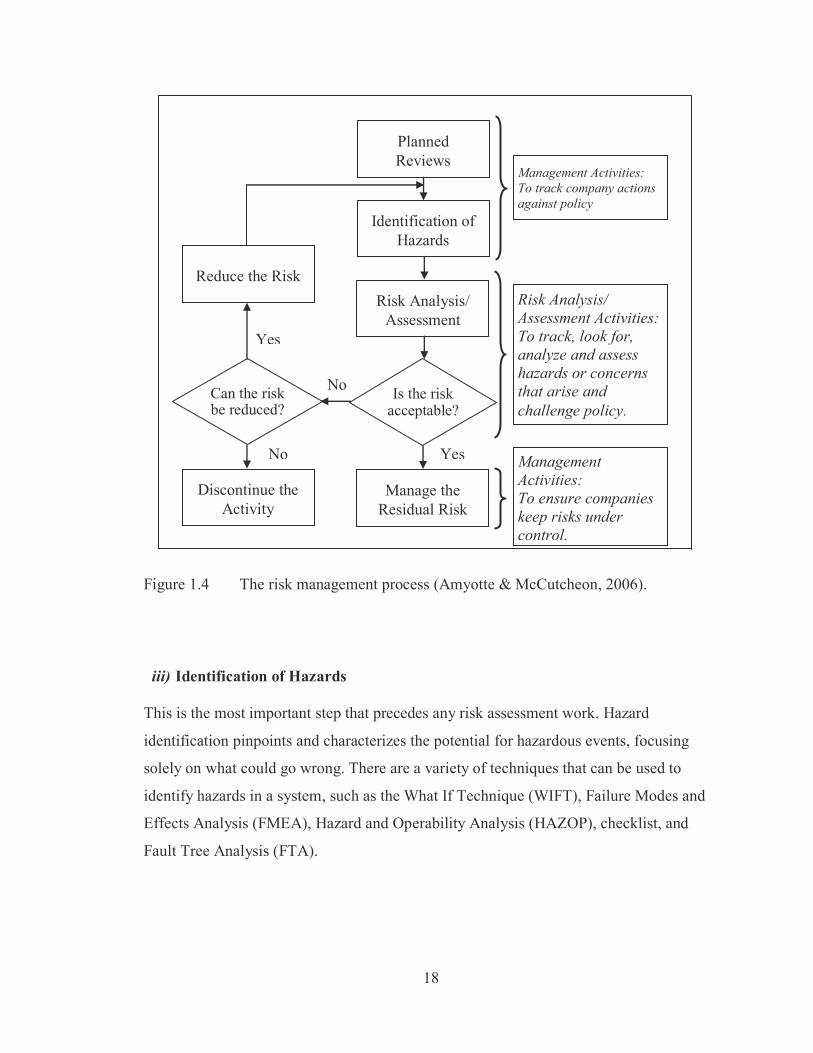
whether any specific risk requires further attention. Amyotte and McCutcheon (2006)
described the risk management process that controls risks associated with hazards, as
shown in Figure 1.4. The following steps describe, in general, the risk management
process:
i) System Description
This aspect of risk planning identifies the entire system component under study as well
as the operating procedure, the hazardous materials, and the surrounding area (Wilson &
McCutcheon, 2003).
ii) Review of Requirements
This step involves a comprehensive system management review which looks at incident
investigation, the overall project, compliance, insurance, and management direction.
18
Figure 1.4 The risk management process (Amyotte & McCutcheon, 2006). iii) Identification of Hazards
This is the most important step that precedes any risk assessment work. Hazard
identification pinpoints and characterizes the potential for hazardous events, focusing
solely on what could go wrong. There are a variety of techniques that can be used to
identify hazards in a system, such as the What If Technique (WIFT), Failure Modes and
Effects Analysis (FMEA), Hazard and Operability Analysis (HAZOP), checklist, and
Fault Tree Analysis (FTA).
Planned Reviews
Identification of Hazards
Risk Analysis/ Assessment
Manage the Residual Risk
Is the risk acceptable?
Can the risk be reduced?
Discontinue the Activity
Reduce the Risk
Management Activities: To track company actions against policy
Risk Analysis/ Assessment Activities: To track, look for, analyze and assess hazards or concerns that arise and challenge policy.
Management Activities: To ensure companies keep risks under control.
Yes
No
No
Yes
19
iv) Risk Assessment Risk assessment looks at the possible causes of injuries or illness and their effects on
people, and involves risk quantification and ranking. A risk assessment methodology
should consider all risk factors, including unexpected parameters. Tweeddale (2003)
explained that the relationship between risk management and risk assessment is similar to
art’s relationship to science, with risk assessment being the scientific tool for risk
management.
Risk assessment’s main use is providing answers to the following questions:
What sorts of risk are there in this situation?
Is this risk too high to be acceptable?
What are the main components of this risk?
What should we do about this risk?
How can we reduce the risk most rapidly?
How can we reduce the risk most cost-effectively?
How can we keep this risk low?
Are we managing this risk effectively at present?
What do the exposed people need to know about the risk?
What should those exposed people do in the event of the risk being realized?
Except for the second question (which requires risk magnitude, i.e., quantitative risk
analysis), all of the above questions can be answered by qualitative analysis (Tweeddale,
2003).
Risk assessment consists of two main steps: risk analysis and risk evaluation.
- Risk analysis and risk estimation
Once hazards have been identified, there is a need to analyze any risks that may be
present. Risk analysis is the determination of how often the event is likely to occur
(frequency), and what the consequences would be if the event did occur (Wilson &
McCutcheon, 2003). There are several methods for determining risk frequency; two of
the most popular are Fault Tree Analysis and Event Tree Analysis (ETA). Risk
20
consequences can be quantified using, for instance, Computational Fluid Dynamics
(CFD) simulations in explosion accidents to determine the maximum explosion pressure,
followed by Probit equations to calculate deaths, injuries, and damage. Risk estimation is
a critical process to quantify the risk. It combines the frequencies and consequences of
events and is a very important process in risk management decisions (Wilson &
McCutcheon, 2003).
- Risk evaluation
Risk evaluation is the judgment and decision-making process, and addresses the question:
Is the risk acceptable? (Wilson & McCutcheon, 2003). If the answer is “Yes”, no changes
need to be made to the system; if the answer is “No”, what do we need to do about it? and
the above questions (in section 1.7.1, iv) must be answered.
v) Risk Control
Risk control is the action process to reduce risk. It produces risk reduction by decreasing
the likelihood and/or consequences of the hazardous event. Risk control could include
inherent changes in the process management by such means as minimization,
substitution, moderation, and simplification. It could also involve engineered changes
(passive or active) and/or procedural changes. The risk control step needs to reviews the
entire process and applies the changes as necessary. If the risk or the residual risk is too
high and changes cannot be safely made, the right decision is to discontinue the activity.
1. Inherent safety: In 1978, Trevor Kletz devised the theory of inherent safety.
Since that time, inherent safety has recorded several applications in the process
industry (Amyotte et al., 2009). Amyotte et al. (2003) defined inherent safety as a
proactive approach in which hazards are eliminated or lessened so as to reduce
risk without engineered (add-on) devices or procedural intervention. Therefore,
inherent safer design costs less, as described in Figure 1.5. Inherent safety is
more a problem-avoidance tool than a solving tool (Kletz & Amyotte, 2010).
21
Figure 1.5 Inherent safety is not an isolated change, but, rather, part of a package of
improvements needed by the process industries (Kletz & Amyotte, 2010).
As seen in Table 1.5, inherent safety has four main principles: minimization,
substitution, moderation, and simplification. It can reduce dust explosion
consequences and likelihood when applied at the early project design cycle and
solve problems at their root sources, as follows (Amyotte et al., 2009):
start by minimizing the hazardous material of a given process whenever
possible,
substitute hazardous materials, processing routes, and/or procedures with
others that are less hazardous,
use process materials in their least hazardous form, and
simplify process routes, equipment, and procedures as much as possible to
minimize human error, maintenance, cost, etc.
Amyotte et al. (2007) emphasized that there is a reduced need to institute safety
add-ons or different safety procedures if an inherent safety approach has been
applied in a process industry. Kletz and Amyotte (2010) clarified the inherent
safety strategy with the following analogies: Why raise lions if lambs can do what
we need? Why build houses with tall stairs if we can have a one-story house or
install staircases with frequent landings instead? However, in some cases,
Inherent Safety
Simplification Less Energy
Lower Cost
22
Table 1.5 Key inherent safety principles (Amyotte et al., 2009).
Principle Description
Minimization
Use smaller quantities of hazardous materials when the use of such materials cannot be avoided or eliminated. Perform a hazardous procedure as few times as possible when the procedure is unavoidable.
Substitution Replace a substance with a less hazardous material, or a processing route with one that does not involve hazardous material. Replace a hazardous procedure with one that is less hazardous.
Moderation Use hazardous materials in their least hazardous forms or identify processing options that involve less severe processing conditions.
Simplification Design processes, processing equipment, and procedures to eliminate opportunities for errors by eliminating excessive use of add-on safety features and protective devices.
inherently safer design does not in itself reduce the threat to an acceptable level,
and therefore engineered safety and procedural safety measures are needed.
2. Engineered safety: This refers to engineered safety add-on devices with special
features that reduce the frequency and consequences of any existing hazard.
Engineered safety devices are classified as passive or active.
Passive engineered safety: These kinds of add-on devices do not have to be
commissioned or initiated by other devices. Explosion relief vents are a good
example of passive add-ons. They open to release explosion pressure when the
pressure rises (Amyotte & Eckhoff, 2010).
Active engineered safety: These kinds of add-on devices have to be initiated by
other detectors or sensors and require periodic checks and maintenance to be
reliable. Inerting is an example of a dust and hybrid mixture explosion
prevention/mitigation measure, which is adding N2, CO2, or rare gases to a dust
cloud by an automatic explosion suppression process. However, inerting could
also be an inherent safety measure (moderation), when adding solid inertants to
a given fuel mixture to maximize MEC (Amyotte & Eckhoff, 2010).
23
3. Procedural safety: This is the weakest safety measure with respect to the above
protective measures (Kletz & Amyotte, 2010). Typically, its use is to eliminate
ignition sources by, for example, requesting hot-work permitting (Amyotte &
Eckhoff, 2010).
The main difference between the above safety measures is that inherent safety measures
look to remove the hazard at the outset of the project design, while the other two attempt
to mitigate the effects.
The hierarchy of controls strategy places control methodologies in sequential order:
inherent safety, passive engineered safety, active engineered safety, and procedural
safety. An overall hierarchical view for dust explosions is given in Table 1.6. It is similar
to the LOPA (Layers of Protection Analysis) concept, where inherently safer design acts
as the core of the layers (Kletz & Amyotte, 2010).
In general, risk management is an iterative process. After a risk has been evaluated, the
next decision is whether or not the risk needs to be reduced. After it has been reduced, it
is necessary to re-estimate the risk. A decision can then be made as to whether the
measures taken have reduced the risk to an acceptable level. It is also essential to check
that the measures used to reduce the risk have themselves not introduced any new
hazards.
24
Table 1.6 A hierarchical view of various means of preventing and mitigating dust explosions (Amyotte & Eckhoff, 2010).
Process design to prevent undesired generation of dust clouds and particle size reduction and segregation Inherent Safety – Minimization, Substitution, Moderation, Simplification
Smouldering combustion in dust, dust fires Procedural Safety – may also involve aspects of Inherent Safety or Engineered Safety
Good housekeeping (dust removal/cleaning) Mitigation with respect to secondary dust explosions; prevention with respect to primary dust explosions Inherent Safety – Minimization
Keeping dust concentration outside explosible range Inherent Safety – Minimization
Other types of open flames (e.g. hot work) Procedural Safety – may also involve aspects of Inherent Safety or Engineered Safety
Explosion-pressure resistant construction Inherent Safety – Simplification
Inerting of dust cloud by adding inert dust Inherent Safety – Moderation
Hot surfaces (electrically or mechanically heated) Procedural Safety – may also involve aspects of Inherent Safety or Engineered Safety
Explosion isolation (sectioning) Inherent Safety – Moderation (e.g., unit segregation, product choke, etc.) if not using mechanical devices. If mechanical devices are used to isolate plant sections, classification would be Engineered Safety – Passive in the case of physical barriers, or Engineered Safety – Active in the case of isolation valves.
Intrinsic inerting of dust cloud by combustion gases Engineered Safety – Active
Heat from mechanical impact (metal sparks and hot-spots) Procedural Safety – may also involve aspects of Inherent Safety or Engineered Safety
Explosion venting Engineered Safety – Passive
Inerting of dust cloud by N2, CO2 and rare gases Engineered Safety – Active
Electric sparks and arcs and electrostatic discharges Procedural Safety – may also involve aspects of Inherent Safety or Engineered Safety
Automatic explosion suppression Engineered Safety – Active
Partial inerting of dust cloud by inert gas Engineered Safety – Active
25
1.8 ORIGINAL CONTRIBUTIONS OF THE RESEARCH
Few studies in the dust and hybrid mixture explosion area have dealt with explosion risk
assessment and management. The current work1 attempts to provide an extensive
Quantitative Risk Management Framework (QRMF) for dust and hybrid mixture
explosion prevention/mitigation. Based on the hierarchy of controls (inherent,
engineered, and procedural safety), the framework can effectively help industrial
managers and safety engineers prevent and mitigate dust and hybrid mixture explosions
in the process industries.
The primary contribution of this research is to provide of an extensive and robust
framework that gathers together the concepts of three risk management methodologies:
the SCAP (Safety, Credible, Accident, and Probabilistic) algorithm methodology for
safety management (Khan et al., 2001), the QRA tool for the external safety of industrial
plants with a dust explosion hazard (van der Voot et al., 2007), and a dust explosion
prevention/mitigation approach based on inherent safety (Amyotte et al., 2003)), a CFD
tool (DESC software), and probability analysis software (Relex).
The novel idea of the current work includes the use of concepts drawn from previous
methodologies, formulated into two main steps. The first step is the creation of a new
combined safety management framework, and the second step is the use of DESC and
FTA to assess explosion consequences and likelihood, respectively. No prior work has
hitherto been undertaken to formulate such a framework. This is the first time that DESC,
a newly developed Fault Tree Analysis, and Relex software have been integrated to
analyze and simulate dust/hybrid mixture explosions.
1 A portion of this work was presented at the 8th ISHPMIE in Japan, and was awarded the honor of being the best paper. The work has since been published in JLPP, referenced as Abuswer et al. (2011).
26
CHAPTER 2 BACKGROUND
2.1 INTRODUCTION
To date, while many researchers have tried to model or predict dust cloud structures and
flame propagation as a first step to mitigating or even preventing dust explosions, there is
still a lack of findings that can provide a real explanation of those hazards (Eckhoff,
2005). Other research has tried to develop robust process management procedures,
techniques, tools, and frameworks with the intention of mitigating or preventing dust
explosion accidents, but there is still more work to be done.
2.2 QUANTITATIVE RISK ASSESSMENT RESEARCH
Many researchers have derived models, developed methodologies, or predicted
frameworks to mitigate and prevent process industry explosions. However, there is scant
published research in the dust and hybrid explosion prevention area, mainly due to the
complex nature of these phenomena (Markowski, 2007). In the late 1990s, Khan and
Abbasi (1998b) developed the software package MAXCRED (Maximum Credible
Accident Analysis) to conduct rapid quantitative risk studies and comprehensive risk
analyses of the petrochemical industry. Its five main modules (data collecting, accident
scenario generation, consequence analysis, graphics, and documentation) make
MAXCRED a flexible tool for risk assessment, as it does not require other packages for
data analysis or graphic support (Khan & Abbasi, 1998a). A few years later, Khan &
Abbasi (2001) developed another computer program called TORAP (Tool for Rapid Risk
Assessment in Petroleum Refinery and Petrochemical Industries), which is used for
conducting rapid risk assessment in the chemical process industry (CPI) and is capable of
handling many types of industrial fires and explosions. This software methodology
includes four main steps: accident scenario generation, consequence analysis, checking
for a higher degree of accidents, and characterization of worst case scenarios. Papazoglou
et al. (2003) developed a methodology for integrating a Quantitative Risk Assessment
27
model and a safety management system (SMS) for chemical installations. Bernatik &
Libisova (2004) explained the importance of Quantitative Risk Assessment in the
operation of six large old gasholders in an area of high population density in the Czech
Republic. Pula et al. (2005) revised several fire consequence models for offshore
Quantitative Risk Assessment. Gowland (2006) explained the principles of LOPA (Layer
of Protection Analysis) and how it can be used within ARAMIS (Accidental Risk
Assessment Methodology for Industries). ARAMIS, which accommodates LOPA, has
several modules that can be used to simplify Quantitative Risk Assessment. Attwood et
al. (2006) explained the development of a quantitative model that can predict accident
frequency on offshore platforms. Their quantitative model focuses on the important
factors that can affect the accident process, such as workers’ opinions regarding safety.
Creating a communication bridge among managers, engineers and risk analysts was the
main goal of Groen et al. (2006). They developed QRAS (Quantitative Risk Assessment
System) software, which is used for modeling and risk analysis. The model consists of
risk scenarios in the form of event sequence diagram (ESD), fault tree (FT), common
cause failure model (CCF), and binary decision diagram (BDD), where BDD compares
results with a Probabilistic Risk Assessment (PRA) software tool. The system starts with
definitions of a functional hybrid system hierarchy and a mission timeline, which
together represent a high-level model.
2.3 DUST EXPLOSION PREVENTION TOOLS
Each one of the selected tools below can provide a different safety methodology to
manage, assess, or analyze risks associated with dust or hybrid mixture releases.
2.3.1 SCAP SCAP is a methodology for safety management based on feedback from a credible
accident probabilistic fault tree analysis system (Khan, et al., 2001). It is an algorithm
28
methodology developed by Khan & Husain in 2001. Figure 2.1 shows the steps involved
in SCAP.
Figure 2.1 The SCAP algorithm (Khan & Husain, 2001).
Apply control measures
Start
Hazard identification FEDI & TDI
Risk estimation
Fault tree development
Fault tree analysis PROFAT
Accident scenario development
MCAA
Consequences analysis MAXCRED
Identify units that contribute substantially
to the probability of top event
Whether risk is in
acceptance
End
No
Yes
Qualitative hazard assessment
Probabilistic hazard assessment
Fault tree for the
envisaged scenario
29
The steps involved in SCAP include: i) Hazard identification
- FEDI (Fire and Explosion Damage Index) estimation involves the following
steps:
classifying units into five categories (storage units, units involving operation,
units involving chemical reactions, transportation units, and hazard units, e.g.,
furnace or boiler),
evaluation of energy factors,
assignment of penalties, and
estimation of damage potential.
- TDI (Toxic Damage Index) represents fatal toxic load over an area. TDI is based
on transport phenomena, empirical models, the physical state, chemical toxicity, operational conditions, and the location condition (Khan & Husain, 2001). G is the TDI estimation factor, which takes into account the following (Khan &
Husain, 2001):
accedental release of super-heated liquid from a unit, some of which could
flash to vapors, and some of which could form a liquid pool,
gas dispersed directly to the surroundings of a unit which could be toxic,
liquefied gas that could cause the same result as the dispersed gas, and
toxic gases that could be released from pyrophoric solids.
- HIRA (the Hazard Identification and Ranking Analysis System) enables
computation of FEDI and TDI, and serves the following purposes (Khan & Husain, 2001): considers the impacts of process units, parameters, and hazard identification,
provides reliable quantitative results, and
uses penalties derived from tested models of thermodynamics and transport
The authors developed their module to quantify the effects and consequences of an
explosion by considering the following:
blast and flame effects,
outflow of bulk material, and
throw of fragments and debris.
iv) Individual and societal risk
The probability of lethality due to a dust explosion depends on the number of unprotected
people in the explosion area. The QRA tool considered four types of objects –
unprotected people, vehicles, domestic houses, and office buildings – that would be
affected by the explosion.
2.3.3 Dust explosion prevention and mitigation approach based on inherent safety
Amyotte et al. (2003) developed a systematic approach to loss prevention (shown in
Figure 2.4) that incorporates the inherent safety principles (i.e., minimize, substitute,
moderate, and simplify). The authors designed their approach based on various previous
heuristics work, including the following methodologies (Amyotte et al., 2003):
The fire triangle, which represents the simple concept of fire elements (fuel,
oxidant and ignition source), as shown in Figure 2.5.
The fire triangle for dusts, which shows the fuel requirements for dusts in the fire
triangle (as illustrated in Figure 2.6). Dusts have to be combustible, airborne, and
within their explosible concentrations.
The explosion pentagon, which expands the basic fire triangle to include
fuel/oxidant mixing and confinement of the mixture, as shown in Figure 2.7.
Worldwide guides and standards providing further advice on engineering
measures and on where explosion protection is required.
34
Figure 2.4 A systematic approach to loss prevention (Amyotte et al., 2003).
Steps Activities
Identify Hazards Identify all hazards and causes of these materials, actions and conditions
Understand Hazards
Avoid Hazards
Reduce Severity
Reduce Likelihood
Apply Active Safeguards
Apply Passive Safeguards
Segregate
Avoid or eliminate hazard by design
Minimize, substitute or moderate to reduce the severity of the hazard
Inherent
Safety
Principles
Simplify the process or plant to reduce the likelihood of
the hazard occurring
Use distance or sections of the plant itself to segregate/protect people and emergency systems
from effects of hazards
Use findings of the hazard assessment to estimate the risks, and target and implement
inherent/segregation/add-on/procedural safeguards until risks are tolerable
Operation and maintenance procedures should be the last resort, especially for control and
mitigation, where the chance of error or failure is high
Assess hazards, their causes and effects, and how these interact with the design
Apply Procedural Safeguards
Apply Residual Risk Reduction
Measures
Use safeguards that do not need initiation, and hence
have high availability
Use active systems, but note these depend on timely hazard
detection and initiation
Add-on
safety
35
Fuel Oxidant
Ignition Source
Oxidant
Particle Size
Fuel
Ignition Source
Concentration
Figure 2.5 The fire triangle (Amyotte & Eckhoff, 2010).
Figure 2.6 The fire triangle for dust (Amyotte & Eckhoff, 2010).
Figure 2.7 The explosion pentagon (Amyotte & Eckhoff, 2010).
Ignition Source
Oxidant Fuel
Mixing Confinement
36
The developed systematic approach is based on the hierarchy of controls, assembled from
three different methodologies: inherent safety, engineered safety, and procedural safety.
2.3.4 Computational Fluid Dynamics modeling (CFD) While Computational Fluid Dynamics modeling of gas explosions has been underway for
a number of years, CFD is a relatively new approach in the field of dust explosions. The
most comprehensive package available at present is Dust Explosion Simulation Code,
which has been developed by GexCon of Norway. The main purpose of the DESC
project was to develop a simulation tool based on CFD that could predict the potential
consequences of industrial dust explosions in complex geometries (Skjold, 2007). As
described by Skjold (2007), DESC can be helpful as a plant design tool for the
optimization of mitigation measures such as explosion barriers, vents and suppression
systems; Figure 2.8 shows a DESC explosion simulation in an industrial complex.
The DESC project deals with the complex nature of the dust explosion phenomenon and
seeks a balance between sufficiently accurate models, robust and efficient numerical
schemes, simplified user input, and emphasis on a risk assessment approach (Skjold,
2007).
Figure 2.8 3D plot showing flame propagation inside a typical module (GexCon,
2009).
37
There are seven work packages (WPs) in the project, and each one was executed by
several research groups; turbulent flow measurements, measurements of burning
velocities and flame speeds, dust dispersion phenomena, combustion model, development
of the CFD code, validation of the CFD code, software package and explosion results
(Skjold, 2007).
DESC capabilities have been addressed by GexCon (2009). The software shows
numerous advantages when used in dust explosion simulations. For instance, DESC is
able to: plot 2D and 3D simulations, and achieve fast-acting pressure panels, as well as
simulate large-scale industrial processes, most kinds of dust encountered in industry,
pressure development and flame propagation, and dust lifting. It can also predict blast
waves.
2.3.5 Fault Tree Analysis Commonly, when Quantitative Risk Assessment is required in industrial processes, Fault
Tree Analysis (FTA) and Event Tree Analysis (ETA) are used to estimate the likelihood
of occurrence. These methods extensively analyze and investigate the unwanted event
diagrammatically, logically, and independently. In the developed QRM framework, FTA
has been chosen to calculate explosion likelihood.
Bell Telephone Laboratories developed FTA in 1961 to evaluate a ballistic missile launch
control system. In 1965, Haasl at Boeing expanded the use of the FTA technique to other
missile systems, and then a year later Boeing started using FTA in civil aircraft design. In
1975, the U.S. Nuclear Regulatory Commission approved FTA as an essential technique
in nuclear safety studies. Recently, FTA has been widely employed in various chemical
process industries (CCPS, 2000).
Basically, FTA technology uses a combination of the Boolean logic gates “AND” and
“OR” in the analysis. Equations 2.3 and 2.4 show the probability calculations for each
gate:
The failure probability equation of the “OR” gate is:
38
(2.3)
where: = total failure probability
=the probability of i-th component
The failure probability equation of the “AND” gate is:
(2.4)
The developed QRMF uses Relex software to calculate frequencies and probabilities. The
advanced features of Relex Fault Tree Analysis software are that it supports quantitative
analyses, is user-friendly, provides computational flexibility, and quickly determines the
minimal cut sets by incorporating a Minimal Cut Set (MCS) engine (Misra, 2008). Figure
2.9 shows the Relex architect platform.
When no realistic data is available or no failure has occurred in the past, mathematical
tools, such as those of Freeman (2011), can generate reliable new data. Freeman (2011)
developed twelve tools to estimate failure ratios of any event that has no failure history.
The author classified the tools into two categories: best guess methods and confidence
limit methods. The methods deal with a variety of possible assumptions, such as
assuming that the failure has actually happened, hypothesis testing, uniform probability
distribution, exponential distribution, and/or binomial failure limits. However, a
minimum ten-year period of historical data is needed to estimate the event failure rate.
Two methods, presented in Equations 2.5 and 2.6, have been chosen to calculate the
failure rate ( ) during number of years of operation (n), which is at least 10 years:
- The ‘best guess method’ assumes that the event has actually happened:
(2.5)
where is a constant and has been found between 0.24 and 0.51.
- The ‘confidence limit method’ is recommended for explosion initiation test
estimates:
39
Figu
re 2
.9
A R
elex
Arc
hite
ct p
latfo
rm sa
mpl
e w
ith fa
ult t
ree
data
dis
play
ed.
40
(2.6)
The best guess method has been recommended for Chemical Process Quantitative Risk
Analysis (CPQRA), as the event is physically possible and more than ten years of history
are available. If the best guess answer is intolerable, the confidence limit method is
recommended to estimate the failure rate of devices with no failure history. Equations 2.5
and 2.6 are also recommended for explosion safety studies (Freeman, 2011).
Crowl and Louvar (2007) defined the failure probability (unreliability) P by Equation
2.7:
(2.7)
where: = time period ≥ 10 years
41
CHAPTER 3 QUANTITATIVE RISK MANAGEMENT FRAMEWORK
3.1 QRMF METHODOLOGY
Wilson and McCutcheon (2003) define risk as the possibility of injury, loss, or
environmental damage created by a hazard, with the significance of risk being a function
of the probability (likelihood) of an unwanted incident and the severity of its
consequences. Risk therefore arises from a hazard – i.e., the potential for a machine,
process, material, piece of equipment, or physical factor in the working environment to
cause harm to people, the environment, assets, or production. Risk management is the
complete process of understanding risk, risk assessment, and decision making to ensure
effective risk controls are in place and implemented. Risk management begins with
actively identifying possible hazards, leading to the ongoing management of those risks
deemed to be acceptable (Wilson & McCutcheon, 2003).
As previously mentioned, this research has focused on the QRM of dust and hybrid
mixture explosions with the development of a methodological framework for the
management of these risks. This framework is shown in a conceptual format in Figure
3.1. The following sub-sections provide details on key components of the framework.
The Quantitative Risk Management approach is proposed to assess and analyze dust and
hybrid mixture risks, together with the likelihood and the severity of consequences, and
then to provide tools based on a hierarchy of controls to prevent or mitigate dust and
hybrid mixture explosions.
The main goals of the QRMF:
to preclude or mitigate dust and hybrid mixture explosions in process industries
through a variety of safety methodologies avoiding any major changes in
process design or procedure,
to provide the optimal safety level in process industries handling dust or hybrid
42
Figure 3.1 A Quantitative Risk Management Framework (QRMF) for dust and hybrid
mixture explosion prevention based on the hierarchy of controls (Abuswer et al., 2011).
Steps Activities
Identify Hazards
Identify and characterize the dust/hybrid mixture potential (Pmax, MEC, MIE, LOC, MIT, etc.), also using the Fire and Explosion Index (F&EI).
Understand Hazards
Develop potential dust explosion scenario and its probability of occurrence, estimate the total risk, assess hazards, their causes and effects, and how these interact with the design, by using DESC and Relex.
Avoid Hazards
Reduce Severity
Reduce Likelihood
Apply Active Safeguards
Apply Passive
Avoid or eliminate hazard by design
Minimize, substitute, or moderate to reduce the severity of the dust/hybrid mixture hazard
Inherent
Safety
Principles Simplify the process or plant to reduce the likelihood of the dust/hybrid mixture hazard
Operation and maintenance procedures should be the last resort, especially for control and mitigation, where the chance of error or failure is
high.
Apply Procedural Safeguards
Use safeguards that do not need initiation and have high availability
Add-on, which use active systems, but depend on timely hazard
detection and initiation
Engineered
Safety
Quantitative
Risk
Assessment
Management
Dust/Hybrid
Mixture
Explosion
Prevention
Framework
Principles
Procedural
Safety
Use findings of hazard assessment to estimate the risks, and target and implement inherent/segregation/ add-on/procedural safeguards until risks are tolerable, and then apply management of change procedures.
Apply Residual Risk
Reduction Measures
Residual Risk
Control
Segregate Use distance or sections of the plant itself to
segregate/protect people and emergency systems from effects of hazards
43
mixtures that can be achieved by the hierarchy of controls,
to provide a Quantitative Risk Management protocol based, in part, on tools
developed for process risk reduction, and
to provide a clearer and more complete picture of dust/hybrid mixture accident
possibility scenarios through Relex and DESC analysis of accident scenarios.
The dust explosion prevention tools mentioned in section 2.3 have been modified for the
proposed framework to aid dust explosion prevention in the process industries. The
following tools are used: (1) the systematic approach to loss prevention, described in
section 2.3.3 and shown in Figure 2.4, which is presented in the research framework as a
general guide (i.e., using the same safety steps but with special tools for hazard
identification and hazard understanding); (2) the SCAP methodology (section 2.3.1),
which, by using DESC and Relex software, provides information on dust and hybrid
mixture hazards; and (3) the QRA methodology, which is used for external safety
(section 2.3.2), i.e., when appraising the external effects of a dust/hybrid mixture
explosion. The framework can be summarized as follows.
3.1.1 Hazard identification This step utilizes dust/hybrid mixture hazard identification, characterizes the dust/hybrid
potential by screening their explosibility parameters (Pmax, MEC, KSt, MIE, MIT, LOC),
and considers dust explosion affecting factors (particle size and agglomeration, moisture,
flammable gas content, inert content, etc.).
3.1.2 Risk analysis Once hazards have been identified, there is a need to analyze what risks may be present.
An industrial plant should be divided into groups (k) of modules (i) as a first step, and
then it should be determined how often an event, or incident, is likely to occur
(frequency), and what the consequences in each group would be should the event occur.
Total risk can be determined by the following equation (Woodruff, 2005):
(3.1)
44
where: R = total risk
S = severity of consequences
P = likelihood of occurrence
Accordingly, to determine total risk, the severity of consequences and the likelihood of
occurrence have to be calculated.
i) Severity of consequences
Determining dust/hybrid mixture incident consequences requires two steps. First,
dust/hybrid mixture explosion scenarios should be created for areas threatened by a dust
or hybrid mixture hazard. DESC software is able to anticipate and envisage explosions in
the affected locations. DESC’s main finding is the explosion overpressure (Pmax), which
is the most important parameter needed to calculate damage. Second, using a Probit
equation (3.2) (Mannan, 2005), the explosion magnitude, such as deaths, injuries, and
structural damage, can be measured depending on the number of causative variables (K1,
K2). Table D.1 (Appendix D), shows the causative variables in the magnitude of the
The structural damage percentage (P) can be transformed by using a Probit
transformation table, Table D.2 (Appendix D), or using Equation 3.3 and the error
function ( ) (equation 3.4).
∞
45
ii) Likelihood of occurrence The proposed framework (QRMF) uses Fault Tree Analysis to identify the likelihood or
probability of a dust or hybrid mixture explosion for a given scenario. FTA is an
analytical tool that employs deductive reasoning to determine the occurrence of an
undesired event by means of a series of “AND & OR” logic gates. Figure 3.2, drawn
with Relex software, shows the qualitative use of the developed FTA to depict all
possible events that could lead to a dust/hybrid mixture explosion, from the top event to
common basic events.
FTA can enable the determination of the frequency of accidents if reliable data is
provided, and can also reveal various likely basic causes which can lead to the top event
or accident. The top event probability or frequency is calculated from failure data of more
simple events.
- Dust explosion and hybrid mixture FTA flowchart
As mentioned above, Figure 3.2 shows a diagrammatic analysis of the undesired top
event in the fault tree and how it gathers all possible process industrial field events that
could lead to a dust/hybrid mixture explosion. However, it can be modified by removing
nonexistent events in any given process. This is described in the steps below, which
address the main explosion elements, as follows:
1- Dust/hybrid mixture explosion: This is the top event of the diagram. It is the worst
event that can occur and also the ultimate one. As such, it is the main target for
analysis in order to determine the likelihood of its occurrence.
2- Ignition source: In the explosion pentagon, ignition source is usually the hardest
element to avoid or control, as it can be anywhere and everywhere in industrial
processes (i.e., it could be an electrical, mechanical, chemical, or even natural event).
Abbasi & Abbasi (2007) have listed some possible ignition sources, which have been
used in the FTA flowchart; all that is required is to determine the probability of
occurrence for each of them in order to calculate the total probability of the main
ignition source element in the pentagon.
46
Figure 3.2 General dust and hybrid mixture explosion FTA flowchart.
Fault Tree Diagram
Gate1
Dust/Hybrid mixture explosion
Gate4
Dust cloud
Gate3
Ignition source
Event2
Total confinement
Gate6
Fuel
Event3
Oxidant concentration > LOC
Gate32
Mixing
From Page 48
Gate10
Dust
Event8
Combustible material
Event9
Concentration > MEC
Event10
Particle size < non-explosible
Gate27
Hy brid mixture
From Page 47
From Page 52
Basic Event
AND Gate
OR Gate
Transfer-In Gate
47
Fault Tree Diagram
Gate27
Hy brid mixture
Event5
Flammable gas
Gate29
Dust
Event6
Combustible material
Event7
Particle size < non-explosible
To Page 46
48
Fault Tree Diagram
Gate32
Mixing
Gate33
Dry ers
From Page 49
Event38
Shock waves
Event39
Dust collecting receivers
Gate34
Transport
Event40
Grinding
Gate35
Transfer
Event42
Blending
Event43
Screening
Event44
Granulating
Event45
Mixing into Reactors
Event46
Bagging and filling FIBCs
Event47
Emptying bags / FIBCs
To Page 46
From Page 51
Other From Page 50 Other
Event41
49
Fault Tree Diagram
Gate33
Dry ers
Event48
Fluid bed
Event49
Spray
Event50
Other
Event51
Flash
Event52
Belt
To Page 48
50
Fault Tree Diagram
Gate35
Transfer
Event58
Separators
Event59
Cyclones
Event60
Receivers and baghouses
Event61
Other
Event62
Silos and bins
Event63
Cartridge
Event64
Flexible intermediate bulk container
To Page 48
51
Fault Tree Diagram
Gate34
Transport
Event53
Air conveying
Event54
Belt conveyors
Event55
Other
Event56
Elevators
Event57
Screw conveyors
To Page 48
52
Fault Tree Diagram
Gate3
Ignition source
Event11
Hot work
Event12
Incandescent material
Event65
Electrical sparks
Event13
Hot surface
Event66
Self heating
Event15
Frction sparks
Event16
Shock waves
Event17
Static electricity
Event18
Electrostatic sparks
Event19
Lightning
Event20
Mechanical impact sparks
Gate15
Flames and direct heat
To Page 46
From Page 53
Other
Event14
53
To Page 52
Industrial ignition sources can be one or more of the following: flames and direct
heat (fire or welding), mechanical impact sparks, hot works, lightning, incandescent
material, electrostatic sparks, electrical sparks, static electricity, hot surfaces, shock
waves, self-heating, and friction sparks. There are also other known or unknown
ignition sources.
3- Confinement: This refers to the probability of total or partial confinement, depending
on where the explosion occurs.
4- Dust cloud: This consists of three main elements, and all three of these elements
must be present to form a dust cloud:
Fuel: this could be combustible dust with particle size within the explosible range
and a concentration above the MEC (minimum explosible concentration), or it
could be a hybrid mixture, which is a mixture of a small amount of flammable gas
and combustible dust.
Mixing: This is one of the five main principles of the explosion pentagon and is
also the element that makes the dust airborne. Within the industrial process,
suspension usually occurs when one or more of the following processes or pieces
of equipment exist: dryers (fluid bed, spray, flash, or belt), emptying bags/FIBC
(flexible intermediate bulk containers), dust collecting receivers, mixing into
Fault Tree Diagram
Gate15
Flames and direct heat
Event33
Fire
Event35
Other
Event37
Welding
54
reactors, transport (pneumatic conveyors, belt conveyors, or elevators),
granulating, grinding, screening, transfer (separators, flexible intermediate bulk
containers, cyclones, silos and bins, receivers and bag houses, or cartridges),
and/or blending. Suspension may also occur as a result of sudden shock waves or
other events.
Oxidant concentration: oxygen is one of the elements of the fire triangle and the
explosion pentagon, whose concentration is fundamental in explosion control
procedures. It affects the probability of occurrence and also affects the
consequences of any possible explosion. Excess oxidants stimulate a swift and
complete reaction, and vice-versa.
3.1.3 Risk estimation Risk estimation is defined as a measure of human injury or death, production and/or
property loss, and/or environmental damage created by a hazard. The significance of risk
estimation is a function of the probability of an unwanted incident and the severity of the
consequences (Wilson & McCutcheon, 2003). There are three common ways to gauge
risk: risk indices, individual risk (RInd), and group (societal) risk. According to many
studies, there are a variety of specific equations and definitions that address these kinds
of measures, as follows (CCPS, 2000).
i) Individual risks
“Individual risk is defined formally (by the Institution of Chemical Engineering, UK) as
the frequency at which an individual may be expected to sustain a given level of harm
from the realization of specified hazards” (Khan, 1999). Individual risk could be
determined in various ways, such as:
- Location-specific individual risk (LSIR)
LSIR calculates the risk at a particular location hypothetically; it is not a realistic method
to calculate individual risk (Khan, 1999). It is shown in Equation 3.5.
55
(3.5)
(3.6)
where: = frequency of scenarios
= probability of death
= probability of local fatality in the fire/explosion
= probability of fatality during escalation/mustering
= probability of fatality during evacuation.
- Individual – specific individual risk (ISIR)
ISIR calculates the risk at different locations, taking into account different lengths of time
for workers, and is a more realistic measure (Khan, 1999), as shown in Equation 3.7.
(3.7)
where: = proportion of time an individual spends in a location.
- Average individual risk (IR)
The IR of exposed people in certain workplaces can be determined by Equation 3.8
(CCPS, 2000).
where: = average individual risk in the exposed population (
= individual risk at location x,y (
=
= frequency of incident outcome, case (
= probability of fatality
= number of people at location .
56
Equation 3.9 calculates average individual risk of the total population whether they are
inside the threatened facility or in nearby residences (CCPS, 2000).
where: = total predetermined population for average risk.
The acceptance of individual risk (IR) is quite different from one country to another; it
depends on the country’s regulations and rules e.g. the acceptance IR in the Netherlands
is per year, and per year for societal risk, however the acceptance IR in UK is
per year, per year for workers, and per year for broadly accepted risk
(Kauer, et al., 2002). The maximum acceptable individual risk range in the process
industries is to ; however the maximum acceptable public individual
risk range is to (CCPS, 2009).
ii) Risk Indices
- Fatal accident rate (FAR)
FAR is the number of fatalities per 108 exposed hours, which is roughly the number of
exposed hours at work in 1,000 working lifetimes. The typical FAR range is 1-30 for
industries. FAR is more understandable that individual risk. Equation 3.10 calculates
FAR from ISIR (Khan, 1999).
(3.10)
where: = hours of work per year.
Table 3.1 provides a list of fatal accident rates for selected industries in Australia.
57
Table 3.1 Fatal accident rates in Australian industry (Cameron & Raman, 2005).
Industry category FAR Mining (non-coal) 27 Mining (coal) 17 Agricultural, forestry 11 Construction 9 Chemicals, petroleum 4 Other manufacturing 3
iii) Group (societal) risks A societal risk is defined by the Institution of Chemical Engineering, UK, as the
relationship between the frequency and the number of people suffering a given level of
harm from the realization of specified hazards (Khan, 1999).
- F-N curve
F-N curve is a societal risk measure that displays cumulative frequencies (F) of an event
versus number of fatalities (N). The curve plots the F-N historical data and shows in
which region (unacceptable, tolerable, or acceptable) they are. Also, it compares the
historical data with QRA results, i.e., after application of the QRM protocol on given
threatened plant (CCPS, 2000).
- Average Rate of Death (ROD)
ROD is a societal risk measure that is not related to any individual risk. It is determined
by Equation 3.11 (CCPS, 2000):
(3.11)
where: = the number of fatalities resulting from outcome case .
- Equivalent societal cost (ESC):
58
Multiple fatalities can be the outcome of a series of incidents or of one incident. ESC
takes incident outcomes into account and shows which ones can cause the most severity.
Equation 3.12 calculates the ESC (CCPS, 2000).
(3.12)
where: = risk aversion power factor = 2 for chemical industries.
3.1.4 Risk evaluation Risk evaluation is the stage at which values and judgments enter the decision process.
This process addresses the question: Is the risk judged to be acceptable? (Wilson &
McCutcheon, 2003). If the answer is “Yes”, no necessary changes need to be made to the
system; the residual risk should be managed and the activity continued. However, if the
answer is “No”, the question remains: What should be done?
There are many risk criteria to evaluate risk, such as ALARP and DMRA.
- ALARP (As Low As Reasonably Practicable)
In order to reduce risk at working areas, and taking into account the concept of
“reasonably practicable”, the HSE (Health and Safety Executive) in 1974 developed
ALARP principles as a simple method for its working staff. The principles are illustrated
in Figure 3.3, which shows the unacceptable region (intolerable risk level), tolerable
region, and acceptable region.
The HSE reported a tolerable individual and societal risk for workers from /year
to / year and a tolerable risk for public from / year to / year
(Mannan, 2005).
- DMRA (Decision matrix risk-assessment)
Marhavilas & Koulouriotis. (2008) developed a systematic technique for risk estimation
known as decision matrix risk assessment (DMRA). DMRA measures and categorizes
risk in terms of its probability of occurrence and its severity of consequences by
combining them in the same matrix, as shown in Table 3.2-a and Table 3.2-b. The
59
Figure 3.3 HSE framework for tolerability of risk (after (IET, 2010)). authors have also developed two scales of values, each with six gradations; the first scale
shows severity of consequences ratings, and the second scale shows frequency or hazard
probability ratings as may be seen in Tables E.1 and E.2 in Appendix E (Marhavilas &
Koulouriotis, 2008).
3.1.5 Risk control Risk control, as mentioned in Chapter 2, is the process of reducing risk by decreasing the
likelihood and/or consequences of the hazardous event. This process needs to be
reviewed, applying changes as necessary. If risk or residual risk is too high and changes
cannot be made safely, the right decision is to discontinue the activity.
The quantitative risk management framework for dust and hybrid mixture explosion
prevention is based on a hierarchy of controls, as shown in Figure 3.1, and gathers
together three different methodologies – inherent safety, engineered safety, and
procedural safety – to deal with dust and hybrid mixture hazards. The idea of the
framework is to apply the safety controls, starting with the most effective one (inherent
safety) and moving to the least effective (with respect to inherent safety), which is
procedural safety. When a safety control tool consists of one or more applicable
principles, these principles should be applied in optimal sequence, as follows:
i) Inherent safety
minimization
substitution
moderation, and
simplification.
61
ii) Engineered safeguards
engineered safety – passive
engineered safety – active
iii) Procedural safeguards
Amyotte et al. (2007) provide an illustrative example of a process safety and occupational
safety checklist form, shown in Table 3.3. However, each company should have its own
inherent safety-based checklist (Amyotte et al., 2007).
3.1.6 Residual risk control Finally, the given process has to be extensively reviewed and monitored to make sure the
applied changes do not affect the process parameters at any point in the whole system, a
step which requires the application of the MOC (management of change) procedure.
Figure 3.4 illustrates an inherent safety-based MOC protocol.
3.2 QRMF IMPLEMENTATION
Implementation of the conceptual framework, which is given in Figure 3.1, is undertaken
by means of the flowchart shown in Figure 3.5. Topics of the developed QRMF include
quantitative Fault Tree Analysis and the use of Probit models to express explosion
consequences in terms of parameters other than overpressure. The case studies detailed in
Chapter 5 emphasize QRMF applications using consequence analysis, DESC, FTA, and
considerations related to the hierarchy of safety controls.
62
Table 3.3 Inherent safety checklist (Amyotte et al., 2007).
Guideword Checklist Question
Minimize
• Is the storage of all hazardous gases, liquids, and solids minimized?
• Are just-in-time deliveries used when dealing with hazardous materials?
• Are all hazardous materials removed or properly disposed of when they are no longer needed or not needed in the next X days?
• Is shift rotation optimized to avoid fatigue?
Substitute
• Can a less toxic, flammable, or reactive material be substituted for use?
• Is there an alternate way of moving product or equipment as to eliminate human strain?
• Can a water-based product be used in place of a solvent- or oil-based product?
• Are all allergenic materials, products, and equipment replaced with nonallergenic materials, products, and equipment when possible?
Moderate
• Can potential releases be reduced via lower temperatures or pressures, or elimination of equipment?
• Are all hazardous gases, liquids, and solids stored as far away as possible to eliminate disruption to people, property, production, and environment in the event of an incident?
• When purchasing new equipment, are acceptable models available that operate at lower speeds, pressures, temperatures, or volumes?
• Are workplaces designed such that employee seclusion is minimized?
Simplify
• Are all manuals, guides, and instructional material clear and easy to understand, especially those that are used in an emergency situation?
• Are equipment and procedures designed such that they cannot be operated incorrectly or carried out incorrectly?
• Are machine controls located to prevent unintentional activation while allowing easy access for stopping the machine?
• Are all machines, equipment, and electrical installations easily isolated of all sources of power?
63
Figure 3.4 An inherent safety-based management of change protocol (Amyotte et al.,
2007).
Inherent Safety Guidewords Identify Need for Change
Identify Required Review and Approval Stage
Conduct Required Hazard Review
Take Action to Control Hazards
Obtain Approval
Implement and Follow-up
Inherent Safety Guidewords/Checklist
Inherent Safety Guidewords/Checklist
64
Figure 3.5 Flowchart for implementation of conceptual risk management framework
for dust and hybrid mixture explosions.
Manage residual risk and continue activity
Is risk acceptable?
Yes
Yes Have all principles of hierarchy of controls
been applied?
No
Stop activity
Is risk acceptable?
Yes
Review requirements Establish and implement
procedures to prevent dust/hybrid mixture
release out of process equipment
Yes
Apply Management of
Change
Does dust/hybrid mixture present an explosion hazard?
Table 4.3 20-L explosibility data for granulated sugar powder.
Test No.
Concentration [g/m3]
Pm [bar(g)]
(dP/dt)m [bar/s]
KSt [bar•m/s]
1 125 1.7 22 6
2 250 3.3 99 26
3 500 6.3 178 48
4 750 6.9 214 58
5 1000 6.7 170 46
6 1250 5.5 99 25
7 1500 4.0 71 19
4.2 DUST EXPLOSION SIMULATION CODE (DESC)
4.2.1 Simulation preparation As DESC was used to estimate the consequences of the dust explosions of the given case
studies, the primary step for the DESC simulation was preparing the fuel files. The files
were produced by Excel spreadsheets (Figure 4.4) containing experimental data acquired
in a 20-L Siwek chamber, along with other thermodynamic data (e.g., KSt, Pmax,
[dP/dt]max, particle density, particle size, and dust thermodynamic and physical
properties) for each fuel material. All of this information was added to the working
directory, to be read by the DESC simulation Run-Manager. Then, the explosion
geometry in the DESC pre-processor CASD (Computer Aided Scenario Design) (Figure
4.5) was built for each case study and the required parameters, such as geometry monitor
points, initial and boundary conditions, pressure relief panels, fuel information (name,
composition and shape), and ignition source (position and strength in kJ) were selected.
Table 4.4 gives a general idea of the simulation input data.
71
Figure 4.4 Part of a DESC Excel spreadsheet.
Figure 4.5 A silo geometry in CASD (Computer Aided Scenario Design) window.
72
Table 4.4 DESC scenario input data for 400 m3 polyethylene silo geometry.
No. The scenario section
1 Simulation volume size (x, y, z) = (30 m, 30 m, 34 m)
2 Grid cells (x, y, z) = (25 m, 25 m, 75 m) 3 Fuel name is “MAIZE” 4 Dust concentration = 500 g/m3 5 Number of monitor points = 30 6 Number of pressure panels (PP) = 6 7 Ignition = 10 kJ
The simulations were run using the Run-Manager program (as seen in Figure 4.6), with
each simulation process lasting from a few minutes to several hours, depending on
geometries sizes. The DESC calculations and plotting curves were monitored while the
programs were running. Simulations of the explosion temperatures, pressure and fuel
consumption were developed and then displayed in 2-D and 3-D in the Flowvis program.
Figure 4.6 DESC run-manager window.
73
4.2.2 Validation and simulations Skjold (2007) discussed DESC validation work that was performed by GexCon. Such
work was also performed by the Health and Safety Laboratory (HSL) in the UK, which
involved a large-scale system of two interconnected vessels (Skjold, 2007).
DESC has been validated as the first step in the numerical research program on dust and
hybrid mixture explosions. The maximum explosion pressures produced by DESC
simulations in a 20-L chamber was compared with relevant experimental data for icing
(powdered) sugar and granulated sugar, and 200-mesh polyethylene. The error
percentages between experimental and predicted data for different materials were found
to be less that 5%, as shown in Table 4.5. Other DESC simulations were run for larger-
scale geometers of a 1-m3 spherical vessel and a 400-m3 cylindrical silo. The results
showed the same maximum explosion pressure (Pmax) but different total explosion times
(texp) for each material, as can be seen in Table 4.6. The explosion period in larger vessels
is of longer duration.
The next chapter shows, in detail, DESC simulations of case studies of the Imperial Sugar
refinery explosion and the grain silo explosion in Blaye, as well as another hypothetical
explosion in a 400-m3 silo, to predict the consequences of polyethylene explosions
Table 4.5 The percent error of dust explosion Pmax between the experimental and DESC of different materials in 20-L chamber.
Dust Material
Pmax (bar(g)) Percentage
Error Experimental DESC Simulation
Icing Sugar 7.2 7.4 2.7 %
Granulated Sugar 6.9 7.0 1.4 %
Polyethylene 6.7 6.5 3.0 %
74
Table 4.6 Comparison between different materials at different explosion volumes in terms of DESC Pmax and tmax.
Figures 4.7 and 4.8 show the DESC simulation results (Pmax and texp) for icing sugar in
20-L and 1-m3 chambers. The highest explosion pressure attained in both simulations is
7.2 bar(g), which is within 3 % of the experimental value. As shown in Figures 4.9 and
4.10, the peak overpressure for the granulated sugar in the 20-L and 1-m3 chambers was
also the same: 6.9 bar(g). In each case (icing and granulated sugar), the explosions in the
different-sized chambers have similar maximum explosion pressures but require more
time to attain the peak overpressure in the larger 1-m3 chamber (all with central ignition
and a dust concentration of 500 g/m3).
Figure 4.7 DESC simulation of icing sugar explosion in a 20-L spherical chamber
20-L Vessel
1-m3 Vessel
400-m3
Material Pmax (bar(g))
texp (s)
Pmax (bar(g))
texp
(s) Pmax
(bar(g)) texp (s)
Sugar Icing 7.4 0.26 7.4 0.65 7.4 3.9
Granulated 7.0 0.28 7.0 0.69 7.0 4.2
Polyethylene 6.5 0.09 6.6 0.23 6.6 1.75
75
Figure 4.8 DESC simulation of icing sugar explosion in a 1-m3 spherical chamber.
Figure 4.9 DESC simulation of granulated sugar explosion in a 20-L spherical
chamber.
Figure 4.10 DESC simulation of granulated sugar explosion in a 1-m3 spherical
chamber.
76
Similarly, more time is needed to reach the peak overpressure in an even larger volume,
as shown in Figures 4.11 and 4.12 for a 400-m3 storage silo.
Figure 4.13 shows simulation results obtained for explosions of a 48-μm polyethylene
sample in 20-L chambers (with central ignition and a dust concentration of 500 g/m3).
Figure 4.11 DESC simulation of icing sugar explosion in a 400-m3 cylindrical silo
without explosion vents.
Figure 4.12 DESC simulation of a granulated sugar explosion in a 400-m3 cylindrical
silo without explosion vents.
77
Figure 4.13 DESC simulation of 48-μm polyethylene explosion in a 20-L spherical
chamber (Amyotte et al., 2010).
78
CHAPTER 5 CASE STUDIES
This chapter demonstrates the application of the framework to three case studies. Two of
them occurred in the past: the dust explosion at the Port Wentworth Imperial Sugar
refinery in Georgia, US, in 2008, and the hybrid mixture explosion at the grain silo at the
Semabla company in Blaye, France, in 1997. However, the third case study was applied
to a hypothetical dust explosion in a polyethylene 400-m3 cylindrical silo. Each case
study’s geometry has, in the DESC pre-processor CASD, been built similar to its relevant
real dimensions, and possible scenarios have then been simulated by DESC. Risk
estimations (risk indices (ROD, FAR, ESC), individual risk, and societal risk) have been
determined for each case study, before and after the framework was applied. Probit
equations were used to estimate the severity of consequences, and Fault Tree Analysis
was used to calculate the probabilities of the explosions.
In this research, the main changes in the case studies when applying the QRMF were in
basic events in the Fault Tree Analysis, which consequently affected the risk estimation
calculations. These case studies clearly show the framework’s benefits in reducing the
risks to acceptable or tolerable zones.
5.1 THE IMPERIAL SUGAR REFINERY DUST EXPLOSION
5.1.1 Refinery description The Imperial Sugar refinery in Port Wentworth, Georgia, US is one of the largest sugar
refineries and packaging complexes in the United States. It consists of three granulated
sugar storage silos (32 m tall and 12.2 m in diameter) as shown in Figure 5.1 and Figure
5.2, a Bosch packing building (for granulated sugar, packaging machines, and packaging
supplies), a south packing building (housing different kinds of manufactured sugar), and
other facilities. The buildings are connected to each other by a complex transportation
79
Figure 5.1 Granulated sugar supply and discharge through the silos (CSB, 2009). system that consists of aero belts, packed elevators, screw conveyors, and conveyor belts.
Granulated sugar from the refinery enters Silo no. 3 and is then transported to Silos no. 1
and 2 to start special processes (e.g., converting sugar to powdered sugar) and packaging
procedures (CSB, 2009).
5.1.2 Explosion causes Prior to the explosion at the Imperial Sugar refinery, the transportation system and
hammer mills produced airborne sugar in the work areas, and the undersized dust
collection system failed to decrease the concentration levels of the dust clouds.
Furthermore, workers had used compressed air to clean the packaging machines. Over
time, thick layers of sugar dust accumulated on elevated surfaces and in narrow places, in
addition to the spilled sugar that built up, unnoticed, in crevices around the machines
(CSB, 2009). In 2007, the company covered the conveyor belts with stainless steel panels
to protect the sugar from contamination during the manufacturing process. However, with
80
Figu
re 5
.2
Pack
ing
build
ings
: firs
t flo
or p
lan
(CSB
, 200
9).
81
the movement of the belts and the absence of any kind of ventilation system inside the
enclosure, the sugar dust concentration increased until it surpassed the MEC (CSB,
2009).
5.1.3 Explosion event On February 7, 2008, an unknown ignition source inside the enclosed conveyor belts
contacted the airborne dust, which was within the explosible concentration range, and a
dust explosion took place in the packing building under the silos. The explosion’s shock
waves sent settled dust throughout the refinery into the air, and resulted in a secondary
dust explosion, which caused a fire and the complete destruction of the refinery. The
explosion killed 14 workers and injured 36 (CSB, 2009). Table 5.1 summarizes the
fatalities, injuries, and number of workers on each floor of the refinery. The total number
of workers at the refinery on the night of the accident was 135. All of the deceased were
killed from injuries sustained from the structural damage or from severe burns.
Table 5.1 The number of injured, deceased, and uninjured workers at the Imperial
energy have been defined and adjusted according to the available data. Table 5.3 presents
some important required data for the simulation.
- Structure damage:
No one was killed in the refinery from the explosion impact or explosion shock waves.
However, four workers were fatally burned when trapped under the falling floor, four
workers died at the scene when surrounded by fire and unable to escape, six workers died
at the hospital due to serious burns, and 36 workers had various kinds of injuries (13 were
severely injured and 23 had minor injuries); 85 workers remained uninjured during the
incident (CSB, 2009). Nevertheless, the spectacular explosions, numerous fatalities, and
extensive damage prompted widespread reports of the accident.
86
Figure 5.6 DESC representation of interconnected 3700-m3 silos and the monitoring
points (M1 – M80) at the Imperial Sugar refinery. Table 5.3 DESC scenario input data for Imperial Sugar refinery geometry.
No. DESC scenario input data 1 Simulation volume size (x, y, z) = (110 m, 70 m, 95 m) 2 Geometry size (x, y, z) = (85 m, 50 m, 70 m) 3 Fuel name is “Icing Sugar” 4 Dust concentration = 500 g/m3 5 Number of monitor points = 80 6 Number of pressure panels (PP) = 58 7 Ignition energy = 10 kJ
Using the Probit equation 3.2, the damage which occurred as a result of the maximum
pressure obtained from DESC can be estimated. using Table D.1 and Table D.2 in
Appendix D, with the structural damage and its causative variables (K1, K2), the equation
will be: .
87
Figures 5.7 to 5.10 show top views of the working floors. DESC pressure simulations of
each work area revealed that the maximum explosion pressure (Pmax) reached inside the
working areas during the simulation was 25 kPa, which was attained at 2.6 s of the
simulation time. The top-view figures below define the pressure distribution at each floor.
The areas are bounded with contour lines to designate various pressure zones (A – R).
Each zone has a different color to indicate pressure magnitude.
Figure 5.7 DESC pressure simulation from a plane view of the first floor, Module
(2,1) of the Imperial Sugar refinery explosion.
A
B D
C
P (bar·g)
88
Figure 5.8 DESC pressure simulation from a plane view of the second floor, Module
(2,2) of the Imperial Sugar refinery explosion.
Figure 5.9 DESC pressure simulation from a plane view of the third floor, Module
(2,3) of the Imperial Sugar refinery explosion.
E F
G
H
I
K
L
J
M
P (bar·g)
P (bar·g)
89
Figure 5.10 DESC pressure simulation from a plane view of the fourth floor, Module
(2,4) of the Imperial Sugar refinery explosion. Figures 5.11 to 5.14 show the development of the explosion pressure, measured by the
monitor points (M1 – M67), with respect to time on each floor. Figure 5.11 shows two
explosion pressure peaks, which represent the primary explosion pressure inside the
enclosure and the secondary explosion pressure on the first floor, respectively. At 1.2 s,
the explosion pressure in the enclosure reached 0.3 bar(g) (30 kPa), which is the adjusted
relief pressure of the vents that represent the enclosure walls’ strength. Then, the pressure
suddenly decreased to nearly zero bar(g) because the pressure had been released into the
refinery’s first floor area, which was much larger than the enclosure. Shortly thereafter, at
1.7 s, the secondary explosion started as a result of the pre-explosion conditions existing
on the first floor. The secondary explosion pressure then increased until it reached 0.2
bar(g), which was the panels’ opening pressure on the refinery walls. The pressure
continued to increase for a few milliseconds longer, reaching 0.25 bar(g) at 2.4 s, as the
explosion pressure rate was significantly higher than the pressure releasing rate (venting).
N O
R
P Q
P (bar·g)
90
Figure 5.11 DESC pressure/time simulation at the monitor points on the first floor,
Module (2,1) of the Imperial Sugar refinery explosion.
Figure 5.12 DESC pressure/time simulation at the monitor points on the second floor, Module (2,2) of the Imperial Sugar refinery explosion.
91
Figure 5.13 DESC pressure/time simulation at the monitor points on the third floor,
Module (2,3) of the Imperial Sugar refinery explosion.
Figure 5.14 DESC pressure/time simulation at the monitor points on the fourth floor,
Module (2,4) of the Imperial Sugar refinery explosion.
92
Then, the pressure curve dropped off rapidly when the pressure was fully released. At 3.1
s, the pressure fluctuated for a few seconds (due to some remaining compressed zones
inside the floor) until it completely released at 6 s. Figures 5.12 to 5.14 show the
explosion pressure peaks for the second, third, and fourth floors, all three of which had
nearly identical pressure development during the same explosion time (6 s).
The Probit equation and the transformation table shown in Appendix D determined the
structural damage at each zone as a damage percentage. Considering the fire effects on
the workers who were trapped at the most damaged areas, the zones’ danger degrees took
the same damage percentages (i.e., any zone with 25%, 22%, or 16% damage will have
the same value of fatalities). Explosion pressure, along with its corresponding Probit
value and the damage percentage for each zone in the work areas, can be seen in Tables
5.4 to 5.7.
Table 5.4 Estimated Probit damage percentages caused by explosion overpressure of
incident outcome cases at Module (2,1).
Incident outcome case
Pmax [bar(g)] Y Damage
percentage (%)
A 0.22 5.39 65
B 0.25 5.77 78
C 0.23 5.52 70
D 0.16 4.47 30
93
Table 5.5 Estimated Probit damage percentages caused by explosion overpressure of incident outcome cases at Module (2,2).
Incident
outcome case Pmax
[bar(g)] Y Damage percentage (%)
E 0.25 5.77 78
F 0.22 5.39 65
G 0.16 4.47 30
H 0.16 4.47 30
I 0.10 3.10 03 Table 5.6 Estimated Probit damage percentages caused by explosion overpressure of
incident outcome cases at Module (2,3).
Incident outcome case
Pmax [bar(g)] Y Damage
percentage (%)
J 0.22 5.39 65
K 0.25 5.77 78
L 0.16 4.47 30
M 0.25 5.39 78 Table 5.7 Estimated Probit damage percentages caused by explosion overpressure of
incident outcome cases at Module (2,4).
Incident outcome case
Pmax (bar(g)) Y Damage
percentage (%)
N 0.22 5.39 65
O 0.25 5.77 78
P 0.16 4.47 30
Q 0.04 0.42 0
R 0.07 2.06 01
94
ii) Likelihood calculations As mentioned, historical information for at least ten years is required to obtain a reliable
likelihood assessment. The basic events data of the refinery-developed FTA have been
generated from Equation 2.5 (the best guess method) and Equation 2.6 (the confidence
limit method), as recommended by Freeman (2011) for explosion initiation test estimates.
As no historical data is available for the refinery, and n = t = 10 years have
been used for basic events such as bagging and filling FIBCs and transfer units. However,
Equation 2.7 has been used for events that were expected to have a significantly larger
contribution to probability for explosion initiation, such as dust collecting receivers,
ignition sources, shock waves, and belt conveyors. Due to the generally unsafe conditions
under which the sugar refinery operated, the failure probabilities of the units that had a
large effect on the explosion are estimated as follows:
- The confinement, the dust concentration, and the combustible material
probabilities were 0.99; the first two probabilities were due to the enclosure
covering the conveyor belt, and the third probability was due to the sugar
material.
- As the explosion occurred at normal atmosphere inside the enclosure, the oxidant
concentration probability (to be above the LOC) was 0.8.
- Rationally, the practical size probability was 0.25 because at least 25% of the
airborne dust sugar was less than the non-explosible diameter.
- The probability that the transport system (belt conveyors, elevators, and screw
conveyors) contributed to the complete dust mixing is 0.25 because they were the
type of machines (in relatively constant movement) that could raise the sugar dust
into the air.
Table 5.8 summarizes the calculated probabilities of occurrence for the basic events at the
Imperial Sugar refinery prior to the explosion. The failure rates ( ) for basic events
were calculated using Equations 2.5 and 2.7; then failure probability was calculated using
Equation 2.8. Other probabilities, such as dust concentration, belt conveyors, mechanical
impact sparks, etc., were estimated as explained in the previous paragraph.
95
Table 5.8 Failure rates of the explosion basic events at the Imperial Sugar refinery.
Stainless steel panels to cover the conveyor belts below the tall silos
Simplification
Eliminate opportunities for errors by eliminating excessive add-on safety features and protective devices by removing the new stainless steel panels that cover the conveyor belts below the tall silos.
Using compressed air to clean the packaging machines
Substitution
Replace the hazardous cleaning procedure (using compressed air to clean the packaging machines) with one that is less hazardous, e.g. using dust vacuum cleaners
7. Understand the residual hazard
i) Consequence analysis
- DESC simulation
Based on the risk controls, detailed in section 5.1.4 at step 6, new DESC simulations
were run on the refinery geometry. Table 5.17 shows the simulation parameters that were
changed to achieve safer operations. The pressure panels at the steel enclosure, Module
(1,1) have been adjusted to open at zero bar(g) to represent enclosure removal. Module
(1,2) and Module (1,3) pressure panels were unchanged because they cover the
transportation system outside the building. However, pressure panels in groups 1, 3, 4, 5,
and 7 were adjusted to open at 0.05 bar(g) (5 kPa).
108
Table 5.17 Opening pressure values of pressure panels and their sizes in the Imperial Sugar refinery, after applying the QRMF.
Pressure panel
no. Opening pressure
( kPa ) Size
( m2 ) PP1 – PP4 P58 P57
0 0 0
68 85 20
PP5 – PP8 PP53 – PP56
30 30
25 20
PP9 – PP12 30 40 Group 1 5 84 Group 2 30 84 Group 3 5 84 Group 4 5 84 Group 5 5 84 Group 6 30 112 Group 7 5 294
The simulations showed that the pressure panels, shown in Table 5.17, at the adjusted
opening pressure, are able to release any explosion pressure inside the refinery before it
causes significant damage. Also, the dust concentration was adjusted to 250 g/m3, which
can be achieved by applying the inherent safety principle of minimization (i.e., good
housekeeping).
The various colors in Figures 5.17 to 5.20 demonstrate the maximum explosion pressure
reached during the DESC simulations. The simulations show that the pressure
distribution is almost the same inside the buildings during the explosion. However, when
the venting relief pressure value is reached, different pressure areas (colored zones) arise,
indicated by different shapes and colors. These areas are the consequence of both
pressure release and explosion reaction continuation.
109
Figure 5.17 DESC pressure simulation from a plane view of the first floor, Module
(2,1), of the Imperial Sugar refinery explosion, after applying the QRMF.
Figure 5.18 DESC pressure simulation from a plane view of the second floor, Module
(2,2), of the Imperial Sugar refinery explosion, after applying the QRMF.
A
B
C
D
110
Figure 5.19 DESC pressure simulation from a plane view of the third floor, Module
(2,3), of the Imperial Sugar refinery explosion, after applying the QRMF.
Figure 5.20 DESC pressure simulation on a plane view of the fourth floor, Module
(2,4), of the Imperial Sugar refinery explosion, after applying the QRMF.
E
F
G
H
I
J
111
Figures 5.21 to 5.24 are plotted in DESC to show the pressure development during the
explosion time. The pressure/time simulations were recorded by the local monitoring
points (M2 – M66) and reflect Figures 5.17 to 5.20, respectively. The explosion started
and ended nearly at the same time (an 8 s duration) across all four floors, as can be seen
in the Figures 5.21 to 5.24. The maximum explosion pressure exceeded the opening
panels’ pressure, 0.05 bar(g), to reach 0.06 bar(g) because of the relatively high KSt. value
with respect to the venting areas. However, the Pmax was still under the destruction
pressure value of 0.07 – 7.0 bar(g). The pressure took about 5 s to entirely release.
Figures 5.21 to 5.24 also show that the explosion took longer to start and had a longer
duration compared to the explosion before applying the QRMF because of the effect of
the decreased dust concentration (from 500 g/m3 to 250 g/m3) and the lower wall vent
relief pressure, from 0.2 bar(g) to 0.05 bar(g).
Figure 5.21 DESC pressure/time simulation at monitor points on the first floor,
Module (2,1), of the Imperial Sugar refinery explosion, after applying the QRMF.
112
Figure 5.22 DESC pressure/time simulation at monitor points on the second floor,
Module (2,2), of the Imperial Sugar refinery explosion, after applying the QRMF.
Figure 5.23 DESC pressure/time simulation at the monitor points on the third floor,
Module (2,3), of the Imperial Sugar refinery explosion, after applying the QRMF.
113
Figure 5.24 DESC pressure/time simulation at monitor points on the fourth floor,
Module (2,4), of the Imperial Sugar refinery explosion, after applying the QRMF.
Explosion pressure, the corresponding Probit value (Y), and the damage percentage for
each zone after applying the QRMF are presented in Table 5.18. Table 5.18 shows slight
damage occurred after the risk controls were applied, which clearly indicates the
framework’s validity in assessing and reducing the potential impact of dust and hybrid
mixture explosions.
114
Table 5.18 Estimated Probit damage percentages caused by explosion overpressure of incident outcome cases in the simulated refinery.
Incident
outcome case Pmax
[bar(g)] Y Damage percentage (%)
A 0.055 1.35 1.31*10-2 B 0.060 1.60 3.37*10-2 C 0.060 1.60 3.37*10-2 D 0.055 1.35 1.31*10-2 E 0.060 1.60 3.37*10-2 F 0.055 1.35 1.31*10-2 G 0.040 0.42 2.33*10-4 H 0.030 0 No likely damage I 0.020 0 No likely damage J 0.015 0 No likely damage
ii) Likelihood calculations Table 5.19 compares the probabilities of occurrence of the basic events of the Imperial
Sugar refinery explosion before and after applying the QRMF. Some of the basic events
in the Imperial Sugar fault tree flowchart (Figure 5.15) have been recalculated to address
the applied safety controls. Figure 5.25 showed the estimated probability of the dust
explosion in the refinery after applying the QRMF, reducing the probability of
occurrence of some basic events. The modified basic events were generated according to
the following reasoning:
When the dust concentration probability is minimized to 0.0325, the dust
collection receivers will collect less dust, and airborne dust particles will also be
minimal.
Removing the steel cover (the enclosure) will reduce the primary explosion risk
and shock-wave probability, and minimize the total confinement probability.
Applying detailed and written procedural safety (in writing), such as creating
checklist, routinely evaluating dust accumulation in hidden areas, applying
115
Table 5.19 The estimated failure rate of the explosion’s basic events at the Imperial Sugar refinery before and after applying the QRMF.
Average individual risk on the fourth floor calculated using Equation 3.9:
The average individual risk for the entire refinery, after QRMF, is:
- Location-specific individual risk (LSIR)
The LSIR for each floor has been re-calculated from Equation 3.5 to identify the
hypothetical risk, after applying the QRMF, at each location.
LSIR1 = + =
LSIR2 = + =
LSIR3 = + + =
LSIR4 = 0.0
The total LSIR is re-calculated as:
+ + =
123
- Individual – specific individual risk (ISIR)
The ISIR for each floor has been calculated from Equation 3.7 to identify the risk at
different locations, after applying the QRMF, taking into account employee working
time.
ISIR1 = 2.06*10-8 * 8/24 = 0.69*10-8
ISIR2 = 2.06*10-8 * 8/24 = 0.69*10-8
ISIR3 = 2.07*10-8 * 8/24 = 0.69*10-8
ISIR4 = 0
The total individual-specific individual risk (ISIR) is:
- Fatal accident rate (FAR)
FAR is re-calculated, as well, from the average individual risk for the exposed employee
population from Equation 3.3.
fatalities /108 man-hours of exposure
- ALARP As shown in Figure 5.26, and according to the HSE (Health and Safety Executive),
ALARP (as low as reasonably practicable) range is from to . The
acceptable risk to the public per year is in the region of to . Therefore,
the value of per year, which is the individual risk (IR) of the Imperial Sugar
refinery before applying the conceptual framework, was within the unacceptable range.
However, the individual and societal risks of the given case study after applying the
safety controls are completely acceptable with IR equal to . These values show
a significant reduction of the dust explosion probability, with the refinery becoming
substantially safer with the new applied controls.
124
Table 5.24 compares the risk measure results obtained before and after applying the
QRMF controls. The numbers show that the total risk has been reduced for each single
measure: the probability of occurrence has been reduced, along with the IR, the LSIR, the
ISIR, and the FAR, which are completely safe.
Figure 5.26 HSE frameworks for tolerability of risk (after IET, 2010). Table 5.24 Summary of the individual risk results for the Imperial Sugar refinery
5.2.1 Semabla installation description Semabla boasted the largest grain storage installations in France. The complex was
located in the port area of Blaye and consisted of vertical silo units with a capacity of
40,000 ton, along with some nearby warehouse buildings with a 90,000-ton capacity, as
shown in Figure 5.27. The number of workers at the site was 21, and the silo facility was
surrounded by a low wall at a distance of 25 m (Masson, 1998).
Figure 5.27 View of the Semabla cells and warehouse-A storage units before the
explosion (Masson, 1998). The storage silo installation was divided into two groups of concrete cells. The first group
consisted of 20 cells, and the second group of 24 cells. They were arranged in three rows,
as shown in Figure 5.28. Each cylindrical cell was 6.20 m in diameter and 33 m in height.
The interspaces between the cells were also used to store grain and were kept open,
except for the two interspaces between the two groups of cells (Masson, 1998).
126
Figure 5.28 The Semabla identification of storage cells (Masson, 1998). In addition, there were two vertical towers at the ends of the silo for the grading system
and cleaner separators. They were connected to each other by a gallery located above the
cells. An additional metal-framed tower, close to the cells, was used for maize dryers. A
series of conveyors inside the underground gallery connected the gallery with
underground storage pits and transfer elevators. While there was a dust removal system
(fans, filters, and a dust chamber), there were no protective devices for the workers to
wear should an explosion or fire occur inside the facility (Masson, 1998).
5.2.2 Explosion causes The investigation report by Masson (1998) suggested two possible causes: combustible
gases from fermentation, and a dust-air explosion in the dust removal circuit. However,
the report could not pinpoint the explosion’s ignition source. Possible sources include an
electric spark, friction, mechanical impact, and self-ignition (Masson, 1998).
127
5.2.3 Explosion event On August 20, 1997, an ignition spark reached a hybrid mixture cloud in a confined place
(likely the top of the handling tower), causing an explosion (Masson, 1998).
In his report, Masson (1998) stated that some witnesses were certain that the explosion
began at the top of the handling tower, propagated through the gallery on top of the silo,
and then went downwards, as a flame jet, through the open interspaces between the two
groups of cells to the working area. The flame jet also propagated inside warehouse-A.
The first explosion possibly raised settled dust, including maize dust, which was handled
in one of the towers, and other maize material that was being unloaded from a truck at the
time of the explosion. The airborne dust caused a second explosion, leading to major
destruction of the facilities, as seen in Figure 5.29.
Figure 5.29 A view of the Semabla silo and warehouse-A storage facilities after the
explosion (van der Voort et al., 2007).
128
5.2.4 Explosion consequences The explosion killed 11 people, injured one, and destroyed the storage cells at the centre
and northern end of the silos. The bodies of ten workers were found in the buildings
under the silo; the eleventh victim, a fisherman, was found outside the silo fence a few
days after the explosion, buried under projected debris. Table 5.25 summarizes the
human toll of injured, uninjured, and killed, along with their location. The stored grain
spilled out over the 25 m space to the fence wall, while the projected debris reached more
than 50 m (Masson, 1998). The total effect of the spilled grain and debris increased the
probability of fatality in the surrounding area of the silo (within 25 m) to 100%, and the
death probability beyond the silo boundary wall (within 50 m) to 25%.
Table 5.25 The number of injured, deceased, and uninjured people at the storage grain
silo explosion (Masson, 1998).
Location Injured Deceased Uninjured Total no. of people
Inside the facility 1 10 10 21
Outside the facility 0 1 0 1
Total 1 11 10 22
5.2.5 Applying the QRMF to the Semabla grain storage silo According to the accident consequences, the grain facility was at high risk due to a lack
of safety management. This case study shows the severity of consequences that could
occur in a similar storage facility, especially the high probability of existing hybrid
mixture. For this reason, this facility was chosen as a case study to apply the QRMF to
prevent/mitigate such explosions.
The following section describes the framework steps for the Semabla grain facility.
129
1. Identify hazard
The Masson (1998) report identified the hazardous dust material as barley, wheat and
maize, which were mixed with a fermented flammable gas. The maize characteristics
have been identified experimentally, as given in Table F.4. (Appendix F) Maize starch
has the most reactivity compared with wheat and barley, so it was chosen in the
simulation as the worst explosion scenario that could occur.
2. Understand hazard
The explosion scenario was simulated using DESC software to find the explosion
pressure zones (severity of consequences). FTA was used to calculate the probability of
occurrence by using Relex software, risk calculations were done, and the risk evaluation
obtained, as explained in detail in the following sections.
iii) Consequences analysis
- DESC simulation
Some details about the Semabla storage silo structure are not publicly available, such as
information about emergency exit doors, worker areas, safety procedures, etc., due to
company privacy rules. Thus, in DESC, the Semabla geometry and its facilities were built
using ‘best estimates’. Figure 5.30 shows the silo geometry built by DESC and the wall
destruction openings. Figure 5.31 shows the side view of the Semabla silo installation
and the modules’ distribution on the silo geometery. Table 5.26 lists the wall openings
covered by pressure relief panels (PPs) and their adjusted opening pressure. Figure 5.32
and Figure 5.33 indicate, by color, the explosion pressure zones at the top and side views,
respectively. The red color represents the maximum pressure (Pmax) reached inside the
work areas during the simulation. As indicated, the pressure reached 0.35 bar(g) (3.5 *
104 Pa), which is very destructive.
130
Figure 5.30 CASD image (3D view) of the Semabla storage silo with the pressure
relief panels (PPs).
Figure 5.31 Module distribution: a side view of the Semabla silo geometry.
PP1 PP3
PP6 PP7
PP5
PP8
PP9
Module (2,1) Module (2,2) Module (1,1)
Module (1,2)
A A
Module (1,3)
Module (3,1)
Module (4,2)
Module (3,2)
Module (4,1)
131
Table 5.26 Opening pressure value of pressure panels and their sizes in the Semabla storage silo.
Pressure panel no. Opening pressure ( kPa )
Size ( m2 )
Module (4,2) PP1 – PP4 30 60
Module (3,2) PP5 30 54
Module (1,2) PP6 30 175
Module (3,1) PP7 30 42
Module (4,1) PP8 – PP9 20 175
Figure 5.32 DESC pressure simulation of the Semabla silo explosion geometry (top
view).
132
Figure 5.33 DESC pressure simulation of the Semabla silo explosion geometry (side
view). Table 5.27 summarizes some important data required in the Semabla simulation. The fuel
used in the simulation was maize starch, which is considered the main fuel, with its
explosibility characteristics shown in Table F.4 (Appendix F). However, wheat and
barley also contributed to the extreme severity of the explosion that spread to the entire
silo facility and nearby buildings over a short period of time.
- Structure damage
As mentioned in Chapter 3, the Probit Equation 3.2 can determine the structural damage
that occurred as a result of the explosion maximum pressure. Using the transformation
tables in Appendix D, the structural damage equation and its causative variables (K1, K2)
are: . The reason for choosing this equation is that the
fatalities resulted from structural damage consequences (grain overflow and debris).
DESC simulated the pressure profile during the explosion inside the silo building. Figure
5.34 is a plane view of the refinery at the cut line A-A in Figure 5.31. Figure 5.34 also
demonstrates the pressure simulation in colors, with the red color representing the highest
133
Table 5.27 DESC scenario input data for Semabla silo geometry.
No. DESC scenario input data 1 Simulation volume size (x, y, z) = (170 m, 66 m, 65 m) 2 Geometry size (x, y, z) = (150 m, 58 m, 35 m) 3 Fuel name is “Maize starch” 4 Dust concentration = 500 g/m3 5 Number of monitor points = 40 6 Number of pressure panels (PP) = 9 7 Ignition energy = 10 kJ
Figure 5.34 A plane view of the Semabla silo geometry in Blaye, France. pressure, 0.35 bar(g), and the blue color representing the lowest pressure, zero bar(g).
Figure 5.34 also shows the most dangerous area in the installation (I), which had the
highest pressure value, and the lower-risk area (K), which had the lowest pressure value.
In addition, the pressure simulation, Figure 5.35, shows that the explosion pressure was
sufficiently high to destroy the facility. In addition, the spilled grains and projected debris
The surrounded wall
K
50 m
I
J 25 m
134
Figure 5.35 DESC pressure/time simulation at monitor points in Modules (4,1) and
(4,2) of the Semabla storage silo explosion. caused by the explosion were also threats.
The Probit equation and the transformation table, Appendix D, have determined the
structural damage at each zone in terms of damage percentage. Outcomes for three areas
are shown in Table 5.28.
Table 5.28 Estimated Probit damage percentages caused by explosion overpressure of
incident outcome cases at Module (2,1).
Incident outcome case
Pmax [bar(g)] Y Damage percentage
(%) I 0.35 6.75 96 J 0.19 5.00 50 K 0.00 0.00 No likely damage
135
iv) Likelihood calculations The probability of occurrence of the FTA basic events at Semabla has been generated
from Freeman’s (2011) equations. Equations 2.5 and 2.7 were recommended by Freeman
for such incidents. Due to the generally unsafe conditions under which the silo operated,
the failure probabilities of the units that had significant effects on the explosion are as
follows:
- The confinement was 75% because the explosion occurred inside the tower,
which was open to other buildings.
- The dust concentration was 25%, as it was not managed safely.
- The probability of existing combustible material was 99% because all materials
(wheat, barley and maize) were combustible.
- The probability of the oxidant concentration above the LOC was considered 80%,
as the explosion occurred at normal conditions.
- Rationally, at least 25% of the airborne material was less than or equal the non-
explosible diameter i.e. the existing of the explosible practical size probability
was also 25%.
- One of the strongest expectations was the existence of flammable gases mixed
with airborne dust; the probability of the gas existence was 75%.
The general dust explosion fault tree flow chart has been modified to address the Semabla
silo explosion. Figure 5.36 provides the FTA of the silo and the probabilities of the
elements that led to the explosion.
136
Basic Event
AND Gate
OR Gate
Transfer-In Gate
Figure 5.36 Fault Tree Analysis flowchart of the Semabla silo explosion.
Gate1
Semabla silo dust
Q:0.00420596
Gate2
Maize dust cloud
Gate11
Ignition source
From Page 137
Event2
Confinement
Q:0.75
Gate5
Fuel
Gate6
Mixing (Suspension)
From Page 138
Event3
Oxidant concentration > LOC
Q:0.8
Gate15
Dust
Event5
Concentration > MEC
Q:0.25
Event4
Combustible material (maize)
Q:0.99
Event27
Particle size < non-explosible
Q:0.065
Gate14
Hybrid mixture
From Page 137
explosion
137
Gate14
Hybrid Mixture
Event29
Flammable Gas
Q:0.75
Gate17
Dust
Event28
Particle size < non-explosible
Q:0.065
Event30
Combustible material (maize)
Q:0.99
To Page 136
138
Gate6
Mixing(suspension)
Event7
Bagging and filling FIBCs
Q:0.0325
Event8
Dust collecting receivers
Q:0.0325
Gate12
Transfer
From Page 139
Gate13
Transport
From Page 139
Event11
Shock waves
Q:0.0325
Event12
Others
Q:0.001
To Page 136
139
Gate13
Transport
Event17
Belt conveyors
Q:0.065
Event18
Elevators
Q:0.065
Event19
Screw conveyors
Q:0.065
Event20
Others
Q:0.001
To Page 138
Gate12
Transfer
Event13
Silos and bins
Q:0.0325
Event14
Baghouses
Q:0.0325
Event15
Cartridge
Q:0.0325
Event16
Others
Q:0.001
To Page 138
140
Gate11
Ignition source
Event21
Mechanical impact sparks
Q:0.065
Event22
Flames and direct heat
Q:0.065
Event23
Static electricity
Q:0.065
Event24
Electrical sparks
Q:0.065
Event25
Friction sparks
Q:0.065
Event26
Others
Q:0.001
Event33
Incandescent material self-heating...
Q:0.065
To Page 136
141
3. Risk estimation Analysis of the severity of consequences and likelihood of occurrence results in risk
estimation. The combination of these factors is represented in the risk criterion, as
follows:
i) Individual risk
Most of the victims in the silo were killed because of the collapse that occurred in the silo
cells and the overflow of bulk grain onto the work areas at the foot of the silo. Individual
risk has been calculated in the work areas, Module (4,1) and Module (4,2), as shown in
Figure 5.31. The fault tree calculations found the probability (f) of the silo explosion as
4.21 * 10-3 per year.
Table 5.29 shows the probability of fatality (Pf,i) for each zone. The Pf,i of zone I is 1.0
(100%) due to the 96% wall destruction plus the grain overflow. The Pf,i of zone K is
0.25 (25%) because of the projected debris. Table 5.29 shows the estimated total risk
after multiplying the incident frequency (fi ) by Pf,i, the number of workers, and the
estimated number of fatalities at each defined zone (I, J, K). The estimated number of
fatalities is calculated by multiplying the Pf,i by the number of workers.
Table 5.29 Individual risk calculations for the Semabla silo, Module (4,1).
Incident outcome case
fi (per year) Pf,i fi * Pf,i
No. of workers
Estimated no. of Fatalities
I 1.0 10 10 J 0.50 11 6 K 0.25 1 1
Average individual risk
142
- Fatal accident rate (FAR)
The FAR is calculated from the average individual risk for the exposed employee
population from Equation 3.10.
Fatalities /108 man-hours of exposure
ii) Group (societal) risks
- F-N Curve
Table 5.30 lists the number of fatalities and the frequency of each incident zone.
Table 5.31 expresses the F-N data, showing cumulative frequencies from the lowest to
the highest value of fatalities.
Figure 5.37 presents the cumulative frequencies versus number of fatalities, as shown in
Table 5.31.
Table 5.30 Cumulative frequency data for the F-N curve of the Semabla explosion.
Estimated number of fatalities (N)
Incident outcome cases included
Total frequency (FN) (per year)
10 I 6 J 1 K
143
Table 5.31 Cumulative frequency data for F-N curve of the Semabla explosion.
Estimated number of fatalities (N) Incident outcome cases included Total frequency
(FN) (per year) 10+ I 6+ I,J 1+ I,J,K
Figure 5.37 Social risk F-N curves for the Semabla explosion.
4. Risk evaluation Table 5.32 summarizes the risk calculations for the Semabla silo explosion, showing that
the risk was unacceptable. Figure 5.37, also indicates that the refinery was at risk, and
that the F-N curve is in the unacceptable risk range, quite far away from the tolerable
line.
1.00E-04
1.00E-03
1.00E-02
1.00E-01
1 3 5 7 9 11 13 15
Freq
uenc
y of
N p
er y
ear
Estimated number of fatalities, N
Unacceptable Risk
Tolerable Line
Tolerable Risk
144
Table 5.32 Summary of the individual risk results for the Semabla explosion, before applying the QRMF.
5.5
5. Identify units and unsafe procedures that contribute significantly to probability of top event
The following contributed to the probability of an explosion at Blaye:
the existence of combustible gases from fermentation,
the occurrence of hybrid mixture explosion in the dust removal circuit,
the open interspaces between the two groups of cells,
the existence of maize dryers,
the maintenance and truck-unloading procedures, and
lack of smoke detectors.
6. Apply the risk controls
Responding to the identified units and unsafe procedures actions, the QRMF controls
should be applied to minimize the risk to be at least tolerable.
- Inherent safety
Inherent safety principles (minimization, substitution, moderation) were applied in
recommended sequence to control the expected main causes of the Semabla silo
explosion, as seen in Table 5.33.
- Engineered safety
Passive engineered safety: Add sufficient explosion relief vents that are able to
release explosion pressure on time, and add smoke detectors.
145
Table 5.33 Applying inherent safety principles to the units and wrong actions that contributed to the Semabla explosion.
Units or actions
contributing to the explosion event
Inherent safety
principle The Action
Dust-air explosion occurred in the dust removal circuit
Minimization
- Good housekeeping (dust removal/cleaning). - Keeping dust concentration outside
explosible range (Amyotte & Eckhoff, 2010). The open interspaces between the two groups of cells
Minimize dust cloud volume by filling the opened interspaces with grain or sealing them tightly.
Unloading of maize and dryers procedure Substitution
Replace the hazardous unloading and drying procedures with others that are less hazardous (Amyotte et al., 2009).
Existence of combustible gases from fermentation
Moderation Identify processing (storage) options that involve less severe processing conditions e.g. efficient add-on (ventilation) system.
Active engineered safety: Add an automatic explosion suppression system by
inerting dust cloud.
- Procedural safety:
Apply safe truck-unloading procedures. Also, review procedures for the entire
installation design, if any modification has been applied to the process units or to the
working areas’ cleaning procedure. Review and apply safety maintenance procedures
to reduce any possible ignition source. Also, create, modify, and/or apply safety
procedures for emergency plans as well as periodic training procedures regarding
safety issues for workers.
7. Understand the residual hazard
i) Consequence analysis
Similar to the procedure used at the Imperial Sugar refinery, new DESC simulations were
conducted after applying possible risk controls that suggested the above. Table 5.34
146
provides the new opening values of the pressure relief panels for achieving safe
operations. Dust concentration was reduced to 250 g/m3, which is 50% of the previous
concentration. The flammable gas formed from the fermentation process was also
reduced by the add-on system.
Table 5.34 Opening pressure values of pressure panels and their sizes in the Semabla
During the simulation, the explosion pressure distribution was virtually the same inside
the buildings until it reached the venting relief pressure value (5 kPa, or 0.05 bar(g)),
after which different pressure regions started forming with different shapes and colors,
indicating pressure release through the panels and continuity of the explosion reaction.
Through the use of different colored areas, Figure 5.38 and Figure 5.39 show the
maximum explosion pressures reached during the DESC simulation. Figure 5.38
indicates that the maximum explosion pressure reached was 0.05 bar(g) at 3.4 s in
Module (4,1). The explosion then propagated through open interspaces between the two
groups of cells to the work area, Module (4,2), where the pressure rose again to 0.05
bar(g) at 12.4 s, as shown at Figure 5.39.
147
Figure 5.38 DESC pressure simulation from a plane view of the Semabla storage silo
explosion, after applying the QRMF at 3.4 s.
Figure 5.39 DESC pressure simulation from a plane view of the Semabla storage silo
explosion, after applying the QRMF at 12.3 s.
K
50 m
I
J 25 m
The surrounding wall
K
50 m
I
J
25 m
The surrounding wall
148
Figure 5.40 expresses the pressure simulation of Figures 5.38 and 5.39, showing the
pressure developments at monitor points M3, M8, and M11. The first peak, at 3.4 s,
recorded by M3, indicates the maximum explosion pressure, 0.05 bar(g), in Module (4,1),
and the second peak, at 12.4 s, recorded by M8 and M11, indicates the maximum
pressure, 0.05 bar(g), in Module (4,2). The total explosion time of 14 s is also shown in
Figure 5.40.
Figure 5.40 DESC pressure/time simulation at the monitor points in Modules (4,1) and
(4,2) of the Semabla storage silo explosion, after applying the QRMF. Table 5.35 lists the maximum explosion pressure, corresponding Probit value, and
insignificant damage percentage for each explosion zone, after applying the QRMF,
which shows significant protection to the Semabla case study.
149
Table 5.35 Estimated Probit damage percentages caused by explosion overpressure of incident outcome cases in the simulated Semabla grain silo, after applying the QRMF.
Incident
outcome case Pmax
(bar(g)) Y Damage percentage (%)
I 0.052 1.19 6.95*10-3 J 0.055 1.35 1.31*10-2 K 0 0 No likely damage
ii) Likelihood calculations Table 5.36 compares the probabilities of occurrence of the Semabla explosion, before and
after applying the QRMF. Using Equation 2.5 (the ‘best guess’ method), some basic
events in the Semabla fault tree flowchart are recalculated, with and n = t = 10
years. This resulted in a basic event probability value of 0.0325, and addresses the
applied safety controls, as follows:
As the probability of dust concentration (which must be greater than or equal to
MEC) is minimized to 0.0325, the existing of airborne dust particles will likewise
be reduced to 0.0325.
Applying procedural safety measures such as hot permit, frequently mechanical
and electrical maintenance, and check equipment grounding will reduce the
probability of mechanical impact sparks, flames and direct heat, or static
electricity to 0.0325.
A new safety procedure for organic grain storage and a proper ventilation system
will reduce incandescent material ignition sources to 0.0325 and mitigate the
presence of flammable gas.
Figure 5.41 is the FTA flowchart of the Semabla grain silo explosion. Figure 5.41
estimates the probability of the dust explosion in Semabla after applying the QRMF,
reducing the probability of occurrence of the most significant causes of the basic events.
150
Table 5.36 Estimated failure rate of the explosion’s basic events at Semabla, before and after applying the QRMF.
19 Friction sparks 0. 0650 0.0325 20 Flames and direct heat 0.0650 0.0325 21 Electrical sparks 0.0650 0.0650 22 Static electricity 0.0650 0.0325 23 Incandescent material 0.0650 0.0325 24 Others 0.0010 0.0010 25 Total confinement 0.7500 0.2500 R The maize dust explosion probability
151
Basic Event
AND Gate
OR Gate
Transfer-In Gate
Figure 5.41 Fault Tree Analysis flowchart of the Semabla explosion after application
of the QRMF.
Gate1
Maize dust explosion
Q:1.48803e-005
Gate2
Maize dust cloud
Gate11
Ignition source
From Page 155
Event2
Confinement
Q:0.25
Gate5
Fuel
Gate6
Mixing (suspension)
From Page 153
Event3
Oxidant concentration > LOC
Q:0.8
Gate15
Dust
Event5
Concentration > MEC
Q:0.0325
Event4
Combustible material (maize)
Q:0.99
Event27
Particle size < non-explosible
Q:0.0325
Gate14
Hybrid mixture
From Page 152
152
Gate14
Hybrid mixture
Event29
Flammable Gas
Q:0.001
Gate17
Dust
Event28
Particle size < non-explosible
Q:0.0325
Event30
Combustible material maize)
Q:0.99
To Page 151
153
Gate6
Mixing(suspension)
Event7
Bagging and filling FIBCs
Q:0.0325
Event8
Dust collecting receivers
Q:0.0325
Gate12
Transfer
From Page 154
Gate13
Transport
From Page 154
Event11
Shock waves
Q:0.0325
Event12
Others
Q:0.001
To Page 151
154
Gate13
Transport
Event17
Belt conveyors
Q:0.065
Event18
Elevators
Q:0.065
Event19
Screw conveyors
Q:0.065
Event20
Others
Q:0.001
To Page 153
Gate12
Transfer
Event13
Silos and bins
Q:0.0325
Event14
Baghouses
Q:0.0325
Event15
Cartridge
Q:0.0325
Event16
Others
Q:0.001
To Page 153
155
8. Risk estimation The previous simulations and calculations that were achieved after applying the QRMF
showed the validation of the framework. Table 5.35 shows remaining consequences of
the hybrid mixture explosion, which is very low as can be seen in Table 5.37, and the
probability of occurrence was reduced to per year, as can be seen in Figure
5.41.
Gate11
Ignition source
Event21
Mechanical impact sparks
Q:0.0325
Event22
Flames and direct heat
Q:0.0325
Event23
Static electricity
Q:0.0325
Event24
Electrical sparks
Q:0.065
Event25
Friction sparks
Q:0.0325
Event26
Others
Q:0.001
Event33
Incandescent material self-heating...
Q:0.0325
To Page 151
156
Table 5.37 Individual risk calculations for the Semabla silo, Module (4,1).
Incident outcome case
fi (per year) Pf,i fi * Pf,i
No. of workers
Estimated no. of Fatalities
I 6.95*10-5 10 0 J 1.31*10-4 11 0 K 0 1 0
Average individual risk
- Fatal accident rate (FAR) The FAR is calculated from the average individual risk for the exposed employee population from Equation 3.10.
Fatalities /108 man-hours of exposure
- ALARP Figure 5.42 shows the individual risks at the Semabla grain silo, plotted on an ALARP
graph, before and after the QRMF was applied. The individual and societal risk of a
dust/hybrid mixture explosion was at first unacceptable ( ), but was then
reduced to , indicating (in theory) a very safe process. This analysis concerns
structural destruction, but additional risks persist, such as pressure safety vents that do
not open properly, fire, fragments from the explosion, structural weakness in some
working areas, etc.
157
Figure 5.42 HSE frameworks for tolerability of risk (after IET, 2010). Table 5.38 compares the risk measure results obtained before and after applying the
QRMF controls. The numbers show that the total risk has been reduced for each single
measure: the probability of occurrence has been reduced, and the IR, LSIR, ISIR and
FAR, are very acceptable.
Table 5.38 Summary of the individual risk results for the Semabla storage silo
Date Location Material Plant / building Dead / injured 1785 Turin, Italy Wheat flour Bakery 2i
1807 Leiden, The Netherlands Black powder Ship 151d/2000i
1911 Glascow, UK a a 5d/8i 1911 Liverpool, UK a a 37d/100i 1911 Manchester, UK a a 3d/5i 1913 Manchester, UK a a 3d/5i 1916 Duluth, MN Grain Steel bin – 1919 Cedar Rapids, IA Corn starch Starch plant 43d
1924 Peking, IL Corn starch Starch plant 42d
1924 USA Sulphide dust a 1d/6i
1924 USA Sulphide dust a 1d/1i
1924 USA Sulphide dust a 2d/1i 1926 USA Sulphide dust a 3d/1i 1930 Liverpool, UK a a 11d/32i 1944 Kansas City, KS Grain dust a a 1949 Port Colbourne, CA Grain Steel bin –
1952 Saskatchewan Grain dust Shipping bin 6d/14i 1955 Waynesboro, GA Grain dust Feed plant 3d/13i 1956 South Chicago Grain dust Elevator – 1958 Kansas City Grain dust Elevator –
1960 Canada Sulphide dust a 2d/– 1960 Albern, Vienna Grain dust a – 1962 St. Louis, MO Grain dust Feed plant 3d/13i 1964 Paisley, UK a a 2d/34i
1965 London, UK Flour Flour mill 4d/37i
1969 Sweden Sulphide dust a 2d/1i 1970 Kiel, FRG Grain dust Grain silo 6d/18i
1970 Germany Grain dust Silos on shipping canal
6d/17i, loss $10 million
182
1970 Norway Wheat grain dust Silo a
1971 New Orleans Bushel Elevator a
1972 Norway Silicon Milling section 5d/4i
1973 Norway Aluminum Mixing vessel 5d/2i
1974 Canada Sulphide dust Fox mines a
1974 Preska, South Africa Sulphide dust Mines a
1975 Norway Fish meal Fish meal grinding plant 1d/1i
1979 Lerida, Spain Grain dust Grain silo 7d 1979 Canada Sulphide dust Ruttan mines a 1980 Germany Coal Cement factory – 1980 Iowa, USA Corn dust Bucket elevator –
1980 Minnesota, USA Grain dust Cross tunnel, bucket elevators 13i
1980 Naples, Italy Grain dust Grain silo 8i 1980 Ohama, NE, USA Grain dust Head house Loss $3,300,000
1980 St. Joseph, MO, USA Grain dust Shipping bin 1d/4i, loss $2,000,000
1981 Canada Sulphide dust Mattabi mines a 1981 Corpus Christi, TX Grain dust Bucket elevator 9d/30i 1981 Bellwood, NE, USA Grain dust Bucket elevator Loss $6,400,000
1981 Germany Coal Coal dust burner
plant, cement works
–
1982 British Columbia, Canada Coal Silo –
1983 Anglesey, UK Aluminum Aluminum
powder production
2i
1984 USA Caol Silo – 1985 Australia Sulphide dust Elura mines a
183
1985 Canada Sulphide dust Lynn lake a 1985 Germany Coal Silo 1i
1985 Norway Rape seed flour pellets Silo –
1986 Canada Sulphide dust Brunswick mines a 1986 Sweden Sulphide dust Langsele mines a 1986 Canada Sulphide dust Dumugami mines a 1986 Australia Sulphide dust Woodlawn a
1987 Canada Sulphide dust GECO mines a
1987 China Textile dust Dust collection system 58d/177i
1994 Tokyo, Japan Rubber waste Shoe factory 5d/22i
1997 Japan Tantalum dust a 1d/1i 1997 Blaye, France Grain Storage 11d
1999 Michigan Coal dust (cause
for secondary explosion)
Powerhouse 6d/14i
1999 Massachusetts Resin Oven 3d/12i 2000 Japan Mg–Al alloy 1d/1i 2000 Modesto California Aluminum dust a a 2002 Mississippi Rubber Recycling plant 5d/a 2003 Kentucky Resin Production line 7d
Appendix D Probit correlations for a variety of explosions and their transformation
187
Table D.1 Probit correlations for a variety of exposures (the causative variable is representative of the magnitude of the exposure) (Crowl & Louvar, 2007).
Type of injury or damage
Probit Parameters
K1 K2
Fire Burn deaths from flash fire Burn deaths from pool burning
-14.9 -14.9
2.56 2.56
Explosion Deaths from lung hemorrhage Eardrum ruptures Deaths from impact Injuries from impact Structural damage Glass breakage