67
A REPORT ON THE BASELINE STUDY AND SUPPLY CHAIN ANALYSIS OF THE HOME GROWN SCHOOL FEEDING PROGRAM (HGSFP) IN THE NADOWLI KALEO DISTRICT By: SAVE-Ghana Submitted to: SNV JUNE, 2013.

A REPORT ON THE BASELINE STUDY AND SUPPLY CHAIN
ANALYSIS OF THE HOME GROWN SCHOOL FEEDING
PROGRAM (HGSFP) IN THE NADOWLI KALEO DISTRICT
By: SAVE-Ghana
Submitted to: SNV
JUNE, 2013.

Table of Contents
LIST OF ABBREVIATIONS AND ACRONYMS 6
ACKNOWLEDGEMENT 7
EXECUTIVE SUMMARY 8
1 CHAPTER ONE: INTRODUCTION 10
1.1 Background 10
1.2 District Profile 11
1.3 Objectives of the Assignment 12 1.3.1 The Base Line Study 12 1.3.2 The Supply Chain Analysis 13
2 CHAPTER TWO: METHODOLOGY 14
2.1 Tools used 14
2.2 Sample size 14
2.3 Identification and Orientation of Data Collectors and Entry Clerks 14
2.4 Data Collection 15
2.5 Data Quality Management 15
2.6 Data Entry and Analysis 15
2.7 Limitations of the Assignment 16
2.8 Challenges of the Assignment and lessons learnt 16
3 CHAPTER THREE: BASELINE FINDINGS AND ANALYSIS 17
3.1 Introduction 17
3.2 Smallholder Farmers/Farmer Based Organizations (FBOs) 17 3.2.1 Registration Status of FBOs 17 3.2.2 Membership of FBOs 18 3.2.3 Crop Value Chains of FBOs and their Members 18 3.2.4 Storage Facilities Used by FBOs 19 3.2.5 Storage Problems Encountered by FBOs 19 3.2.6 FBO Participation in SF Procurement and Training 19 3.2.7 Inspection of FBO Storage Facilities 19 3.2.8 Regularity of Inspection on FBOs’ Facilities 20 3.2.9 Details of FBOs Activities 20
3.3 Traders/Suppliers 20 3.3.1 The Role of NAFCO as a Supplier in the SFP 21

3.4 Caterers 22 3.4.1 Status of Caterers 22 3.4.2 Caterers’ Membership of National Level Organizations 22 3.4.3 Training Received by Caterers 23 3.4.4 Caterers’ Employees working on SF Related Activities 23 3.4.5 Food Stuff Used in School Feeding Menu 23 3.4.6 Decision on School Menu/Ration 24 3.4.7 Main Sources of Caterers Supplies 25 3.4.8 Places of Storage Prior to Usage/Disposal 25 3.4.9 Caterers’ Storage Problems 26 3.4.10 Getting in Touch with Local Farmers 27 3.4.11 Quality Management Measures at Storage 27 3.4.12 Food Stuff Price Determination 27 3.4.13 Location of School Meal/Food Preparation 28 3.4.14 Quality Control Measure at Kitchen 28 3.4.15 Frequency of Inspection of Caterers’ Cooking Facility 29 3.4.16 Training Received by Caterers 29 3.4.17 Financial Support Received by Caterer to Supply to School Feeding 29 3.4.18 Financing the Purchases for SF 29 3.4.19 Participation in Social Audit Events of the School Feeding 30
3.5 District Assembly (DA) 30 3.5.1 The School Meals 30 3.5.2 Participation in SF Coordination and Social Audit Events 30 3.5.3 Ministry of Food and Agriculture (MoFA) 30 3.5.4 Production levels in the last Season 31 3.5.5 Knowledge of FBOs in the district 31 3.5.6 Support to FBOs 31 3.5.7 The Use of Cereal Banks 32 3.5.8 Participation in SF Coordination and Social Audit Events 32
3.6 Financial Institutions 32
3.7 Key Informant 33 3.7.1 Challenges and Opportunities 33
3.8 Barriers to SF Supply Chains 33
3.9 Non-governmental Organizations (NGOs) interventions 33
4 CHAPTER FOUR: SUPPLY CHAIN STUDY 34
4.1 Introduction 34
4.2 Supply Chain Study 34 4.2.1 Definition of the end food product(s) demanded by the school feeding programs 34 4.2.2 Identification of foodstuffs grown by local farmers that can form the main menus for school feeding in the district 35 4.2.3 Potential Food Items on the SF Menu 35 4.2.4 The Core Processes in the Supply Chain 36 4.2.5 Production 38 4.2.6 Storage 38 4.2.7 Transportation 38 4.2.8 Marketing 38 4.2.9 Development of the supply chain map showing flow of goods and linkages between the primary actors and the final consumers 38

5 CHAPTER FIVE: SUPPLY CHAIN ANALYSIS 41
5.1 Objectives for Improvement of the Supply Chain 41
5.2 Benchmarking 41 5.2.1 9.2.3 Source/Procurement of Food Supplies 42 5.2.2 9.2.4 Crops in the School Menu 42 5.2.3 9.2.5 Decision on School Menu 42 5.2.4 9.2.6 Purchases and Storage of the Food Stuff 42 5.2.5 9.2.7 Challenges 43
5.3 Supply Chain Governance and Governance for Empowerment (GfE) 43
5.4 Identification of Constraints and Opportunities 45 5.4.1 Challenges and Opportunities of Caterers 45 5.4.2 Challenges and Opportunities of FBOs 46 5.4.3 Challenges and Opportunities of NGOs 46
6 CHAPTER SIX: CONCLUSIONS AND RECOMMENDATIONS 47
6.1 Conclusion 47
6.2 Recommendations 47
7 CHAPTER SEVEN: ACTION PLANNING 49
7.1 Supply Chain Governance Analysis, including GfE elements 49
7.2 Supply Chain Constraints and Opportunities Analysis and Action Planning 51
8 APPENDICES 57
9. DAYS REQUIRED FOR THE ASSIGNMENT 63
9 REFERENCES 67

TABLE OF FIGURES Pages Figure 3.3.1: Registration Status of FBO 15
Figure 3.3.2 Membership of FBOs by Sex 16
Figure 3.3.3 Crop Value Chain FBOs deal with 17
Figure 3.3.4 Storage Facilities Used by BOs 18
Figure 3.3.5 Inspection of Storage Facilities of FBOs 19
Figure 3.3.7 FBO Activities in the Value Chain 20
Figure 3.5.1 Sex Distribution of Caterers 22
Figure 3.3.6 Inspection of FBO Facilities 22
Figure 3.5.2: Registration Status of Caterers 22
Figure 3.5.3 Training of Caterers 23
Figure 3.5.5 Decision on Menu 24
Figure 3.5.4 Food Stuff Used for School Meals 25
Figure 3.5.6 Caterers Sources of Supplies of Food Stuff 26
Figure 3.5.7 Storage Facilities Used by Caterers 27
Figure 3.5.8 Storage Problems of Caterers 27
Figure 3.5.9 Quality Management by Caterers 29
Figure 3.5.10 Pricing of Food Stuff Sold in the Market 30
Figure 3.5.11 Location of School Meal Preparation 30
Figure 3.5.12: Inspection of Caterers’ Cooking Facility 31
Figure 3.5.13 Financial Support Received 32
Figure 4.2.1 Supply Chain Map of the District 42
LIST OF TABLES Pages Table 3.7.1 Production levels and Prices 34
Table 3.7.2 FBOs that benefited from MoFA support 35
Table 4.2.1 Food Stuff and Sources 37
Table 4.2.2 Potential Food Items for School Menus 38
Table 4.2.3 Actor function worksheet 40
Table 5.3.1 Assessment of Governance Parameters 43

List of Abbreviations and Acronyms
BMGF Bill and Melinda Gates Foundation
CSOs Civil Society Organizations
CTO Chief Technical Officer
DDO District Desk Officer
DIC District Implementation Committee
FBO Farmer Based Organization
FGD Focus Group Discussion
GES Ghana Education Service
GSFP Ghana School Feeding Programme
HGSFP Home Grown School Feeding Program
MoFA Ministry of Food and Agriculture
NAFCO National Buffer Stock Company
NGOs Non-Governmental Organizations
NKDA Nadowli Kaleo District Assembly
PGHGSFP Procurement Governance for Home School Feeding Programme
PNDC Provisional National Defense Council
SHF Small Holder Farmers
SIC School Implementation Committee
SIDSEC Sustainable Intergraded Development Services Centre
SMC School Management Committee
SNV Netherlands Development Organization
WFP World Food Programme
WVI World Vision International

Acknowledgement
We would like to register our indebtedness first to SNV our partner in the implementation of this
project for finding us worthy and credible enough to undertake this exercise and for the support of
Madam Alimata Abu the Project Associate Advisor and Mr Sylvester Ekpe whose experience and
guidance throughout the implementation of this project helped us to get this far.
We also deeply appreciate the support and cooperation of the Nadowli Kaleo District Coordinating
Director, the Deputy District Coordinating Director, the District Finance Officer and the District Desk
Officer of the School Feeding Programme for their presence at the inception and validation workshops
during which they made a lot of inputs and for cooperating with us as the Local Capacity Builder (LCB)
in this project.
We are also grateful to the Nadowli Kaleo District Director of the Ministry of Food and Agriculture
(MoFA) for cooperating and providing us with the necessary information in this survey and particularly
for releasing his Agriculture Extension Agents (AEAs) and Supervisors to support us as Research
Assistants in the data collection process. By this, we are extending our appreciation to the AEAs for
their support in the data collection.
We are indeed grateful to everyone who supported us in whatever capacity and form to come this far
in this project. We will forever appreciate this partnership and cooperation from all of you.

Executive Summary
The Procurement Governance for Home Grown School Feeding (HGSF) program is a four-year initiative funded by the Bill and Melinda Gates foundation through SNV-Netherlands Development Organization that is aimed at securing smallholder farmer participation in Home Grown School Feeding programs in Mali, Kenya, and Ghana. The project is designed and estimated to enable as many as 10,000 smallholder farmers in Ghana, at least 30% being women within a period of four years, to derive increased and stable income through effective participation in a Home Grown School Feeding program that uses open, transparent, accountable procurement practices in its implementation, affecting all stakeholders along the supply chain. The project is aimed at piloting new interventions to strengthen farmer-caterer linkages through an improved procurement process, and enhanced supply chain that guarantees social accountability in the HGSFP through effective and participatory mechanisms. In order to achieve the above objectives it was paramount to establish the existing situation on the
ground for retooling, effective targeting and management through a baseline and supply chain analysis
with information from the key actors of the GSFP supply chain to inform the project implementation
and to subsequently measure the progress made at the end.
Data collection tools were therefore designed by SNV to elicit both quantitative and qualitative
information from the key actors; Caterers, Traders, Farmer Based Organizations (FBOs), MoFA and
Non-governmental Organizations (NGOs), Financial Institutions (FI) and Key Informants who were
purposively sampled in view of their roles in the GSFP. A four member MoFA team who are very
familiar with the district were recruited as Research Assistants to collect data from all the actors.
Some of the key findings of the survey include the following;
Caterers who are 100% women have also employed a total of 116 people who are also all
women as cooks.
Fifty-three per cent (53%) of the membership of the FBOs interviewed in this study are women
which is significant for the target of the project.
Most FBOs, Caterers and Traders do not keep accurate records to help them evaluate their own
progress.
The caterers buy their food stuffs from the open market and not from Smallholder Farmers
which defeats the purpose of the HGSFP.
Thirty-five (35%) and 41% of FBOs and caterers respectively operate only as informal business
enterprises which affects their ability to access credit and negotiate for favorable business
terms.
Caterers did not receive training on SF procurement before being contracted but were selected
based on their existence both as formal or informal business enterprises or some recognition of
their capacity to supply to the SFP.
The caterers are not organized into associations and none of them belongs to any national level
association which suggests weak compliance in respect of best practices in terms of standards
and code of ethics.
The caterers’ main challenge remains the fact that they have to pre-finance the feeding for
several months with very irregular and delayed refund from government.

The main food stuffs grown by smallholder farmers and FBOs include maize, rice, beans,
groundnuts, yam and millet/sorghum. All these including cassava/gari which is mostly
purchased from external markets are the main food stuffs on the school menus.
Other actors of the SFP aside caterers, framers and traders who are playing direct and support
service roles include Agro Input Dealers, Transporters, MoFA, the GSFP regional secretariat,
NGOs, the National Buffer Stock Company (NAFCO), Environmental Health Department, the
District Implementation Committee (DIC) and the School Implementation Committees (SIC).
On the whole, the survey was successful despite challenges like incomplete questionnaires attributed
to inappropriateness of the issues to the respondents and poor record keeping which made the
completion of the quantitative information sections of the questionnaire impossible for the
respondents.

1 CHAPTER ONE: INTRODUCTION
1.1 Background
In 2003, African governments endorsed the Home Grown School Feeding Program (HGSFP) of the
Comprehensive Africa Agricultural Development Program (CAADP) and in the same year, the New
Partnership for Africa’s Development (NEPAD) identified Home Grown School Feeding (HGSF) as having
an immediate impact on food security in Africa, with the potential to contribute to long-term
development goals (WFP, 2009).
The Ghana School Feeding Programme (GSFP) was started in October 2005 as an initiative of the
Comprehensive Africa Agricultural Development Program (CAADP) Pillar 3 aimed at enhancing food
security and reducing hunger in line with the UN Millennium Development Goals (MDGs) on hunger,
poverty and malnutrition. The programme seeks to among other things increase school enrolment,
attendance and retention, reduce short term hunger and malnutrition amongst kindergarten and
primary school children and boost domestic food production through the provision of one hot
adequately nutritious meal, prepared from locally grown foodstuffs, on every school going day (WFP,
2007).
For now, the program has successfully increased school enrollment and attendance with about 90%
coverage in most districts. However, the program has not yet met its goal of boosting agricultural
production by using locally grown foodstuffs. Linking school feeding programs to domestic smallholder
farmers will ensure that farming becomes sustainable as farmers’ incomes increase making the
availability of nutritious meals for the children more a reality. Current procurement processes,
however, generally fail to create this link or are not set up to facilitate smallholder access to Home
Grown School Feeding (HGSF) programmes (SNV, 2012).
According to the World Food Programme (WFP), “there are 66 million primary school-age children who
attend classes hungry across the developing world, with 23 million in Africa alone” (WFP, 2012). The
introduction of the GSFP and particularly in the Nadowli Kaleo district could not have come at a better
time because the district is one of the relatively young and struggling districts among the poorest of
the 216 districts in the country.
The GSFP is decentralized under the local government structure with a framework for the active
participation of local actors like the District Implementation Committees (DIC), the School
Implementation Committees (SIC), Caterers and Small Holder Farmers (SHF) through Farmer Based
Organizations (FBOs) in the implementation process. However, many of the actors have not been
adequately informed about their roles and responsibilities resulting in a lack of involvement in the
decision making process and some lapses in the implementation.
It was for efficiency in the implementation of the programme that the Procurement Governance for
Home Grown School Feeding (PGHGSF) programme funded by the Bill and Melinda Gates Foundation
(BMGF) seeks to improve the Home Grown School Feeding (HGSF) procurement process and
strengthen the capacity of all actors to ensure that smallholder farmers have access to the HGSF
markets, enhance the supply chain governance of HGSF programs to ensure effective, transparent and
accountable delivery of products across the supply chain and to develop effective and participatory
mechanisms for increased accountability by and for the programs’ stakeholders.

The project seeks to increase the number of contracts awarded to smallholder farmers from HGSF
programmes to supply their locally grown products by introducing innovative mechanisms that involve
all stakeholders along the supply chain. In the end, important changes to current practices that result
in greater openness, transparency and accountability in the procurement process of HGSF will enable
smallholder farmers to access the market created which will serve as an incentive to increase
production and eventually ensure food security in the district.
1.2 District Profile
In view of the fact that the new Daffiama-Busie-Issa district was recently created out of the Nadowli
district and that there is a challenge presenting information on the Nadowli Kaleo district as it stands
now separately, the district profile in this report represents information on the original Nadowli
district.
The Nadowli District was carved out of the Wa Municipality in 1988 as part of the decentralization
policy of the Provisional National Defence Council (PNDC) government under the Local Government
Law of 1988 (PNDC Law 207) with Nadowli as the administrative capital 43 km from the Upper West
Regional Capital, Wa. It is bordered to the south by Wa Municipality, to the west by Burkina Faso, to
the north by Jirapa District and to the East by Sissala West District covering a total land area of 2,
742.50 km2.
The total population of the district from the 2010 census report stands at 94, 388 out of which 44, 724
are males and 49, 664 are females giving a ratio of 44:51, a situation with a clear need for gender
mainstreaming.
The District is generally a low lying but gently undulating area with a few peak areas between 1000ft
and 1150ft. The area lies within the guinea savannah vegetation zone characterized by short deciduous
trees such as the shea, dawadawa, kapok and baobab tree, a short grass cover and a unimodal rainfall
pattern. The rainy season extends from April to October with a mean annual rainfall estimated at 1100
mm, maximum in August, followed by a long spell of dry season between November and March
characterised by dry hazy winds (harmattan).
The district has a lateritic sandy loam type of soil which is relatively poor in organic matter and soil
nutrients due largely to bush burning and poor farming practices.
Like many rural communities in Ghana, agriculture remains the mainstay of the people engaging about
85% of the labour force while commerce, industry and services account for about 14%, 5% and 1% of
the labour force respectively according to the Nadowli District Medium Term Development Plan, 2002-
2004. Out of the 85%, only 25% use intermediate technology services in their production process
resulting into a cycle of low yields, low income low investments the end effect of which is food
insecurity.
One unfortunate situation farmers in this district are confronted with is the lack of storage facilities.
The rate of post-harvest loss as a result is as high as 30% in the district forcing farmers to dispose their
produce soon after harvest. In doing so, farmers are also confronted with the challenge of lack of
markets and so they sell their produce at low farm-gate prices thereby earning very little for their hard
work (NDA, 2012).

The mean annual household income of the district is estimated at GH¢480 whereas the mean annual
expenditure stands at Gh¢ 504 giving us a net deficit which is mostly made up by remittances from
migrant households.
Major crops cultivated in the area include sorghum (guinea corn), millet, maize, beans, groundnuts,
yam, rice, potatoes cotton, soya beans, tiger nuts and vegetables. The people are also survived by the
rearing of animals which include sheep, cattle, goats, pigs, and a variety of poultry breeds but also
depend on some indigenous economic trees including the baobab, shea, dawadawa and kapok trees
among others.
The Nadowli Kaleo district has a total of 157 basic schools made up of 60 primary schools, 34 JHS and
63 kindergartens (Source: DDGES, Statistics Unit - 2013) with the total pupil population of about 20533
(10382 females, 10151 males). The Ghana School Feeding Program (GSFP) started in the Upper West
Region in 2005 with just eighteen (18) beneficiary schools. In 2005/2006 academic year the GSFP was
introduced in the then Nadowli District in one (1) School namely Kyang R/C with an addition of one
more school, Meguo R/C Primary in the 2006/2007 academic year. In 2010/2011, the district feeding
schools increased to seven (7) schools. Following a retargeting exercise that took place between 2011
and 2012 across the country, currently, with the 491 feeding schools in the Upper West region, the
programme covers 70 primary and kindergarten schools engaging the services of 76 caterers in the
Nadowli Kaleo District.
These figures according to the Nadowli Kaleo District Assembly’s profile represent about 100%
coverage of the district with a total of 34,115 children being 20,234 boys and 13,881 girls benefiting.
From the position of the GSFP regional secretariat and the District Desk Officer (DDO), the program has
made great achievements including; 80% to 99% coverage of schools in the various districts, increased
enrolment, attendance and retention in most beneficiary schools, training for caterers and SIC
members, increased community participation in the program and the establishment of a standard
menu for caterers among others. The implementation of the program is however not without
challenges some of which include; delays in the release of funds for payment to caterers, lack of
kitchens and access to potable water for some schools, misconception and politicization of the
program by ill-informed individuals and the heavy schedules of the DDOs who are mostly District
Planning officers, Budget Officers or District Deputy Coordinating Directors. Notable also is the fact
that some of the caterers under feed the children with the Ghȼ 0.40 currently paid per child for a meal
compared to Ghȼ 0.60 per student per day for three meals in the Senior High schools.
1.3 Objectives of the Assignment
The objectives of the assignment which is two-fold i.e. a baseline development and supply chain
analysis include; 1.3.1 The Base Line Study
To collect both quantitative and qualitative data to capture the current status of governance in the
procurement process and in the GSFP
To produce relevant baseline information to inform the project implementation and to measure
the progress made at the end, in each of the following key thematic areas of the project:

improvement of the school feeding procurement process, enhancement of the Home Grown
School Feeding supply chain and promotion of good governance with the development of social
audit
1.3.2 The Supply Chain Analysis
The objectives of the Supply Chain analysis are to use the findings of the base line study to;
Define the end food product(s) demanded by the school feeding programs
Identify foodstuffs grown by local farmers that can form part of the main menus for school feeding
in the district.
Determine the core processes in the supply chain
Map the main actors involved in these processes as well as the supporting actors (e.g. Financial
institutions , extension services, and certification)
Develop the supply chain map showing flow of goods and linkages between the primary actors and
the final consumers

2 CHAPTER TWO: METHODOLOGY
2.1 Tools used
The study relied on both primary and secondary data as different categories and levels of analysis were
required in order to produce this report. The secondary data was gathered through the review of
articles and reports on the background, the concept and implementation strategies of the HGSFP as
well as the profile and Medium Term Development plans of the Nadowli district over the years. This
data was also both qualitative and quantitative in nature.
The primary data was collected through field work targeting key stakeholders of the GSFP in the
district. This data was collected using pre-designed questionnaire instruments from the Netherlands
Development Organization (SNV) with Farmer Based Organizations (FBOs), Caterers, Traders and
beneficiary schools as respondents. Other respondents were institutions such as the Ministry of Food
and Agriculture (MoFA), Non-governmental Organizations (NGOs), Financial Institutions operating in
the district and the Ghana Education Service (GES) eliciting both qualitative and quantitative
information from them. The questionnaires were largely quantitative in gathering information for the
baseline survey while that of the supply chain was by the use of in-depth interview and Focus Group
Discussion (FGD) guides.
2.2 Sample size
In view of the fact that so much quantitative information was required to establish the baseline of the
Home Grown School Feeding Programme (HGSFP), sampling a cross section of the target populations
would result in gaps in the survey and a misrepresentation of the reality. The study therefore sought to
collect information from every caterer, trader, FBO and institution linked to the GSFP. The selection of
these groups of people and institutions was purposive because the study is in relation to a program
that no other person has ample knowledge about except the above mentioned who are linked to the
programme. The study targeted seventy (70) caterers, twenty-six (26) FBOs, eight (8) NGOs and MoFA
which were to respond to the same instrument, the District Assembly through the District Desk Officer
(DDO), one financial institution and a key informant. In view of challenges like unwillingness of some
institutions and individuals to respond to the questionnaire, data was eventually collected from forty-
six (46) caterers, seventeen (17) FBOs, three (3) NGOs, MoFA, the District Assembly through the DDO,
one trader supplying to the school feeding programme and a key informant.
2.3 Identification and Orientation of Data Collectors and Entry Clerks
After the LCB orientation on the tools at the Tamale workshop, four (4) data collectors and two (2)
data entry clerks were identified during the district inception workshop. On the 28th of May 2013,
these data collectors and entry clerks were put together in Wa at the SNV conference Hall and trained
on the tools designed for the study in the baseline development and Supply chain Analysis in order to
avoid ambiguity and misinterpretation of the questions. The facilitators were Alimata Abu of SNV
GHANA and Boniface Nyewie, the Programme Manager for SAVE GHANA. Below are the names and
contacts of the data collectors and data entry clerks.

Table 2.3.1: List of Data Collectors and Entry Clerks
Name Portfolio Contact numbers
Florence Tantuo Data Collector/ MOFA AEA in
charge of Kaleo
0208914414
Kyelnye Abdulai Data Collector/MoFA Service
Personnel in charge of Takpo
and Sankana
0206425995
Iddrisu Braimah Data Collector/MOFA AEA in
charge of Nator
0208395288
Stephen Yelsong Data Collector/ MOFA
Supervisor
0247714461
Comfort Tommie Rabiatu Data Entry Clerk/ SAVE
GHANA
0208782642
Fuseini Latif Data Entry Clerk/SAVE
GHANA
0201326351
2.4 Data Collection
Primary data was collected directly from the field by four (4) MoFA staff (Extension Officers) who were
recruited based on their previous experience in similar exercises and the fact that they work across the
district with a good knowledge of the geography of the district as well as the social dynamics of the
people..
2.5 Data Quality Management
SAVE-Ghana went through a process of data cleaning to ensure consistency in the responses and also
made follow ups and called up some of the respondents for further information for completion of
gaps in the questionnaire. Some of the respondents were called up again to complete gaps that were
left out. It became clear in the process that some of the gaps were as a result of the fact that some
questions were either not applicable in the view of respondents or they just did not have that
information. The margin of error in this report has therefore been reduced to the barest minimum but
we accept any discrepancies in the report nevertheless.
2.6 Data Entry and Analysis
The baseline survey tools which were designed with multiple response options were entered into a
purpose-designed excel spread sheet for analysis. The analysis for the baseline survey which was
largely quantitative focused on the existing situation in terms of numbers of actors, their level and
depth of participation in SF as regards procurement processes, flow of funds, supply chain and
stakeholder accountability. Linkages between their modus operandi and the quantities they handled in
the last season or last school term as well as their interactions with other stakeholders along the line of
delivery to the GSFP were also considered. The analysis generated tables and charts for clear
presentation of the information so gathered. Data for the supply chain analysis was processed through
a qualitative process eliciting the information from respondents in relation to their activities and

involvement in the GSFP but more importantly the challenges they face as well as their impressions
about governance issues in relation to the GSFP.
2.7 Limitations of the Assignment
The study is in two parts the first being a baseline development on the procurement governance process of the GSFP which basically is to present a situational analysis as it pertains out there. The second part is on supply chain analysis in relation to the GSFP. The limitations of this study included the fact that no baseline research on SF had been conducted previously in the district thereby making access to some information from some stakeholders difficult. The baseline was also restricted just to the previous academic year in which case we did not have to concern ourselves with current information though relevant. The study was also limited to the current Nadowli-Kaleo district and not the old Nadowli district which had a detailed profile. 2.8 Challenges of the Assignment and lessons learnt
The following were the challenges faced in the data collection process;
There was no comprehensive information on the caterers operating in the district and so some
caterers could either not be traced or it took a longer time to get them interviewed.
Even though a district inception meeting was held prior to data collection, information about
the survey had still not gone down well and most caterers were still very suspicious and were
initially hesitant to provide information.
Most FBOs, Caterers and Traders had the problem of poor record keeping and could not
respond to all the questions because they did not have the information required.
The supply chain tools for caterers, traders and FBOs which were by FGDs were most difficult to
administer because it was very difficult bringing the target respondents together.
The AEAs were we recruited as research assistants to help collect data were very helpful
because they already work within most parts of the district and are in touch with the people.
They were particularly more helpful in collecting data from the FBOs and MoFA itself.
In this study caterers were to introduce the traders or suppliers they deal with to enable us
collect supply related information from them. Findings from the caterers are that only one of
them has permanent trade links with traders while the rest buy from the open market from
traders they have no information about and so they cannot be traced.

3 CHAPTER THREE: BASELINE FINDINGS AND ANALYSIS
3.1 Introduction
This chapter presents the findings of the survey as gathered through the use of research tools
administered to key actors of the GSFP in the Nadowli Kaleo District. Even though the district profile
represents the old Nadowli district which includes the newly created Daffiama-Bussie-Issa district, data
collection was limited to the Nadowli Kaleo District and all findings presented here do not include
information from Daffiama-Bussie-Issa area.
3.2 Smallholder Farmers/Farmer Based Organizations (FBOs)
FBOs are voluntary interest groups of smallholder farmers which serve as platforms for knowledge
sharing and also an avenue through which they influence the prices of their produce in the market with
opportunities to press home certain demands and particularly policy interventions. FBOs engage in
series of activities as may be deemed feasible for the wellbeing of the individual members including
production, processing, storage, bulking, transporting and marketing among others.
FBOs are indispensable in the supply chain of the GSFP and the achievement of the objectives therein.
This is as a result of their role as primary producers irrespective of whether they supply directly to the
SFP or not. The Nadowli Kaleo District has a total of 26 FBOs recognized by MoFA, however this study
covers 17 of them. There are however other FBOs in the district working in partnership with NGOs
(SIDSEC and UW Agro Industries). 3.2.1 Registration Status of FBOs
From Figure 3.3.1, only 12% and 18% of the FBOs have been registered as business enterprises and
farmer cooperatives respectively. The greater majority of 35% exist as loose farmer organizations that
probably meet irregularly to pursue their interest as a result of which they may not be able to lobby
and to influence policy and the prices of their produce.
Figure 3.3.1: Registration Status of FBOs
Source: SAVE-Ghana Field Survey, 2013
The rest of the 35% also had no idea what their status was and so could not respond to that item.
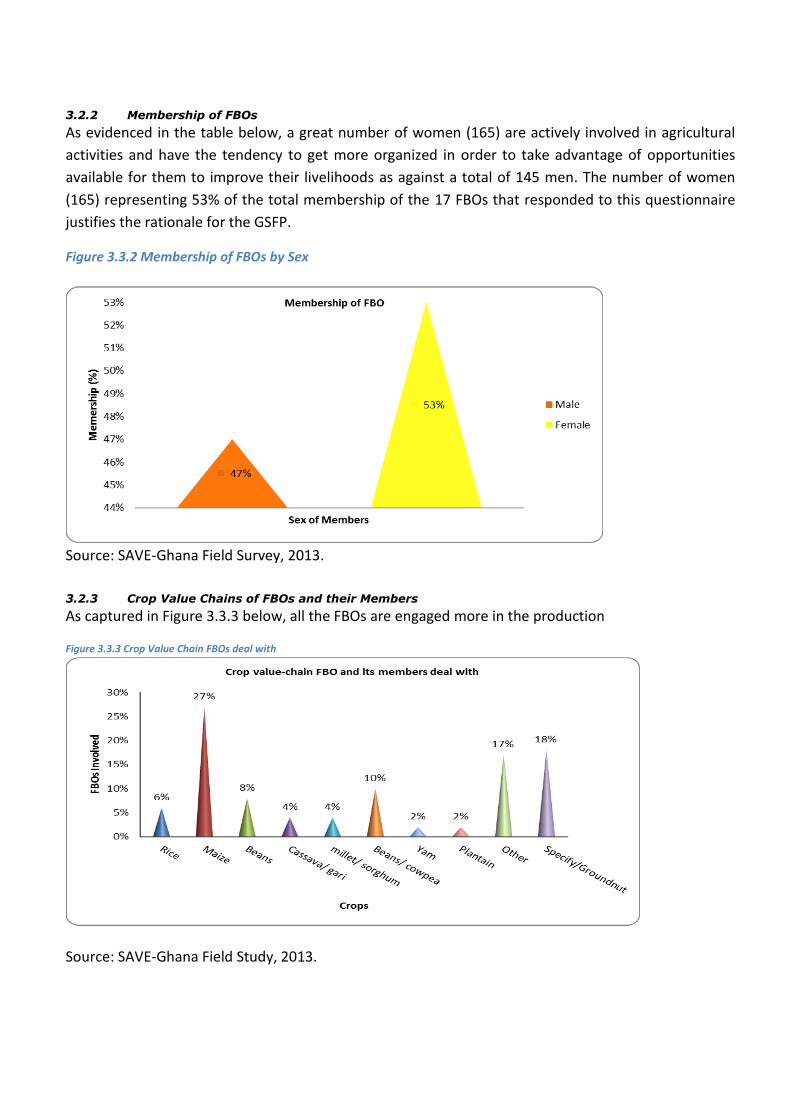
3.2.2 Membership of FBOs
As evidenced in the table below, a great number of women (165) are actively involved in agricultural
activities and have the tendency to get more organized in order to take advantage of opportunities
available for them to improve their livelihoods as against a total of 145 men. The number of women
(165) representing 53% of the total membership of the 17 FBOs that responded to this questionnaire
justifies the rationale for the GSFP.
Figure 3.3.2 Membership of FBOs by Sex
Source: SAVE-Ghana Field Survey, 2013.
3.2.3 Crop Value Chains of FBOs and their Members
As captured in Figure 3.3.3 below, all the FBOs are engaged more in the production
Figure 3.3.3 Crop Value Chain FBOs deal with
Source: SAVE-Ghana Field Study, 2013.

and related activities of maize and groundnuts followed by beans and cowpea while yam and plantain remain the lowest. This could be influenced by the environment, the multiple uses into which maize and groundnuts can be put and even the ease of production and storage. 3.2.4 Storage Facilities Used by FBOs
All 17 FBOs indicated that they store their produce in their own facilities prior to disposal or use. None
of them store in school, caterer and trader facilities because they have not been linked to the GSFP
supply chain and they have no relationships with them. The capacity of the storage facilities of 12 FBOs
put together out of the 17 FBOs totals 174 metric tons. 3.2.5 Storage Problems Encountered by FBOs
Eleven (11) out of the 17 FBOs said that they do not encounter storage problems while six (6) of them
also experienced storage problems in the last harvest season which included heat/moisture, pests and
pilferage related storage problems.
3.2.6 FBO Participation in SF Procurement and Training
None of the FBOs have ever participated in SF procurement or received any training from any
institution. No institution has ever invited them to any procurement process or to be trained on SF
supply chain related issues. They have also never received any financial support to supply to the SFP.
3.2.7 Inspection of FBO Storage Facilities
As shown in Figure 3.3.5 below, 65% (11) of the FBOs have never had their storage facilities checked or
inspected by any authority however, 29% (5) of them have their storage facilities inspected by MoFA
and 6% (1) of them has its storage facility inspected by the DDO. This suggests that the 11 FBOs whose
facilities are not inspected do not receive any technical advice on storage and would most likely
experience storage problems.
Figure 3.3.5 Inspection of Storage Facilities of FBOs
Source: SAVE-Ghana Field Survey, 2013.

3.2.8 Regularity of Inspection on FBOs’ Facilities
On the regularity of checks, out of the 6 FBOs that have their facilities checked, 33% (2) indicated that
they have their facilities checked monthly, 17% (1) quarterly, 17% (1) semi-annually and 33% (2)
annually as presented in Figure 3.3.6 below.
Figure 3.3.6 Inspection of FBO Facilities
Source: SAVE-Ghana Field Survey, 2013.
3.2.9 Details of FBOs Activities
For the different crop value chains that the FBOs deal with, they engage in production, bulking storage,
transportation, processing, negotiation and sale of their produce. Their total volume of production in
the last season was 764 metric tons followed by storage which also totaled 584 metric tons while sales
recorded 52 metric tons. Processing, transportation and bulking recorded the least volumes of 2 metric
tons, 8 metric tons and 9 metric tons respectively. Within the period, 6 FBOs were able to negotiate
sales deals while only 4 FBOs received technical assistance.
3.3 Traders/Suppliers
Traders/suppliers have always served as middlemen and women between smallholder farmers and all
consumers and in this case the caterers who do the purchases to cook for food preparation.
The only trader who featured in this study does her business as an informal business enterprise that
was started in 2010. She has no employees and is not affiliated to any national level organization.
The only activity she engages in is the storage and sale of cassava and gari up to four (4) metric tons.
From the interview, she has never participated in any school feeding procurement process meaning
that relationship with the caterer(s) is an informal one. She has neither received training nor financial
support to supply to the GSFP.
All her food stuffs are stored in her own facility and she does not experience storage problems. This is
because she frequently dries the food stuff as a quality management measure. All her stock is bought

from external markets but all grown within the country because cassava is not a major food crop
produced in the district.
She reaches the farmers she buys from via telephone but thinks that none of them determines the
prices of the products but rather, the market forces.
She has never attended any SF coordination meeting and social audit event since the start of her
business.
3.3.1 The Role of NAFCO as a Supplier in the SFP
For various reasons, the small holder farmer has limited participation in the school feeding food supply
chain due to inefficient supply chain practices such as limited access to information, limited
collaboration between supply chain actors, limited access to credit and delay in release of funds to
GSFP caterers from GoG, coupled with the low financial capacity of caterers to pre-finance their
businesses and farmers’ inability to accommodate extended credit sales (beyond 30 days). NAFCO was
set up by the Ministry of Food and Agriculture (MoFA) to ensure food security and to insulate farmers
against losses resulting from anticipated increases in production. A key objective of NAFCO is to
promote the consumption of locally grown produce. MOFA initiated the Block Farm interventions
including NAFCO to increase the level of cereal production locally such as rice, maize and soya. The role
of NAFCO therefore is to purchase these cereals from farmers and the request to supply state
institutions should boost cereal production locally and consequently its consumption. The GSFP
became one of the largest client/consumers of rice produced locally, purchased and processed by the
National Buffer Stock Company (NAFCO) since 2011. This arrangement came about partly in response
to the challenge of delay of release of funds from GoG to GSFP Caterers. GSFP has an MOU with
NAFCO to supply rice to School Feeding caterers so that the GSFP can deduct the cost of the quantity
of rice supplied through the District Assembly and pay NAFCO any time Government releases funds for
the payment of caterers. Payments are deducted directly from the payments due caterers. In recent
times NAFCO has been an important actor in the GSFP because it supports caterers particularly
through the supply of rice to enable them deliver to the GSFP.
In the last academic year (2012/2013) NAFCO supplied a total of 1052 bags of rice to the caterers in
three batches of 250, 400 and 402 bags. This certainly was relieving to the caterers particularly those
who often have problems pre-financing the feeding for as long as a school term before payment.
In the opinion of some of the caterers, the arrangement with NAFCO to give them the rice on credit
was commendable but complained that the rice supplied is sometimes infested with weevils. They
expressed fears it could have harmful effects on the pupils if it is cooked for them.
In line with that the following could help NAFCO play its role in the school feeding program more
efficiently;
The Food and Drugs Board (FDB) should check on the quality and expiry date of NAFCO’s rice
before they supply it to schools.
NAFCO should have a warehouse in each district where they can store food stuff for
redistribution to caterers.

NAFCO/LBC should be part of the SF coordinating meetings and organize training workshops
for caterers and other stakeholders to understand their mode of operation.
The supply chain arrangement with NAFCO would be improved if;
They build warehouses in the district to stock food from local farmers.
The people of the district appreciate by tracing to the farmers involved and consume what is
grown in the district.
If they can reduce the prices on the supplies of rice to caterers
3.4 Caterers
3.4.1 Status of Caterers
Caterers are key actors in the GSFP as they are the direct link between food stuff producers and
suppliers (farmers and local markets) and final consumers of the food-the school children. All the forty-
six caterers who responded to the questionnaire were females which confirm the dominance and
passion of women in the field of catering.
By the procurement process of the GSFP, some of the caterers were contracted as formally registered
business enterprises or existed as informal business enterprises recognized by the District Assembly to
be able to participate in public or SF procurement.
Figure 3.5.2: Registration Status of Caterers
Source: SAVE-Ghana Field Work, May, 2013. The study revealed as depicted in figure 3.5.2 above that 41 caterers representing 89.1% of those who
responded to the question on their status operated only as informal business enterprises with only 6
representing 13% being registered as business enterprises. Two (2) of them representing 4% though
not registered, met the requirement to take part in SF procurement processes. This suggests that many
of them either did not run catering services prior to the introduction of the SFP or their capacities were
not up to the huge task of pre-financing the supply of one hot adequately nutritious meal per child per
day.
3.4.2 Caterers’ Membership of National Level Organizations

These caterers are not part of any national level catering or SF related organization which means that
at the district, regional and national levels, there is not any platform that can serve as a voice for the
interests and concerns of the individual caterers and there is no opportunity for their own learning or
sharing of experiences in which case standards or principles/ethics would be difficult to enforce.
3.4.3 Training Received by Caterers
As contained in Figure 3.5.3 below, out of the 46 caterers who responded to the questionnaire, only
39% of them have received trainings on food quality and hygiene in relation to the SFP which according
to them were organized by the regional office/secretariat of the GSFP.
Figure 3.5.3 Training of Caterers
Source: SAVE-Ghana Field Survey, 2013. 3.4.4 Caterers’ Employees working on SF Related Activities
To enable the caterers offer quality services in view of the number of children they are responsible for,
all the caterers have employed the services of an average of 3 cooks totally 116 all on full time bases.
Except in the case of one caterer, these employees of the caterers who are mostly cooks have never
received any formal training to deliver to the SFP but barely rely on the instructions of their bosses and
their experiences in the kitchen as women over the years. This has a lot of implications on the quality
of meals delivered to the children particularly that cooking for large numbers is not the same as
cooking a family meal.
3.4.5 Food Stuff Used in School Feeding Menu
Even though so many other crops are cultivated in the study area, the dominant food stuff used for the
school meals are rice, maize, beans/cowpea and cassava products (gari and cassava dough). As
presented in Figure 3.5.4 below, rice, maize and cassava/gari have the same patronage of 20%
followed by beans and cowpea at 16%. Other crops including soya beans despite its touted nutritional
value, has just 4% patronage while the traditional grains of sorghum and millet have a negligible 1%
use by the caterers.

Figure 3.5.4 Food Stuff Used for School Meal
Source: SAVE-Ghana Field Work, May, 2013. Rice, maize and cowpea were the most used food stuffs in the menu last academic year with the total quantity of rice used totaling 184 metric tons at the cost of Ghc 138,575; maize totaling 128 metric tons at the cost of Ghc 44,949 while cowpea totaled 114 metric tons at the cost of Ghc 16, 502. Millet and sorghum were the least used totaling 3 metric tons at the cost of Ghc 912.
Table 5.7.1 Quantities of Food Stuffs Demanded last Academic Year
Food Stuff Quantity (m/t) Cost (Ghc)
Rice 184 138,575
Maize 128 44,949
Beans 23 6,410
Cassava/Gari 64 14,592
Millet/Sorghum 3 912
Cowpea 114 16,502
Others (G’nuts, Soya Beans)
10 730
Source: SAVE-Ghana Field Survey, 2013.
3.4.6 Decision on School Menu/Ration
If the response of the caterers is anything to go by, they are not fully responsible for which food stuffs
used on the school menu as 74% of them indicated that the decision on the school menu is by the
GSFP with just 12% saying they decide what to cook based on what foodstuff is available and 10% also
suggesting the school’s involvement in the choice of menu. The GSFP regional secretariat however says
the menu is jointly decided by the DIC, the GSFP and the caterers.

3.4.7 Main Sources of Caterers Supplies
The concept of the PGHGSFP is that it will create a ready market for the produce of local farmers
within the beneficiary communities or districts a good percentage (at least 30%) of who are expected
to be women thereby increasing their productivity and incomes for an eventual improvement in the
standards of living of these rural farmers. This implies that caterers are supposed to have direct links
with Small Holder Farmers (SHF) and purchasing directly from them.
Figure 3.5.6 Caterers Sources of Supplies of Food Stuff
Source: Field Work, 2013. From Figure 3.5.6 above, the sources of supplies of all the caterers aggregates to 35% from Market
Queens and 31% from traders with only 19% of supplies from SHFs 10% from NAFCO. This clearly
justifies the need for this study from which the gaps making it impossible for the goals of the HGSFP to
be achieved can be highlighted.
3.4.8 Places of Storage Prior to Usage/Disposal
Majority of the caterers (76%) i.e 35 of the 46 caterers as shown in Figure 3.5.7 below use their own
facilities for the storage of the food stuff mostly in their homes and then issue enough for cooking each
day while 29% (13 caterers) and 11% (5 caterers) have access to school and community storage
facilities respectively where they keep their food stuff. It suggests that neither the DA, the GSFP nor
beneficiary communities have been able to assist many beneficiary schools with facilities where the
caterers can store their food to ensure food safety and quality control. Out of this number, only one
caterer received financial support from a relative to improve her storage facility.

Figure 3.5.7 Storage Facilities Used by Caterers
Source: SAVE-Ghana Field Work, 2013. 3.4.9 Caterers’ Storage Problems
Thirty-seven percent (17) of the caterers encounter storage problems while the rest of the 63% (29)
caterers do not. For those who encountered storage problems, there were pests, moisture/heat and
pilferage related problems. In Figure 3.5.8 below are the details.
Figure 3.5.8 Storage Problems of Caterers
Source: SAVE-Ghana Field Survey, 2013. Out of this, 27% was pests related storage challenges, 7% moisture and heat related problems and
4.3% pilferage related problems. As a result, out of a total of 153.25 metric tons of food stuff that they
bought and put into storage, as much as 21 metric tons representing 13.7% was lost in storage.

3.4.10 Getting in Touch with Local Farmers
A few of the caterers who have bought food stuff from the local farmers have indicated that the
interaction and business relationships between them and farmers are from their own initiative. They
visit the farmers or meet them in the open market for transactions. No other stakeholder in the GSFP
has played any role so far in linking caterers to farmers in the district.
3.4.11 Quality Management Measures at Storage
As high as 89% of the caterers (41) apply quality management measures in the storage of their food
stuff.
Figure 3.5.9 Quality Management by Caterers
Source: SAVE-Ghana Field Work, 2013. The common measures used are storing in sacks, storing on pellets and frequent drying which are
represented by 32%, 31% and 27% respectively. A very innovative and simple method which is by
storing in pic sacks rather attracted just 6% of them as a quality management measure. Pic sacks are
special sacks fabricated to keep grains and legumes safe without chemical treatment of the food stuffs.
Figure 3.5.9 below presents it clearly. As a multiple response item, some employed more than one of
the quality management measures presented in the table below.
3.4.12 Food Stuff Price Determination
In an answer to the multiple response question of price determination, 72% (33 caterers) of
respondents think prices are fixed by the market forces while about 16% (7 caterers) say price is
determined through negotiation between caterers and farmers and 9% (4 caterers) also see the
market prices of food stuff as an imposition by the farmers.
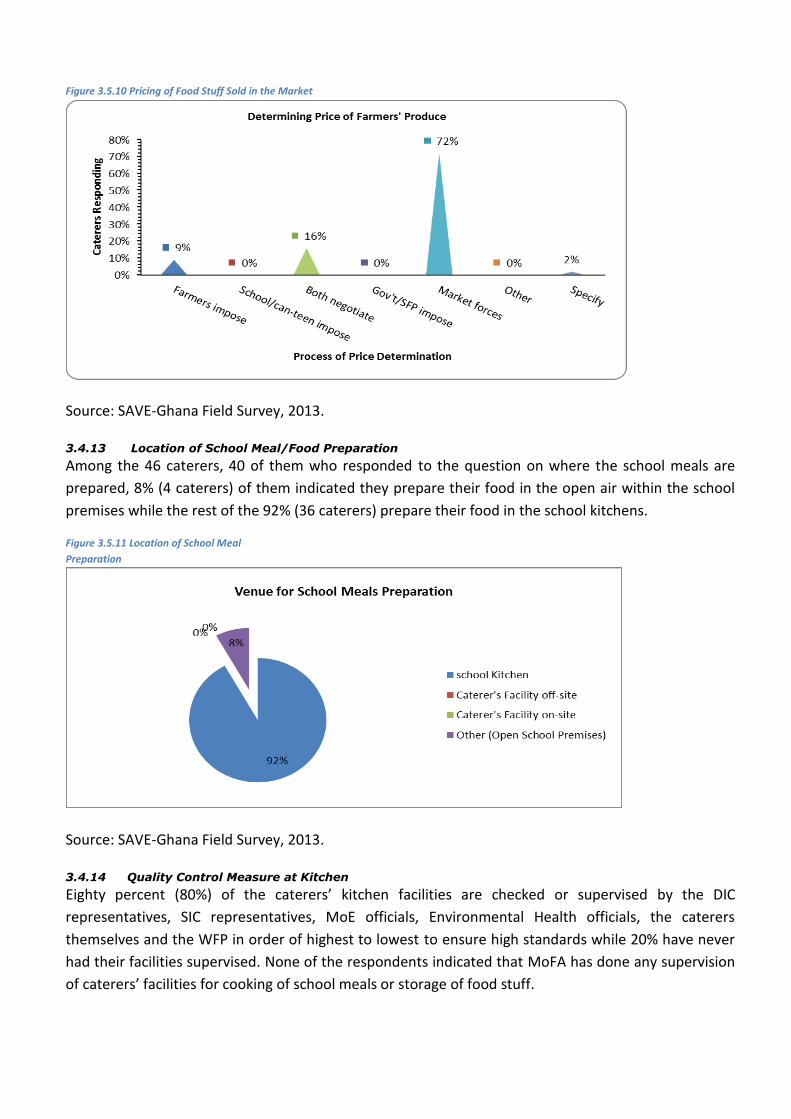
Figure 3.5.10 Pricing of Food Stuff Sold in the Market
Source: SAVE-Ghana Field Survey, 2013. 3.4.13 Location of School Meal/Food Preparation
Among the 46 caterers, 40 of them who responded to the question on where the school meals are
prepared, 8% (4 caterers) of them indicated they prepare their food in the open air within the school
premises while the rest of the 92% (36 caterers) prepare their food in the school kitchens.
Figure 3.5.11 Location of School Meal
Preparation
Source: SAVE-Ghana Field Survey, 2013. 3.4.14 Quality Control Measure at Kitchen
Eighty percent (80%) of the caterers’ kitchen facilities are checked or supervised by the DIC
representatives, SIC representatives, MoE officials, Environmental Health officials, the caterers
themselves and the WFP in order of highest to lowest to ensure high standards while 20% have never
had their facilities supervised. None of the respondents indicated that MoFA has done any supervision
of caterers’ facilities for cooking of school meals or storage of food stuff.

3.4.15 Frequency of Inspection of Caterers’ Cooking Facility
On the question of how regularly their facilities are inspected, 19.4% (9 caterers) have indicated that
their facilities are checked quarterly, 41.3% (19 caterers) monthly and 11% (5 caterers) weekly. The
rest have their facilities checked daily, annually, semi-annually or twice a week and this is detailed in
Figure 3.5.12 below.
Figure 3.5.12: Inspection of Caterers’ Cooking Facility
Source: SAVE-Ghana Field Survey, 2013.
3.4.16 Training Received by Caterers
The study shows that only 39% (18 caterers) have received training to deliver to the SF either from the
GSFP regional secretariat or the DA through the DIC. With the exception of one caterer whose
employees benefited from a formal training, the employees of the rest of the caterers of an average of
3 per caterer have not received any training.
Only two of the caterers have also ever attended SF coordinating meetings convened by the DDO and
DIC for the SF secretariat.
3.4.17 Financial Support Received by Caterer to Supply to School Feeding
As presented in the figure below, only 11 caterers representing 24% received financial support to
supply to the SFP three (3) of them in the form of credit totaling Ghȼ 9000 from two financial
institutions Agriculture Development Bank (ADB) and Social Security Bank (SSB) as well as PRONET
North (an NGO) while eight of them also received support in the form of pre-financing totaling Ghȼ
6940 from World Vision International (WVI).
3.4.18 Financing the Purchases for SF
Caterers finance the delivery of food to the school children with their own resources and in some cases
they use their own farm produce to feed the children. They think that banks can be useful in offering
the right financial services but would need to improve their services by timely disbursement of such
facilities and also by reducing the interest rates. The banks and other institutions like NGOs and MoFA
can help them better by giving to them those loans and micro-finance services.

3.4.19 Participation in Social Audit Events of the School Feeding
None of the caterers have ever attended any social audit event in relation to the GSFP. These events
have either never been organized in the district or the caterers have never been invited to be part of it.
3.5 District Assembly (DA)
In view of the fact that the GSFP falls under the jurisdiction of the Ministry of Local Government and
Rural Development (MLGRD) the DA is tasked with the responsibility of coordinating, supervising and
monitoring the implementation of the program in the district.
The SFP started in the then Nadowli District in the 2005/2006 academic year with a few schools and
gradually scaled up.
The DDO in-charge of the SFP who even though officially designated to facilitate and coordinate the
SFP has never received any training on procurement for SF.
In the 65 days of the last school term in 2011/2012 academic year, the request for funds for SF by the
DDO took two weeks from the point of planning. It took another two weeks after the request for funds
to be paid into the accounts of the district. There was no response to questions on time difference
between receipt of funds through announcement of tender, contract awarding and delivery of the
product.
3.5.1 The School Meals
From the angle of the DDO, menus of the schools are decided by the DIC with all meals prepared in the
school kitchens or within the school premises as indicated by the caterers. Some of these kitchen
facilities have seen improvement with financial support from the Local Government Authority and for
that matter the District Assembly.
Food stuff from the NAFCO which is periodically supplied to caterers as a form of pre-financing is
normally stored in a convenient place at the DA until distribution is done. These facilities have been
improved periodically to ensure the quality of the food stored in there again through the support of
the Local Government Authority. To ensure that some standards are complied with, the facility is
inspected quarterly by officials of the Environmental Health Service and the GSFP. The district however
still encounters storage problems including pilferage and pest attack.
3.5.2 Participation in SF Coordination and Social Audit Events
Contrary to responses from the FBOs and caterers, the DDO reported that, in collaboration with the
DIC, the assembly organizes SF coordination meetings and social audit events annually. In regular
participation in these events are CSOs/NGOs, FBOs and the general public. The DDO has also
participated in social audit events attended by CSOs/NGOs called Social Accountability Audit convened
by the GSFP National secretariat of the GSFP and in collaboration with the Ghana Audit Service.
3.5.3 Ministry of Food and Agriculture (MoFA)
Information obtained from MoFA indicates that their role as a public sector institution includes
agricultural policy formulation, planning and coordination, monitoring and evaluation in their bid to
offer essential services such as capacity building of farmers, promotion of farmer to market access,
provision of extension services, technology transfer, farmer and public education and sensitization and

research into improved varieties of crops and breeds of animals and provision of technical advice
towards the overall goal of improved livelihoods.
3.5.4 Production levels in the last Season
From MoFA’s authenticated records for the last farming season, the production levels for the major
crops produced in the district are captured in table 3.7.1 below. Maize, groundnuts and cowpea stand
out clearly as the largest agricultural products of the district and the only point of sale of these food
stuffs are at the local markets with the main local market located in Tangasia in the district?.
Table 3.7.2 Production levels and Prices
Commodity Production (MT)
Average Price per
bag Last Season
(Ghȼ)
Main Markets
Maize 20,527 80.00 Local Markets
Rice 314 80.00 Local Markets
Sorghum 16,011 160.00 Local Markets
Millet 8,299 200.00 Local Markets
Groundnuts 26,475 80.00 Local Markets
Soya Beans 716 70.00 Local Markets
Cowpea 23,980 200.00 Local Markets
Source: MoFA, Nadowli.
3.5.5 Knowledge of FBOs in the district
MoFA has verified data on the functional existence of 17 FBOs in the district with a total membership
of not less than 310 out of which 136 of them are women. There is information also about other FBOs
that exist under the supervision of some NGOs (SIDSEC, WVI, ACDEP, UW Agro Industries) operating in
the district.
3.5.6 Support to FBOs
In the year 2012, MoFA supported a number of FBOs by giving them training, extension services,
technology transfer and loans (credit facility) aimed at ensuring food security in the district. In Table
3.7.2 below is a list of some of the FBOs that received various supports from MoFA. Beneficiaries from
Daffiama and Kojokperi which are now under the newly created Daffiama-Busie-Issa district are
mentioned here because the Nadowli-Kaleo District Directorate of MoFA still administers the new
district pending the establishment of a fully operational district office in the new district

Table 3.7.3 FBOs that benefited from MoFA support
NAME OF
BENEFICIARY
FBO
NUMBER
OF
FARMERS
SUPPORT RECEIVED
Location
Training Extension
Technology
Transfer
Credit/L
oan
(Ghȼ)
Progressive
Farmers Ass. 16 Dawuri
3,043
Sagdiibu Farmers
Ass, 4 -
1,017
Tietaa Maale
Farmers
Association. 22 Golyiri
4,181
Amayaana
Women Group 18 Kojokperi
2,026
Puli Farmers
Association 22 Kaleo
791
Changu Farmers
Ass. 13 Changu
-
Buu Farmers
Association 12 Kaleo
3,051
Tietaa Farmers
Ass. 11
Daffiama-
Dakyie
2,398
TOTALS 118 16,507
Source: MoFA, Nadowli, 2013.
3.5.7 The Use of Cereal Banks
MoFA in collaboration with the DA owns some cereal banks in the district that serve as storage
facilities to some farmers which were located in Fian, Kojokperi, Nadowli, Takpo and Daffiama which
are also used as national food reserves from which the local markets are supplied. These banks are
under the management and supervision of MoFA with the purpose of enhancing food security in the
area. Most of them regrettably have been abandoned and are wasting away this is because they were
establish for a FASCOM project where fertilizers where mostly stored for distribution to farmers
maintenances became un sustainable following the end of the project.
3.5.8 Participation in SF Coordination and Social Audit Events
MoFA has never participated in any SF coordination meeting in the district and has also never been
part of any social audit event about SF because they have never been invited.
3.6 Financial Institutions
The only financial institution operating in the district is the Nadowli branch of the Sonzele Rural Bank
of Jirapa. No caterer indicated any transactions or receipt of any credit facility from the bank. All
efforts to collect information from them proved futile as the branch manager was not only hesitant at

responding to the questionnaire but also insisted they have to send it to their mother branch for
approval before any such information could be given.
3.7 Key Informant
The respondent, Madam Florence N. Tantuo who is a Chief Technical Officer with MoFA indicated her
role in agricultural value chains is in the dissemination of relevant information particularly on new
findings and the impact of policies in relation to production and ensuring effective comprehension of
issues. She has had several trainings on agricultural value chains and is very well abreast with the case
of Nadowli district. In her opinion, farmers in the district have never been linked to the GSFP and so no
formal relationships exist between the two key actors in the SF supply chain.
3.7.1 Challenges and Opportunities
The barriers to efficiency in the agricultural value chains from her position as an informant include the
following;
Little or no research done to improve efficiency in the value chains of the major crops in the
area which are maize, rice, yam, cassava, fruits, vegetables and cassava (Gari processing).
The cost of technology transfer and level of education are barriers to technology transfer in
the district as a result of which farmers do not have the full benefit of improved and
recommended technologies.
The cultivation of these crops annually is dependent on the mercy of nature as there are no
irrigation systems in the area.
Marketing is poor and farmers do not get value for their toils.
The respondent however did not identify any opportunities in the agricultural value chains.
3.8 Barriers to SF Supply Chains
The most disturbing challenge here is the delay in paying caterers after pre-financing the feeding of
children for months. A timely release of funds to be paid to caterers who would in turn also pay
farmers who might have supplied them would be the best way forward.
3.9 Non-governmental Organizations (NGOs) interventions
Three of the NGOs operating in the district (ACDEP, World Vision and PRONET) which are into capacity
building, education and sensitization, policy advocacy and extension services indicated that they
support some FBOs by linking them to financial institutions for credit. With only PRONET North giving
training, extension services technology transfer and supply of equipment to farmer groups. Only
ACDEP has ever participated in a coordination meeting about SF where issues of production and
supplies were discussed but none of them participated in any social audit events about SF because
they do not know about it neither have they been invited to attend any meeting of the sort.

4 CHAPTER FOUR: SUPPLY CHAIN STUDY
4.1 Introduction
This section presents and discusses the findings on the food stuffs used, core processes, the key actors
and the roles they play, the interrelationships between them and the constraints and opportunities
existing in the SF supply chain and how these impact on the effective and efficient delivery of the final
product to the beneficiaries. It is expected that this study will lead to the development and analysis of
the SF supply chain map for the district that will in turn lead to actions or interventions to address the
constraints and take advantage of the opportunities for an improved SF supply chain.
4.2 Supply Chain Study
4.2.1 Definition of the end food product(s) demanded by the school feeding programs
In the Nadowli Kaleo district, the main meals fed to the children include plain rice, rice and beans, gari
with beans, Banku and “Tuo Zaafi’ (TZ) which come with different accompaniments in the form of soup
or stew prepared from ingredients such as cooking oil, tomatoes both fresh and canned, fish (mostly dry
or smoked), dawadawa, maggi cubes, groundnut paste, okro, pepper, salt and onions among others. These
meals permanently on the menus of schools were decided by the DIC in collaboration with the regional
secretariat of the GSFP. These meals come from the major food crops in the agricultural value chain
which are maize, beans, cassava groundnuts and rice.
In Table 4.2.1 are the list of food stuff used in the SFP and their sources. Caterers guarantee that the
food stuff they buy comes from locally produced sources. They are able to determine this subjectively
by the low level of value addition and packaging. The quality of the local food stuff is different from
those coming from outside. Production and demand statistics from the FBOs and caterers in the last
farming season and the last academic year shows that, rice produced locally totaled 314 metric tons
while the 46 caterers used just 184 metric tons the whole academic year. The rest are millet/sorghum
(24,310 metric tons produced) against (3 metric tons used) by the caterers, cowpea (23,980 metric
tons produced) against (114 metric tons used), maize (20,527 metric tons produced) against (128
metric tons used) and groundnuts and soya beans (27,191 metric tons produced) against (10 metric
tons used) by the caterers. These statistics suggest that caterers can get all their supplies directly from
the farmers if the linkage is well established and that SHFs will indeed benefit from the SFP through
increased incomes.
The food stuffs used in the school menu are delivered in their raw form. The cereals are delivered in
bags while cassava comes in the form of dried cubes or sticks in a bags. Vegetables used for soup come
fresh in containers but is mostly damaged because of its perishability. Most of the food stuff are
available all year round but has peak seasons during which prices are low and lean seasons during
which prices sour up.
To ensure that the food bought is of good quality, caterers go to the market themselves and insist to
have the bags opened to verify grains to be sure it is free of pest infestation and that it is well
processed. The quality of the food stuff in their view, can be improved if farmers and traders use good
storage structures and systems, dry their goods periodically, store on pellets and making use of Pic
sacks.

According to the caterers, they face competition from other buyers such as petty traders, market
queens who aggregate the products and to sell later, Bursars of the second cycle educational
institutions and other traders from Techiman. Some group of caterers predict an increase in the
quantity of food to be bought next year because the free feeding in school is encouraging many
parents who would otherwise not have sent their wards to school to do so.
Table 4.2.1 Food Stuff and Sources
FOOD STUFF SOURCE OF SUPPLY PLACE OF PRODUCTION
Rice Traders and NAFCO Locally Grown
Maize Local Farmers, Traders, Market Queens Locally Grown
Beans/Cowpea Traders and Market Queens Locally Grown
Gari Traders and Market Queens Locally Grown
Cassava Market Queens and Local Farmers Locally Grown
Source: SAVE-Ghana Field Survey, 2013.
4.2.2 Identification of foodstuffs grown by local farmers that can form the main menus for school
feeding in the district
The school menu across the district is the collaborative decided of the GSFP, the DIC and the caterers. The decision is informed by the local food stuffs available all year round and the ease of cooking for large numbers. The menu is therefore not an exclusive list of possible food items as there are many other food crops and dishes that can form part of the school menu.
4.2.3 Potential Food Items on the SF Menu
The school menus have not made room for all food stuff gown in the district. Table 4.2.2 below
presents other food stuff that could be very useful in improving the nutritional status of the children.
Table 4.2.2 Potential Food Items for School Menus
FOOD STUFF PRICE PER BAG (GH₵) SOURCE PERIOD AVAILABLE
Soya Beans 100 Locally Grown October. – December
Bambara Beans 160 Locally Grown November – January
Yam N/A Locally Grown November – May
Sweet Potato N/A Locally Grown January – April
Fruits (Mango,
Pawpaw) N/A Locally Grown February – April
Source: SAVE-Ghana Field Survey, 2013.
Soya beans according to nutrition experts has the highest nutritional value among all the legumes and
can be put to varied uses while Bambara beans is about the same nutritional value as beans or
cowpea. Bambara and soya beans are also the most expensive though available in significant
quantities. The challenge in using Bambara and soya beans would then have to do with cost given that
each child is fed on Ghc 0.40 a day. Bambara beans also take much time and energy to cook while soya
beans would have to be processed into other forms before it becomes consumable.
4.2.4 The Core Processes in the Supply Chain
The core processes in the supply chain of the SFP include production, extension services, processing,
post-harvest storage, transportation, marketing, storage, food preparation and delivery to the school
children.
The bulk of the production of food stuff in the district is done by SHFs while a small proportion is also
produced by organized farmer organizations in the district. This is with the technical support of MoFA
and some NGOs in the district. NGOs also help the farmers to access credit facilities to increase and
improve production levels.
The food stuff produced is processed through activities such as thrashing/de-husking, cleaning, drying,
sorting and bagging to ensure high quality and to prevent losses. This is mainly done by individual
farmers and FBOs but traders also find themselves processing food stuff like rice and groundnuts into
paste for soup

Table 4.2.3 Actor Function Worksheet of the District
Source: SAVE-Ghana Field Survey, 2013.
Functions
ACTORS
Direct Actors Support Services Actors
SHFs/
FBSs
Food
processors
Traders/
Market
Queens
Retailers NAFCO Caterers Schools/
pupils
MoFA Agro
Input
Dealers
NGOs MLGRD/
GSFP
FIs FDA DA/DIC/
SIC
Environ
mental
health
Transporters
Consumption
Food safety & quality
training
Food Preparation
Menu Determination
Foodstuff Supply
Transportation
Storage
Bulking
Processing
Production
Extension
Input Supply
Finance
M&E
Regulation &
Coordination

The delivery of the final product of the school feeding program to the children is preceded by a
complex array of interrelationships between different actors in the agricultural and SF value chain.
The supply chain functions include; Regulation and Coordination, Monitoring and Evaluation,
Financing, Input Supply, Extension Service, Production, Processing, Bulking, Storage, Transportation,
Food Stuff Supply, Menu Determination, Food Preparation, Food Safety and Quality Training and
Consumption. Along this chain are Smallholder Farmers and FBOs, Food Processors, Traders/Market
Queens, Retailers, NAFCO, Caterers and Pupils as direct actors and MoFA, Agro Input Dealers,
Financial Institutions, NGOs, the District Assembly/DIC/SIC, the Ministry of Local Government and
Rural Development (MLGRD) represented by the GSFP, Financial Institutions (FIs), Food and Drugs
Authority, Environmental Health Department and Transporters as indirect or support service actors. 4.2.5 Production
MoFA plays a significant role in the production, processing and storage of food stuff by giving
extension services and technical advice to FBOs and individual SHFs. FBOs and SHFs are at the center
of the processes of production up to marketing of their produce. Some of the SHFs produced with the
support of financial institutions even though from outside the district.
4.2.6 Storage
Storage is done by the FBOs and SHFs immediately following harvesting except in the case of
perishable goods. ACDEP also does grain banking which is sold back in the lean season. The DA also
plays a minimal role in storage by supporting in the provision of grain banks. After buying from
farmers, traders also store the food stuff for sale later or do sales gradually. The caterers also have
storage facilities where the raw food is stored prior to cooking. 4.2.7 Transportation
In the area of transportation of the food stuff, it is done solely by transporters as their main function
even though caterers also transport their food stuffs from the market to their storage facilities. In a
few cases, farmers themselves do transportation when they take their produce to the markets.
4.2.8 Marketing
Marketing is between farmers and traders, farmers and caterers and also between traders and
caterers because the market remains farmers’ only sales point since they do not have direct
marketing relationships with caterers. The same lack of relationship is what compels caterers to also
depend on the open market for their supplies of food stuff.
The caterers engage in purchasing and transporting the food stuff they require to supply to the SFP
and together with cooks that they employ, they deliver the final product.
4.2.9 Development of the supply chain map showing flow of goods and linkages between the
primary actors and the final consumers
In this entire process, there are weak and strong relationships between the various actors. As
depicted in Figure 4.2.1 below, MoFA has a strong relationship with the farmer organizations and
individual farmers through the technical services they are mandated to offer but maintain loose
relationships with NGOs, the DA and traders.

Figure 4.2.1 Supply Chain Map of the District of Nadowli-Kaleo District
Source: SAVE-Ghana Field Survey, 2013
FBOs (17 active)
Farmers = 310 (44% Female)
70 Schools, Children-34,105
Caterers=46 (70)
Cooks=115
Extension
(MOFA, Agro Input Dealers)
Financial Services Bank: Sunzele Rural Bank branch
Policy Guide, Coordination,
Funding (, MLGRD, GSFP,
DA)
Food Safety & Quality
Training (EPA/FDA,
MoFA, DA, GES)
NAFCO (1052 bags)
Production Bulking Storage Distribution Food
Preparation
Consumption
Supply
Traders = 1 (Supply of rice, maize, beans,
cassava/gari & groundnuts)
KEY Funds flow Product flow Supply contracts Support services etc
Processing
Support services, funding, regulation, coordination, steering, quality control etc.
GSFP REG.
SECRETARIAT
Food Processors (Supply of gari,
dough, groundnut paste)

40
There is a strong product supply flow between food processes, traders and NAFCO while
there is a weak supply relationship between caterers and SHFs and FBOs. This stems from
the fact that supply relationships between caterers and farmers have not been facilitated
and so have not been established. Caterers therefore buy from traders in the open market
and market queens but do not have formal trade agreements. There is also a strong supply
relationship between caterers and the school children since caterers supply them with one
hot meal on each school day.
Funds flow is stronger between the GSFP and caterers because caterers pre-finance the
supply to the school children and are later reimbursed through the GSFP. Funds flow is fairly
good between the financial institutions and traders as well as food processes. This could be
because they have a more reliable source of income and can easily access loan facilities
from the financial institutions. Funds flow is weak between financial institutions and
caterers as well as farmers and this could be attributed to the delay and irregular payment
of funds to caterers after they pre-finance sometimes for over a school term. In the case of
farmers, agriculture is considered the most risky business venture because farmers solely
rely on nature which cannot be predicted and financial institutions have the experience of
struggling to retrieve loans given to farmers.
There is a strong supply contract relationship between NAFCO and the GSFP and also
between the GSFP and caterers which are two-way relationships. NAFCO supplies rice to
caterers on credit at a given price through the GSFP and caterers are bound by an
agreement to pay back to NAFCO when government pays their funds.
The map also shows that MoFA and Agro Input Dealers offer extension services to farmers
while the Food and Drugs Authority (FDA), Environmental Protection Agency (EPA), MoFA,
the District Assembly and Ghana Education Service also give food safety and quality training
support services to caterers and for the benefit of the school children.

5 CHAPTER FIVE: SUPPLY CHAIN ANALYSIS
5.1 Objectives for Improvement of the Supply Chain
The objectives of the supply chain analysis include;
Definition of the end food product(s) demanded by the school feeding programs
Identification of foodstuffs grown by local farmers that can form the main menus for
school feeding in the district
Determination of the core processes in the supply chain
Mapping the main actors involved in these processes as well as the supporting actors
Developing the supply chain map showing flow of goods and linkages between the
primary actors and the final consumers
Validating the mapping together with the actors
The outcome of this is a clear understanding of the supply chain situation of the HGSFP
where the actions and inactions of the various stakeholders of the program which are
potentially detrimental to the achievement of the program’s objectives will be mapped out
and strategies adopted to resolve the challenges therein.
5.2 Benchmarking
The whole concept of school feeding for Kindergarten and Primary School children could
have been crafted out of the system where second cycle students in the age range of 14 to
19 on the average are not only fed but are also resident on campus for reasons of control
and management efficiencies. The current concept of the SFP is such that caterers pre-
finance the provision of one hot and adequately nutritious meal to each child on each
school day and are paid later by the central government through the local government
authorities as and when funds are available. This for now is bedeviled with a lot of
challenges which are fast eroding the benefits the programme is set to achieve.
The GSFP feeds the children on Ghc 0.40 per meal per day while students in the boarding
houses of the secondary schools are fed on Ghc 1.80 for three meals a day. Even though
several factors determine the quality of cooked food and that quality in itself is relative, the
feeding grants for the two systems suggests that, students in the secondary school boarding
system are likely to be better fed than the Kindergarten and Primary school children on the
GSFP.
Even though the system run by the second cycle institutions has its own challenges, there
exist some significant levels of variations in the manner the second cycle institutions feeding
system is administered which probably accounts for its relative smooth running compared
to the HGSFP.

5.2.1 9.2.3 Source/Procurement of Food Supplies
Unlike the HGSFP, the supply of non-perishable food stuff is awarded to food contractors
who go through formal procurement processes to supply to the school. The matrons are
allowed to purchase the perishable food stuff themselves on weekly bases but with the
approval of the procurement committee.
One very important thing to note about school feeding at that level is that, the Matrons are
all professionally trained and have a national level association called the National
Association of Domestic Matrons and Bursars (NADMAB) which is currently lobbying for a
desk in the GES and the Ministry of Finance and Economic Planning to advocate for their
interest. The association also serves as a regulatory body that controls the activities of their
members.
By estimation, the food contractors supply between 50% and 100% of the food stuff used in
each school term according to a school matron. The variation in the percentage of supplies
is due to the fact that the matrons themselves procure food items like yam which is
perishable and seasonal in terms of availability.
5.2.2 9.2.4 Crops in the School Menu
The major food crops used in the school menu are the same as those used in the menus of
the GSFP that is rice, maize, beans, cassava/gari with the exception of yam. This is
accordingly in view of the fact that the number of students at that level is enormous and
therefore impossible for any food crop that is not readily available in large quantities and all
year round to be introduced into the menu.
5.2.3 9.2.5 Decision on School Menu
Unlike the HGSFP where the menu is influenced greatly by the DIC and the SF secretariat,
the menu at the second cycle level is decided by the school’s food committee which is
usually made up of the matron, representatives of all the year groups of the school, the
Dining Hall Prefect and the Dining Hall Master. At that level, the decision on the menu is
independent of any administrative control and is what informs the choice of food crops to
be awarded to contractors to supply.
The respondent was convinced that all their supplies come from local SHFs and FBOs within
the area and that the prices are arrived at through negotiations between both parties.
5.2.4 9.2.6 Purchases and Storage of the Food Stuff
The second cycle institutions have facilities within the school premises for storage except
that they are mostly in very bad conditions with storage challenges which are pests and
moisture/heat related. The institutions prefer purchasing their food stuff in bulk mostly
enough to last for a school term. This accordingly is because it is cost effective and also
because some food stuff are not available all year round or have to be purchased from
outside the district.

To ensure that the food stuff which they purchase in bulk is safe for consumption, they first
do quality checks on the supplies and also chemically treat the quantity they estimate would
not be consumed immediately.
5.2.5 9.2.7 Challenges
The main challenge at that level is that infrastructural deficiencies have left many of them
cooking in the open and where there are kitchens, there are in very deplorable conditions
for which they continue to appeal to government for support.
5.3 Supply Chain Governance and Governance for Empowerment (GfE)
In a group discussion with caterers and also from the responses of other actors including
MoFA, ACDEP and the FBOs, the following assessments of the governance parameters in
relation to the SF supply chain were made as presented in Table 5.3.1 below where (5
means Excellent, 4 means Very Good, 3 means Good, 2 means Poor and 1 means very
poorest) with suggested means of improvement. The highest they graded was three (3) on
the average across all parameters with some parameters graded by some respondents as
low as one (1). Clearly, none of the parameters was graded up to four (4) and this suggests that
the governance process has not been very effective generally and more needs to be done if the
objectives of the HGSFP will be achieved.
Table 5.3.1 Assessment of Governance Parameters
Parameters Definition Ranking (1-5) Means of
Improvement Caterers MoFA FBOs NGO
Effectiveness
and Efficiency
Sharing
information
freely among
actors
2 2 3 3 Monthly Coordination
Meeting to be Held
Relationships
between actors
developed
2 2 3 3 Strengthen
Relationships
Membership
associations
provide needed
services to
members
2 2 4 4 Hold and Strengthen
Associations
Equity,
Inclusiveness
and
Actors
organizations are
functional at all 2 2 2 4
Definition of roles.
Make Actor
Organizations

Responsiveness levels
Functional at all
levels.
Actors are bound
by mutually
beneficial
contractual
agreements that
are fully complied
with.
2 2 2 3
Maintain Strategy
Contract
Enforcement
Special attention
is given to
women’s
involvement in all
supply chain
functions
3 3 3 2 Maintain Strategy
Rule of Law Standards and
regulations exist
and operational
2 2 1 4
Re-visit the Rule of
Law and Make
Amends
Enforcement
Accountability
and
Transparency
Information is
flowing freely
2 2 2 3 Make information
flow freely
Information is
shared to all
operators and
stakeholders
2 2 3 4
Information should be
shared to all operators
and stakeholders
Participation
and Voice
Collaborations on
common vision
exist
1 2 3 2
Strengthening of
collaborations.
Definition of
visions.
Involvement of
all functional
operators and
other
stakeholders in
decision making
and achieving
2 2 3 2 Involving all in
decision making

buy-in
Unlimited access
to information,
public facilities
and decision
making
structures to
make better
informed
choices
2 2 3 4 Involving grass
root structures
Source: SAVE-Ghana Field Study, 2013.
5.4 Identification of Constraints and Opportunities
The challenges in relation to the SFP cut across the various institutions or actors in the
supply chain.
5.4.1 Challenges and Opportunities of Caterers
The challenges of caterers in the SF supply chain include the following;
Delay in payments to them after they pre-finance the process
Inability to provide collaterals to the financial institutions to access credit facilities
High cost of inputs and poor timing in the case of pre-finance the SF with their farm
produce
The lack of secured storage facilities in the schools
High transport cost
Poor communication network in some of the beneficiary communities making it
difficult for them to access information
Poor record keeping
They however consider the following as opportunities and are hopeful that the situation will
improve,
It should be possible for the financial institutions to grant them loans based on the
contracts awarded to them which means they would surely be paid
Schools and PTAs can also help with the provision of storage facilities
FBOs and NAFCO will collaborate well with them
Communication network is still spreading and will improve with time
Caterers can form associations for learning and sharing purposes.
Stakeholder meetings can be used to strengthen the procurement and supply
process
The capacity of all actors can be built through training workshops.

5.4.2 Challenges and Opportunities of FBOs
On the part of FBOs and SHFs, their challenges include;
Difficulty in reaching consensus as a group
Poor transportation network and high cost of transport
Lack of resources to pay for inputs and other serves
Non-compliance to the principles of the SFP
Inability to access credit facilities
Group sustainability
High interest rates
The opportunity however is that, farmers are very willing to come into contractual
agreements with prospective buyers including the caterers supplying to the SFP. They also
think that there is room for more financial institutions in the district and if that is done,
services to them will improve.
5.4.3 Challenges and Opportunities of NGOs
NGOs operating in the district are also confronted with some challenges which affect their
activities and their contribution to the agricultural value chain and the SF supply chain for
that matter. They include the following;
High illiteracy rate of the farmers they deal with
High cost of equipment
Majority of farmers are not organized into groups
Those farmer groups that exist are not able to coordinate their own activities
Banks are not able to meet the demands of all groups they link to them
The farmers do not have storage facilities
There is a high default rate among farmers who receive credit facilities from banks.
They also identify the following as opportunities;
Farmers have the capacity to build community warehouses
The banking sector is getting more competitive and farmers can exploit that.
NGOs have organized capacity building programs which farmers can take
advantage.
Stakeholders are demanding more accountability and forming more groups which
will help strengthen governance issues.

6 CHAPTER SIX: CONCLUSIONS AND
RECOMMENDATIONS
6.1 Conclusion
Barring all odds, the GSFP has been resilient over the years since its introduction in the
district with coverage increasing steadily to a near 100% coverage in the words of a regional
monitor of the program. School enrolments have shot up with admissions taking place
throughout the academic year which is unprecedented in the records of the Ghana
Education Service (GES). One can therefore say on authority that the objective of the GSFP
to increase enrolment and retention is already being achieved in the Nadowli Kaleo district.
The main foodstuffs used are also almost all grown in the district by the smallholder farmers
in medium to large quantities except that caterers are not buying directly from them as
envisaged in the concept of the SFP. Despite the unfriendly pre-financing policy associated
with the SFP, most caterers have endeavored to regularly deliver to the program and in
good quality too.
6.2 Recommendations
Based on the challenges of the various actors and the opportunities that exist for
improvement, we make the following recommendations which will go a long way to
improve the implementation of the SFP in the district and beyond;
The SFP secretariat should be decentralized to the district level with a full time
employee responsible for the planning, implementation, coordination and
monitoring of all SF related activities instead of the current arrangement where
Local Government staff at the DAs with very busy schedules, are tasked with the
responsibility of running the program at that level.
In order to deal with the problem of delayed release of funds to the DAs for payment
to caterers, DAs should find alternative funding sources to pre-finance the caterers
pending the payment by central government.
The procurement and contractual process should be more transparent and should
strictly follow the principles of the SFP which requires caterers to be present all
times to supervise and ensure quality in the final product delivered to the children.
Supervision on the caterers should be intensified as many of them abandon their
responsibilities to the cooks they engage.
Caterers should get organized into groups through which some standards and ethics
of their profession would evolve but also serve as a platform for learning. Such
associations will also facilitate their access to credit facilities through linkage to
FBOs and SHFs.
There should be flexibility in following the menu to allow for the inclusion of other
food crops which may seasonally available.
The SFP should provide standard measurements for all food items that go into the
food preparation process to ensure that all children across the district benefit
equally.

The DA should guarantee for the caterers they recruit to access loans from the
financial institutions to pre-finance the SFP.
All caterers and farmers should be trained on keeping records on their activities to
be able to track leakages and losses.
SHFs should also be assisted to access mechanization services and probably pay after
harvesting.

7 CHAPTER SEVEN: ACTION PLANNING
7.1 Supply Chain Governance Analysis, including GfE elements
Table 7.1.1 Supply Chain Governance Scores
Criteria Score (as weak, fair, good or strong)
Explanation
1 Level of formal cooperation or information sharing among actors
Weak Little knowledge about SF issues and so did not know about roles
2 Existence of formal contacts among actors
Weak
Farmers’ currently still wasting away because there were no contacts and lack of information
3 Level of traceability of produce/foodstuffs to producers
Weak There are no formal relationships between caterers, traders/suppliers and farmers
4 Level of quality control
Fair
Poor Storage facilities and pest infestation while some of the chemicals are dangerous
5 Membership and functionality of associations, if any (e.g. assoc. is able to represent members and establish agreements with other actors)
Fair FBOs are organized and have good leadership while caterers are not
6 Access to information, public facilities and decision making structures to make better informed choices
Weak Structures and relationships have not been well established
7 Level at which opportunities for quality improvements and requirements regarding inclusive business (employees, smallholder participation) exist
Good There are platforms like school PTAs and SMCs sharing for improvement can take place.
8 Existence of standards and/or regulation
Good
MOFA educates farmers on processing and storage while a few caterers have also received training on

ensuring standards
9 Enforcement of standards and regulation
Fair No sanctions in place for those who flout the standards

51
7.2 Supply Chain Constraints and Opportunities Analysis and Action Planning
This section of the report is the outcome of responses from a District School Feeding Stakeholder validation workshop. During the workshop,
actors present who were mainly caterers, small holder farmers and representatives of FBOs, the District Directors and representatives of the
GES and MoFA, staff of the Ghana School Programme Regional Secretariat and the District Assembly together with SNV’s Programme Advisors
and a team from the Local Capacity Building Organization discussed in plenary sessions the constraints around the SFP that actors would need
address as well as some existing opportunities that can be tapped for the successful implementation of the programme. The workshop also
identified appropriate actions to be taken to address the challenges of the SFP, assigned responsibilities to specific organizations and
institutions and set timelines within which action should be taken. Table 7.2.1 below presents the details of this session.
Table 7.2.1 Supply Chain Constraints and Opportunities Analysis and Action Planning
Objectives Constraints/Challenges Opportunities Actions/Solutions Responsibility Timelines Resources
1 Food quality improvement(from a nutrition perspective)
Nutritive content of food in some communities suspect
Active GHS & GES monitoring
Intensify monitoring of SF
Encourage community/parents to provide in-kind or cash support
Nutrition Department (GHS), WIAD (MoFA)
Immediately Funds
2 Food safety improvement(from a health perspective)
Cooking in some areas done under unhygienic conditions
Active GHS & GES monitoring
Intensify monitoring of SF
Encourage communal labour for clean-up of school environment
Partner available WASH in Schools initiatives
Nutrition Department (GHS)
Immediately Funds

Objectives Constraints/Challenges Opportunities Actions/Solutions Responsibility Timelines Resources
3 Inclusion of local farmers
Lack of functional MSHP
Inability of caterers to make prompt payments to farmers who are unable to offer long term credit sales
Emergence of PGHGSF project
increased interest of governments and development partners to contribute to:
o farmer inclusion in HGSF
o availability of lessons from interventions from other countries and regions, etc.
Facilitate SF MSHP
FBO/Caterer matchmaking
Facilitate access to credit for actors
SNV, DA/DIC, MoFA, GSFP, Other NGOs
Immediately Funds and Technical Expertise
4 Timely release of funds
Irregularities/delays in payments to caterers
High demand on public funds
Lack of dedicated SF fund from public purse
Donor/NGO interest
Advocacy at district and national level for dedicated funds
Continue advocacy
SNV, GSFP, Caterers Associations, Other NGOs.
Immediately
5 Improving price Limited public funds Donor/NGO Stakeholders to SNV, GSFP, Now and

Objectives Constraints/Challenges Opportunities Actions/Solutions Responsibility Timelines Resources
per ration interest
Commitment of government
continue to persuade government
Caterers Associations, Other NGOs,
on-going
7 Improve information flow among supply chain actors
Caterers:
Actors, especially caterers not communicating their concerns with appropriate office & vice versa
Supportive MA/DA
Link actors through common platforms
GSFP, DIC, NGOs
Now and on-going
FBOs:
Irregular information flow (e.g. on improved seeds, market access etc.)
Irregular visits by Extension Agents
Presence of district MOFA
Linking FBOs up with District Desk Officer and MoFA
FBO leaders, MOFA, SNV.
Now and on-going
8 Improve information technology to link up supply chain actors
Poor communication networks in villages
Availability of community radio
Presence of mobile networks with coverage in the communities
Design radio programs for FBOs, caterers etc.
Use of new mobile networks
FBO leaders, MOFA, SNV.
Now and on-going
9 Improve business and management capacity of supply chain actors
weak business skills of caterers and farmers
Weak organizational capacity of caterers
Supportive DA/MA
Emergence of PGHGSF project
Facilitate organizational strengthening of FBOs and caterers
GSFP, DIC, NGOs
Now and on-going
Funds and Technical Expertise

Objectives Constraints/Challenges Opportunities Actions/Solutions Responsibility Timelines Resources
and FBOs
Misunderstanding arising from lack of record keeping on the part of caterers and suppliers/farmers
Undertake business skills training in recordkeeping, negotiation etc.
Caterers pool resources to undertake bulk purchases
FBOs undertake bulking to ease supply and competitive pricing
10 Improve access to finance by supply chain actors
Inadequate access to loans
High interest rates on commercial loans
Presence of microfinance NGOs and public microfinance (MASLOC), rural banks
DA and Caterers Association negotiate with MASLOC for financial assistance
Build business skills (including record keeping) of actors to access loans
Facilitate access to credit
FBO & caterer leaders
MOFA reaching out
SNV facilitation
Now and on-going
11 Improve Inadequate storage Availability of DA Pursue DA for DA, MoFA, Now and Funds

Objectives Constraints/Challenges Opportunities Actions/Solutions Responsibility Timelines Resources
infrastructure to support supply chain actors in terms of storage and haulage of food stuffs and farm inputs
facilities for keeping food stuffs
Poor roads to facilitate easy haulage of foodstuffs
Common fund
increased interest of governments and development partners to contribute to:
o financing for improved storage facilities, quality regulations, etc.
use of some of common fund for central storage
Lobby DA/MA to rehabilitate roads
Provide technical assistance in the construction of storage facilities
NGOs on-going
12 Ensure contracts and compliance are established among supply chain actors
Breech of business contracts on the part of some actors
Dishonoring of verbal contracts between suppliers/ farmers and caterers
Emergence of PGHGSF project
Organize training on use and compliance of business contracts for supply chain actors (traders, farmers, caterers, input dealers)
Enforcing the use of written contracts
GSFP, DIC, SNV Now and on-going
13 Reduce transaction costs
High cost of foodstuffs as
Pre financing by DA/MA using
Exemption of caterers in rice

Objectives Constraints/Challenges Opportunities Actions/Solutions Responsibility Timelines Resources
between actors and stages of the chain
caterers purchase from suppliers on credit basis
Many caterers store and prepare food far away from school premises
NAFCO rice costs very high in rice producing districts as compared to local market prices
internally generated funds, were applicable
Locating foodstuff store and kitchen on school premises to remove transport costs of prepared food
producing regions from NAFCO supply

57
8 APPENDICES
Appendix 1: FBOs and their Membership and Activities
# FARMER BASED ORGANIZATION M F TOTAL ACTIVITIES
1 Suntaa Sunbaala Coop.
Farmers/Marketing society 2 22 24
P, S, Ps, SM.
2 Suntaa Nuntaa Farmers Ass. 3 26 29
3 Lambuuri -N-Maarong 14 7
P, S, SM, TA
4 Sagdiibu Farmers 4 - 4 P, SM
5 Nadowli Multi-purpose Farmers - - - P, B, S, SM, TA
6 Numbu Group 11 4 15 P
7 Kahong Batung Hukundi 17 14 31 P, S, N, SM, TA
8 Songbaala 18 4 22 P, S, N, SM, TA
9 Angaanseo - - 34 P, N, SM, TA
10 Takpo soyabeans - - 9 P, S, N, TA
11 Booduori farmers 6 4 10 P, T, SM
12 Kandanbongbu - 32 32 Ps
13 Nyanga-Yiri Langbuuri Agro-
forestry 9 12 21
P, S, SM
14 PULI FARMERS ASS. 21 - 21 P, S, SM, TA
15 PROGRESSIVE FARMERS 12 4 16 P, S, SM, TA
16 SEREKPARE FARMERS GROP - - 9
17 DATUAYIRI DRY SEASON
GARDENERS 5 7 12
P, S, SM, TA
TOTALS 122 136 310
P=Production, B=Bulking, S=Storage, T=Transport, Ps=Processing, N=Negotiation, SM=Sale/Marketing,
TA=Technical Assistance
Source: SAVE-Ghana Survey, 2013

Appendix 2: LCB Work Plan for the Baseline Study & Supply Chain Analysis
No Activity Responsibility Target Group Outputs Timeline Supervision
1 SAVE-Ghana
team meeting
Kingsley Kanton 5 member
implementation team
Tasks properly
assigned/
shared among team
members
13th
May,
2013
Alima
2 Desk study Boniface Nyewie 1. D/A
2. MoA
Secondary
data/information
gathered on supply
chain and analyzed
9th
-10th
May 2013
Kingsley
3 Orientation
for data
collectors and
data entry
staff.
Boniface Nyewie
Zack Savei
1. Daniel Kanton
2. Ussif Sibor
3. Blay Luri
4. Siita Kodima
5. Bawa Peter
6. Latif
7. Sakina
8. Comfort
Tommie
Data collectors
understand the tools
and are able to
administer them
through a test on the
field
15th
May,
2013
Alima
4 Initial
stakeholder
consultation
meeting
Lead:
Boniface Nyewie
Support :
Zack Savei
Kodima Siita
1. District
Assembly
2. Ghana
Education
Service
3. MOA,
4. NGOs in Agric
5. NAFCO LCBs
6. Financial
institutions
7. Agro Input
dealers
Support built for the
project from all
stakeholders
16
th May,
2013
Alima
5 Data
collection
Daniel Kanton
Ussif Sibor
Blay Luri
Bawa Peter
Siita Kodima
Latif
1. FBOs,
2. Caterers,
3. Traders,
4. MOA,
5. NGOs in Agric
6. NAFCO LCBs
7. Financial
institutions
8. Agro Input
dealers
Data collected for
both baseline and
supply chain
17th
-23rd
May, 2013
N/A
7 Data entry Sakina
Comfort Tommie
1. DA
2. MOA
Data entered
successfully and
audited
20th
– 25th
May 2013
Boniface
8 Data analysis Boniface Nyewie
Sule Dintie
1. DA
2. MOA
Data analysed for
report writing
27th
May
2013
Kingsley
9 Report writing
& Submissions
Boniface Nyewie
Sule Dintie
N/A Draft report
submitted on
27th –
31st
May, 2013
Kingsley &
Alima

baseline and supply
chain
10 Stakeholder
Validation
Workshops
Boniface Nyewie 1. FBOs,
2. Caterers,
3. Traders,
4. MoFA,
5. NGOs in Agric.
6. NAFCO LCBs
7. Financial
Institutions
8. Agro Input dealers
Stakeholders make
inputs into findings of
baseline and supply
chain study
4th
June,
2013
Alima
11 Submission of
Final Reports
Boniface Nyewie N/A Comprehensive
report submitted on
baseline and supply
chain
5th
June,
2013
Kingsley and
Alima
Appendix 2: Terms of Reference (TOR) for the Assignment
TERMS OF REFERENCE
LOCAL CAPACITY BUILDERS SUPPORTING THE DISTRICT BASELINE DEVELOPMENT & SUPPLY CHAIN
STUDY & ANALYSIS
FOR PROCUREMENT GOVERNANCE FOR HOME GROWN SCHOOL FEEDING PROJECT IN GHANA
MARCH 2013
1. Background
The Procurement Governance for Home Grown School Feeding (PGHGSF) project is a four-year
initiative funded by the Bill and Melinda Gates foundation (BMGF) that is aimed at securing
smallholder participation in Home Grown School Feeding programs in Mali, Kenya, and Ghana.
In Ghana, the project team is working in close collaboration with the Ministry of Local Government
and Rural Development (MLGRD), the Ghana School Feeding Program National/Regional secretariats,
implementers of farmer-to-market access programs, local partners, farmer based organizations,
District Assemblies and the private sector, with the ultimate goal of enhancing smallholder farmers
(SHF) access to the Ghana School Feeding Program as a structured market.
It is expected that the project will enable 10,000 smallholder farmers (made up of at least 30%
women) in 20 districts to directly derive increased and stable incomes through effective participation
in Home Grown School Feeding programs that use open, transparent, and accountable procurement
practices in their implementation, hence affecting all stakeholders along the supply chain.
Districts are being introduced in a phased approach, starting with 5 in the first year as follows– Ga
West in Greater Accra Region, Karaga and East Gonja in the Northern Region and Sissala East and Wa
East in the Upper West Region. In the second year (2013), 10 additional districts (which constitute the
coverage for this ToR) are participating and include:
Ga East and Ada East in Greater Accra Region;
Bunkpurugu Yunyoo, Kpandai, Tamale Metro and Tolon in the Northern Region;

Nadowli-Kaleo and Wa Municipal in the Upper West Region and
Kassena Nankana and Builsa North in the Upper East Region
The project aims at the following main objectives:
1. To improve the HGSF procurement process and strengthen the capacity of all actors to ensure that
smallholder farmers have access to HGSF program structured market opportunities.
2. To enhance the supply chain governance of HGSF programs to ensure effective, transparent and
accountable delivery of products across the supply chain.
3. To develop effective and participatory mechanisms for increased accountability by and for the
program’s stakeholders
4. To ensure effective monitoring and documentation of lessons learned for broad dissemination to
increase the likelihood of replication/scaling up of best practices
To achieve the above objectives, especially objectives 1 and 2, the services of Local Capacity Builders
(LCBs) are requested to develop a comprehensive Baseline and Supply Chain Analysis for school
feeding in each of the 10 additional districts.
The purpose of this Terms of Reference (ToR) therefore, is to describe the conditions and
responsibilities of the Local Capacity Builder (LCB) to be contracted by SNV to undertake the Baseline
development and Supply Chain Analysis. This ToR thus serves as the fundamental guideline for the LCB
in the execution of this assignment. 2
. Baseline Development
Information gathering is required to produce relevant baseline information and share lessons learnt
from the project. Thus the baseline data collection and analysis are fundamental to inform project
implementation and to measure the progress made at the end, in each of the following key thematic
areas of the project:
improvement of the school feeding procurement processes,
enhancement of the Home Grown School Feeding supply chain and
promotion of good governance with the development of social audits
The PGHGSF team has started the collection of some data as part of district entry activities and
requires the support of local development organizations (Local Capacity Builders) to complement the
work done, leading to the development of comprehensive baselines for each of the targeted 10
districts.
Using a set of questionnaires/ tools developed by SNV, the LCBs will collect primary baseline data from
key actors that include Farmer Based Organizations (FBOs), Caterers under the Ghana School Feeding
Program, Traders/ suppliers of the caterers, District Assembly represented by the desk officer and
District Directorate of MOFA and any relevant NGO.

In each district the questionnaires will be administrated to cover all caterers and traders/suppliers
involved in school feeding. In the case of the FBOs an assessment should be done with the district
actors to ascertain how many FBOs to interview in each district.
After data collection, the LCB is to enter field data into a data entry tool developed by SNV and carry
out data analysis and produce a draft baseline report which shall be subjected to stakeholder
validation and action planning, following which a final report shall be produced at the end of the
assignment.
3. Supply Chain Analysis
The second objective of the project is to enhance supply chain governance in School Feeding. The
improvement of the supply chain should lead to more sustainable and cost effective solutions when
combined with clear and effective governance mechanisms. The inclusion of smallholder farmers is an
essential part of the expected improvement.
A main activity required to achieve this objective is the analysis of existing supply chains for School
Feeding in the intervention districts.
The assignment thus involves undertaking activities captured under the following three phases as
shown in the methodology in Appendix I:
The supply chain study, to obtain data about the real situation of the chain, its actors and their
relationships
The supply chain analysis, based on the data from the study
The elaboration of an action plan, based on prioritization of constraints and opportunities
during the analysis.
In executing this assignment, the LCB shall be expected to collect both primary and secondary data
from relevant stakeholders in the target district, including among others (and if available); GSFP Desk
Office, the District Directorate of MOFA, World Food Program (WFP), National Buffer Stock Company
Limited (NAFCO) and its Licensed Buying Companies (LBCs), local financial institutions, caterers, FBOs,
CSOs, local foodstuff contractors, input suppliers and key informants. It is also expected that a
technical analysis of the data would be done, presented and discussed for validation with the relevant
district stakeholders to determine with them an action plan to improve the supply chains towards
improved inclusion of smallholder farmers.
4. General Management and Coordination of the entire assignment
SNV, after holding an orientation meeting with the LCB on the assignment, will support the LCB to take
off by organizing an initial stakeholder consultation meeting, informing the district authorities about
the assignments to assure their buy-in for a smooth implementation of the assignment. It is also for
the purpose of ensuring their orientation, capacity and involvement in the specific steps of this
assignment.
The LCB shall work closely with the responsible project team member in the region and is expected to
share with her/him on a regular basis (weekly), briefings on progress made. SNV shall support the LCB
by sponsoring the workshops and assist in contacting people and organizations to be
interviewed/surveyed.

5. General Scope of Work
The LCB may apply to cover at least two of the four districts in the Northern Region, two each in Upper
West Region, Upper East Region or Greater Accra region.
Key respondents and data collection tools
As outlined above under Baseline development and Supply Chain Analysis, the respondents shall
include (but not limited to):
1) FBOs
2) Caterers
3) Local foodstuff contractors i.e. traders and suppliers
4) the District, represented by the GSFP Desk Office
5) MOFA, represented by the District Agricultural Development Unit (DADU) plus other relevant NGOs
operating in the district (e.g. WFP, PCD)
6) Local financial institutions
7) NAFCO LBCs
8) Agro input dealers
9) Any available key informant(s)
In addition to the first five respondents above from whom both baseline and supply chain data is to be
collected, it is recommended that the LCB collects mainly supply chain specific data from local financial
institutions, NAFCO and its Licensed Buying Companies (LBCs), agro-input dealers and any available
key informant(s) [respondents 6-9]. With the application of appropriate sampling methods, the LCBs
will collect primary data from these key actors in the district(s). Generally, a mix of data collection
methods – individual interviews including key informants and focus group discussions may be used.
6. Reporting and Key Deliverables
The LCB will report at the regional level to the Project Advisor and all activities will be coordinated at
the national level by the Project Country Coordinator.
After selection the LCB will submit an Activity/Work plan with dates for the assignment (within 5 days
of confirmation of selection and before contract is signed) and which may include (but not limited to)
the following major activities.
1) Desk study
2) Orientation for data collectors
3) Stakeholder consultation
4) Field data collection
5) Data entry and analysis
6) Production of first draft baseline and supply chain reports
7) Review of draft reports
8) Stakeholder validation workshop at the district level
9) Finalization of baseline and supply chain reports
Concerning the reports, the LCB shall deliver as follows:

Baseline Development:
The first draft report per district that brings out an analysis of the baseline information should
be presented and discussed with the SNV team. The report should be as comprehensive as
possible and should clearly spell out findings, analysis and recommendations
Second draft report incorporating inputs and comments drawn from the SNV Team presented
to a District Stakeholders at a Validation workshop to be organized by SNV.
Final report, which incorporate all inputs, comments and action points agreed on by the
project team and stakeholders in the district.
Supply Chain
The first draft report per district that captures elements under each of the six steps of Phase A
(Supply Chain Study) described in the methodology (Appendix III) should be presented and
discussed with the SNV team. The report should be as comprehensive as possible and should
clearly spell out findings, analysis and recommendations.
Second draft report incorporating inputs and comments drawn from the SNV Team presented
to a District Stakeholders at a Validation workshop to be organized by SNV.
Final report, which incorporate all inputs, comments and action points agreed on by the
project team and stakeholders in the district.
7. Schedule of Deliverables
Upon selection of the LCB, key deliverables shall follow the time frames suggested:
A work plan with timelines shall be presented within 5 days of confirmation of selection and
prior to signing the contract
First draft Baseline and Supply Chain reports shall be presented to SNV for comments from the
project team within 25days of the assignment.
Final draft reports incorporating approved changes and action points by stakeholders shall be
submitted within 35 days of the assignment. (It is recommended that the reports shall not
exceed 20 -25 pages, plus annexes )
The study, which is expected to commence in April 2013, is to be completed in 5 weeks.
9. Days required for the assignment
The recommended billable days for the assignment are 18 days per district as detailed in the
table below;
No Activity Days
1 Desk Study 1
2 Orientation of Data Collectors 1
3 Stakeholder Consultation 1
4 Field Data Collection 5
5 Data Entry and 2

6 Production of first draft
baseline and supply chain
reports
2
7 Review of draft reports 2
8 Stakeholder validation
workshop
2
9 Finalization of baseline and
supply chain reports
2
10 TOTAL 18
9. Qualification and experience required
The assignment will be awarded to the most competent LCB based on its track record, availability and
extent of creativity and knowledge of the subject matter and district terrain. Considering the quantum
of work to be done on the field, the LCB must assure the availability of at least 2 staff/resource
persons fully responsible and constantly available for the assignments to be undertaken. The
engagement of interns is strongly recommended.
It is expected that the LCB team shall possess the following competences and skills:
Familiarity with the Districts being applied for
Good representation in the district with an office or a contact person with good communication
skills
Knowledge of farm-level organization and organizational development
Competence in food crop supply chain/value chain development
Inclusion of a supply chain expert in the team
Good consulting and coaching skills
Having an operational team capable to deliver within the time frame required
Good experience in data collection, entry and analysis
Good skill in community mobilization and in partnership development with local Authorities
Excellent written and oral communication skills in English
Appreciable knowledge about the Ghana School Feeding Program will be an advantage
Having sufficient number of trained staff with competence in M & E
10. Pre-selection Requirement
Interested LCBs may submit brief proposals (not more than 15 pages) to SNV on or before Friday April
5, 2013.
The proposal shall indicate the districts being applied for and shall spell out the LCB’s understanding of
the assignment, a statement of capacity, a work plan and budget in Ghana Cedis.
The LCB may send the required particulars to the address of this Terms of Reference or call the
appropriate telephone number for any clarifications.

Appendix 4: List of Caterers
NO NAME OF CATERER SCHOOL CONTACT NUMBER
1 CELESTINA PUOTIERE KARIYIRI WAP/KG 0242021754
2 ADOLEE ENTERPRISE ZAMBOGU R/C PRIM/KG 0242507042/0203222565
3 BY CATERING SERVICES OMBO L/A PRIM/KG 0244152155
4 SALIA PATIENCE JANGUASI -
5 GRACE BOMANSAAN KALEO R/C PRIM/KG 0246712625
6 BOOKPIERE VIDA KALEO R/C PRIMARY -
7 CLOTHILDA KANYI LOHO PRIMARY 0206687370
8 HELLEN SUMBAWERA KAYIRE D/A PRIM/KG 0248858446/0247808758
9 FATI SALIFU JANG D/A PRIMARY 0543846811/02448808891
10 KANDEE REBECCA KUANG R/C PRIMARY -
11 AGNES B. BOMANSAAN NARO D/A PRIM/KG 0243810708
12 ABUBAKARI AYISHETU KALEO L/A KG 0545185430/0547743656
13 SAAN REBECCA KALEO BAPTIST KG 0547962139
14 AYISHETU HAMIDU KALEO L/A PRIMARY SCH. 0248538678
15 MARY SOHA LOHO TENDAABA -
16
SALAMATU CATERING
SERCIVE
17 GAANYE GERTRUDE KONNI PRIM/KG 0209384568/0247485761
18 MARCELLINE SUGLO TANGASIA PRIMARY/KG 0209029867/0207246786
19 ANTAABU STELLA CHARIKPONG PRIM/KG 0246965810
20 GAGLA ALICE TANDUORI PRIMARY 0245284817
21 DATUAH THERESA DAPOPARI PRIMARY/KG 0208864908
22 DIEDONG ASIBI YIZIRI PRIMARY/KG 0206660231
23 PATRICIA DAKURAH GBERUNG PRIMARY/KG 0206767137
24 WONGERE JANE KPAZIE PRIMARY/KG 0242756286
25 UBAIDATA IDDRISU PENETOBO KG -
26 ALIMA AHMED CHANGU R/C PRIM. & KG -
27 LAWRANCE GOLLMA NATOR R/C PRIM. SCH. -

28
HAWA DAPILAA
CATERING SERVICE LONKORO E/A PRIM./KG -
29
FRANCISCA
KANGAAKPLENG BAANUORI KG -
30
FRANCISCA CATERING
SERVICE -
31 AYISHA SULEMANA TAKPO R/C PRIM/KG -
32 AFUSA ABUBAKARI NYIMBALE L/A PRIM/KG -
33 BASIMBU DIANA NEGUO R/C PRIM. & KG -
34 MINATA IBRAHIM
TAKPO D/A PRIM/KG
0243360735
35 MARY ZANGU NADOWLI R/C PRIMARY B -
36 KAMPEGLU ELIZABETH NADOWLI DA KG -
37 MARY KARAWONG NADOWLI D/A PRIMARY -
38 JANE WONGERE KPAZIE PRIMARY/KG 0242756286
39 ZANGU COMFORT NADOWLI R/C PRIMARY A -
40 ANSGNAA ISAAC SEREKPERE L/A PRIM./KG 0243031945
41 SARAFINA ANKURO PIREE R/C PRIMARY/KG 0241093044
42 NUMBU LAWRENCIA GOLI PRIMARY 0261232913
43 TUONFIRIBO LINDA TANGAZIA D/A PRIMARY 0208767352/0207372556
44 TALATA ANATABA PAPU R/C PRIMARY/KG 0209313544
45 ZUWERA ADAMS DUONG PRIMARY /KG 0261955550
46 TALATA L. ANATABA -
Appendix 5: List of FBOs and Contacts
NO NAME OF FBO LOCATION CONTACT NUMBER
1 SUNTAA SUNBAALA COOP.
FARMERS/MARKETING SOCIETY
CHARI-SOMBO 0209384718
2 SUNTAA NUNTAA FARMERS KPAZIE 0547650088
3 LAMBUURI -N-MAARONG SEREKPERE
4 SAGDIIBU FARMERS SEREKPLERE 020340538/0205103921
5 NADOWLI MULTI-PURPOSE FARMERS NADOWLI -
6 NUMBU GROUP - -
7 KAHONG BATUNG HUKUNDI KAABOGU 0201397673
8 SONGBAALA CHARI SOMBO
9 ANGAANSEO - 0247805298
10 TAKPO SOYABEANS TAKPO -
11 BOODUORI FARMERS KALEO 0541585872
12 KANDANBONGBU TIBANI 0245861417

13 NYANGA-YIRI LANGBUURI AGRO-
FORESTRY
NYANGAYIRI 0546131214
14 PULI FARMERS ASS. PULI -
15 PROGRESSIVE FARMERS ASSOCIATION - -
16 SEREKPARE FARMERS GROP SEREKPARE -
17 DATUAYIRI DRY SEASON GARDENERS DATUOYIRI -
Appendix 6: List of Other Respondents and Contacts
No Individual/Organization/Institution Contact
1 Mary Galyuoni (Trader) -
2 Florence N (Key Informant) 0208914414
3 Association of Church Development Projects (ACDEP) 0200766497
4 Professional Network North (ProNet North) 0247434482
5 World Vision International -
6 MoFA 0243703267/0549291910
7 District Assembly (DDO) 0209373329/0248402788
9 REFERENCES
WFP (2012) Two Minutes to Learn about School Meals. Organization’s Fact Sheet. Accessed
from www.wfp.org on 9th May, 2013
WFP (2007) Home Grown School Feeding field case study: Ghana. Accessed from
www.wfp.org on 9th May, 2013
SNV (2012) Procurement Governance: Strengthening Systems to Ensure Smallholder
Farmers Benefit from Structured Demand, HGSF Fact Sheet-Ghana.
Nadowli District Assembly (2012) District Profile and Analysis of the Current Situation
WFP (2009) Home-Grown School Feeding: A Framework to Link School Feeding with Local
Agricultural Production


