1 Durham University 2 University of Leeds 3 Centre for Ecology and Hydrology Bangor 4 Macaulay Land Use Research Institute 5 University of Aberdeen
For further information please contact: Joint Nature Conservation Committee Monkstone House City Road Peterborough PE1 1JY www.jncc.defra.gov.uk This report should be cited as: Worrall, F., Chapman, P., Holden, J., Evans, C., Artz, R., Smith, P. & Grayson, R. 2011. A review of current evidence on carbon fluxes and greenhouse gas emissions from UK peatland. JNCC Report, No. 442. In Memoriam For Mark Crick, our colleague from JNCC, in recognition of all his valuable work that has contributed to this report and to nature conservation in the UK.
A review of current evidence on carbon fluxes and greenhouse gas emissions from UK peatlands
Fred Worrall1, Pippa Chapman2, Joseph Holden2, Chris Evans3, Rebekka Artz4, Pete Smith5 and Richard Grayson2 December 2010
1 Durham University 2 University of Leeds 3 Centre for Ecology and Hydrology Bangor 4 Macaulay Land Use Research Institute 5 University of Aberdeen
A review of current evidence on carbon fluxes and greenhouse gas emissions from UK peatlands
Summary This study considers the current evidence on fluxes of carbon (C) and greenhouse gases (GHG) from UK peatlands, including managed peatlands. Peatlands are here defined as deep peats as per the respective UK national soil surveys, and where management considers both land-uses (e.g. grazed) and land use changes (e.g. cessation of grazing) although this review has often been limited by the number of available studies which has meant that definitions have necessarily been viewed flexibly. The review takes two approaches in order to understand the carbon and GHG, firstly a Bayesian meta-analysis approach is used in order to combine studies; predict the probability that a management will result in an improvement in the C or GHG budget; and calculate and equivalent number of complete C and GHG budgets that the reviewed literature represents. The second approach is to use results from computer modelling in order to construct significant linear models for a range of peatland settings. The study was able to consider the following land uses: semi-natural; drained; drain-blocked; burnt; grazed; forested; bare and revegetated peatlands; cutover and restored; cut or mowed peatlands; and converted to agriculture. The meta-analysis and review show that not all modified peatlands are C or GHG sources just as not all “pristine” peatlands are net sinks of C or GHG. Equally, peatland restoration may not necessarily lead to a peatland becoming a net sink of C or GHG. The reason that many restoration or management interventions may not provide a benefit in terms of GHG is because the flux of CH4 is often a more important component of the C balance of restored peatlands when considered in terms of global warming potential even when, in terms of mass, CH4 losses are only a few percent (3-5%) of the net exchange of CO2 between the peatland and the atmosphere. Fluvial C fluxes also represent a significant part of the overall peatland C budget. In all systems the fluvial C flux will reduce the C sink associated with CO2 sequestration, and in some systems these fluxes may be sufficient to change the peatland from an (apparent) C sink to a net C source. Their role in GHG terms is dependent on their ultimate fate, which remains poorly understood. We can use this review to identify priorities with regard to which combinations of peatland type and management; and a research plan relative these knowledge gaps is provided in a separate document. The review enabled us to revise our estimate of the GHG flux from UK peatlands from a net source of 5.7 Mtonnes CO2 eq yr-1 to a net source of 3.72 Mtonnes CO2 eq yr-1.
A review of current evidence on carbon fluxes and greenhouse gas emissions from UK peatlands
Contents 1 Review rationale and introduction .................................................................................... 1
1.1 Introduction ................................................................................................................ 1 1.2 Carbon and Greenhouse Gas budgets for peatland sites .......................................... 2 1.3 Methodology .............................................................................................................. 6
2 Detailed review ............................................................................................................... 11 2.1 Use of peatlands in the UK ...................................................................................... 11 2.2 Spatial extent of peatland types and land-uses ....................................................... 12 2.3 Influence of land use on C and GHG fluxes from peatlands - field evidence ........... 17
2.4 Influence of land management on C and GHG fluxes from peatlands - modelling evidence ................................................................................................................... 42
2.5 Influence of other factors on C and GHG fluxes from peatlands ............................. 47 2.5.1 Atmospheric Deposition .................................................................................... 47 2.5.2 Climate change ................................................................................................. 49 2.5.3 Summary .......................................................................................................... 52
Restoration of cutover peatland.......................................................................................... 86
A review of current evidence on carbon fluxes and greenhouse gas emissions from UK peatlands
1
1 Review rationale and introduction
1.1 Introduction The purpose of this review is to examine the evidence, to date, on C and GHG budgets in UK peatlands under differing land management, with the aim of identifying the additional evidence required to generate UK emission factors for managed and restored UK peatlands. This will inform the development of a targeted research programme, which will identify the practical research required to supply this evidence. This assessment takes a number of approaches to assess the current state of knowledge. Firstly, the review pulls together information and conclusions from existing reviews, along with new material in the published and grey literature. We start by discussing the general principles of C and GHG budgets for peatland sites before briefly providing an overview of UK peat types and their typical management. We then synthesise reports on land management impacts on peatland C and GHG fluxes and budgets from the available research. Secondly, this approach is supplemented by a Bayesian meta-analysis that attempts to combine the results from published papers and reports in a single quantitative framework that enables relative gaps and importance of management types to be judged. Finally, the results from the literature are compared with results from computer models of peatland GHG and C flux. Peatlands cover only a small portion of the Earth’s surface, estimated at between 2% and 3% (Charman 2002; Gorham 1991), but they comprise a large accumulation of terrestrial organic matter, fixed from the atmosphere by photosynthesis. Peatlands are therefore important carbon (C) stores, representing up to one third (between 250 and 450 Pg1) of the world’s terrestrial carbon pool (Gorham 1991). Thus peatlands represent an important long-term sink for atmospheric carbon dioxide (CO2) (Gorham 1991; Roulet et al 2007) and have the potential to moderate concentrations of atmospheric CO2 (Moore et al 1998). However, many northern peatlands, including many in the UK (Holden et al 2007a), have been disturbed by drainage, agricultural improvement, peat cutting, afforestation, burning and increased atmospheric deposition. Disturbance can significantly alter C cycling within peatlands (e.g. Roulet et al 2007) such that peatlands can become a large and persistent source of carbon, both to the atmosphere as CO2 (e.g. Waddington et al 2002) and to aquatic ecosystems (Dawson and Smith 2007). There is increasing interest among national and regional agencies in protecting and restoring peatlands in order to conserve existing C stocks and to help mitigate climate change, which could complement and support current restoration for nature conservation. Restoration usually involves techniques to stabilise eroding surfaces, re-establish a suitable vegetation cover and raise and stabilise the water table, and hence encourage waterlogged conditions and wetland vegetation that will enable peat to form again. Research at the plot-scale suggests that restoration of degraded peatlands can reduce C losses to both the atmosphere (e.g. Tuittila et al 1999; Waddington and Warner 2001) and the aqueous environment (e.g. Waddington et al 2008; Holden et al 2007b). However, it may lead to an increase in methane (CH4) emissions (e.g. Waddington and Day 2007), at least in the short term. Methane is, over a 100 year time horizon2, a greenhouse gas around 23 times more potent than CO2 (Houghton et al 1995, Forster et al 2007). When accounting for this higher global warming potential (GWP), increases in CH4 emissions may reduce or even counteract C savings associated with peatland restoration. Although there is some evidence that restored peatlands emit more CH4 than degraded peatlands, there is considerable uncertainty as to whether restored peatlands become sinks or sources of greenhouse gases, when all gases are compared in terms of their GWP though some increases in GHG releases 1 One petagramme (Pg) equals one gigatonne Gt, which is 1015g. 2 The global warming potential of gases is assessed over a range of time windows that relate to their residence time in the atmosphere. Over shorter windows the GWP is larger.
A review of current evidence on carbon fluxes and greenhouse gas emissions from UK peatlands
2
may well be transient associated with the immediate period after restoration. In addition, water-borne fluxes of C (particulate, dissolved and gaseous forms) from peatlands are often not included in peatland GHG and C budgets (Worrall et al 2003). In addition to understanding gaseous C losses from peatlands, quantifying aqueous peatland C loss, and understanding of how much of this C becomes active as greenhouse gases, is, therefore, critical in determining C and GHG budgets for sites, and in understanding the potential of restoration to reduce C losses and greenhouse gas (GHG) flux (Worrall et al 2003). Throughout this review it has become apparent that there has been very little work on the C and GHG flux for some categories of land management or peatland types. Furthermore, research reviewed was often conducted using different experimental and monitoring techniques, which has complicated direct comparisons or up-scaling to a national level. This has implications for the scale of the research required to generate emissions factors that relate to a broad range of environmental conditions, and may limit the applicability of potential emissions factors generated at an early stage. This review has sought to identify the range of land covers, land uses, and peat conditions that affect peatlands in the UK. It has attempted to identify key changes in land use that affect UK peatlands now and are likely to affect peatlands in the future. For each land use or land use change the evidence available to support the provision of GHG emissions factors has been reviewed, and further work required to develop these factors identified. The evidence gap for each possible land-use or land-use change will be addressed in the corresponding section of the research programme land-use or land-use change addressed in the review
1.2 Carbon and Greenhouse Gas budgets for peatland sites A crucial aim of this study is to assess what information is available upon which to base emissions factors of peatlands across the UK. The present available emissions factors are discussed here and many of these are tier 1 emissions factors, i.e. they are not necessarily based upon information from the UK. Emission factors are emissions from a land-use at steady state and do not reflect a land-use change, i.e. they would represent a peatland that has reached a steady state of emissions and does not represent a transition between states or a management action upon land. For example, an emission factor is needed for afforested peatland, but it is not required for afforestation. However, it is not always clear in the literature whether studies are reporting a steady state emission or a transition and thus in this study both are considered and where possible the distinction is made. Carbon and GHG budgets of peatlands have generally been estimated by three types of method: Dating of peat accumulation: Dating methods give a rate of C accumulation in peatland systems (e.g. Tolonen and Turunen 1996) but cannot be used to estimate C losses in degraded systems unless an obvious eroded surface is present. Furthermore, the approach averages over long periods, typically tens to hundreds of years depending upon the particular dating technique, and therefore gives no indication of the temporal variation in C accumulation that may have occurred due to environmental change over shorter time periods. Although until the last few centuries environmental change may well have been slow enough for such approaches to record changes in accumulation this is less true with the rapid changes associated with anthropogenic influences. Therefore, this approach is not suitable for understanding the impact of land management change on the C budget and can only be used to provide “baseline” information to indicate the typical function of active, relatively unmanaged peatlands. Shorter term peat accumulation is sometimes indicated by changes in the peat surface relative to a fixed structure (e.g. cranked wire) but these
A review of current evidence on carbon fluxes and greenhouse gas emissions from UK peatlands
3
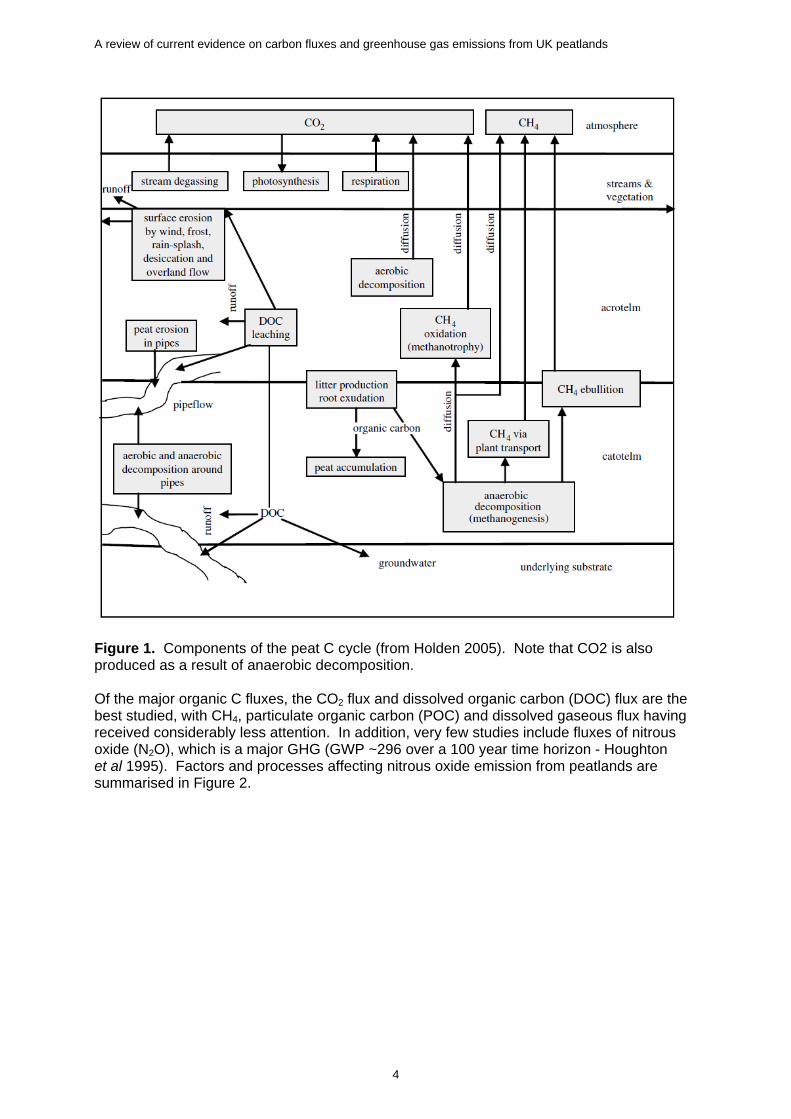
techniques often fail to capture the subtle impacts of carbon processing in lower peat layers, especially if they are anchored in the peat mass itself. Measuring accumulation or loss of peat material (e.g. Turetsky et al 2004): Studies looking at peat mass loss use reference points such as erosion pins or transects, or existing artificial structures such as the Holme Fen Post (see frontispiece), to observe changes in peat surface elevation over time. Another approach is to estimate loss using dated photographic evidence. Both accumulation and loss approaches based on measuring the peat surface rely critically on assumptions about the bulk density of the material lost, may fail to estimate other factors such as compression of peat correctly, and cannot estimate the impact of methane flux. They also cannot accurately partition peat loss between gaseous or fluvial pathways. Measuring C fluxes between the ecosystem and the atmosphere (Smith et al 2008a): The third approach is to calculate a present day C budget which is based on measuring/estimating fluxes of C and GHG with the atmosphere and fluxes of C to the fluvial system. The advantages of this approach is that it captures all types of peat C and GHG flux, within the limitations of measurement or experimental design, but the disadvantage is that sites must be measured more frequently to capture fully the temporal variability in the system, and is harder to integrate over long time periods. Figure 1 represents all key fluxes of C and the carbon-GHGs (excluding N2O) that need to be considered in order to calculate a C and GHG budget for a site and to determine whether it is acting as a C or GHG sink or source.
A review of current evidence on carbon fluxes and greenhouse gas emissions from UK peatlands
4
Figure 1. Components of the peat C cycle (from Holden 2005). Note that CO2 is also produced as a result of anaerobic decomposition. Of the major organic C fluxes, the CO2 flux and dissolved organic carbon (DOC) flux are the best studied, with CH4, particulate organic carbon (POC) and dissolved gaseous flux having received considerably less attention. In addition, very few studies include fluxes of nitrous oxide (N2O), which is a major GHG (GWP ~296 over a 100 year time horizon - Houghton et al 1995). Factors and processes affecting nitrous oxide emission from peatlands are summarised in Figure 2.
A review of current evidence on carbon fluxes and greenhouse gas emissions from UK peatlands
5
Figure 2. Schematic diagram of the N budget for a peat soil only and not considering catchment inputs once the water has left the peat profile (Worrall et al in review). In terms of mass, gaseous exchange between the atmosphere and the peat surface is dominated by photosynthetic fixation of CO2 from the atmosphere and by soil and vegetation respiration losses of CO2. The balance between these is known as the net ecosystem exchange (NEE) of CO2. The other significant gaseous loss of C to the atmosphere is CH4 which is produced via anoxic decay of the soil organic matter. However, as highlighted by Baird et al (2009), CH4 is often omitted from C budgets because it represents a relatively small proportion (<10%) of the total C budget. In addition, it is harder to measure and its production across all peatland types maybe spatially very variable. However, CH4 is a much more potent greenhouse gas than CO2 and it is possible for a peatland to be a net sink for C but at the same time to have a net positive radiative forcing (i.e. warming) effect on climate. The loss of C to the fluvial system should include: POC, DOC, and dissolved gaseous carbon (CO2 and CH4). However, most studies investigating the transfer of C between peatlands and the aquatic system only quantify the DOC flux, which is usually the dominant component of the aquatic flux (Dawson et al 2002). Gorham (1995) estimated that the DOC loss from all northern peatlands was about 20 tonnes C km-2 yr-1; however, this estimate was largely based on peatlands not typical of those in the UK. Furthermore, a complete aquatic C flux should include measurements of POC, DIC, dissolved CO2 and CH4 and CO2/CH4 degassing from the stream surface. Consideration of POC and CO2 evasion (i.e. gaseous release to the atmosphere from water) have found a significant increase the aquatic C flux from peatlands (Hope et al 2001; Dawson et al 2002; Billett et al 2004) and their inclusion may well determine whether a peatland is acting as a C sink or source. Furthermore, the POC flux from disturbed catchments may be substantially greater than in more pristine sites and so ignoring those fluxes may be result in very erroneous C budgets for peatland systems. For example, Pawson et al (2008) observed that 80% of the fluvial C loss was in the form of
A review of current evidence on carbon fluxes and greenhouse gas emissions from UK peatlands
6
POC in an eroding peat catchment in the south Pennines. However, as noted by Baird et al (2009), quantifying the impact of the fluvial flux from peatlands on climate change is very difficult because, in terms of radiative forcing, this C loss from the peatland only becomes important if it ends up in the atmosphere. While certain fluvial fluxes, such as dissolved CO2 and CH4, (Billett et al 2004; McNamara et al 2008) are likely to return to the atmosphere quite rapidly, the fate of DOC and POC are less clear. Their role in the GHG budget of a peatland should not be considered negligible; Worrall et al (2006a) observed a reduction in the DOC flux across an 11.4km2 catchment of 32% by mass and 40% by mass over an 818km2 catchment - this observed loss may have been due to loss to the atmosphere, but could also reflect flocculation and precipitation of organic carbon. If a large proportion of the C exported by streams from peatlands ends up in long-term storage whether as part of the in-channel, floodplain or estuarine and marine sediments then we may conclude that the peatland-stream-river-estuary-coast continuum is a net accumulator of atmospheric C. Alternatively, if a large proportion of the POC and DOC flux undergoes oxidation and is returned to the atmosphere it enhances the potential of peatlands to act as a source of GHG to the atmosphere, rather than a sink, of atmospheric C. It should be noted that the carbon, or GHG, budget measured for a managed peatland may reflect a transition from one management to another rather than an equilibrium position. Therefore, the benefit of peat restoration or changed management can be considered to be threefold. Firstly, the peatland could presently be a persistent net source of carbon as a result of ongoing processes (e.g. rising air temperature as a result of climate change) and a change in management or restoration could result in this process being slowed or halted in the long term, thus diminishing the source. Such a decrease represents a carbon saving that we can consider as an avoided loss. Secondly, there is a transitional stage where restoration, or other management changes, cause a difference in the state functioning of the peatland, and will alter the extent to which it is a net source of carbon or GHGs. This transitionary stage can be of carbon benefit due to both avoided losses and net gains of carbon. For example, this transitionary sink could be the period during which an eroded gully refills with redeposited peat (an avoided loss) or vegetation becomes established on bare peat (representing a new carbon pool and therefore a net gain of carbon). Thirdly, many studies have demonstrated that active, peat-forming peatlands accumulate carbon and provide long-term sinks for C, although not necessarily all GHGs Therefore, an intervention on a managed peatland could be a carbon, or GHG benefit, in a maximum of three ways - avoided loss, transitionary gain/transitionary avoided loss, and an almost perpetual or long-term gain of carbon over thousands of years.
1.3 Methodology In order to make the review systematic, we have used the following assumptions and definitions to constrain the scope of the study: 1. The soils of concern are peat soils where peats are defined as deep peats with an
organic layer of peat texture with an organic carbon content greater than 25% and thicker than 40cm depth which coincides with the definition used within the Soil Survey of England and Wales, or 50cm deep in Scotland (Hodgson, 1997). In mineral soils, changes in soil carbon are often indicated by changes in the percentage carbon content of the soil by weight. For highly organic soils such as peat the %SOC (soil organic carbon) does not change greatly under different
A review of current evidence on carbon fluxes and greenhouse gas emissions from UK peatlands
7
managements and the key determinants of the soil carbon stored is the depth and density of the peaty layer which represent a high and but not necessarily constant background of C storage. Changes in the carbon dynamics of peat soils are therefore indicated by the fluxes of C to and from the soil.
2. The study is not limited to just upland peat soils but includes lowland raised bog, fen
peatlands of all nutrient statuses (including wasted fen peatlands lacking a semi-natural vegetation cover) as well as upland and lowland blanket bog. All such peatlands are included regardless of current vegetation cover or management.
3. In geographical terms, this review considers data from the UK as a priority but also
considered data from Europe and North America, but data from the Arctic or which could be considered as coming from tundra were excluded. Literature is considered by the region from which it originates and where a study from outside the UK is considered then the location of the study is listed in the text.
4. The context in which peat soils are considered is not stationary, especially in the light
of climate change, but given the scarcity of studies it was decided not to discriminate on the grounds of age of the study.
5. The study reviewed across the range of land covers and ongoing land use types
affecting UK peatlands. Not all possible management types were considered, but the study attempted to capture the most prevalent or important land uses affecting peatlands.
6. A number of ongoing land covers and land uses were identified as high priority for
development of emissions factors, and evidence relating to the GHG and C flux from these systems was reviewed. Low priorities were not assigned because a specific land use had a very low spatial extent compared to others.
7. A range of potential changes in land use were also considered on the basis of their
likelihood to have an impact on GHG and C flux, and a number of key land use changes were identified as priorities for developing information on GHG and C flux.
8. Where data are not available for a widespread peatland management or land use
change, attempts have been made to consider the likely impacts on peatland GHG and C flux, based on an understanding of peatland function. Such areas have also been identified as priorities for addressing in the research programme.
9. Pristine and active peat-forming areas are included. It should be noted that ‘Pristine’
is here used to consider peatlands that are actively forming peat. The study further recognises that some peatlands may be under management which is appropriate to perpetuating peat forming conditions, but which are not, for reasons of external drivers, active peat forming areas. It should be noted that this does not coincide with habitat classification used in many national surveys.
10. The study focused upon the greenhouse gas and C budget of peat soils where the C
budget is defined as
42 CHdissCODOCPOCNERPPFC +++++= (i)
Where: Fc = the total C budget (tonnes Ckm-2 yr-1); PP = primary productivity (tonnes Ckm-2 yr-1); NER = net ecosystem respiration (tonnes Ckm-2 yr-1); POC= the annual flux of POC (tonnes C km-2 yr-1); DOC = annual DOC flux (tonnes C km-2 yr-1);
A review of current evidence on carbon fluxes and greenhouse gas emissions from UK peatlands
8
diss.CO2 = the annual flux of excess dissolved CO2 (tonnes C km-2 yr-1); and CH4 = the annual methane flux (tonnes C km-2 yr-1). Flux is defined as a mass of material (e.g. C) moving into or out of a soil over a defined period - typically one year. Export is defined as a flux per time unit per unit area. The sum of PP and NER is taken as the net ecosystem exchange (NEE) and studies that use this measure were included. In addition to C greenhouse gases (i.e. CO2, CH4), N2O is considered. Dissolved CH4 does appear in a few studies but it is rarely measured and where studied its flux is negligible even allowing for its GWP (Dinsmore et al 2010). The GHG budget will include the fluvial flux but only that proportion of the POC and DOC exports that is turned over to be released to the atmosphere as CO2 or CH4 - if the dissolved CO2 is calculated as the excess dissolved CO2 then it can be assumed to all eventually be released to the atmosphere. The GHG budget would then become
ONCHdissCODOCfPOCfRPPF DOCPOCCO 2422
++++++= (ii)
Where: FCO2 = the total GHG budget (tonnes CO2 eq.km-2yr-1); fx = the fraction of the export of component x that is turned over to the atmosphere in streams; all other symbols as defined above but with units as tonnes CO2 eq km-2.yr-1; and N2O = the annual methane flux (tonnes C km-2 yr-1).
11. The approach includes any study that considers any one of the above mentioned
components of the GHG and C budget (10) for any of the managements considered high priority or a pristine peatland - where pristine is as defined above under point nine.
12. Between studies, the exact definitions of each of these components of the budget
may vary and we have to rely on the published methodology and results of the individual authors and a critical assessment of data quality. The findings of any study are recorded as the magnitude and direction of any component of the GHG flux for any year of the study; the magnitude and direction of change upon management change.
13. All fluxes of all components are judged relative to the atmosphere, e.g. PP flux is
negative. Therefore, a net sink of greenhouse gases from the atmosphere is given a negative value. Note that fluvial fluxes can also be judged in the same way and are given a positive value as they are released from the peat soil into the environment.
14. Multiple years of any study are recorded separately. 15. For each land cover/management type, the review reports on the ability of current
data to provide a robust emissions factor to represent the impact of this land cover/management on peatland C and GHG flux. For all key transitions, the extent is considered to which these have been fully characterised to indicate the complete transition from one land cover/ management to another.
16. Results from the Durham carbon model (Worrall et al 2009) are viewed as a separate
analysis from the review of the literature. The meta-analysis exploits the method of Worrall et al (2010). The method of Worrall et al (2010) considers any study relative to any of the GHG pathways defined above (plus NEE whenever that is reported instead of PP or NER) and for any of the managements defined above. Equally, as with Worrall et al (2010) it is assumed, based upon the observations of
A review of current evidence on carbon fluxes and greenhouse gas emissions from UK peatlands
9
Worrall et al (2006a), that 40% of DOC export is lost to the atmosphere as CO2 (i.e. fDOC = 0.4 - Equation (ii)), but, because of lack of evidence to the contrary fPOC = 0. All the studies indicating transitions in land use that gave a definitive result were then classified to be an improvement or a worsening of the carbon and/or GHG budget, even if only within the lifetime of the study. An improvement is defined as occurring where net GHG or carbon emissions from the peatland to streams or atmosphere are reduced when compared to the previous land use and includes any examples where sequestration of carbon, or processing of atmospheric methane, is increased to give a negative flux of C or GHG. A worsening of the carbon or GHG budget occurs where net emissions of C or GHG from the peatland to streams or atmosphere increases. In the case of the components considered by this study we classified an improvement as: • soil respiration = decreased; • primary productivity = increased (thus net ecosystem exchange = increased); • methane emissions= decreased; • DOC = decreased; • POC = decreased; • dissolved CO2 = decreased. This means that for each management or land-use change, the contribution of each of the components of the C and GHG budget to changes in the budget can be identified. This contribution can be interpreted as ‘the probability of improvement’ in that component, e.g. of the 13 studies of soil respiration in relation to drain-blocking reviewed by this project that showed a definitive result, 12 showed a decline in the magnitude of the soil respiration. Following the method above, this result is classified as an improvement and suggests that there is a 92% (12/13) chance that the next site where drain blocking is used would lead to an improvement in that component of the budget. The meta-analysis approach then combines the studies considering the result from each study to show an increase, decrease or no change in the carbon and/or in the GHG budget. These increases, decreases or no change for carbon and GHG, are transformed into a beta distribution. The beta distribution is a probability distribution, which means it can be viewed as the probability that the next site to undergo that particular management, or change in management, would be a net sink of GHG or C. The beta distribution can be updated as new information and studies become available. Transforming data into a distribution not only means that it is possible to predict a probability of improvement but also the variance on that estimate, i.e. a measure of uncertainty. Furthermore, by combining information from studies of different uptake and release pathways, this approach can calculate the equivalent number of complete C or GHG budgets. This review is different from the approach presented by Worrall et al (2010) in two ways. Firstly, this study considers grey literature in addition to literature in peer-reviewed journals, and secondly, where studies have presented multiple years of data, the separate years are considered as distinct. This latter change in approach means that the study can capture inter-annual variation. In order to support the literature review, all available results of the Durham Carbon Model (Worrall et al 2009a) were examined in order to assess the impact of management upon the C budget of peat soils. The model estimates each of the important carbon flux pathways and relates these to changes in predictable drivers, for example, depth to the water table. The model has been developed and validated for two sites - Bleaklow and Moor House in the
A review of current evidence on carbon fluxes and greenhouse gas emissions from UK peatlands
10
South and North Pennines respectively. To make the assessment, the data were sorted by the management types that can be considered by the model (presence/absence of: burning, grazing, drainage, bare soil or forest plantation) and the predicted budgets were then assessed relative to these land management factors using altitude as a covariate. On the basis of the significant differences found (only those significant at the 95% probability of being greater than 0), linear models were constructed. Note that these linear models are derived independent of equations used in the model and are derived as if the outputs from the models were actually observed data; this is a recognised technique in hydrological modelling often referred to as minimum information requirement models (e.g. Quinn et al 2008). In total 4544 model runs were considered covering 1309km2 grid squares of the UK uplands where peat soil represented at least 10% of the soils in the grid square. The areas chosen covered the Peak District, Lake District, the Forest of Bowland (all England) and the Water of Cree catchment (Galloway, Scotland). Wherever possible this report quotes all budgets and export values (budget per unit area) in terms of CO2 equivalents (e.g. tonnes CO2 eq.km-2.yr-1) where the conversion to GHG warming potential (GWP) has been achieved by reference to Houghton et al (1995) and Forster et al (2007). However, because of the manner in which results are reported this conversion is not always possible and so the C budget, or export, is reported. Equally, reporting of GHG emissions from land us, land use change and forestry (LULUCF) is normally given under three separate components (CO2, CH4 and N2O - Penman et al 2003), but for clarity in this study we have expressed GHG budgets only as tonnes CO2 eq However, where GHG budget is given and sufficient detail was not available in the literature source to make a separation between CO2, CH4 and N2O then this review says so. As a rough conversion the C budget, or export, can be multiplied by 3.667 to give the equivalent flux of CO2; however, this will not indicate the impact of methane on the GHG budget, nor account at all for any N2O flux or the proportion of fluvial losses that are not released to the atmosphere.
A review of current evidence on carbon fluxes and greenhouse gas emissions from UK peatlands
11
2 Detailed review
2.1 Use of peatlands in the UK UK peatlands are used or managed for: agricultural purposes (crops and livestock grazing); small-scale extraction for fuel; larger scale peat extraction for horticultural growing media; production of grouse; and forestry. There are a number of other secondary uses of the UK peatlands that are often more related to their location or the fact they are in uplands or open spaces, e.g. leisure and tourism, spiritual places, education etc. Land management practices represent both a threat and an opportunity with respect to the C budgets of peatlands, as management may affect the cycling of C and ecosystem function of peat. Changes in land management represent an important opportunity to improve C uptake as land management practice can more readily be reversed than external drivers such as increases in air temperature, changes in precipitation as a result of climate change or changes in the chemical composition of atmospheric deposition. Furthermore, some forms of damage to peatlands can be restored, for example by active re-vegetation after damage by wildfire. Although there is currently little evidence that restoration or reversal of land management can lead to C gains, recent modelling work by Worrall et al (2009a) has suggested that for the English Peak District it would be possible to obtain a net economic benefit from a C offsetting scheme based upon restoration of peat in specifically targeted areas, equally restoration may bring benefit through avoided losses. The largest area of peatland restoration in the UK to date has been on blanket bog (approximately > 200km2) compared to other types of peatland (< 20km2 of restoration on lowland raised bog, for example). This is not surprising given the dominant cover of blanket bog among the peatland types found in the UK (Table 2). The Defra Peat Project compendium compiled in 2008 showed that at the time more than 150 peatland restoration projects were operating in the UK on more than 1,000 sites (Holden et al 2008). Most of these restoration projects have focused on restoring ecological and hydrological function. Biodiversity came across overwhelmingly strongly as a justification for all restoration projects. The main recent driver has been Public Service Agreement or related targets on achieving favourable condition for Sites of Special Scientific Interest (SSSI) within England and Wales and in Scotland Land Manager’s Options targeting SSSI under the Scottish Rural Development Programme. Other benefits such as conserving or enhancing C stocks and mitigating climate change have, until very recently, been secondary or low priority aims. Carbon was used as a justification for 62% of the restoration projects considered by Holden et al (ibid), but was only considered extremely important in three cases. More recently, fewer of the newer restoration projects claim that C benefits are of no importance or of very low importance when justifying the need for restoration or management. Almost all restoration projects were found to be monitoring vegetation, mainly through ground survey but assisted in about half of the cases by air photos and other remote sensing techniques. Hydrology was being monitored by ground survey in 70% of projects. Invertebrate and bird monitoring were also common, occurring in more than 50% of projects while C, peat erosion, climate and pollution were being monitored in a few rare cases. Monitoring was delivered by a variety of personnel ranging from academic collaborators to volunteers and private contractors. Most vegetation monitoring was delivered in-house while most monitoring for other variables was delivered by others. Academic collaborators dominated the delivery of C and climate monitoring.
A review of current evidence on carbon fluxes and greenhouse gas emissions from UK peatlands
12
2.2 Spatial extent of peatland types and land-uses The term peatland refers to an area of land that is dominated by peat soils. Peat soils form where slow rates of decomposition, under waterlogged conditions, result in the accumulation of partially decomposed organic matter. Formation of peat, therefore, occurs in areas of positive water balance. Peats are more likely to form in areas of high precipitation, such as upland areas of the temperate and boreal zone or in lowland areas where springs or surface groundwater, shallow gradients, impermeable substrates or topographic convergence maintain saturation. Soil classification systems define peat soils by two methods, either mass composition or profile partition. The mass composition method defines peats as those soils that contain > 65% organic matter (Scotland) or >50% organic matter (England and Wales), whereas the profile partition method defines peat soils by the depth of their surface peaty horizon. In England and Wales, peat is defined as a deposit of at least 40cm depth (50cm in Scotland) which contains greater than 20-25% organic material within the top 80cm of the soil profile (Avery 1980). This definition is arbitrary as there is a continuum between a highly organic mineral soil and an almost purely organic Sphagnum peat (Clymo 1983). Peatlands are often classified in terms of their source of water and nutrients into bogs and fens, where bogs are ombrotrophic, receiving all of their water and nutrients from rainfall whereas fens receive an ecologically significant proportion of their water and nutrients from surrounding land and are known as minerotrophic. Both types of peatland can be subdivided into further classes, for example bogs can be subdivided into blanket and raised bogs; further details about bog classification can be found in Lindsay (1995; 2010). Fens can be divided into basin, valley, floodplain and sloping fens (Charman 2002) and also differ according to the nutrient status and pH of the ground water. Peatlands in the UK represents less than 1% of the 3.5 million km2 of the northern peatlands that mainly occupy the boreal and subarctic zones (Gorham 1991); however, UK blanket peats represent around 10-15% of the world’s blanket peat resource (Tallis 1997). Although there are many ways to classify peat soils and peatland habitat types it is often difficult to gather information on the extent or importance of these. In this review we suggest that there are three major ways in which we can consider the importance of peat types or peatland management. • Spatial extent - the simplest approach is to consider the spatial area of each
peatland type/management and conclude that the focus should be on the type with the greatest spatial extent.
• Flux-weighted - the peatland types and management could be weighted not only by spatial extent but also by emission factor and so in that case the peatland that is the largest source of GHG is prioritised.
• Stock weighted - the peatland types could be weighted to reflect their stock of C, for which it would be necessary to know the typical depth of peat, bulk density and C content as well as their spatial extent. This approach was not used in this study, as some of the required information was not available, i.e. peat depth maps.
Therefore, this study assessed the spatial extent and flux-weighted spatial extent of different peat types and management. This task used four major sources of information: 1. UK Biodiversity Group (2008) - UK Biodiversity Action Plans (2008). 2. Natural England (2010) - England’s Peatlands - Carbon Storage and Greenhouse
Gases. Natural England Report NE257.
A review of current evidence on carbon fluxes and greenhouse gas emissions from UK peatlands
13
3. Scottish Executive (2007). ECOSSE - estimating carbon in organic soils, sequestration and emissions.
4. Defra (2009). Assembling UK wide data on soil carbon (and greenhouse gas) in the context of land management. Project SP0567 (Defra 2010) 2010).
These sources were used because they are the most up-to-date studies that explicitly considered the areal extent, and sources (reports 2 and 4 above give emissions factors for a range of peatland types). Each of the studies presented above (1-4) draws upon a number of earlier studies (e.g. Northern Ireland Peatland Survey - Cruickshank and Tomlinson 1988) and upon nationally available maps. However, each study (1-4) interprets the spatial extent of peat in a slightly different way, and each covers a different total area. Combining information from the UK Biodiversity Action Plans with national soil survey information means that all UK peatland can be classified into four types reflecting the habitat that formed the peat; blanket bog, which represents nearly 90 of all peatland areas in the UK; upland raised bog; lowland raised bog; and fen. Fens are included as one type, as data on the areal extent of the different types are not available for all of the UK. While this report has divided peatlands into four types, it should be noted that the Biodiversity Action Plan (BAP) classifications are the most widely used in restoration project planning and targeting (Holden et al 2008). These recognise “broad habitats” used for describing the range of habitats found across the UK, and a sub-set of “priority habitats” which are subject to action plans for their conservation. For the most part, BAP habitats reflect the current vegetation on the surface of the peat, and therefore do not necessarily indicate the extent of the peat deposit, or therefore, the peatland. Relevant BAP habitat types are blanket bog; lowland raised bog; upland heathland; lowland heathland; lowland fens; and, upland flushes ,fens, and swamps. Although heathland is not recognised as a peatland type, as most heathland is associated with the formation of drier organo-mineral soils (Holden et al 2007a) and not peat, wet heathland is associated with the formation of shallow peaty soils even though it may cover deeper peat soils as well. Of the four Priority Habitat types assessed by UK BAP, the extent of both blanket bog and lowland fens are assessed as declining ; and the extent of lowland raised bog is probably declining No values for upland raised bog are reported after 2005. The total area of UK BAP peatland habitats is given as just over 22,000km2. Bogs include blanket and raised bogs. Lowland raised bogs comprise a dome of saturated peat underlain by fen peat or waterlogged mineral sediments. The peat is usually 3-10m deep in the middle but shallower nearer the edge (Charman 2002). The area around a bog’s margin may receive some nutrient rich water from surrounding farmland and may therefore support fen plant communities, though many examples are fringed instead by drainage. The largest complex of lowland raised bogs in England is Thorne, Hatfield, and Crowle Moors in Yorkshire, but these have been severely altered from their natural state by peat cutting. Raised bogs are also found in the uplands but usually in association with blanket bogs and in the uplands are not usually distinguished in classification or management practice from the surrounding blanket bog. Lindsay (1995) and Charman (2002) suggest that raised bogs and blanket bogs are simply end-points of an ecological continuum, e.g. a blanket bog can be considered a large raised bog or may contain small areas that act more like raised bogs. Most peatlands in the UK are blanket peats which occur on flatter parts of the uplands and are primarily supplied with water and nutrients in the form of precipitation. They are usually hydrologically disconnected from the underlying mineral layer and range in depth from 0.4 to 6m, with a typical average of 2-3m and are found in the wetter, cooler upland areas of the UK (Charman 2002). The largest area of blanket bog in the UK is in the Flow Country in northern Scotland.
A review of current evidence on carbon fluxes and greenhouse gas emissions from UK peatlands
14
The term ‘fen’ covers a much wider range of peatland types than ‘bog’ (Wheeler et al 2009). Fens are peatlands in which some of the water inputs have a minerotrophic origin (typically via ground-water flow and river flooding). The nutrient status of fens varies depending on their position in relation to the surrounding land and local geology. Hence the pH can vary from 4-5.5 (poor fen), to 5-7 (intermediate and moderately-rich fen), to 6.8-8 (extremely-rich fen) (Rydin and Jeglum 2006). Together with macronutrient (N,P,K) status, pH influences the species composition of fen vegetation, which can range from a Sphagnum-dominated assemblage very similar to that found on bogs, to one dominated by tall herbs, sedges or emergent plants such as Typha spp. (Reedmace or Cattail) and Phragmites australis (Common Reed). A detailed classification for England and Wales, based on water-supply mechanisms, may be found in Wheeler et al (2009). A significant component of Europe’s surviving fen is located in the UK (Baird et al 2009). Peatlands can also include areas where peat is no longer accumulating or where the peat has been damaged or degraded by human activities such as peat cutting, drainage or pollution. Table 1. The area of different types of peat in the UK. Unless otherwise stated the source of this information is Natural England (2010).
Country Peat type sub-type Area of peat (km2)
England Deep peat Total 6799a Lowland
wasted peatb 1922
Upland peat 3553 Raised bog 357 Lowland fen 958 Other 9 Shallow
peats 5272
Soils with scattered pockets of deep peat
2114
Scotlandd Total deep peat
17269
Wales Deep peats 706 Total peaty
soils 2809
Northern Ireland
Deep peats 1700c
UK Intact deep peat
total 17125
a Includes 1,922km2 of wasted peat. b This number refers to areas where fen peat has been largely lost as a result of drainage and cultivation for
agriculture. c Source: International Peat Society - www.peatsociety.org d Figure adapted from Natural England 2010 It should be noted when comparing between figures for the nations in Table 1 that there is a lack of clarity of terms and it is impossible to bring all UK peat into one set of definitions and classifications that would be most helpful to this review. Table 1 implies that Scotland’s peat is less important than previously considered (Milne & Brown, 1997); this may be due to more
A review of current evidence on carbon fluxes and greenhouse gas emissions from UK peatlands
15
inclusive mapping of peaty soils in England, which encompassed some areas that only support “pockets” of deep peat than in the other countries of the UK. It is also likely that earlier estimates did not include the area of deep wasted peat in England. However, the same could be true in Scotland with the area estimate given here being an underestimate because it has not included soil units with peat pockets. Using the data presented in reports 1-4 above we have compiled Table 2 which outlines the extent of managements for upland peatlands in the UK. Table 2. The percentage of peat within different management types. NB. many areas may have more than one management.
Gripped 11 13 Eroded 7 Afforested 5 15 Bare soil 3 Grazed 85 Extracted 1 Developed 2 Restored 2
This review used the GHG emission factors compiled by Natural England (2010) to generate a flux-weighted assessment of UK peat, corrected for the area of bare soil and then applied to the UK to give estimates of GHG fluxes from UK peats (Table 3). In order to scale up for the UK, it was assumed that 5% of peat in Scotland, Wales and Ireland is cultivated and 5% is improved grassland (there is no citable evidence for this, but it is assumed to be a lower percentage than in England because there is less cultivated land). Where no data for other UK countries was available relating to the extent of land use or management of peatlands these peatlands were assumed to have the same proportional land use as that in England, as presented in Table 2.
3 Deep peats only, taken from Natural England (2010), 4 Taken from Defra (2010)
A review of current evidence on carbon fluxes and greenhouse gas emissions from UK peatlands
16
Table 3. Emissions factors used by Natural England to estimate greenhouse gas flux from England’s peat soils under a range of managements - this does not include biomass increase on any type of management such as forested land. Units are tonnes CO2eq ha-1 yr-1. No factors were available for peatlands supporting woodland, scrub, semi-natural vegetation, purple moor-grass or with old peat cuttings. The factor for bare soil is for a site with 100% bare soil not as reported in Natural England (2010) which mistakenly reported the value for 1% bare soil.
a Based on data from Couwenberg et al (2008). b CO2 and CH4 factors from Couwenberg et al (2008), N2O from IPCC tier 1. c CO2 from Bradley (1997), N2O from IPCC tier 1. d Emissions factors from Byrne et al (2004). e CO2 and CH4 factors from Couwenberg et al (2008), N2O from Byrne et al (2004) f IPCC tier 1 emissions factor g Based on simplified version of Durham Carbon Model (Worrall et al 2009b) Using data presented in Tables 1 to 3 it is then possible to estimate GHG fluxes associated with different types of peatland management (Table 4). Table 4 suggests that UK peatlands are currently a net source of 5.73 Mtonnes CO2eq yr-1 of GHG with about 50% of these emissions coming from English peats even though these represent less than 40% of the total UK area of peat soils (Table 1). Whilst this higher contribution may represent the greater proportion of the peats converted for agriculture being in England, it may also be due to an underestimate of the area of managed peatlands in Scotland, Wales and Northern Ireland where less information on peatland management has been collated.
A review of current evidence on carbon fluxes and greenhouse gas emissions from UK peatlands
17
Table 4. Total estimated greenhouse gas emissions from peat soils under a range of uses, land covers and peat condition - not including biomass on forested land. Units are Megatonnes (Mt) CO2 eq yr-1. Note this table does not include losses from use of peat for horticultural purposes.
England (Mt CO2 eq yr-1)
UK (Mt CO2 eq yr-1)
Cultivated & temporary grass 1.75 3.11
Improved grassland 0.53 1.06
Rotationally burnt 0.27 0.62
Afforested 0.02 0.42
Restored 0.03 0.12
Extracted 0.03 0.18
Overgrazed 0.00 0.00
Bare 0.12 0.39
Gripped 0.00 -0.02
Eroded -0.01 -0.01
Undamaged -0.02 -0.14
total estimated GHG emissions (Mt CO2-e yr-1)
2.72 5.73
Conclusion - it is clear from this analysis that there are peatland land uses/covers that in terms of emissions would appear more significant than others at this stage; it would suggest that areas improved for agriculture are the most important sources by far; however, many of these are based on non-UK, tier 1 emission factors (Penman et al 2003).
2.3 Influence of land use on C and GHG fluxes from peatlands - field evidence
The following sections describe the evidence available to characterise the GHG and C flux associated with a range of ongoing peatland management types. The GHG and C flux implications are then described for a number of key transitions, representing changes in land management, and associated activities carried out to affect these. The managements can be divided between land uses (e.g. currently-grazed land) and land use changes (e.g. afforestation of previously unforested peat). In considering the current evidence upon carbon and greenhouse gas fluxes we have first considered the evidence from ‘Pristine’ peatlands and then considered the management categories listed above. For each management category we have provided a summary with respect to knowledge gaps and the potential for improving our estimation of emission factors. We then provide a link to the section of the research plan that will address these knowledge gaps. 2.3.1 ‘Pristine’ peatlands There are only a small number of studies that have attempted to measure a complete C budget for what were considered, a priori, by the authors to be active peat-forming peatlands, within the UK. a Moor House Worrall et al (2003; 2009a) constructed a C budget that considered both fluvial and gaseous exchange, for the Trout Beck blanket peatland catchment at Moor House in the North
A review of current evidence on carbon fluxes and greenhouse gas emissions from UK peatlands
18
Pennines (Table 5). It is impossible that any catchment could be fully representative of upland peats in England and Wales, and indeed the Moor House National Nature reserve has been significantly affected by gully erosion caused by both internal and external forces and a history of moorland burning. However, but there has been no land management intervention, except grazing, on the site since 1954 and much of the eroded area is significantly re-vegetated, with a vegetation frequently dominated by dwarf shrubs rather than bog mosses and cotton grasses. As such the site may represent the more degraded end of active peat-forming peatlands. The estimated C budget proposed by Worrall et al (2003) had a number of limitations; the study did not measure all possible uptake and release pathways; in-stream losses were not included; the study only considered one year; the fluxes of CH4 had to be modelled for the catchment based upon results from outside the study area; and the budget was for C and not a complete GHG assessment as N2O fluxes and proportion of DOC and POC not lost to atmosphere were not considered. The first three of these issues were addressed in an updated and revised budget by Worrall et al (2009a), who reported that the 13 year (1993-2005) average C budget for Trout Beck was -59 tonnes C km-2 yr-1 (i.e. the catchment was acting, on average, as a sink for C), with annual budgets ranging between -20 and -91 tonnes C km-2. Further measurements of N2O at a nearby site have indicated that the flux of this gas is consistently below detection limits. b Auchencorth Another catchment-scale blanket peat C budget was presented by Billett et al (2004) for Auchencorth Moss in central Scotland (Table 5). A small part of the Auchencorth catchment has been drained but these drains have not been maintained and there has been a small amount of peat extraction. The C budget was compiled over two years, October 1996 to September 1998 and was found to be 8.3 tonnes C km-2 yr-1, suggesting that the system was acting as a source of C or at best C neutral within the uncertainty of the export estimates. In addition, Billett et al (2004) observed that the fluvial export of total organic carbon (TOC = POC + DOC) is of a similar magnitude to the net CO2 exchange (Table 5). Based upon an estimate of UK peat area, Baird et al (2009) estimated the GWP of Auchencorth to be 26 tonnes CO2-eq km-2 yr-1, assuming that all the fluvial C flux eventually returned to the atmosphere. Dinsmore et al (2010) have subsequently shown that the Auchencorth peatland is a net sink for GHGs (-352 tonnes CO2-eq km-2 yr-1) and C (-69.5 tonnes C km-2 yr-1), similar to the 13 year average of -59 tonnes C km-2 yr-1 reported by Worrall et al (2009a). Here too they showed that the aquatic fluxes of C were very important, representing 41% of NEE C. A number of other C budgets of active sites have, at the time of writing, been submitted for publication or are in press, which show a considerable range in values (Table 5). Clay et al (in press) compiled a C budget for the Hard Hill plots at Moor House in order to study the impact on C fluxes of managed burning and grazing in comparison to control (unmanaged) plots. The control plots in this case have been unmanaged since 1954, and are dominated by mature and degenerate Calluna vulgaris. They therefore do not represent typical peat-forming blanket bog vegetation, probably as the result of the continued influence of past management practices as well as the current lack of any management. In this context, the unmanaged plots are considerable sources of C and GHG. Similarly, as part of a study into the impact of revegetation on the C and GHG budget of blanket peat, Billett et al (in press) monitored two control plots that represent the range of normal conditions for the study region (Peak District). The two plots in this study differed in their sink/source status with the Eriophorum-dominated plot, more typical of peat-forming blanket bog vegetation, acting as a net sink of C (and GHG) over two years while the dwarf shrub-dominated plot was a net source of C/GHG over the same period (Table 5).
A review of current evidence on carbon fluxes and greenhouse gas emissions from UK peatlands
19
The variation in budgets from this range of sites illustrates the importance of understanding the past impacts of management on apparently unmanaged plots, and also highlights the difficulties in re-establishing active peat formation. They also suggest that care must be taken not to confuse an apparent lack of management interventions with favourable peatland condition or active peat formation. Reliance on contrasts with less intensively managed local peatlands thus may not represent a true comparison with an active peatland when considering changes in management in order to improve the C or GHG budget of an ecosystem. To characterise such systems, it may be necessary to establish new research sites on peatlands where the vegetation is more clearly similar to that which has formed the peat in the past. However, local “controls” continue to be important in that they indicate the impacts of different intensities of management, even where they do not reflect truly active or undamaged peatlands. Both of the sites identified above represent peatlands which are under favourable management but apparently not peat-forming. It is acknowledged that a category of peatland should be recognised where there is both ideal management for peat formation and maintenance of the peat forming vegetation. These areas cannot be viewed as ‘pristine’ peatlands in the UK, because almost all will have received some management, and the sites may still be subject to anthropogenic environmental pressures (such as excess N deposition) that are likely to affect GHG and C flux. The term “undamaged” peatlands has been used (Natural England 2010 - Table 2) to describe those subject to the lowest pressures from management or other external sources, but this carries negative connotations, and implies that all peatlands that are not positively identified as “undamaged” must therefore be damaged. Another term proposed to capture these peatlands is “active” or “peat-forming”. This term applies a functional definition, but recognises that peatlands may be peat forming, even when subject to management. Even quite intensively disturbed peatlands; however, can be actively peat forming (such as those dominated by purple moor-grass as a result of too-frequent burning, or in some peatland areas between drains). Furthermore, the evidence from Table 5 and the description above suggests that what authors may have, a priori, chosen to study as ‘pristine’ could in fact be better described as ‘semi-natural’ as described in Table 2. In this review we have tried to be careful in clarifying these differences even if we retain an overarching term of ‘Pristine’ to recognise areas where the current management is at very low intensity. One aspect of ‘pristine’ peatlands that is certain is that they have been net sinks of carbon, if not necessarily of greenhouse gases, in the past. It is possible to characterise elements of the vegetation that formed this peat, because of the preservation in peat of recognisable plant material. Thus it is possible to determine if the current vegetation on a site is similar to that which has formed the peat in the past. If the vegetation and peat species composition are similar, then this may indicate that active peat formation is at least possible, but this can only be demonstrated by understanding the carbon budget. However, there are a range of possible peat forming species which may have dominated at separate times during the period of peat formation at a site. If the current carbon flux of a peatland is positive (i.e. the peatland is losing its stored carbon faster than it gains new carbon from the atmosphere), then it cannot be considered to be active and peat-forming. Most studies that have attempted to characterise the carbon budget of active peatlands have made assumptions on likely peat-forming activity on the basis of comparative intensity of management, rather than examine the similarity between current and past vegetation.
A review of current evidence on carbon fluxes and greenhouse gas emissions from UK peatlands
20
Table 5. Estimated C (and GHG) balance for pristine peatlands in the UK. Site Auchencorth
5 Rowson et al (in press a) consider two pristine sites where site a) is Eriophorum dominated and b) is shrub-dominated. 6 Worrall et al (2009a) considered 13 years and so maximum and minimum values are given. 7 Clay et al (in press a) consider a range of management types, the numbers presented here are from the unmanaged control plots. 8 It is not always necessary to measure rainfall inputs of DOC, if DOC is calculated at source.
A review of current evidence on carbon fluxes and greenhouse gas emissions from UK peatlands
21
Other studies outside of the UK that might be considered to relate to active peatlands, include a six year study by Roulet et al (2007) on a Canadian raised bog who found the peat acted as net C sink of -21 tonnes C km-2 yr-1 although this varied significantly between years and a two year study of a Swedish peat bog by Nilsson et al (2008) who found that the peats acted as a net C sink of between -20 and -27 tonnes C km-2 yr-1. Similarly, Koehler et al (in press) report six years of carbon budget from an Irish blanket bog measuring an average of being -29.7 tonnes C km-2 yr-1. However, data from Canada and Sweden are unlikely to be readily applicable to UK peatlands; both sites were raised bogs, while most of the UK data is for blanket bogs and water throughputs are considerably higher in the UK context leading to higher comparative fluvial fluxes. Indeed, and even despite the fact that values for an Irish blanket bog should be more comparable with the rest of the UK, the fluvial budgets of Koehler et al (2010) seem remarkably low at 14 tonnes C km-2 yr-1 and their budgets do not consider POC, dissolved CO2 or in-stream losses. Summary i This review could not find a study of an undamaged peatland in the UK. ii The studies listed above for the UK would have to be considered at this stage as
examples of the semi-natural iii Considering the above studies as examples of semi-natural peatlands (Table 5)
would give an emissions factor of +1.0 tonnes CO2eq ha-1 yr-1, with a standard deviation of 1.4 tonnes CO2eq ha-1 yr-1.
iv A future research programme should consider local controls in order to understand
the impact of any management. v The research case addresses these issues in section 2.3.2 and section 3. 2.3.2 Drained peatlands In this section we must consider four things: two steady state conditions - drained and drain-blocked; and two transitions - draining and drain-blocking. It should be noted that in much of the available literature it is difficult to assess whether a study is describing a position at steady state or in transition due to a management intervention such as drain-blocking, and so we are forced to assess these together. a Drained This section considers evidence on all forms of drainage in upland and lowland peatlands, although evidence from the UK is largely for upland settings. In a drained peatland rates of litter and peat decay in blanket peat may increase because of a thickening or deepening of the aerated zone caused by drainage (lowering of the water table). Decay rates in the aerated (oxic) zone are typically thousands of times greater than those in the absence of oxygen (e.g. Clymo 1983; Frolking et al 2002). Therefore, a deepening of the oxic zone caused by drops in the water table can cause very large increases in rates of CO2 emissions from peatlands and a loss of C sink function (Dirks et al 2000). By contrast a lowering of the water table may result in lower CH4 emissions (Best and Jacobs, 1997). Studies that have investigated the impact of drainage on DOC concentration have observed contradictory results. Clausen (1980), Edwards et al (1987) and Mitchell and McDonald (1995) found that upland drained catchments produced much more discoloured (DOC-rich) water than undrained catchments. In contrast, Moore (1987) in southern Quebec, observed only minor changes in stream DOC concentrations in drained peat extraction sites, compared
A review of current evidence on carbon fluxes and greenhouse gas emissions from UK peatlands
22
to undisturbed raised bog peatlands. Results from studies investigating the role of deeper water tables on DOC export are also contradictory, with some studies observing an increase (Tipping et al 1999) while others observed a decrease (Freeman et al 2004) or no significant changes (Blodau et al 2004). A large amount of unpublished data collected as part of water colour projects for water companies in the 1980s demonstrates this contradiction very clearly and more recent work by Wallage et al (2006) showed that DOC concentrations within the peat were significantly greater within drained blanket peat than in nearby undrained peat. Chapman et al (in press) have shown for a blanket peatland, where measurements were taken in 1986, that water colour (a surrogate for DOC) was greater in drained sub-catchments than in undrained peat. However, when the measurements were repeated in 2006/7 the difference in water colour between drained and undrained sites was much smaller. The colour had increased in all subcatchments over time, but had increased at a faster rate in the undrained catchments. In other words the undrained catchments appear to have ‘caught up’ with the drained catchments in terms of colour production. There may, therefore, be some important long-term changes in DOC production with time since drainage which means that the findings might vary between sites depending on how long it has been since those sites were drained. These background changes in DOC production may result from other widespread land management changes (such as increased moor burning over the same period) or changes in environmental conditions, such as pollutant deposition or amelioration. The production of POC has been found to be significantly greater from drained peats than in undrained, upland peats at many sites (Ramchunder et al 2009). The ditches are often the source of the additional POC rather than the additional POC coming from changes in flowpaths. The upland ditches themselves can be subject to severe scouring, widening and deepening often by several metres (Mayfield and Pearson 1972). At other sites there is a more gradual erosion of drains but there is often no stabilisation. Carling and Newborn (2007) found drain sediment yields were between 10 and 10,000 times greater over a five year period than those in natural streams. This might suggest that only direct intervention can reduce particulate C loss although the authors observe that many upland drains do appear to become blocked with vegetation or redeposited sediment over time without active re-digging. Site characteristics (e.g. steep slopes) often mean that even relatively recently drained catchments may be significant sources of sediment and C. Holden et al (2007a) showed that for Oughtershaw Moss (Upper Wharfedale) peat drains were major sources of suspended sediment with 18.3% of the sediment originating from drains which drained 7.3% of the area. There is a greater incidence of peat pipes in drained peatlands (Holden 2006a) which may also exacerbate sediment losses and other forms of C loss, although no measurements of pipe C losses have been made in drained catchments. With respect to the surface exchange of gases, the meta-analysis shows that numerous studies all agree that soil respiration will increase following drainage, while the majority of studies showing a reduction in CH4 flux (Table 6). These findings are entirely consistent with an increase in oxic processes with the lowering of water table with drainage. The meta-analysis suggests that drainage results in a peatland becoming a net source of C, due to an increase in the CO2 flux (47% probability of being a net sink and therefore a 53% probability of being a net source). However, the decrease in the CH4 flux upon drainage results in a reduction in the net GHG flux from a peatland, with the meta-analysis suggesting there is a 69% probability of drainage resulting in an overall improvement in the GHG budget, i.e. the drained peatland is more likely to become a net sink. There is one complete study of a drained peatland and this is for the UK - Rowson et al (2010). The study of Rowson et al (2010) considered one open drain for one year, but that drain had been dug at least eight years before the study and so may be considered to be at a steady state rather than in transition and the study found that the C budget was +94.5 ± 13 tonnes C/km2/yr (+178 tonnes CO2eq/km2/yr). Although, this study may represent a steady
A review of current evidence on carbon fluxes and greenhouse gas emissions from UK peatlands
23
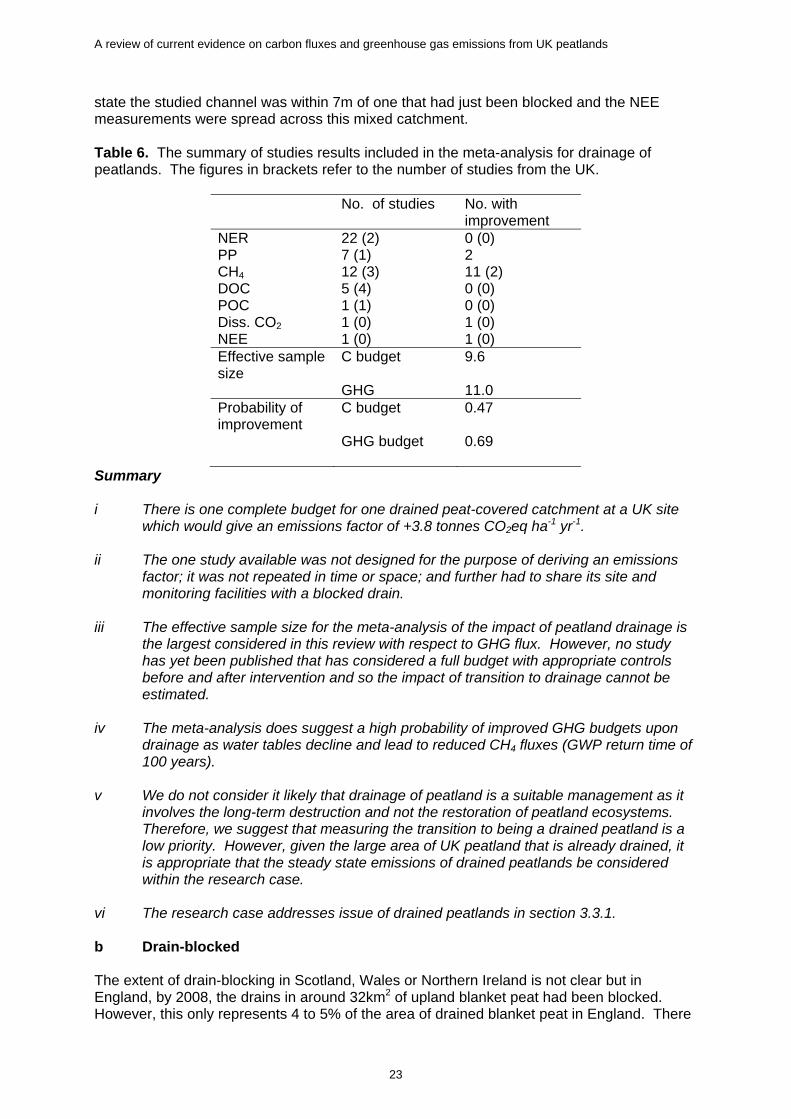
state the studied channel was within 7m of one that had just been blocked and the NEE measurements were spread across this mixed catchment. Table 6. The summary of studies results included in the meta-analysis for drainage of peatlands. The figures in brackets refer to the number of studies from the UK.
Summary i There is one complete budget for one drained peat-covered catchment at a UK site
which would give an emissions factor of +3.8 tonnes CO2eq ha-1 yr-1.
ii The one study available was not designed for the purpose of deriving an emissions
factor; it was not repeated in time or space; and further had to share its site and monitoring facilities with a blocked drain.
iii The effective sample size for the meta-analysis of the impact of peatland drainage is
the largest considered in this review with respect to GHG flux. However, no study has yet been published that has considered a full budget with appropriate controls before and after intervention and so the impact of transition to drainage cannot be estimated.
iv The meta-analysis does suggest a high probability of improved GHG budgets upon
drainage as water tables decline and lead to reduced CH4 fluxes (GWP return time of 100 years).
v We do not consider it likely that drainage of peatland is a suitable management as it
involves the long-term destruction and not the restoration of peatland ecosystems. Therefore, we suggest that measuring the transition to being a drained peatland is a low priority. However, given the large area of UK peatland that is already drained, it is appropriate that the steady state emissions of drained peatlands be considered within the research case.
vi The research case addresses issue of drained peatlands in section 3.3.1. b Drain-blocked The extent of drain-blocking in Scotland, Wales or Northern Ireland is not clear but in England, by 2008, the drains in around 32km2 of upland blanket peat had been blocked. However, this only represents 4 to 5% of the area of drained blanket peat in England. There
A review of current evidence on carbon fluxes and greenhouse gas emissions from UK peatlands
24
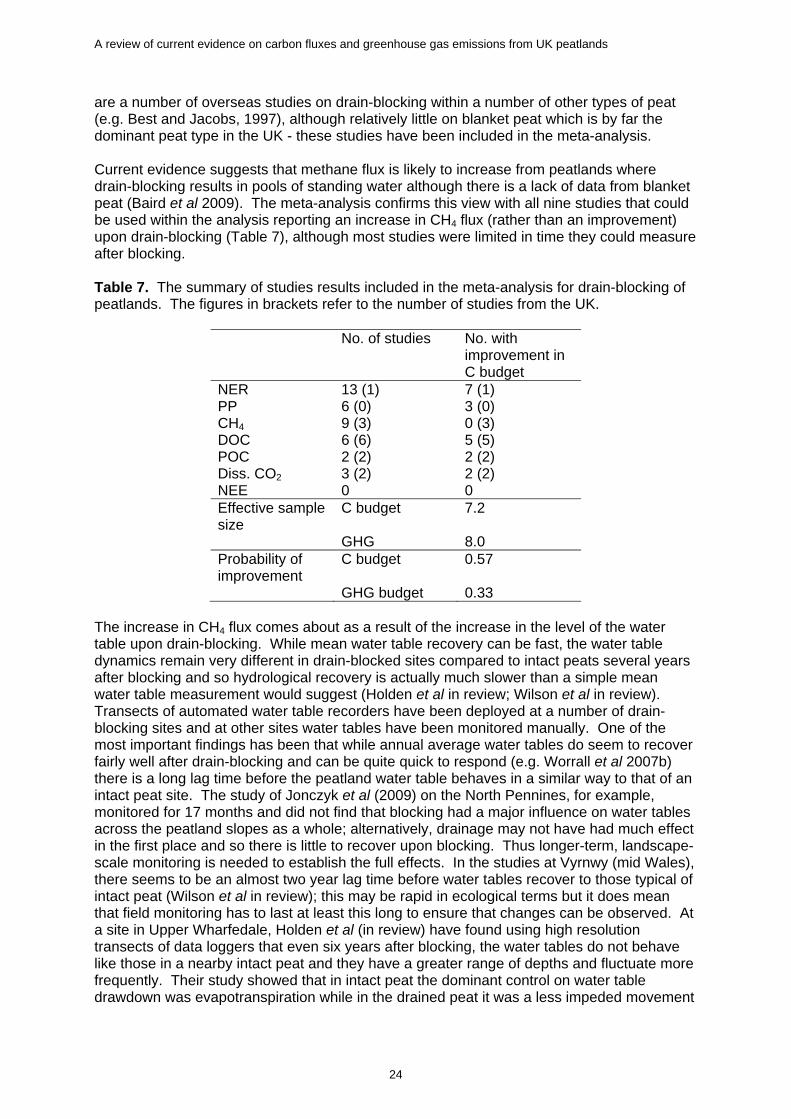
are a number of overseas studies on drain-blocking within a number of other types of peat (e.g. Best and Jacobs, 1997), although relatively little on blanket peat which is by far the dominant peat type in the UK - these studies have been included in the meta-analysis. Current evidence suggests that methane flux is likely to increase from peatlands where drain-blocking results in pools of standing water although there is a lack of data from blanket peat (Baird et al 2009). The meta-analysis confirms this view with all nine studies that could be used within the analysis reporting an increase in CH4 flux (rather than an improvement) upon drain-blocking (Table 7), although most studies were limited in time they could measure after blocking. Table 7. The summary of studies results included in the meta-analysis for drain-blocking of peatlands. The figures in brackets refer to the number of studies from the UK.
GHG budget 0.33 The increase in CH4 flux comes about as a result of the increase in the level of the water table upon drain-blocking. While mean water table recovery can be fast, the water table dynamics remain very different in drain-blocked sites compared to intact peats several years after blocking and so hydrological recovery is actually much slower than a simple mean water table measurement would suggest (Holden et al in review; Wilson et al in review). Transects of automated water table recorders have been deployed at a number of drain-blocking sites and at other sites water tables have been monitored manually. One of the most important findings has been that while annual average water tables do seem to recover fairly well after drain-blocking and can be quite quick to respond (e.g. Worrall et al 2007b) there is a long lag time before the peatland water table behaves in a similar way to that of an intact peat site. The study of Jonczyk et al (2009) on the North Pennines, for example, monitored for 17 months and did not find that blocking had a major influence on water tables across the peatland slopes as a whole; alternatively, drainage may not have had much effect in the first place and so there is little to recover upon blocking. Thus longer-term, landscape-scale monitoring is needed to establish the full effects. In the studies at Vyrnwy (mid Wales), there seems to be an almost two year lag time before water tables recover to those typical of intact peat (Wilson et al in review); this may be rapid in ecological terms but it does mean that field monitoring has to last at least this long to ensure that changes can be observed. At a site in Upper Wharfedale, Holden et al (in review) have found using high resolution transects of data loggers that even six years after blocking, the water tables do not behave like those in a nearby intact peat and they have a greater range of depths and fluctuate more frequently. Their study showed that in intact peat the dominant control on water table drawdown was evapotranspiration while in the drained peat it was a less impeded movement
A review of current evidence on carbon fluxes and greenhouse gas emissions from UK peatlands
25
of water through the deeper peat layers, with the drain-blocked site having water table features somewhere in between those of intact and drained peat. Changes in both CH4 flux and soil CO2 respiration resulting from drain-blocking are explained by decreases in the depth to the water table, and so it might be expected that when drains are blocked that NER would decrease. However, the studies used in the meta-analysis are almost equally divided over whether drain-blocking leads to an increase or decrease in NER (Table 7). Most studies have concluded that drain-blocking will reduce DOC flux from the peat soil to surface waters (Table 7). A modelling study by Worrall et al (2007c) predicted that drain-blocking should reduce DOC concentrations and fluxes but found that the magnitude of the decrease is critically dependent upon the drain-spacing and for the larger drain-spacings no decrease may be observed. Gibson et al (2009) showed that DOC fluxes were lower in the three blocked drains than in one unblocked drain. Worrall et al (2007b) found that increase in DOC concentration in blocked drains was more than offset by decreases in water discharge along the drain; that is, these studies tend to show that decrease in DOC flux to surface waters is due to changes in water flow leaving via the drain and not a decrease in DOC concentration leaving via the drain. However, water held up by drain-blocking may emerge into the catchment elsewhere meaning that any decline in DOC flux observed at the drain-scale may be diminished or even lost at the catchment-scale. Alternatively, Wallage et al (2006) and Armstrong et al (2010) have both shown decreases in DOC concentration, the former in soil water and the latter in runoff waters. It should be noted that none of these studies have had appropriate controls, i.e. studied drains before blocking and having parallel unblocked controls. POC is one of the parameters of the C cycle that should be immediately impacted by drain-blocking work. In Upper Wharfedale drain-blocking significantly reduced fine sediment (and POC) yield by over 50 fold (Holden et al 2007a). Drain-blocking is one of the few transition types for which there is a complete, published C and GHG budget (Rowson et al 2010). In this case, the C budget for a drain-blocked peat catchment was 74 ± 11 tonnes C/km2/yr (143 tonnes CO2eq/km2/yr). These budgets are for the year immediately after drain-blocking and so represent part of a transition rather than the drain-blocked steady state. Furthermore, this study for the North Pennines could not include appropriate pre-intervention and parallel controls and so it is difficult to estimate the true change in GHG budget for this site. Equally, the drain that was blocked was close to an open drain and some of the monitoring was of necessity shared. Summary i A field-based emission factor does exist for a drain-blocked site
(+3.0 tonnes CO2eq ha 1 yr-1), but this result must be considered of low quality because it was not derived for this purpose, and the site was mostly likely to be in transition.
ii The meta-analysis suggests that drain-blocking would represent a considerable risk
through the reported increase in CH4 fluxes. iii We consider that not blocking drains would not be conducive to peatland restoration
and so research to address the issue of how to mitigate CH4 fluxes is needed9.
9 We note that such a project is underway at Migneint in Wales, funded by DEFRA.
A review of current evidence on carbon fluxes and greenhouse gas emissions from UK peatlands
26
iv Drain-blocking has a large impact on fluvial fluxes, yet it is presently assumed that fluvial fluxes have a lesser role in the GHG balance of a peatland, if this assumption were wrong then it could be that drain-blocking would become more favourable with respect to GHG mitigation.
v The research case addresses issues relative to drain-blocking in section 3.3.1. 2.3.3 Burnt peatlands It is difficult within this land use to consider what the steady state is and what the transition is. Managed burning is a cyclic management on some UK peatlands is quite often irregular, with rotational patch burning on cycles of five to 25 years and so at the scale of each patch there is little opportunity for a new steady-state to develop as each patch may always be recovering from a burn. However, at a wider spatial scale across a number of burn patches then it might be possible to consider a steady state with equivalent numbers of burn patches at each stage of the burn cycle. Therefore, it is postulated that the transition would be from an unburnt area to one that has a patchwork of burnt plots at each stage in the locally appropriate burn cycle. Large areas of upland peatlands experience rotational burning of the heather (Calluna vulgaris) to produce stands at different ages, which increase habitat structural diversity predominantly for grouse (Lagopus lagopus L.) (Glaves et al 2005; Holden et al 2007a). The principal effect of burning management on blanket bogs is to effect a change in vegetation from Sphagnum- and Eriophorum- dominated vegetation to that dominated by common heather (Calluna vulgaris) or (where burning is more frequent and in certain circumstances) purple moor-grass (Molinia caerulea). Managed burning has been reported to cause several changes to peatland soils, including loss of nutrients (Allen 1964) and changes in vegetation composition (Hobbs, 1984; Rawes and Hobbs 1979). With regard to carbon and greenhouse gas fluxes, vegetation change (for example, driven by management practice) may have a strong impact on DOC production. Evidence is building from a number of sources that vegetation cover is a key driver of DOC concentrations. Much of this evidence has been compiled into one document by Armstrong et al (in review); Sphagnum and Molinia seem to be associated with low concentrations while Calluna is associated with higher concentrations of DOC. Thus if management alters the vegetation cover of sites then this might alter the C fluxes in the long term. However, studies of DOC and managed burning differ in their spatial and temporal scales as well as the particular pathways they consider. At the plot scale, Ward et al (2007) and Clay et al (2009b) found no significant difference in DOC concentrations in soil waters between burnt and unburnt sites while Worrall et al (2007a) and Helliwell et al (2010) showed a significant decrease in DOC concentration in soil water though the latter study is not a deep peat. Worrall et al (2007a) and Ward et al (2007) considered the same site and only considered burnt sites nine to ten years after a burn. Clay et al (2009b) and Helliwell et al (2010) consider changes after a burn and Clay et al (2009) considered pre-burn vs. post-burn. Clay et al (2009b) is the only study to consider surface runoff and none of these studies considered stream water DOC concentrations in comparison to measured soil or surface runoff water. At larger scales the effects of fire on DOC concentration for burns more than four yrs old, or those on soil types other than blanket peat, show no observed effect on DOC concentrations in catchment drainage (Yallop & Clutterbuck, 2009; Chapman et al 2010). In total or partly blanket peat catchments a significant relationship between the area of new burn (typically <4 yrs old) on blanket peat and drainage DOC concentration has been found (Yallop & Clutterbuck, 2009) and such a result can be extended to DOC export (Yallop et al 2010). This range of observations is reflected in the meta-analysis for DOC flux (Table 8).
A review of current evidence on carbon fluxes and greenhouse gas emissions from UK peatlands
27
Table 8. The summary of studies results included in the meta-analysis for managed burning of peatlands. The figures in brackets refer to the number of studies from the UK.
GHG budget 0.29 Rates of infiltration have been noted to change as a result of burning; Imeson (1971) suggested that rates increased (but did not actually measure them) whilst Mallick et al (1984) found rates of infiltration decreased as soil pores became clogged with ash, resulting in increased rates of erosion. Burning in other settings has been associated with the development of water repellency that limits infiltration (e.g. for Californian wildlands - DeBano 2000). However, Mallik and Rahman (1985) demonstrated that water repellency in peat soils under regular burning peaked within the first month after burning then declined to a minimum. Mallik and Fitzpatrick (1996) used thin section studies to show that porosity increased peat soils under regular burning but that any difference disappeared within two to three years of burning. Worrall et al (2007a) and Clay et al (2009b) both showed that water table was significantly closer to the surface under managed burn sites compared to those dominated by tall heather, consistent with the loss of tall shrubby vegetation. Furthermore, Clay et al (2009b) showed that burn managements could result in significantly lower hydraulic conductivity and increased frequency of surface runoff. With regard to POC, no study has measured POC fluxes from managed burnt areas; Clay et al (in press) used relative numbers based on suspended sediment concentrations from Clement (2005). The relationship between managed burning and wildfires is complex; areas subject to managed burns are arguably less prone to large-scale wildfires because the taller stands of vegetation are separated by more recently burnt areas, where the fire cannot spread so quickly. However, managed burning replaces the natural blanket bog vegetation, which is not easily burnt, with heather, which burns readily. The worst situation for wildfires is where historic burning has encouraged heather, and this has been left to become tall over large areas, presenting a high and coherent fuel load. Thus wildfires are best avoided by managements that seek to reduce the dominance of heather in the long term. Wildfires have been shown to trigger erosion. Wildfires commonly burn deeper and hotter than well-managed burns so that plant roots are killed leading to break up of the surface, physical erosion, and even burn the peat itself. There are many documented examples of extreme erosion associated with UK wildfire events (Maltby 1980; Maltby et al 1990; Tallis 1997). Rapid erosion means high POC export from these systems. There are few studies of gaseous exchange on sites under managed burning. Because managed burns are a rotational treatment, the net primary productivity (NPP) at any given time and point will depend on the growth stage of the heather during the cycle of burning and re-growth. Clay et al (in press) found significantly higher PP on recently burnt sites in comparison to unburnt control sites. However, the overall effect of carbon capture in these
A review of current evidence on carbon fluxes and greenhouse gas emissions from UK peatlands
28
systems can only be characterised through either multiple measurements indicating NPP in stands representing the full age range of the heather. Because the vast majority of the carbon captured by the heather is lost through regular burning, or decomposition of litter, it is possible, and less expensive, to indicate the overall NPP by the C stored in the standing vegetation and litter in samples representing each stage of the burning cycle. Soil gaseous fluxes of CO2 and methane are likely to go through similar cyclical stages, relating to the water table fluctuations caused by the changing biomass of transpiring heather vegetation. For the Hard Hill plots at Moor House, Ward et al (2007) found increases in gross ecosystem CO2 fluxes of both respiration and photosynthesis in burned and grazed treatments plots relative to controls. Garnett et al (2000) examined long-term experimental plots at Moor House, North Pennines, and found that burning reduces peat accumulation in comparison to heather-dominated plots with no burning. Recalculating the data of Garnett et al (2000) based upon all of their data, shows that the mean difference between burnt and unburnt treatments was 2.3kg m-2 (not 2.48 as reported),which gives a mean effect of burning of 55 tonnes C km-2 yr-1 (not 73 tonnes C km-2 yr-1 as reported in their study). Pietikäinen et al (1999) working in Finnish mires determined that C sequestration at regularly burned sites was half that at unburned sites, although it is uncertain what vegetation differences existed between these two sites. The average C loss associated with a single fire was 2,500 tonnes C/km2, but an annual flux is impossible to estimate as the return period of the fires is not stated. Similarly, Kuhry (1994) used peat core data to demonstrate that rates of peat accumulation in boreal Canada reduce with increased frequency of wildfires. However, these studies measure peat accumulation as a proxy for C accumulation and so it misses C losses from lower in profile and ignores that different forms of C with different densities can be deposited. Clay et al (in press) studied the Moor House plots further and showed that burnt sites, not including the loss of biomass during burning, were a mean source of approximately 117.8 tonnes C km-2 yr-1 compared to unburnt sites with a mean source of 156.7 tonnes C km-2 yr-1. Even when including the loss of C during the vegetation combustion, there are conditions (burn temperature and duration) under which the long term loss of C is less than if no burning had occurred. However, the study of Clay et al (in press) could not consider a full burn cycle including the emissions from the burn itself nor could it consider the inception of burning and as such cannot represent an emissions factor for this land use. It should be noted that the evidence of Clay et al (in press) contradicts that of Garnett et al (2000), but one is a flux study over three years and the latter is a long term accumulation study. Summary i There is only one published complete controlled GHG budget for an area under
managed burning. However, this budget is for duplicated patches comparing the pre- with the post-burn situation, i.e. it is too small a scale and across a transition for us to consider it suitable for calculating an emission factor.
ii A 50-year peat accumulation study of burnt patches may represent a steady-state but
accumulation studies cannot be converted into a GHG balance. iii There is no budget of burnt peatland where the complete patchwork across the range
of ages within a burning rotation is considered. Equally, there is no budget for the transition into or out of that state.
iv The meta-analysis suggests that the introduction of burn management would have a
low probability of improving the carbon or GHG balance of a peatland.
v The gaps identified are:
A review of current evidence on carbon fluxes and greenhouse gas emissions from UK peatlands
29
a. Carbon and GHG balance relative to variation in burning practice - there is no information on what is the variation in burning practice and present evidence tends to come from well managed sites. The impact of burning maybe more dependent upon how much “bad” burning occurs where “bad” is defined in carbon/GHG terms.
b. We are still guessing at the role and importance of stock change at the time of burning, i.e. how much dead biomass and char is left behind compared to how much is pyrolysed?
c. In the case of burnt peatlands the whole life cycle of the management and land will have implications for both GHG and C budgets. Burning is done for a reason and therefore, the consequence of not doing would limit other activities or require burning to occur elsewhere to facilitate these activities.
vi The research case addresses these issues in section 3.3.2. 2.3.4 Grazed peatlands With respect to this review, this section considers the steady state of being grazed land and the transition to being grazed from ungrazed land or the transition from being grazed to ungrazed. Most of the review must consider the impact of sheep but there are other large grazers such as deer, cattle and ponies. In the UK uplands, low-density sheep grazing has been occurring for over 2,000 years and is recognized as an important driver of vegetation change (e.g. Miles 1988) and known to directly affect plant community composition and indirectly affect the activity of decomposer organisms (Bardgett et al 1998; 2001), and thus has the potential to alter ecosystem C fluxes. Management of peatlands for grazing has changed over the last few centuries in response to economic drivers such as: i the switch from summer moorland sheep grazing to hardier breeds able to over-
winter in the hills, in the 18th Century; ii the increase in management for moorland sport based primarily on red deer (Cervus
elaphus) and red grouse (Lagopus lagopus scoticus), from the 19th Century; iii government subsidies following the Second World War for the cutting of drainage
ditches in peatlands (Holden et al 2004); iv European Common Agricultural Policy (CAP) subsidies for livestock farming based
upon headage that resulted in a 30% increase in sheep numbers on UK moorlands between the 1970s to 1990s.
This section will mainly focus upon sheep production and grazing rather than other grazers as it is for sheep that there is the majority of information. From Table 2 it is possible to suggest that 85% of UK upland peats are grazed and sheep numbers in the UK peaked at 44 million in 1990 (MAFF, 1975-2000; Defra 2001-2006). Hope et al (1998 estimate 51% of all UK peat is grazed. The intensification of UK upland agriculture, largely due to subsidising sheep production, has been widely blamed for the recent erosion of peatlands and losses of certain types of habitat (Eggelsmann et al 1993) as well as substantial vegetation change. Blanket peats, for example, have suffered severe degradation in many parts of the UK and particularly in the English Pennines. However, increased peat erosion is unlikely to be solely due to overgrazing - rather that overgrazing by sheep has exploited a vulnerability in the ecosystem caused by other stresses such as increased atmospheric deposition.
A review of current evidence on carbon fluxes and greenhouse gas emissions from UK peatlands
30
Major changes in moorland vegetation have been observed over the 20th century. In Scotland one quarter of heather moorland was estimated to have been lost since the 1940s (Moorland Working Group 1998) and replaced by coarse grasses such as Molinia and Nardus or sedge moors as a result of heavy grazing, as well as loss to bracken and coniferous plantations. For the Peak District and Cumbria, 36% of heather cover was lost during the 20th Century (Anderson and Yalden 1981; Felton and Marsden 1990). While the patterns are not uniform, there has been a general trend from more productive vegetation with relatively high species diversity to large areas dominated by less diverse and more aggressive species of lower agricultural value such as Molinia and Nardus. This is widely blamed on overstocking of sheep and deer, although other factors such as nitrogen deposition have also been implicated. The key changes that have been reported are defoliation, trampling and changes in the nutrient status of the soils (Crofts and Jefferson 1999). Changes in plant species have been reported as a result of grazing, the changes observed varied depending on the stocking density of the sheep (Pakeman et al 2003; Stewart and Lance 1983). Reductions in infiltration rates have been reported (Shaw et al 1996; Worrall et al 2007a) as a result of trampling and possibly stocking densities that are too high, which have also been cited as a cause of erosion of upland peat (Evans 2005). Table 9. The summary of studies results included in the meta-analysis for grazing removal on peatlands. The figures in brackets refer to the number of studies from the UK.
GHG budget 0.96 There is a dearth of studies which have investigated the impact of grazing intensity on C dynamics and fluxes from peatlands. Ward et al (2007) investigated the impact of sheep grazing on CO2, CH4 and DOC fluxes over a 12 month period using long-term grazed and ungrazed plots at Moor House, in the north Pennies. They found that grazing increased rates of respiration and photosynthesis relative to ungrazed plots and that grazed plots acted as greater net sink for CO2 than ungrazed plots on 10 of the 15 dates CO2 was sampled - sampling was predominantly in the summer. They also observed that grazing significantly increased CH4 effluxes, with an average increase of 115% relative to ungrazed plots and that DOC concentrations in soil solution at 10cm depth were 7% larger in plots that were grazed relative to the ungrazed, but that this difference was only detected on seven of the 12 sampling dates when CH4 flux was measured. Shepherd (unpublished PhD thesis) showed that sheep urine could stimulate organic matter turnover in heathland soils especially where vegetation removal was occurring. Worrall et al (2007a) using the same plots as Ward et al (2007) observed no significant difference in DOC concentrations in soil solutions in grazed and ungrazed plots during the period April to September 2005, i.e. during the period of grazing as opposed to the period when grazers are not roaming the uplands. Clay et al (in
A review of current evidence on carbon fluxes and greenhouse gas emissions from UK peatlands
31
press) studied the Moor House plots further and showed that over three years the average difference in C budget between grazed and ungrazed sites was +36 tonnes C km-2 yr-1, i.e. that removing grazing from the Hard Hill site would increase the size of the carbon source. From the results for Hard Hill this apparent improvement in carbon budgets with grazing is probably due to more vigorous plant growth on the lightly grazed site. However, the meta-analysis (Table 9) supports a view that grazing removal has a high probability of resulting in an improved C and GHG budget. It should be noted that the impacts of grazers may be more than these experiments can measure and in reality they can only measure the indirect effects of grazers (especially sheep), which are typically due to trampling and vegetation removal. However, sheep, and indeed other grazers, are associated with several C flow processes. Although no study has put these processes together as a C budget several studies have interpreted these in terms of both energy and dry matter production (e.g. Perkins 1978). Most of these studies consider respiration and fermentation only as energy flows and not as mass loss. Given these types of published information it is possible to re-interpret them in terms of C flows. Firstly, we can look up standard values of the C concentration of each pathway so that a dry matter exchange can be calculated as a C exchange. Secondly, the sheep converts some of its consumption to CH4 via fermentation and so the GHG warming potential of CH4 relative to CO2 has to be accounted for using standard values (Houghton et al 1995). Thirdly, not only does the sheep convert plant primary productivity into CO2, CH4, wool and meat but also into faeces and urine. Plant primary productivity will produce litter which is relatively refractory, i.e. less-readily turned over in the environment, compared to dung and urine, and so the sheep is converting C into a form that is more readily decomposed and lost from the environment. The relative turnover rates of urine and faeces C relative to leaf litter is not known and so we made the conservative assumption that there is no difference between faeces/urine and plant litter. If it is assumed that sheep graze at an intensity of between 0.66 and 1 ewe ha-1 then the loss of C is between 1994 and 3021 tonnes CO2 eq. km-2 yr-1. A further impact of sheep grazing is that the presence of sheep restricts the capacity of the biomass to grow and regenerate and therefore, at steady state, the above ground biomass will be less where there are grazers as opposed to where there are not. In order to model this effect the growth curve of biomass is considered when there are no grazers present versus when they are present. The sheep eat a proportion of biomass present each year equivalent to their energy requirement. If the following assumptions are made: firstly if the biomass data for Moor House is chosen, which is a combination of Calluna vulgaris, Eriophorum and Sphagnum (Forrest 1971); secondly that sheep stay on the hill for 180 days of the year (the sheep over winter off the uplands); and thirdly that the grazing intensity is between 0.66 and 1 ewe ha-1, then it would mean a biomass foregone of between 27 and 51 tonnes C km-2. This loss is only a sink or source of C in transition between grazing states. It should be noted that the biomass foregone approach predicts there are grazing intensities at which there is no biomass foregone. This would be about 0.25 ewes ha-1 and it might be that this is considered as a carrying capacity. However, this concept of biomass foregone is only true for the biomass curve for Moor House which is dominated by Calluna which is both a relatively slow growing species and a species that is not a preferential food for sheep unless grasses are not present. For more realistic calculations information for grass species would be required. It should be noted that in the context of emissions factors it is not possible to perform a life cycle analysis as agricultural production, i.e. the emissions from the animals, are accounted for separately from land use and land use change. Furthermore, grazers can function on a range of vegetations and so when considering grazed land or the transitions related to grazing we could be considering peatlands under differing vegetations. Of perhaps particular concern in the UK is the behaviour of peatlands under Molinia caerulea.
A review of current evidence on carbon fluxes and greenhouse gas emissions from UK peatlands
32
Several UK projects have encouraged incursion of animals such as Polish Konik ponies, sheep, cattle and water buffalo to manage fen vegetation. Work is needed to determine the total C and GHG budget of such grazing practices, including the animals within the budget. Summary i There is one complete controlled study of grazing on GHG budgets of a peatland
which can be considered at steady state, and which case the emissions factor for adding grazing to a site would be -1.3 tonnes CO2eq ha-1 yr-1.
ii However, this emissions factor is for a very lightly grazed site and it contradicts the
suggestion of the meta-analysis that there is a high probability of grazing removal resulting in an increased sink of C to the peatland.
iii There are several clear research gaps:
a There is only one site where the complete information for GHG budget for grazing exists.
b There is no information upon the impact of grazing intensity. All studies so far have focused upon presence/absence of grazing, but what would be the emission factor of, for example, halving the grazing intensity at a site?
c There have been no studies of ‘biomass foregone’ through sheep grazing d There are no studies that consider the impact of simply displacing the grazing to
a non-peatland site and so consider the actual impact, which is the difference between their impact while on a peatland compared to their impact in the setting to which they are moved.
e There no studies of grazed land relative to different vegetation types. f Although agricultural production appears separately from land use, land use
change and forestry in the UK GHG inventory reporting, not considering the implications of grazing change for agricultural production would give a misleading view of its impacts.
iv The research case addresses issues for grazed land in section 3.3.3. 2.3.5 Forested peatland Within this land use we are considering the transition to and from the forested state (i.e. afforestation and deforestation) as well as the forested state itself. However, it should be noted that commercial forestry has a cycle of planting and harvesting that can last 70 - 100 years. Over the last century, substantial areas of upland blanket bog (notably in Wales and the Scottish Flow Country) and raised bog (e.g. Flanders Moss, Stirlingshire, and Foulshaw Moss, Cumbria), have been planted with fast growing coniferous species (Table 3). However, increasing realisation of the conservation of value of peatlands and the introduction of the EU Habitats Directive resulted in a change of planting regime. Since 1990 there has been a steep decline in new plantings on deep peat soils and clear guidelines have been written by the Forestry Commission. The UK Forestry Standard (Forestry Commission, in press), includes a general presumption against woodland creation on soils with peat, and on sites that would compromise the hydrology of adjacent bog sites. In Scotland there is a general presumption against woodland creation on soils with peat exceeding 50cm in depth, (exceptions may be appropriate, for areas of woodland expansion which are likely to have both significant environmental or scenic benefits and relatively low potential impacts on greenhouse gases). In summary, this guidance discourages new planting on; (i) active raised bog and degraded raised bog capable of restoration to active status, and (ii) extensive
A review of current evidence on carbon fluxes and greenhouse gas emissions from UK peatlands
33
areas of active blanket bog or any associated peatland where afforestation could alter the hydrology of such areas. The Forestry Commission will also encourage the conservation of peatland habitats within forest as part of the design and management of open ground. The values reported above (Table 2) suggest that the c. 2,500km2 of peatland planted with conifers in the UK is similar to the 2000km2 of peatland planted in the Republic of Ireland (Byrne and Farrell 2005), but is small compared to the 150,000km2 of all the northern European peatlands that have been drained for forestry purposes (Paavilainen and Paivanen 1995). Hence it is in the Nordic and Baltic countries that most research on the impact of forestry on the C dynamics of peatlands has been carried out. However, caution should always be applied when applying results obtained from studies in the boreal peatlands of northern Europe to temperate bogs in the UK. In the UK, peatlands were often drained, ploughed and planted with coniferous species, usually Sitka spruce Picea sitchensis, and the original ground flora was impacted. The subsequent development of shading to the ground flora during preparation and planting of the trees means that most plantations on peatlands have very little under storey. In comparison, as noted by Laine et al (2009) peatland forestry in boreal areas is mainly based on the management of natural tree stands, which means that the soil and natural vegetation undergoes less disturbance, other than the installation of drainage ditches used to increase productivity of the forest. Many studies that have investigated the effects of drainage on forested boreal peatlands suggest that they become stronger C sinks, and the meta-analysis suggests there is an 89% chance of afforestation leading to an improved GHG sink (Table 10). Drainage lowers the groundwater leading to an increase in oxygenation and thus decomposition of the organic matter (Clymo 1983), resulting in higher fluxes of CO2 and lower fluxes of CH4 (Cannell et al 1993; Arnold et al 2005). However, as well as affecting GHG emissions, drainage increases net primary production of the tree biomass, and, therefore C accumulation in the vegetation (Cannell et al 1993; Laiho and Lain 1997). Thus, when NEE was compared with the flux of GHG from three drained forested peatlands and an undrained peatland in southern Finland (Arnold et al 2005), the undrained peatland was found to be a net source of C, while all the drained forested sites were a net sink of C, the strength of which increased with productivity (Table 11). This supports the findings of Minkkinen et al (2002) who claimed that altered exchange rates of GHG due to drainage of forested peatlands have decreased the radiative forcing (i.e. warming potential) of Finnish peatlands and that of Byrne et al (2004) who estimated that forested bogs have an average GWP of -10.5 tonnes CO2 eq km-2 yr-1 over a 100 year time period. Table 10. The summary of studies results included in the meta-analysis for afforestation on peatlands. The figures in brackets refer to the number of studies from the UK.
In the UK the most comprehensive information on whether afforested peatlands act as a source or sink or C was compiled by Hargreaves et al (2003), who estimated annual NEE of CO2 over peatlands that had been ploughed, drained and afforested with coniferous trees one, two, three, four, eight, nine and 26 years previously by extrapolating data collected over two to four weeks at each site using relationships observed between daytime fluxes and solar radiation and night time fluxes and air temperature at an undisturbed peatland. The C exchange between the atmosphere and the peatland was determined by the difference between the overall C flux and the amount of C accumulated in the tree and tree litter, which was estimated using a C accounting model. Data in Table 12 indicate that while undisturbed peatlands may change from a small C sink to a source a few years following afforestation, they return to being a sink again once ground vegetation recolonises and after eight years, the trees dominate the budget and afforested peatlands absorb up to 500 tonnes C km-2 yr-1. However, no consideration was given to CH4 and N2O fluxes or C losses via the aquatic route, which may be large immediately after planting and harvesting given the potential degree of disturbance to the peat. However, all the studies included represent the early years of the new land use and reflect transitionary sinks. Cannell et al (1993) and Hargreaves et al (2003) make it clear that afforested sites eventually (within 90-190 years?) become net sources and without a change in land use, would continue as such in perpetuity. Emission factors should reflect the full life cycle. If afforestation were to prove irreversible in terms of GHG fluxes, emission factors would have to be very high to cover their long-term GHG cost. Although it is widely accepted that drainage of peatland increases the CO2 flux to the atmosphere, Byrne and Farrell (2005) observed no increase in the CO2 flux at a recently afforested peatland in Ireland as drainage had failed to lower the water table sufficiently. They also observed that the CO2 flux varied between tree species. Table 12. Estimated net C flux at four stages of afforested peatland development (from Hargreaves et al 2003).
Age (years) State Net C flux (tonnes C km-2 yr-1)
0 Undisturbed -250 2-4 Newly ploughed, drained and
A review of current evidence on carbon fluxes and greenhouse gas emissions from UK peatlands
35
Table 13. The summary of studies results included in the meta-analysis for deforestation on peatlands. The figures in brackets refer to the number of studies from the UK.
GHG budget 0.07 The above analysis of afforestation may suggest that the restoration of afforested peatlands is not necessary from a C sink and GHG perspective and that deforestation would offer a low probability of GHG benefit. Indeed, the meta-analysis suggests that deforestation gives a very low chance of GHG benefit (Table 13) but the overriding impression given by the meta-analysis is that there are very few studies of any C or GHG uptake and release pathways. Laine et al (2009) noted that very few studies include aquatic fluxes of C or the fate of the harvested timber in their C balance. When the trees are felled the site will, at least temporarily, become a net source of C, as trees are no longer sequestering C, and the on-site remains of the felled trees provides a source of C for aerobic decomposers, leading to the production of more CO2. However, Reppo et al suggest that residue (such as stumps) may be long lived in colder boreal environments. Clear felling can have a significant effect on the C and GHG budget of afforested peatlands by altering environmental factors which have an effect on these fluxes, such as water table height, soil temperature and root activity, resulting in an increase in CH4 and N2O emissions (Zerva & Mencuccinni 2005). Studies in England (Zerva & Mencuccinni 2005) and Ireland (Byrne & Farrell 2005) both observed a large reduction, 30 and 50%, respectively, in the gaseous CO2 flux from the soil directly to the atmosphere from clear-felled sites compared to mature stands of Sitka spruce, which both studies attributed to the lack of living fine roots and the cessation of root respiration. Zerva & Mencuccinni (2005) also observed an increase in soil CH4 and N2O emissions after clear felling, whereas Huttunen et al (2003) observed that clear felling led to a short-term increase in the N2O flux at a forested site in Finland, while no significant change in CH4 flux was observed. Clear-felling has also been observed to lead to a significant increase in DOC concentrations in streams draining blanket peat (Cummins & Farrell 2003). However, this discussion on deforestation assumes that it is possible to re-instate the C and GHG sink function. This has not yet been proven. Summary i According to the meta-analysis afforestation is the most studied of all the
managements that could be considered in this review. ii However, no complete controlled budget of the transition to forest or of the state of
being forested exists for the UK.
A review of current evidence on carbon fluxes and greenhouse gas emissions from UK peatlands
36
iii Conversely, deforestation is the least studied of the managements that could be considered in the meta-analysis, but as for afforestation there is no complete and controlled study of peatland that is undergoing deforestation or has been deforested.
iv Given the cycle in forest plantation in the UK after the Second World War a study of
both the forested state and the process of deforestation and its implications for peatland restoration should be a priority.
v Deforestation will always have to be considered in the context of the options for the
use of the harvested timber, replanting or restoration to peat bog in order to give an appropriate emissions factor reflecting a life cycle analysis of the site C, even if such processes have to be accounted separately as part of inventories.
vi The research case addresses issues with regard to forested land in section 3.3.4. 2.3.6 Bare and re-vegetated peatlands In this case we consider two steady-states (bare peat soil and revegetated peat) and the transition between. It could be argued that revegetation is always a transition back to a semi-natural or undamaged state; however, given the nature of the data available it is at present worth considering as the twin of the bare peat soil The degree of vegetation or revegetation of a peatland is the dominant control on POC flux, either through its role in limiting sediment production on intact surfaces or in reducing slope-channel linkage, i.e. breaking up the pathway eroded sediment would take before reaching a stream, in eroding but re-vegetating systems (Evans et al 2005). In some environments, POC removal by wind erosion is important or large peat blocks may erode downstream during stream bank collapse events but neither of these is detected by most C sampling strategies (Evans and Warburton 2001; Warburton 2003). In the UK, peat stabilisation work (e.g. using geotextiles or brash) to reduce erosion and enable revegetation usually takes place in the uplands but also the Great Fen Project and the New Forest LIFE 3 project both involve stabilisation work (www.greatfen.org.uk). Examining the meta-analysis (Table 14) shows some unexpected results. In some cases use of lime to aid establishment of vegetation caused a decrease in soil respiration as reported by Keller et al (2005). In other cases we see a rise in both soil respiration and primary productivity, the rise in soil respiration is due to a rise in root respiration as the vegetation returns or due to lowering of the water table as transpiration develops. The presence of vegetation seems also to increase CH4 fluxes; this could be due to increased root exudates upon the return of vegetation and/or the role of plants in transporting methane from the water table to the atmosphere. The recovery of vegetation limits soil erosion and so POC fluxes decline, but the evidence for a change in DOC is equivocal. The meta-analysis suggests that there is 70% chance of C budget improvement but only a 54% chance of GHG improvement.
A review of current evidence on carbon fluxes and greenhouse gas emissions from UK peatlands
37
Table 14. The summary of studies results included in the meta-analysis for revegetation of peatlands. The figures in brackets refer to the number of studies from the UK.
GHG budget 0.54 Rowson et al (in press) considered the C budget of peat covered sites on Bleaklow, Peak District, after revegetation following degradation by past wildfires and overgrazing. The study measured the C budget of eight sites: four restored-revegetated sites, two unrestored bare soil control sites, and two intact vegetated controls over two years (2006-2008). The study considered the following flux pathways: DOC; POC; dissolved CO2; primary productivity; net ecosystem respiration, and CH4. The study shows that bare peat sites had significant C losses as high as 522 tonnes C km-2 yr-1 and that revegetation resulted in an improvement in the C budgets with one revegetated site achieving a C budget after four years that was more negative than that of the vegetated control sites. The C benefit of peatland restoration in heavily degraded systems such as this may be predominantly avoided loss, i.e. the effect of revegetation is to change a large source into a small source of C or GHG rather than converting a net source into a net sink, but could be up to 833 tonnes C km-2 yr-1. Summary i There is only one site where an emissions factor for bare soil can be derived, in which
case the emissions factor would be +9.8 (±4.8) tonnes CO2eq ha-1 yr-1. ii There is only one site where an emissions factor for revegetated peatlands can be
derived, in which case the emissions factor would be +5.5 (±2.4) tonnes CO2eq ha-1 yr-1.
iii There is information from only one location for the derivation of these two emissions
factors. iv The meta-analysis suggests that the probability of improvement in C/ GHG flux upon
revegetation is relatively low which appears to be because (a) the use of lime would appear to offset many gains of revegetation within the time frame of the available investigations, and (b) the meta-analysis technique used here may be misleading in this case, as it equally weights increases in both PP and NER that comes with re-planting yet there is no reason to believe that the increase in PP would not be considerably larger than that in NER.
v However, there is no information upon differences in restoration practise and how
they may alter C or GHG budgets. It remains for future research to determine which technique would be best and to what vegetation type or cover given the need to avoid
A review of current evidence on carbon fluxes and greenhouse gas emissions from UK peatlands
38
lime and offset any decrease in the depth of water table required to support that vegetation.
vi The research needs are addressed in section 3.3.5 of the research case. 2.3.7 Cutover and Restored peatlands Peat has a relatively high energy content and can therefore be used as a source of energy when combusted. Peat harvesting for fuel has been in operation throughout human history and the traditional method of hand-cutting turf and stacking blocks to dry is still in use today in some areas of Ireland and Scotland. However, the major way by which peat is commercially harvested today is milling. In this process, the surface vegetation is removed; the peat is then harrowed and dried before being sucked up by vacuum collectors. Lowland raised bog is the main source of peat for extraction (higher pH and fertility than blanket peat). Milling in the UK has been carried out to supply the horticultural market with peat for inclusion in growing media. However, in the Republic of Ireland, similarly large-scale peat extraction is used to fuel power stations. This extraction to supply the horticultural market has resulted in about 94% of lowland raised bogs in Britain being severely damaged or destroyed by peat harvesting in the 20th Century (Gosselink & Maltby 1990). Peat extraction has a dramatic impact on the biodiversity of peatlands and is also a significant contributor globally to the emission of CO2. Therefore, Defra is committed to preserving the stores of C in peatlands and peat soils (Defra 2007). In addition, the UK government is committed to reducing peat use under the Biodiversity Action Programme and has set targets of total market requirements for soil improvers and growing media to be supplied by non-peat materials. The target for 2005 was set at 40% and was met in that year and the very ambitious target for 2010 was set at 90%. Restoration of cutover lowland raised bogs is occurring, such as at Thorne and Hatfield Moors, where Defra bought out the peat extraction rights in order to end commercial milling of peat at the sites in 2001. Restoration has involved re-wetting the peatland by damming the peat drains and using peat bunds to form water-retaining compartments, averaging three hectares in size, where the water level can be controlled carefully. This encourages the growth of peat forming bog species, mainly comprising Sphagnum mosses and Eriophorum sedges. Several studies have investigated the changes in C fluxes during and after restoration of cutover raised bogs. However, as noted by Baird et al (2009), different components of the C balance are often reported in different papers and it can be difficult to determine whether the study site referred to in one paper is exactly the same as that reported in another. For example, Waddington and Day (2007), Waddington et al (2008) and Waddington et al (2010) report on CH4 emissions, DOC fluxes and NEE, respectively, from a boreal cutover bog, Bois des Bel in Québec, Canada for one year pre-restoration (1999) and a number of years post-restoration (2000-2002). Compiling the data from each paper in Table 16 highlights that the restored site changed from a source of CO2 to a small sink of CO2 during the 2000 growing season and a slightly larger sink during the following year (20 tonnes C km-2), while the cutover site remained a source of CO2 during the growing season, although substantial inter-annual variability occurred. The increase in the net C sink strength at the restored site coincided with a substantial increase in vegetation cover from 22% to more than 90% in the third year following restoration. However, combining these results in the meta-analysis shows that because restoration of cutover peatlands leads to increases in CH4 flux the probability of GHG benefit is restricted (Table 15).
A review of current evidence on carbon fluxes and greenhouse gas emissions from UK peatlands
39
Table 15. Annual fluxes (tonnes C km-2 yr-1) of CO2, CH4 and DOC from the cutover and restored areas at Bois des Bel, Quebec, Canada.
Table 16. The summary of studies results included in the meta-analysis for restoration of cutover peatlands. The figures in brackets refer to the number of studies from the UK.
GHG budget 0.37 Summary i There is no reviewable data from the UK, and therefore no emissions factor can be
derived. ii Evidence from overseas suggests that CH4 fluxes as a result of restoration will be
problematic and may outweigh any other improvements in the GHG budget. iii However, we would suggest that there remains a strong case for the restoration of
the UK’s remaining cutover peatlands to meet habitat restoration objectives and other ecosystem services as restoration of these predominantly lowland areas would otherwise be slow on a human timescale.
iv Research needs are addressed in section 3.3.6 of the research case. v Land uses/transitions where there is no available information on GHG and C flux a Cut or Mowed peatlands Cutting and mowing are commonly used as an alternative to burning and compared to burning cutting has the advantage of no risk of runaway wildfires or of hot burns destroying litter or soil reserves of C. The cutting or mowing of vegetation is distinct from burning in many ways:
A review of current evidence on carbon fluxes and greenhouse gas emissions from UK peatlands
40
• in that in order to save cost the cut biomass is typically left on the site, where it is likely to lead to increases in respiration;
• However,the biomass left behind can also be considered as a C input and will add to the litter layer;
• Furthermore, the presence of cut vegetation may act as mulch and keep underlying peat soils wet and help prevent surface erosion.
There is no information in Table 2 as to the spatial extent of vegetation cutting on peat soils as an intervention. The review could not find any studies covering the effects of vegetation cutting on C or GHG budgets. As an approximation we could assume that it was similar to that of burning, i.e. vegetation removal would result in loss of biomass and cause rises in the water table but would not promote fire resistant species. Cutting is less like grazing as grazing is a slow attrition of the vegetation with vegetation still largely present whereas cutting is usually a rapid removal of vegetation by mowing or flailing to near the ground surface (as in preparation for well managed burns). It is possible therefore, we could assume that cessation of cutting would be a C benefit unless the cuttings are left and that they former a mulch and an extensive litter layer. Summary i There is no information for vegetation cutting upon which to base an emissions factor
or to understand the likelihood of GHG improvement. ii If cutting becomes a serious alternative management intervention to burning then
information on the impact of cutting upon the GHG and C balance will be needed. iii The research case addresses this in section 3.3.7. b Gullied and Hagged peatlands Gullied or hagged peat represent another possible sub-class of the eroded land considered in Tables 2 through 4. Information on the spatial extent of gullied and hagged ground as opposed to bare soil has been collected as part of Natural England’s survey of England’s peat soils. In the absence of further information emissions factors for bare soil maybe a conservative approach; however, hagged and gullied peat maybe a more extensive type of peatland than bare soil. Summary i No information exists for this land-use of for the transition from or to gullied land.
ii This issue is addressed in section 3.3.5 of the research case alongside the
discussion of bare soil research. c Peatlands converted to agriculture Given the analysis in Tables 3 and 4 perhaps the most important land management that this review could not consider is that conversion to agriculture through ploughing or conversion to improved pasture. This could not be included because we found no literature on the subject. What literature was available was not for the UK and so any emissions factors would be based upon values from Bryne et al (2004).
A review of current evidence on carbon fluxes and greenhouse gas emissions from UK peatlands
41
Summary i It is clear that there is a complete lack of information in these settings and given the
predicted emissions in Table 4 these would be a high priority for any future research programme.
ii The research gaps identified are addressed in section 3.3.8 of the research case. d Other settings without information Some important peat land-use or managements have not been considered in this review. This is partly because, as above, there are no studies but also because they could be considered as being made up of elements of other land management that have been analysed in this review. For example, the impact of wind farms upon the C or GHG budgets of peat soils could not be explicitly included in this review as there are no published studies but it might be that the impact of wind farms is made of such components as drainage and the presence of bare soils. 2.3.8 Summary of meta-analysis The meta-analysis is summarised for all studies in Table 17 and for UK studies only in Table 18. Table 17. The summary of the meta-analysis of all studies. The figures in brackets refer to the variance in the probability estimate. Management Probability of C
A review of current evidence on carbon fluxes and greenhouse gas emissions from UK peatlands
42
Table 18. The summary of the meta-analysis of UK studies. The figures in brackets refer to the variance in the probability estimate. Management Probability of C
It should be noted that when no studies exist for a particular land use or management then the prior beta distribution will default to a 50% probability of improvement, i.e. it is 50:50 whether either an improvement or deterioration will be achieved; furthermore this estimate has a variance of ±50%. However, for clarity of interpretation, where there is no data that has been stated in the table (Table 18).
2.4 Influence of land management on C and GHG fluxes from peatlands - modelling evidence
All modelling results analysed here come from the Durham Carbon Model as described in Worrall et al (2009a). 2.4.1 ‘Pristine’ peatlands When considering the output of the Durham Carbon Model, the C budget of those grid squares within the modelling where there was no burning, grazing, drainage, afforestation or any other management intervention were collated. The C budget was then regressed against the altitude of the grid square; the percentage peat cover, and the percentage of bare peat soil. The resulting equation tells us about the expected C budget at any altitude.
Where: Ctotal = the total C budget (tonnes C km-2 yr-1); A = altitude (m above sea level; asl); fpeat = the fraction of the grid square that is peat soil; and fbaresoil = the fraction of the grid square that is bare soil. All variables are significant at least at the 95% level and r2 = 96%. When there is 100% peat soil and no bare soil, then:
8.138087.0 −= ACTotal (iv)
This means that the maximum C budget that would be achieved at sea level would be -136.8 tonnes C km-2 yr-1 and that the average lapse rate of 8.7 tonnes C km-2 yr-1 100 m-1. The range of A for the regression is 109 to 550m asl. It should be noted that this approach predicts that there would be no ‘Pristine’ peatlands that are net sources of carbon within the range of altitudes found in the UK which does not match with the observation in Table 5. However, equations (iii) - (iv) are not vegetation specific and so one of the major causes of
A review of current evidence on carbon fluxes and greenhouse gas emissions from UK peatlands
43
variation in Table 5 maybe the vegetation on the site that has been taken as ‘Pristine’ for that area may not be suitable for continued peat formation or expected ongoing C/GHG status, and in some cases sites in Table 5 are mature to degenerate Calluna which cannot be considered a peat forming species, although remains are found in peat. 2.4.2 Drained peatland From the computer modelling, the presence of drainage makes a significant difference (P of no effect < 0.05) to the model outcome and decreases the C budget by -4.8 tonnes C km-2 yr-
1 - averaged across all other conditions. When grazing is present the effect of drainage is 10.1 tonnes C km-2 yr-1, but when it is absent the effect is -0.6 tonnes C km-2 yr-1, i.e. when there is no grazing drainage could slightly improve C budgets. When burning is also present then the effect of drainage is 15.3 tonnes C km-2 yr-1 but when it is absent the effect of drainage is -5.8 tonnes C km-2 yr-1, i.e. drainage may slightly increase C budget when burning is not present. In terms of the equivalent GHG budget, drainage would be expected to result in a decrease in the budget due to the decline in CH4 emissions and modelling suggests that drainage of a pristine peat would decrease equivalent CO2 emissions by 19 tonnes CO2 equivalent km-2 yr-1. It is beyond the remit of this review for detailed discussion of what the mechanisms behind these proposed emission factors might be. Results from the Durham Carbon Model for drain-blocking will be the reverse of those for drainage at a steady state. Therefore, the model predicts that drain-blocking decreases the C budget by -4.8 tonnes C km-2 yr-1. When grazing is present the effect of drain-blocking is -10.1 tonnes C km-2 yr-1, when it is absent the effect is 0.6 tonnes C km-2 yr-1, i.e. when there is no grazing drain-blocking could slightly improve C budgets. When burning is present then the effect of drain blocking is -15.3 tonnes C km-2 yr-1 while when it is not present the effect of drain-blocking is 5.8 tonnes C km-2 yr-1, i.e. drainage may slightly increase C budget. In terms of the equivalent GHG budget drain-blocking would be expected to increase the budget due to the increases in CH4 emissions, in this case an increase in emissions of 19 tonnes CO2 equivalent km-2 yr-1. A recent study by Worrall et al (2009b) has suggested that in terms of reducing GHG emissions drain-blocking was only successful 20% of the time. 2.4.3 Burnt peatland Output from the Durham Carbon Model shows that the presence of burning decreases C sequestration by an average of 83.4 tonnes C km-2 yr-1. Burning has a significant, but small interaction with both grazing and drainage. With respect to grazing, when there is no grazing the effect of burning increases to 89.4 tonnes C km-2 yr-1. When draining is present the effect of burning increases to 93 tonnes C km-2 yr-1. This first approach to modelling does not include any changes in the C stocks at the time of the burn. All types of fire will lead to a loss of biomass which may also be accompanied by the loss of C from the layers and the peat itself. None of the studies above considered the production of char during the burn as a C flux and a means of additional GHG storage. Through a number of studies on burns it has been possible to estimate the extent of char production. Considering a wildfire in the Peak District in 2008, Clay and Worrall (in press) have shown that 13% of the pre-burn biomass survived the fire (the above model assumed 0% survival) and of this 13%, 4% was char. Given typical biomass for a shrub-dominated moorland these percentages would represent a 6.4 tonnes C km-2 as char and 15.4 tonnes C km-2 as standing dead biomass. 2.4.4 Grazed peatland From the modelling approach, the presence of grazing decreases the C budget by -3.6 tonnes C km-2 yr-1. When there is drainage present the effect of drainage increases to 8.9
A review of current evidence on carbon fluxes and greenhouse gas emissions from UK peatlands
44
tonnes C km-2 yr-1 while when there is no drainage present the effect of grazing is only 1.1 tonnes C km-2 yr-1. When there is burning present the effect of grazing is 1.1 tonnes C km-2 yr-1 but when burning is not present then the effect of grazing is 6.1 tonnes C km-2 yr-1. With respect to GHGs it would be expected that grazing removal would decrease emissions. 2.4.5 Forested peatland For the modelling approach to understanding the impact of afforestation we must consider the biomass separately. In a project based in the Galloway Forest10, the average change of the C export from peat soil due to afforestation was 194 tonnes C km-2 yr-1 (-59 tonnes C km-2 yr-1 for pristine peat in the area compared to 134 tonnes C km-2 yr-1), i.e. planting of coniferous forest causes a transition from small C sink to large C source with respect to the soil. The C stored in the trees is critically dependent upon age and the growth rates of the trees which do vary. Again using data from the Galloway Forest it is possible to see that the maximum C sink will exist for this setting between 20 and 70 years (Figure 4), but after 80 years the forest biomass is mature. For the Galloway case where the forest biomass is included and given the stand age distribution of this particular forest area shows that the C budget has risen from an average of -59 tonnes C km-2 yr-1 to -253 tonnes C km-2 yr-1, but it should be reiterated that this advantage would reduce with time. These calculations do not include the possibility of use of harvested wood for fossil-fuel intensive product substitution, or woodfuel.
Figure 4. The aboveground biomass of plantation forest in Galloway over the growth of the trees. From the modelling perspective and given the biomass curve in Figure 4 the loss of primary productivity can be predicted and there would be an optimum harvest time which in the case shown in Figure 4 would be at 80 years of age. The presence of bare soil and the role of
A review of current evidence on carbon fluxes and greenhouse gas emissions from UK peatlands
45
revegetation are discussed later. But deforestation may form part of a product substitution programme and so if the deforestation occurred at the optimal growth stage (e.g. 70 years old - Figure 4), there was replanting and the products then used to substitute for GHG producing products then deforestation, like afforestation, could show C benefit. As an alternative, we could propose that if deforestation could occur at optimal growth stage, that the harvested wood is used for product substitution or woodfuel; that the harvested area is restored with revegetation and perhaps blocking of drainage; and that the harvested trees are replaced but planted on mineral soils then the C benefits may be maximised. 2.4.6 Bare and revegetated peatlands From the modelling approach for pristine soils (Equation (iii)) the following significant relationship was found:
Equation (v) can be used to assess the impact of revegetation, given that equation a 1% decrease in bare soil leads to 2.1 tonnes C km-2 yr-1 improvement in the C budget. However, equation (iii) considers only the pristine subset within the dataset, when considering all data, i.e. including those where there was recognisable management such as burning, the equation becomes:
In this case the C budget lapse rate is 4.3 tonnes C km-2 yr-1100m-1, and the bare soil rate has increased to 3.7 ± 0.1 tonnes C km-2 yr-1 % bare soil-1. However, is there an interaction effect in which revegetation is more or less effective at greater altitude? Therefore, equation (iii) is recalculated with an interaction term A*fbaresoil and the equation becomes:
This would imply that the interaction although significant is slight i.e. the bare soil rate is 4.9 ± 0.4 tonnes C km-2 yr-1 decreases by 0.27 tonnes C km-2 yr-1 for every 100m decrease in altitude and so revegetation has a bigger effect at greater altitude. 2.4.7 Other settings At present there are no modelling results for the restoration of cutover peat bogs or the other settings discussed above. 2.4.8 Summary i It is also possible to summarise the results as GHG emissions factors in contrast to
those given above in Table 4 (see Table 19 & 20). ii It should be remembered that the model used to derive this information has been
developed for two sites only and has now published validation. iii It should be a priority for research to develop, improve and validate models of the
GHG balance of managed peatlands. The development of models is considered in section 5.3 of the research case.
A review of current evidence on carbon fluxes and greenhouse gas emissions from UK peatlands
46
Table 19. Summary of C (not CO2 eq) emission factors derived from the Durham Carbon Model.
Management From modelling (tonnes C ha yr-1)
Afforestation Peat soil +1.94a Above ground
biomassb -3.87
Deforestation - Drainage Average -0.05 Grazing
present +0.1
Grazing not present
-0.01
Burning present
+0.2
Burning not present
-0.06
Drain-blocking Reverse of those above
Grazing removal
Average +0.04
Drainage present
-0.09
No drainage present
-0.01
Burning present
-0.01
Burning not present
+0.06
Managed burning
Average +0.8
Grazing not present
+0.9
Drainage present
+0.9
Revegetationc -3.7 a A positive number means that the carbon net sink size decrease and or the net
source size increase. b Assumes trees are in maximum growth phase, i.e. between 10 and 80 years old. c Assumes revegetation from 100% bare soil.
A review of current evidence on carbon fluxes and greenhouse gas emissions from UK peatlands
47
Table 20. Summary of emission factors derived from the literature review presented above.
Management Emission factor (tonnes CO2 eq ha yr-1)
It should be noted that given these revised emission factors, and those given earlier (Table 3) the total GHG flux from UK peatlands would be 3.72 Mtonnes CO2 eq yr-1.
2.5 Influence of other factors on C and GHG fluxes from peatlands Other factors not directly related to management can also affect C and GHG fluxes from peatlands. The most important of these are probably changes in atmospheric sulphur and nitrogen deposition and climate. This study assumes that economic changes that result in shifts in the viability of one land management over another have been considered above in the review and meta-analysis of the management impacts. 2.5.1 Atmospheric Deposition Over the last century, atmospheric deposition of S over the UK increased to a peak around 1970, and then decreased dramatically; between 1986 and 2006 anthropogenic S deposition fell by 80% (RoTAP 2010). Over the same time period total N deposition has remained approximately constant, at greatly elevated levels relative to the natural baseline (Fowler et al 2005). The large change in S deposition, and continuing high levels of N deposition, has had several effects on the C cycle of peatlands. Because anaerobic conditions below the peatland water table limit oxygen supply, and hence organic matter decomposition, decomposer organisms must use other electron acceptors to obtain energy from organic matter. In anaerobic ombrotrophic peatlands decomposition is usually dominated by fermenters that break down labile organic compounds to acetate, other simple organic compounds and hydrogen. Certain types of fermentation produce CO2 as well as other organic carbon compounds. Depending on the availability of sulphate, these fermentation products are then used by sulphate reducers (sulphate-reducing bacteria (SRB)) or by methanogens, which transfer electrons to SO4
2- or CO2 to produce hydrogen sulphide (H2S) or methane (CH4), respectively and some CO2. However, in the presence of sulphate reducing bacteria the presence of sulphate will mean the suppression of methanogenesis. Thus, in peatlands where atmospheric S deposition is low, methanogenesis is the dominant anaerobic C mineralization pathway. However, S deposition on peatlands in Europe and North America increased rapidly during the 20th century as a result of increased emissions of sulphur dioxide (SO2) from industrial combustion. This increase in SO4
2- deposition has the potential to enhance the importance of SO4
2- as an inorganic electron acceptor, and therefore divert substrate flow away from methanogenesis, thereby reducing CH4 flux to the atmosphere.
A review of current evidence on carbon fluxes and greenhouse gas emissions from UK peatlands
48
A number of field and laboratory experiments have investigated the impact of SO42-
deposition (1 to 15 tonnes S/km2/yr, applied as either a single dose or in small, regular pulses that mimic rainfall, on CH4 emissions and/or sulphate reduction rates (e.g. Dise and Verry 2001; Fowler et al 1995; Gauci et al 2002 2004a; Vile et al 2003; Watson and Nedwell 1998). Although the peatlands differed in their hydrological characteristics, vegetation, climate, and CH4 emissions, all of these experiments showed that SO4
2- suppressed CH4 emissions (with respect to control cores/sites) by up to c. 50%. Gauci et al (2004b) showed that a linear relationship existed between rates of atmospheric deposition up to about 3 tonnes S/km2/yr and suppression of CH4 emissions, but no further increase in suppression occurred with further increases in deposition. This relationship is similar to that reported by Vile et al (2003) between SO4
2- deposition and SO42- reduction rates in peatlands, which
shows that sulphate-reducing bacteria are limited by something other than SO42- availability
above about 2.5 tonnes S/km2/yr. Overall, the results from all the studies reviewed here strongly suggest that SO4
2- deposition from acid rain plays an important role in regulating CH4 production in, and therefore emission from, peatlands. However, other factors have also been found to be important in controlling the extent to which SO4
2- inputs suppress CH4 emissions. These include temperature (Gauci et al 2002 2004a; Nedwell and Watson 1995) position of the water table (Gauci et al 2002), quality of the peat organic matter, and the growth and senescence of the vascular plants. The large recorded decreases in UK sulphur deposition could result in higher rates of CH4 emissions from UK peatlands. However, the response to declining inputs of atmospheric SO4
2- may be delayed as the sulphur retained in the peat will act as a long-term source of SO4
2- through cyclic reduction/oxidation due to water table fluctuations. Flux of DOC is also affected by changes in S deposition. Over the last 20 years, concentrations of DOC have risen in freshwaters across areas of NE America and NW Europe (Skjelkvåle et al 2005), with particularly large and consistent increases in the UK (Evans et al 2005; Worrall et al 2004). A number of potential driving mechanisms have been proposed, many of which are linked to climate change. These include increased biological production of DOC by warming and drying (e.g. Freeman et al 2001a), changes in the distribution and volume of rainfall on the hydrological regime, including increasing flow volumes and changes in flow pathways (e.g. Tranvik and Jansson 2002; Erlandsson et al 2008; Lepistö et al 2008) and, increased biological activity due to elevated atmospheric CO2 (Freeman et al 2004). While all of these factors influence DOC, Evans et al (2006) showed that the changes in temperature and CO2 across the UK were too small to account for the observed rate of increase in DOC and that no changes in rainfall and runoff were apparent. This led Evans et al (2006) to suggest that the large decline in S deposition was responsible for the increase in DOC due to its impact on soil solution pH and ionic strength. The decline in S deposition has resulted in an increase in soil solution pH and decrease in ionic strength, both of which leads to an increase in the solubility of DOC. Subsequent analysis of 522 surface waters from across North America and northern Europe and found that rising trends in DOC between 1990 and 2004 can be substantially explained by changes in atmospheric deposition chemistry (Monteith et al 2007). Soil acidification, due primarily to S deposition, may also suppress overall decomposition rates via the effects of increased acidity on vegetation (affecting labile substrate supply) and on decomposition processes via effects on the activity of key enzymes such as phenol oxidase (Sinsabaugh 2010). It has been suggested that this led to increased organic matter accumulation over the ‘acid rain’ peak of the 1960s-80s, followed by accelerated C losses as acidity has declined (Sanger et al 1994; Evans et al 2007). Recent analyses of data from the UK Countryside Survey support this hypothesis, suggesting that temporal changes in soil C are correlated with changes in soil pH (RoTAP 2010). The significance of this mechanism for peats, which are naturally acid, has yet to be determined.
A review of current evidence on carbon fluxes and greenhouse gas emissions from UK peatlands
49
Studies investigating the impact of increased N deposition (all N species) on CH4 emissions have observed contrasting, and often small, impacts of N. Watson and Nedwell (1998) observed that that addition of NO3
- to peat suppressed CH4 production, although this was only statistically significant at additions of 100 µM, which was much larger than NO3
-
concentrations observed in the field, suggesting that NO3- concentrations were less likely to
inhibit methanogensis than SO42-, and nitrate reduction would lead to N2O, i.e. GHG
production. Silvola et al (2003) investigated the effects of elevated CO2 and N deposition on CH4 emissions from five peatlands across Europe, including one in the UK. They observed no consistent effect of N treatment on CH4 emissions across the sites, and all effects were small. In the UK site, the N-enriched and the control plots had almost the same CH4 emissions. In other studies, Granberg et al (2001) observed that atmospheric deposition of N reduced CH4 emissions from peatlands with high sedge cover but had no significant impact at sites with low sedge cover, while Aerts and de Caluwe (1999) and Nykanen et al (2002) both observed an increase in CH4 emissions on the addition of N to nutrient-poor peatlands only. While the direct effects of N deposition on CH4 emissions may be small, the indirect effects via changes in plant community structure may be substantial (Baird et al 2009). Plant communities of blanket and raised bogs are adapted to nutrient-poor conditions, and the addition of increased atmospheric N deposition has the potential to result in increased growth rates, species change and loss of biodiversity. In the UK, Stevens et al (2004) reported a progressive loss of biodiversity along a gradient of increasing N deposition within individual habitat classes, while repeated national-scale vegetation surveys have shown a temporal shift towards more nutrient-demanding species in semi-natural upland systems (Smart et al 2003). Increases in N deposition have been shown to stimulate vascular plant growth at the cost of Sphagnum, with the magnitude of effects greatly depending on the starting conditions (Limpens et al 2008). Limpens et al (2008) suggested that the shift from a Sphagnum-dominated to vascular plant-dominated vegetation type would result in a general decline in C sequestration over the long-term due to increases in litter decomposability (Dorrepaal et al 2005) and heterotrophic respiration (Bubier et al 2007). 2.5.2 Climate change The potential effects of climate change on C cycling in peatland systems are complex. Climate change is being driven by increases in the concentration of atmospheric greenhouse gases, primarily CO2. Increasing CO2 in the atmosphere can itself lead to changes in the biogeochemistry of peat soils. Increased CO2 can enhance plant growth (Freeman et al 2004; Silvola 1985), although some studies have observed no increase in peatland biomass growth under elevated CO2 (e.g. Berendse et al 2001) and in others a change in plant species composition (e.g. Freeman et al 2004) with the abundance of vascular plants increasing relative to mosses. Freeman et al (2004) also observed an increase in DOC release from peat soils under elevated CO2 which they attributed to elevated net primary productivity (NPP), and increased root exudation of DOC. They suggest that the labile C released by roots stimulate microbial activity, leading to enhanced degradation of soil organic matter; this process is known as the ‘priming mechanism’. Moreover, a more than additive effect was found due to the interaction between CO2 and warming, leading to even greater increases in vascular plant dominance, decomposition and DOC release (Fenner et al 2007). There has been much speculation on the response of peatlands to global warming, where increased temperatures are likely to lead to a decline in water tables as well as an increase in peat temperatures. Both of these are likely to lead to an increase in the decomposition of organic matter and subsequent release of CO2 into the atmosphere resulting in a positive feedback to climate change. Under normal peat temperature ranges, CO2 production increases by threefold for every 10oC increase, but this varies with depth and it is not clear
A review of current evidence on carbon fluxes and greenhouse gas emissions from UK peatlands
50
what controls the temperature dependency of C mineralization rates (Blodau 2002). With climate change fluxes of CH4 from temperate peatlands, as opposed to boreal peatlands, would be expected to decline as water tables fall and higher temperature favour CH4 oxidation as much as CH4 production. Most current soil models predict that, in the longer term, rising temperatures will speed up the decomposition of organic C in soil releasing CO2 into the atmosphere (Smith et al 2008b) in excess of any C sequestrated in the soil due to an increase in NPP (Powlson 2005), though some suggest a balance (Smith et al 2005 2006). However, these models are based on data derived from experiments using mineral soils, not organic soils. In addition, these models typically assume that decomposition of all soil organic matter is equally sensitive to temperature (Fang et al 2005). But this remains controversial (Fang et al 2005; Knorr et al 2005; Davidson & Janssens 2006). Decomposition may be slow either because the complex structures of the molecules render them resistant to decomposition or because environmental constraints restrict access of enzymes to the molecules, or a combination of the two (Davidson & Janssens 2006). The presence of high water tables in peats result in low oxygen concentrations that inhibit the activity of phenol oxidase, causing accumulation of phenolic compounds (Freeman et al 2001b). These phenolic compounds inhibit the activity of hydrolase enzymes responsible for decomposition, thus slowing decomposition. However, the inhibition is quickly reversed when peats become aerobic due to a drop in water table. Hence the large amount of C present in peat, which has been accumulating over centuries, is ‘stable’ only as long as anaerobic conditions are maintained. Once the upper layers of peat dry out they become aerobic and available for decomposition. Evidence that this process may already be occurring comes from recent repeated inventories of soils in England and Wales, which shows that peat soils lost C at a faster rate than other soil types over the last 25 years (Bellamy et al 2005). However, the methodology used (loss on ignition measurement of a 0-15 cm fixed depth sample) is not appropriate for measuring peat C stock change (e.g. Smith et al 2007) and a similar re-sampling of soil for the Countryside Survey showed no change in C content. Worrall et al (2007d) used the Durham Carbon Model, as described above, rather than the stocks model discussed above, in order to show that climate change over the next 30 years would mean that the C and GHG budgets of the Moor House catchment declined from net sink to net source. Overall, most studies investigating the impact of climate change on peatland C fluxes have concentrated on gaseous exchange and the role of increased temperature and/or atmospheric CO2. However, changes in rainfall and drought frequency/intensity are less discussed. Changes in water balance will lead to changes in the position of the water table. The greater the depth to the water table, the greater is the depth of oxygen ingress; this has been suggested as leading to increased flux of dissolved CO2 (Jones and Mulholland 1998); demonstrated as leading to increased soil CO2 respiration (Glenn et al 1993, Funk et al 1994 and Bubier et al 2003); and decreased CH4 production and increased oxidation of the CH4 being produced (Huttunen et al 2003). Changes in rainfall could result in changes in runoff and river discharges which, in the UK have been tending to increase (Werrity 2002). Tranvik and Jansson (2002) have suggested that the DOC concentration increases observed by Freeman et al (2001a) could be hydrological changes in discharge being associated with changes in concentrations. This mechanism has been proposed for increases in DOC concentrations in lakes and stream in Sweden during the 1970s and 1980s where increases in DOC concentrations coincided with decreased temperature and increased precipitation. Similarly, a decrease in discharge as opposed to a change in the balance of hydrological pathways, can also explain increased DOC concentrations because of a decrease in dilution. But changes in precipitation can alter the balance of flowpaths in a peat-covered catchment and cause greater flow through areas rich in DOC. However, Worrall et al (2003) have shown that for two long-term time series, not only have there been long term increases in DOC concentration there have also been
A review of current evidence on carbon fluxes and greenhouse gas emissions from UK peatlands
51
increases in DOC flux through the catchment. Alternatively, we could consider that increasing runoff is contributing to the observed increases in DOC flux. Lumsdon et al (2005) has proposed a model of DOC runoff concentration from organic-rich soils based upon DOC solubility, in which case increasing runoff would lead to increasing flux of DOC. Worrall and Burt (2007) have shown that the pattern of DOC flux from the UK, which is dominated by flux from peatlands, can be explained by an underlying increase in air temperature and by changes in river flow. Rainfall is a key driver of POC flux, runoff is the primary agent of peatland erosion and increases in runoff have the potential to trigger fresh erosion through increasing the erosive force on stressed vegetation surfaces and also to exacerbate the rate of POC flux from eroding systems. The former poses much the greater risk as the shift from vegetated to eroded status entail at least an order of magnitude increase in POC flux. Changes of rate of erosion at bare sites will be of a lower order and will be significantly affected by changes in the frequency of high intensity storms which carry a large proportion of total sediment load (Evans & Warburton 2007). There are several lines of evidence to support drought as a distinct driver of change and drought frequency is increasing in the peatlands of the UK (Worrall et al 2006b). Two biogeochemical mechanisms have been proposed that link drought to carbon uptake and release pathways. Freeman et al (2001a or b) have shown that hydrolase enzymes can be de-repressed by declines in the water table and their activity continues even after water tables rise. Alternative biogeochemical mechanism was proposed by Clark et al (2005). The catastrophic lowering of the water table in peat during droughts leads to the oxidation of sulphide minerals to sulphate. The increase in sulphate concentration suppresses the mobility of DOC, as the drought ends this suppression is released, as sulphate is reduced or washed out, and DOC concentrations rise. There are several lines of evidence to support these proposed mechanisms, including: observed change in the relationship between flow and DOC after a severe drought that can persist even through more minor droughts (Worrall & Burt 2004); and decoupled soil respiration and DOC production (Worrall et al 2005a). Alternatively, drought may alter the physical structure of peat and influence carbon release either by change of flowpath or changing water’s access to parts of the peat profile, or returning to parts of the peat profile not accessible to water during the drought, including parts of the profile with increased DOC concentration. The change in the flowpaths experienced by runoff could be due to three mechanisms: the creation of new pathways; the hydrophobic nature of dried peat causing water exclusion from parts of the peat matrix; and crusting of the surface preventing infiltration. Tranvik & Jansson (2002) suggest that changes in DOC concentration in Scandinavia were due to changes in climate changing the mix of flowpaths runoff accessed. Evans et al (1999) have shown that runoff characteristics do change after a drought, but could only speculate on the longer term. Holden and Burt (2002) showed in laboratory studies of peat that the short term consequences of drought are to increase infiltration and flow at depth, and decrease surface runoff. However, this study showed no significant effect for drought upon mixing processes within the peat. Worrall et al (2006c) used a multivariate analysis of long term records of stream and soil water chemistry and showed no evidence for substantive new flowpaths being generated during the drought, though there appeared to be persistent changes in the runoff chemistry due to hydrophobic behaviour in the peat. Worrall et al (2007e) examined the change in runoff initiation probability over the period of the same drought and showed that runoff initiation returned to its predrought state within months of the cessation of the severe drought, i.e. flowpaths created in the drought did not persist. Therefore, studies have found only hydrophobic effects to be persistent beyond the year of the severe drought but even that is not sufficient to explain the longer term increases in DOC. Increasing drought frequency is potentially significant for POC flux. Francis (1990) showed that desiccation during drought periods was an important process driving sediment
A review of current evidence on carbon fluxes and greenhouse gas emissions from UK peatlands
52
production from bare gully walls; increases in summer drought coupled with enhanced autumn rainfalls are therefore likely to enhance POC flux. Drought conditions have also been implicated in the initiation of peat erosion in the southern Pennines by Tallis (1997 1998), Moisture stress on the surface vegetation and cracking due to desiccation have the potential to destabilise peat masses and produce a step change in POC flux from the system. A second POC related risk of drought periods relates to the risk of wildfire. Wildfires destroy vegetation creating large areas of bare peat and deep burning fires destroy roots inhibiting regeneration. During the dry summer of 1976 fire burnt over 120ha of moorland on Burbage Moor and subsequent heavy rainfall led to removal of over a metre depth of surface peat. This constitutes a catastrophic input of POC to the system and the subsequent chronic erosion of fires sites leads to long term increase in POC flux. Under conditions of increasing drought frequency the aggregation of fires scars across peatland surfaces and the associated POC losses represent a significant threat to long term peatland stability. Future research is urgently needed to determine whether peatlands will act as a net source or sink of C in the future, particularly as over the next few decades large stock of C in organic soils could potentially be exposed to less constrained decomposition. We do not yet know the relative importance of external drivers such as climate change compared to what can be achieved by management, e.g. is that could be achieved by optimal management going to be defeated by climate change? 2.5.3 Summary i The research programme will need to reflect the influence of external (non-
management) environmental influences in order to provide sufficient controls and geographic spread. Again the variation in Table 5 may in part be explained the variation in the external drivers discussed above.
ii The research programme could also seek to illuminate the interactions between
management and the external environmental factors identified above, to help inform peatland management that is better capable of withstanding their impacts.
iii The need to consider the role of external drivers is considered in section 3.2.2 and
section 3.2.3 of the research case.
A review of current evidence on carbon fluxes and greenhouse gas emissions from UK peatlands
53
3 Conclusions This review has highlighted that there are very few full C or GHG budget studies for peat soils in the UK, and even fewer that consider land management and land management change. Where relevant, therefore, this review has also highlighted international research findings that may provide more guidance as to potential processes and patterns of C and GHG flux under management. Many UK peatlands may be close to the tipping point between C source and C sink. Production of detailed C budgets for representative land use or management types from a wider range of peatland types would provide a clearer picture and identify systems where management intervention would have the most significant returns in terms of either reduced C loss or enhanced sequestration. This review has identified the following particular limitations: i Measurements of some areas of peatland carbon budgets are more lacking than
others: for two of the management interventions considered there is less than one equivalent complete budget, and for some management and land uses of concern we could not identify a single UK study.
ii Where emission factors could be derived they are mostly for a single site from studies that were not designed for the purpose of measuring an emissions factor.
iii If measurements of different managements and land uses are lacking then it is even
more difficult to find the following:
a Measurements relative to peatland types. For example, although there are complete budgets of drained peat catchments there is no information relative to drainage on blanket bogs versus wet heaths or fens.
b Measurements of managements or land-uses in different climatic settings. As for point (a), the limited number of studies means that it is impossible to compare, for example, drain-blocking in north-east Scotland with the same intervention in the South Pennines.
c Measurements of managements and land uses interactions. Although this review can identify studies of individual managements or land uses, what would be the effect of multiple land uses upon one site? This review could not identify studies of whether, for example, grazing upon land subject to managed burning increases or mitigates the impact of the burning.
iv Measurements of certain components of the C or GHG budget are more lacking than
others, with a particular lack of data for both CH4 and N2O fluxes. The flux to the atmosphere of both these gases can be small in magnitude but they both have relatively high GWP in comparison to other gases released from peat soils.
v Most restoration transition studies have a limited time span and often lack pre-restoration monitoring of long time series (i.e. years) to generate baseline conditions prior to intervention. From what observations there are available large inter-annual variability in C, and GHG, budgets are common and thus several years of data are required to enable more informed judgements as to the C/GHG budgets under different management strategies. More focussed monitoring work is required to examine hydrological and C cycle changes following restoration using careful protocols.
vi No studies have considered budgets in a full life cycle assessment and considered
issues of displacement and leakage when considering a land management change.
A review of current evidence on carbon fluxes and greenhouse gas emissions from UK peatlands
54
Such elements maybe part of other components in national GHG inventories, but will be an important part of a conservation case.
All of these limitations mean that it is not possible at this stage to greatly improve on emissions factors over those presented in this study. While a lack of data stems partly from cost restrictions it has also been partly a function of the lack of technological capability to collect it. However, the possibility of measuring C and GHG budgets is improving rapidly with advances in technology. Automatic field logging equipment now exists, or is currently being trialled, for DOC (Grayson and Holden, in review); of dissolved CO2; and for the inclusion of open-path CH4 detectors on eddy flux towers. Such technology needs to be adopted in any new monitoring networks studying peatland C and GHG fluxes. The options for establishing robust, sensor-based peatland monitoring networks are considered in detail in the research case. Despite the lack of evidence, it is possible to make the following tentative general conclusions based on the evidence compiled: • Not all modified peatlands are C or GHG sources. Additionally, peatland restoration
may not necessarily lead to a peatland becoming a C or GHG sink; • The reason that many restoration or management interventions may not provide a
benefit in terms of GHG, at least over the relatively short time which typifies most studies, is because CH4 is often an important component of the C balance of restored peatlands when considered in terms of global warming potential even when, in terms of mass, CH4 losses are only a few percent (3-5%) of the net exchange of CO2 between the peatland and the atmosphere;
• Fluvial C fluxes also represent a significant part of the overall peatland C budget
particularly in blanket bogs were large gradients can exist. In all systems the fluvial C flux will reduce the C sink associated with CO2 sequestration, and in some systems they may be sufficient to change the peatland from an (apparent) C sink to a net C source. Their role in GHG terms is dependent on their ultimate fate, which remains poorly understood; and
• We can use this review to identify priorities with regard to which combinations of
peatland type and or management should be regarded as priorities for further research, and this is summarised in Table 21 and 22.
The monitoring of managed peat soils is and will be expensive but is worthwhile given (i) the scale of investment in peatland restoration, conservation and management (tens to hundreds of millions of pounds each year) and ii) the importance of peatlands as a UK carbon store, a potential carbon source and a potential long-term future carbon sink. Thus a robust and comprehensive GHG and carbon monitoring programme should be properly costed, planned and implemented for the UK’s peatlands. Such a programme is described in the accompanying document.
A review of current evidence on carbon fluxes and greenhouse gas emissions from UK peatlands
55
Table 21. Summary of review and meta-analysis of management transitions prioritised by category listing the top 5 priority land managements under each category, where 1= highest priority; 5 = lowest priority; and ? = no available information. Existing study site are listed as = possible study site exists; and = no presently existing study site.
A review of current evidence on carbon fluxes and greenhouse gas emissions from UK peatlands
56
Table 22. Summary of the steady-state land uses considered by the review in comparison to Table 4. The land uses are prioritised by land area and estimated emissions with the top priority under each category, where 1= highest priority for further investigation. The availability of an emissions factor for any land use is classified as = possible emissions factor could be derived from available UK literature; and = no emissions factor could be derived from available UK literature
A review of current evidence on carbon fluxes and greenhouse gas emissions from UK peatlands
57
4 References This list is only of those references used directly in the above text; studies included in the meta-analysis are listed in the appendices. AERTS, R. & DE CALUWE, H. 1999. Nitrogen deposition effects on carbon dioxide and methane emissions from temperate peatland soils. Oikos, 84, 44-54. ALLEN, S.E. 1964. Chemical aspects of heather burning. Journal of Applied Ecology, 1, 347-367. ANDERSON, P. & YALDEN, D.W. 1981. Increase sheep numbers and the loss of heather moorland in the Peak District, England. Biological Conservation, 20, 195-213. ARMSTRONG, A., HOLDEN, J., KAY, P., FOULGER, M., GLEDHILL, S., MCDONALD, A.T. & WALKER, A. 2009. Drain-blocking techniques on blanket peat: a framework for best practice. Journal of Environmental Management, doi:10.1016/j.jenvman.2009.06.003. ARMSTRONG, A., HOLDEN, J., KAY, P., MCDONALD, A.T., GLEDHILL, S., FOULGER, M. & WALKER, A. 2010. The impact of peatland drain-blocking on dissolved organic carbon loss and discolouration of water: results from a national survey. Journal of Hydrology, 381, 112-120. ARMSTRONG, A., HOLDEN, J., LUXTON, K. & QUINTON, J.N. (in review). Peatland vegetation type - a key driver of DOC? Science of the Total Environment. ARMSTRONG, A., HOLDEN, J. & STEVENS, C. 2008. The differential response of vegetation to grip-blocking. Report for Peatscapes, North Pennine AONB. 29pp. VON ARNOLD, K., WESLIEN, P., NILSOON, M., SVENSSON, B.H. & KLEMEDTSSON, L. 2005. Fluxes of CO2, CH4 and N2O from drained coniferous forest on organic soils. Forest Ecology and Management, 210, 239-254. AVERY, B.W. 1980. Soil classification for England and Wales. Soil Survey of England and Wales, Harpenden. Technical Monograph, 14, 67. BAIRD, A.J., HOLDEN, J. & CHAPMAN, P.J. 2009. A Literature Review of Evidence on Emissions of Methane in Peatlands. Defra Project SP0574. BARDGETT, R.D., WARDLE, D.A. & YEATES, G.W. 1998. Linking above-ground and below-ground food-webs: how plant responses to foliar herbivory influence soil organisms. Soil Biology and Biochemistry, 30, 1867-78. BARDGETT, R.D., JONES, A.C., KEMMITT, S.J., COOK, R. & HOBBS, P.J. 2001. Soil microbial community patterns related to the history and intensity of grazing in sub-montane ecosystems. Soil Biology and Biochemistry, 33, 1653-64. BELLAMY, P.H., LOVELAND, P.J., BRADLEY, R.I., LARK, R.M. & KIRK, G.J.D. 2005. Carbon losses from all soils across England and Wales 1978-2003. Nature, 437, 245-248. BERENDSE, F., VAN BREEMEN, N., RYDIN, H., BUTTLER, A., HEIJMANS, M., HOOSBEEK, M.R., LEE, J.A., MITCHELL, E., SAARINEN, T., VASANDER, H. & WALLEN, B. 2001. Raised atmospheric CO2 level and increased N deposition cause shifts
A review of current evidence on carbon fluxes and greenhouse gas emissions from UK peatlands
58
in plant species composition and production in Sphagnum bogs. Global Change Biology, 7, 591-598. BEST, E.P.H. & JACOBS, F.H.H. 1997. The influence of raised water table levels on carbon dioxide and methane production in ditch-dissected peat grasslands in the Netherlands. Ecological Engineering, 8, 129-144. BILLETT, M.F., PALMER, S.M., HOPE, D., DEACON, C., STORETON-WEST, R., HARGREAVES, K.J., FLECHARD, C. & FOWLER, D. 2004. Linking land-atmosphere-stream carbon fluxes in a lowland peatland system. Global Biogeochemical Cycles, 18, GB1024, doi: 10.1029/2003GB002058. BILLETT, M.F., CHARMAN, D.J., CLARK, J.M., EVANS, C.D., EVANS, M.G., OSTLE, N.J.,
WORRALL, F., BURDEN, A., DINSMORE, K.J., JONES, T., MCNAMARA, N.P., PARRY, L., ROWSON, J.G. & ROSE, R. Carbon balance of UK peatlands: current state of knowledge and future research challenges. Climate Research (in press). BLODAU, C. 2002. Carbon cycling in peatlands - A review of processes and controls. Environmental Reviews, 10, 111-134. BLODAU, C., BASILIKO, N. & MOORE, T.R. 2004. Carbon turnover in peatland mesocosms exposed to different water table levels. Biogeochemistry, 67, 331-351. BRADLEY, I. 1997. Carbon loss from drained lowland fens. In: M.G.R. CANNELL, ed. Carbon Sequestration in Vegetation and Soils, DOE/ITE Contract EPG 1/1/3. Final Report March 1997. Department of Environment, London. BUBIER, J.L., MOORE, T.R. & BLEDZKI, L.A. 2007. Effects of nutrient addition on vegetation and carbon cycling in an ombrotrophic bog, Global Change Biology, 13, 1168-1186. BUBIER, J.L., BHATRIA, G., MOORE, T.R., ROULET, N.T. & LAFLEUR, P.M. 2003. Spatial and temporal variability in growing season net ecosystem carbon dioxide exchange at a large peatland in Ontario, Canada. Ecosystems, 6, 353-367. BYRNE, K.A. & FARRELL, E.P. 2005. The effect of afforestation on soil carbon dioxide emissions in blanket peatland in Ireland. Forestry, 78, 217-227. BYRNE, K.A., CHOJNICKI, B., CHRISTENSEN, T.R., DRÖSLER, M., FREIBAUER, A., FRIBORG, T., FROLKING, S., LINDROTH, A., MAILHAMMER, J., MALMER, N., SELIN, P., TURUNEN, J., VALENTINI, R. & ZETTERBERG, L. 2004. EU Peatlands: Current Carbon Stocks and Trace Gas Fluxes. Discussion paper produced as part of the EU-funded Concerted Action CarboEurope-GHG. 58 pp. CANNELL, M.G.R., DEWAR, R.C. & PYATT, D.G. 1993. Conifer plantations on drained peatlands in Britain - a net gain or loss of carbon. Forestry, 66, 353-369. CARLING, P. & NEWBORN, D. 2007. Erosion and moorland drainage - lessons from a past experiment. Review of 2006; research section I - Uplands. CHARMAN, D. 2002. Peatlands and environmental change. Wiley, Chichester. CHAPMAN, P.J., MCDONALD, A.T., TYSON, R., PALMER, S.J., MITCHELL, G. & IRVINE, B. (In press.) Changes in water colour between 1986 and 2006 in the headwaters of the River Nidd, Yorkshire, UK. Biogeochemistry.
A review of current evidence on carbon fluxes and greenhouse gas emissions from UK peatlands
59
CLARK, J.M., CHAPMAN, P.J., ADAMSON, J.K. & LANE, S.J. 2005. Influence of drought-induced acidification on the mobility of dissolved organic carbon in peat soils. Global Change Biology, 11, 791-809. CLAUSEN, J.C. 1980. The quality of runoff from natural and disturbed Minnesota peatlands. Proceedings 6th International Peat Congress, Duluth, Minnesota 1976, Minnesota, pp. 523-532. CLAY, G.D., WORRALL, F. & ROSE, R. (In press.) Carbon budgets of an upland blanket bog managed by prescribed fire - evidence for enhanced carbon storage under managed burning. JGR - Biogeosciences. CLAY, G.D. & WORRALL, F. (In press.) Black carbon production in a UK moorland wildfire. Journal of Environmental Management. CLAY, G.D., WORRALL, F. & FRASER, E.D. 2009a. Effects of managed burning upon Dissolved Organic Carbon (DOC) in soil water and runoff water following a managed burn of a UK blanket bog. Journal of Hydrology, 367, 41-51. CLAY, G.D., WORRALL, F., CLARK, E. & FRASER, E.D.G. 2009b. Hydrological response to managed burning and grazing in an upland blanket bog. Journal of Hydrology, 376, 486-495. CLEMENT, S. 2005. The future stability of upland blanket peat following historical erosion and recent re-vegetation. PhD thesis, University of Durham, Durham. CLUTTERBUCK, B. & YALLOP, A.R. 2010. Land management as a factor controlling dissolved organic carbon releases from upland peat soils 2: changes in DOC productivity over four decades. Science of the Total Environment, 408, 6179-6191. CLYMO, R.S. 1983. Peat. In: A.J.P. GORE, ed. Ecosystems of the World 4A, Mires: swamp, bog, fen and moor. Elsevier, Oxford, pp. 159-224. COUWENBERG, J., AUGUSTIN, J., MICHAELIS, D. & JOOSTEN, H. 2008. Emission reductions from rewetting of peatlands: towards a field guide for the assessment of greenhouse gas emissions from Central European peatlands. Duene, University of Griefswald. CROFTS, A. & JEFFERSON, R.G., eds. 1999. The lowland grassland management handbook. English Nature and the Wildlife Trusts, Peterborough. CRUICKSHANK, M.M. & TOMLINSON, R.W. 1988. Northern Ireland Peatland Survey. Report to Environment Service, Department of the Environment for Northern Ireland (7 volumes and 285 maps at 1:20 000 scale). CUMMINS, T. & FARRELL, E.P. 2003. Biogeochemical impact of clear-felling and reforestation on blanket peat streams. II major ions and DOC. Forest Ecology and Management, 180, 557-570. DAVIDSON, E.A. & JANSSENS, I.A. 2006. Temperature sensitivity of soil carbon decomposition and feedbacks to climate change. Nature, 440, 265-173. DAWSON, J.C. & SMITH, P. 2007. Carbon losses from soil and its consequences for landuse management. Science of the total environment, 382, 165-190.
A review of current evidence on carbon fluxes and greenhouse gas emissions from UK peatlands
60
DAWSON, J.J.C., BILLETT, M.F., NEAL, C. & HILL, S. 2002. A comparison of particulate, dissolved and gaseous carbon in two contrasting upland streams in the UK. Journal of Hydrology, 257, 226-246. DEBANO, L.F. 2000. The role of fire and soil heating on water repellency in wildland environments: a review. Journal of Hydrology, 231-232, 195-206. DEFRA. 2001 through 2006. Agriculture in the United Kingdom. Department of Environment, Food and Rural Affairs. HMSO, London 2001 through 2006. DEFRA. 2008. E-digest of statistics, www.defra.gov.uk DEFRA. 2007. Monitoring of peat and alternative products for growing media and soil improvers in the UK 2007. DEFRA. 2009. Assembling UK wide date on soil carbon (and greenhouse gas) in the context of land management. Defra project SP0567. DINSMORE, K., BILLETT, M.F., SKIBA, U.M., REES, R.M., DREWER, J. & HELFTER, C. (In press.) Role of the aquatic pathway in the carbon and greenhouse gas budgets of a peatland catchment. Global Change Biology. DIRKS, B.O.M., HENSEN, A. & GOUDRIAAN, J. 2000. Effect of drainage on CO2 exchange patterns in an intensively managed peat pasture. Climate Research, 14, 57-63. DISE, N.B. & VERRY, E.S. 2001. Suppression of peatland methane emission by cumulative sulphate deposition in simulated acid rain. Biogeochemistry, 53, 143-160. DORREPAAL, E., CORNELISSEN, J.H.C., AERTS, R., WALLEN, B. & VAN LOGTESTIJN, R.S.P. 2005. Are growth forms consistent predictors of leaf litter quality and decomposability across peatlands along a latitudinal gradient? Journal of Ecology, 93, 817-828. EDWARDS, A., MARTIN, D. & MITCHELL, G. 1987. Colour in upland waters. Proceedings of Yorkshire Water/Water Research Centre Workshop, Leeds, 29 September 1987. EGGELSMANN, R., HEATHWAITE, A.L., GROSS-BRAUKMANN, G., KUSTER, E., NAUCKE, W., SCHICH, M. & SCHWEIKLE, V. 1993. Physical processes and properties of mires. In: A.L. HEATHWAITE & K. GOTTLICH, eds. Mires, process, exploration and conservation. John Wiley, Chichester, pp. 171-262. ERLANDSSON, M., BUFFAM, I., FOLSTER, J., LAUDON, H., TEMNERUD, J., WEYHENMEYER, G.A. & BISHOP, K. 2008. Thirty-five years of synchrony in the organic matter concentrations of Swedish rivers explained by variation in flow and sulphate, Global Change Biology, 14, 1191-1198. EVANS, C.D., CHAPMAN, P.J., CLARK, J.M., MONTEITH, D.T. & CRESSER, M.S. 2006. Alternative explanations for rising dissolved organic carbon export from organic soils. Global Change Biology, 12, 2044-2053. EVANS, C.D., MONTEITH, D.T. & COOPER, D.M. 2005. Long-term increases in surface water dissolved organic carbon: observations, possible causes and environmental impacts. Environmental Pollution, 137, 55-71.
A review of current evidence on carbon fluxes and greenhouse gas emissions from UK peatlands
61
EVANS, C.D., FREEMAN, C., CORK, L.G., THOMAS, D.N., REYNOLDS, B., BILLETT, M.F., GARNETT, M.H. & NORRIS, D. 2007. Evidence against recent climate-induced destabilisation of soil carbon from 14C analysis of riverine dissolved organic matter. Geophysical Research Letters, 34, L07407, doi:10.1029/2007GL029431. EVANS, M.G. & WARBURTON, J. 2001. Transport and dispersal of organic debris (peat blocks) in upland fluvial systems. Earth Surface Processes and Landforms, 26, 1087-1102. EVANS, M.G. & WARBURTON, J. 2007. The geomorphology of upland peat: erosion, form, and landscape change. Blackwell, Oxford 262 p EVANS, M.G., BURT, T.P., HOLDEN, J. & ADAMSON, J.K. 1999. Runoff generation and water table fluctuations in blanket peat: evidence from UK data spanning the dry summer of 1995. Journal of Hydrology, 221, 141-160. EVANS, M.G., ALLOTT, T., HOLDEN, J., FLITCROFT, C. & BONN, A. 2005. Understanding gully blocking in deep peat. Moors for the Future report no 4. Moors for the Future Partnership, Castleton. Available from: http://www.moorsforthefuture.org.uk/mftf/downloads/publications/MFF_ Report_No4.pdf EVANS, R. 2005. Curtailing Grazing-Induced Erosion in a Small Catchment and its Environs, the Peak District. Central England Applied Geography, 25, 81-95. FANG, C., SMITH, P., MONCRIEFF, J.B. & SMITH, J.U. 2005. Similar response of labile and resistant soil organic matter pools to changes in temperature. Nature, 433, 57-59. FELTON, M. & MARSDEN, J.H. 1990. Heather regeneration in England and Wales. A feasibility study for the Department of the Environment, Nature Conservancy Council, Peterborough. FENNER, N., FREEMAN, C., LOCK, M.A., HARMENS, H., REYNOLDS, B. & SPARKS, T. 2007. Interactions between elevated CO2 and warming could amplify DOC exports from peatland catchments. Environmental Science and Technology, 41, 3146-3152. FORREST, G.I. 1971. Structure and production of North Pennine blanket bog vegetation. Journal of Ecology, 59, 453-479. FORESTRY COMMISSION. 2000. Forests and Peatland Habitats: Guideline Note. Forestry Commission, Edinburgh. FORSTER, P., RAMASWAMY, V., ARTAXO, P., BERNTSEN, T., BETTS, R., FAHEY, D.W., HAYWOOD, J., LEAN, J., LOWE, D.C., MYHRE, G., NGANGA, J., PRINN, R., RAGA, G., SCHULZ, M. & VAN DORLAND, R. 2007. Changes in atmospheric constituents and in radiative forcing. In: S. SOLOMON, D. QIN, M. MANNING, Z. CHEN, M. MARQUIS, K.B. AVERY, T, M. TIGNOR & H.L. MILLER, eds. Climate Change 2007: The Physical Science Basis. Contribution of Working Group I to the Fourth Assessment Report of the Intergovernmental Panel on Climate Change, Cambridge University Press, Cambridge, United Kingdom and New York, NY, USA. FOWLER, D., MACDONALD, J., LEITH, I.D., HARGREAVES, K.J. & MARTYNOGA, R. 1995. The response of peat wetland methane emissions to temperature, water table and sulphate deposition, in Acid Rain research: Do we have enough answers? In: G.J. HEIJ & J.W. ERISMAN, eds. pp. 485-487, Elsevier Sci., New York.
A review of current evidence on carbon fluxes and greenhouse gas emissions from UK peatlands
62
FOWLER, D., SMITH, R.L., MULLER, J.B.A., HAYMAN, G. & VINCENT, K.J. 2005. Changes in the atmospheric deposition of acidifying compounds in the UK between 1986 and 2001. Environmental Pollution, 137, 15-25. FRANCIS, I.S. 1990. Blanket Peat Erosion in a Mid-Wales catchment during two drought years. Earth Surface Processes and Landforms, 15(5), 445-456. FREEMAN, C., EVANS, C.D., MONTEITH, D.T., REYNOLDS, B. & FENNER, N. 2001a. Export of organic carbon from peat soils. Nature, 412, 785-785. FREEMAN, C., OSTLE, N. & KANG, H. 2001b. An enzymic 'latch' on a global carbon store - a shortage of oxygen locks up carbon in peatlands by restraining a single enzyme. Nature, 409, 149. FREEMAN, C., FENNER, N., OSTLE, N.J., KANG, H., DOWRICK, D.J., REYNOLDS, B., LOCK, M.A., SLEEP, D., HUGHES, S. & HUDSON, J. 2004. Export of dissolved organic carbon from peatlands under elevated carbon dioxide levels. Nature, 430, 195-198. FROLKING, S., ROULET, N.T., MOORE, T.R., LAFLEUR, P.M., BUBIER, J.L. & CRILL, P.M. 2002. Modelling seasonal to annual carbon balance of Mer Bleue Bog, Ontario, Canada. Global Biogeochemical Cycles, 16, 10.1029/2001GB001457. FUNK, D.W., PULLMAN, E.R., PETERSON, K.M., CRILL, P.M. & BILLINGS, W.D. 1994. Influence of water table on carbon dioxide, carbon monoxide and methane fluxes from taiga bog microcosms. Global Biogeochemical Cycles, 8, 271-278. GARNETT, M.H., INESON, P. & STEVENSON, A.C. 2000. Effects of burning and grazing on carbon sequestration in a Pennine blanket bog, UK. Holocene, 10, 729-736. GAUCI, V., DISE, N. & FOWLER, D. 2002. Controls on suppression of methane flux from a peat bog subjected to simulated acid rain sulfate deposition. Global Biogeochemical Cycles, 16, doi: 10.1029/2000GB001370. GAUCI, V., FOWLER, D., CHAPMAN, S.J. & DISE, N.B. 2004a. Sulfate deposition and temperature controls on methane emission and sulfur forms in peat. Biogeochemistry, 71, 141-162. GAUCI, V., MATTHEWS, E., DISE, N., WALTER, B., KOCH, D., GRANBERG, G. & VILE, M. 2004b. Sulfur pollution suppression of the wetland methane source in the 20th and 21st centuries. Proceedings of the National Academy of Sciences, doi: 10.1073/pnas. 0404412101. GIBSON, H.S., WORRALL, F., BURT, T.P. & ADAMSON, J.K. 2009. DOC budgets of drained peat catchments: implications for DOC production in peat soils. Hydrological Processes, 23, 1901-1911. GLAVES, D.J., HAYCOCK, N.E., COSTIGAN, P., COULSON, J.C., MARRS, R.H., ROBERTSON, P.A. & YOUNGER, J. 2005. Defra review of the heather and grass burning regulations and code; science panel assessment of the effects of burning on biodiversity, soils and hydrology. DEFRA, London. GLENN, S., HEYES, A. & MOORE, T. 1993. Carbon dioxide and methane emissions from drained peatland soils, southern Quebec. Global Biogeochemical Cycles, 7, 247-258.
A review of current evidence on carbon fluxes and greenhouse gas emissions from UK peatlands
63
GORHAM, E. 1991. Northern peatlands: role in the carbon cycle and probable responses to climatic warming. Ecological Applications, 1, 182-195. GORHAM, E. 1995. The biogeochemistry of northern peatlands and its possible response to global warming. In: G.M. WOODWELL & F.T. MACKENZIE, eds. Biotic Feedbacks in the Global Climate System. pp. 169-187. Oxford University Press, Oxford, UK. GOSSELINK, J.G. & MALTBY, E. 1990. Wetland gains and losses. In: M. WILLIAMS, ed. Wetlands: a threatened landscape. Blackwell Science, Oxford, UK, pp. 269-322. GRANBERG, G., SUNDH, I., SVENSSON, B.H. & NILSSON, M. 2001. Effects of temperature, and nitrogen and sulphur deposition, on methane emission from a boreal mire. Ecology, 82, 1982-1998. GRAYSON, R. & HOLDEN, J. (In review.) Continuous sampling of spectrophotometric absorbance in peatland streamwater: implications for understanding fluvial carbon fluxes. Science of the Total Environment. HARGREAVES, K.J., MILNE, R. & CANNELL, M.G.R. 2003. Carbon balance of afforested peatland in Scotland. Forestry, 76, 3, 299-317. HELLIWELL, R.C., BRITTON, A.J., GIBBS, S., FISHER, J.M. & POTTS, J.M. 2010. Interaction effects of N deposition, land management and weather patterns on soil solution chemistry in a Scottish alpine heath. Ecosystems, 13, 696-711. HOBBS, R.J. 1984. Length of burning rotation and community composition in high-level Calluna-Eriophorum bog in N. England. Vegetatio, 57, 129-136. HODGSON, J.M. 1997. Soil Survey Field Handbook: Describing and Sampling Soil Profiles. Soil survey Technical Monograph No. 5. Soil Survey and Land Research Centre, Silsoe. England. HOLDEN, J. 2005. Peatland hydrology and carbon cycling: why small scale process matters. Phils. Trans. Royal Society A 383, 2891-2913. HOLDEN, J. & BURT, T.P. 2002. Laboratory experiments on drought and runoff in blanket peat. European Journal of Soil Science, 53, 4, 675-690. HOLDEN, J., CHAPMAN, P.J. & LABADZ, J.C. 2004. Artificial drainage of peatlands: hydrological and hydrochemical process and wetland restoration. Progress in Physical Geography, 28, 95-123. HOLDEN, J., EVANS, M.G., BURT, T.P. & HORTON, M. 2006a. Impact of land drainage on peatland hydrology. Journal of Environmental Quality, 35, 1764-1778, doi:10.2134/ jeq2005.0477. HOLDEN, J., CHAPMAN, P.J., EVANS, M., HAYCOCK, N., HUBACEK, K., KAY, P. & WARBURTON, J. 2006b. Vulnerability of organic soils in England and Wales. Defra Project SP0532. HOLDEN, J. 2006. Sediment and particulate carbon removal by pipe erosion increase over time in blanket peatlands as a consequence of land drainage. Journal of Geophysical Research-Earth Surface, 111, F02010, doi:10.1029/2005JF000386.
A review of current evidence on carbon fluxes and greenhouse gas emissions from UK peatlands
64
HOLDEN, J., SHOTBOLT, L., BONN, A., BURT, T.P., CHAPMAN, P.J., DOUGILL, A.J., FRASER, E.D.G., HUBACEK, K., IRVINE, B., KIRKBY, M.J., REED, M.S., PRELL, C., STAGL, S., STRINGER, L.C., TURNER, A. & WORRALL, F. 2007a. Environmental change in moorland landscapes. Earth-Science Reviews, 82, 75-100. HOLDEN, J., GASCOIGNE, M. & BOSANKO, N.R. 2007b. Erosion and natural revegetation associated with surface land drains in upland peatlands. Earth Surface Processes and Landforms, 32, 1547-1557. HOLDEN, J., WALKER, J., EVANS, M.G., WORRALL, F. & BONN, A. 2008. A compendium of peat restoration and management projects. Defra report SP0556. HOLDEN, J., WALLAGE, Z.E., LANE, S.N. & MCDONALD, A.T. (In review.) Water table dynamics in drained and restored blanket peat. Journal of Hydrology. HOPE, D., BILLETT, M.F., MILNE, R. & BROWN, T.A.W. 1997. Exports of organic carbon in British rivers. Hydrological Processes, 11, 325-344. HOPE, D., PICOZZI, N., CATT, D.C. & MOSS, R. 1998. Effects of reducing sheep grazing in the Scottish Highlands. Journal of Range Management, 49, 301-310. HOPE, D., PALMER, S., BILLETT, M.F. & DAWSON, J.J.C. 2001. Carbon dioxide and methane evasion from a temperate peatland stream. Limnology and Oceanography, 46, 847-857. HOUGHTON, J.T., MEIRA-FILHO, L.G., CALLENDER, B.A., HARRIS, N., KATTENBERG, A. & MASKELL, K. 1995. Climate change 1995: The science of climate change. Cambridge, University Press. 339 pp. HUTTUNEN, J.T., NYKANEN, H., MARTIKAINEN, P.J. & NIEMINEN, M. 2003. Fluxes of nitrous oxide and methane from drained peatlands following forest clear-felling in southern Finland. Plant and Soil, 255, 457-462. IMESON, A.C. 1971. Heather burning and soil erosion on the North Yorkshire Moors. Jour. Applied Ecology, 8, 537-542. JONCZYK, J., RIMMER, D. & QUINN, P. 2009. Geltsdale grip block monitoring report, Peatscapes project final report. JONES, J.B. & MULHOLLAND, P.J. 1998. Carbon dioxide variation in a hardwood forest stream: an integrative measure of whole catchment soil respiration. Ecosystems, 1, 183-196. KELLER, J.K., BRIDGHAM, S.D., CHAPIN, C.T. & IVERSENA, C.M. 2005. Limited effects of six years of fertilization on carbon mineralization dynamics in a Minnesota fen. Soil Biology and Biochemistry, 37, 1197-1204. KNORR, W., PRENTICE, I.C., HOUSE, J.I. & HOLLAND, E.A. 2005. Long-term sensitivity of soil carbon turnover to warming. Nature, 433, 298-301. KOEHLER, A.K., SOTTOCORNOLA, M. & KIELY, G. (In press.) How strong is the current carbon sequestration of an Atlantic blanket bog? Global Change Biology. KUHRY, P. 1994. The role of fire in the development of Sphagnum-dominated peatlands in western boreal Canada. Journal of Ecology, 82, 899-910.
A review of current evidence on carbon fluxes and greenhouse gas emissions from UK peatlands
65
LAINE, J., MINKKINEN, K. & TRETTIN, C. 2009. Direct human impacts on the peatland carbon sink. In: A.J. BAIRD, L.R. BELYEA, X. COMAS, A. REEVE, & L. SLATER, eds. Carbon Cycling in Northern Peatlands, Geophysical Monograph Series, American Geophysical Union, Washington D.C, USA. LAIHO, R. & LAINE, J. 1997. Tree stand biomass and carbon content in the age sequence of drained mires in southern Finland. Forest Ecology and Management, 93, 161-169. LEPSITO, A., KORTELAINEN, P. & MATTSSON, T. 2008. Increased organic C and N leaching in northern boreal river basins in Finland. Global Biogeochemical Cycles, 22, GB3029. LIMPENS, J., BERENDSE, F., BLODAU, C., CANADELL, J.G., FREEMAN, C., HOLDEN, J., ROULET, N., RYDIN, H. & SCHAEPMAN-STRUB, G. 2008. Peatlands and the carbon cycle: from local processes to global implications - a synthesis. Biogeosciences, 5, 1475-1491. LINDSAY, R. 1995. Bogs: The ecology, classification and conservation of ombrotrophic mires. Scottish Natural Heritage, Battleby. LUMSDEN, D.G., STUTTER, M.I., COOPER, R.J. & MANSON, J.R. 2006. Model assessment of biogeochemical controls on dissolved organic carbon partitioning in an acid organic soil. Environmental Science and Technology, 39, 8057-8063. MAFF. 1975 through 2000. Agriculture in United Kingdom. Ministry of Agriculture Fisheries and Food, HMSO, London 1975-2000. MALLIK, A.U. & FITZPATRICK, E.A. 1996. Thin section studies of Calluna heathland soils subject to prescribed burning. Soil Use and Management , 12, 143-149. MALLIK, A.U. & RAHMAN, A.A. 1985. Soil water repellency in regularly burned Calluna heathlands: comparison of three measuring techniques. Journal of Environmental Management, 20, 207-218. MALLIK, A.U., GIMINGHAM, C.H. & RAHMAN, A.A. 1984. Ecological effects of heather burning: 1. Water infiltration moisture retention and porosity of surface soil. Journal of Ecology, 72: 767-776. MALTBY, E. 1980. The impact of severe fire on Calluna moorland in the North York moors. Bulletin d'Ecologie, 11, 683-708. MALTBY, E., LEGG, C.J. & PROCTOR, M.C.F. 1990. The ecology of severe moorland fire on the North York Moors: effects of the 1976 fires and subsequent surface vegetation development. Journal of Ecology, 78, 490. MAYFIELD, B. & PEARSON, M.C. 1972. Human interference with the north Derbyshire blanket peat. East Midland Geographer, 12, 245-251. MCNAMARA, N.P., PLANT, T., OAKLEY, S., WARD, S., WOOD, C. & OSTLE, N. 2008. Gully hotspot contribution to landscape methane (CH4) and carbon dioxide (CO2) fluxes in a northern peatland. Science of the Total Environment, 404, 354-360. MIDDELBOE, A.L. & MARKAGER, S. 2003. Depth limits and minimum light requirements of freshwater macrophytes. Freshwater Biology, 37, 553-568.
A review of current evidence on carbon fluxes and greenhouse gas emissions from UK peatlands
66
MILES, J. 1988. Vegetation and soil change in the uplands. In: M.B. USHER, & D.B.A. THOMPSON, eds. Ecological Change in the Uplands. Blackwell Scientific, Oxford. pp. 57-70. MINKKINEN, K., KORHONEN, R., SAVOLAINEN, I. & LAINE, J. 2002. Carbon balance and radiative forcing of Finnish peatlands 1900-2100 - the impact of forestry drainage. Global Change Biology, 8, 785-799. MITCHELL, G. & MCDONALD, A.T. 1995. Catchment Characterization as a Tool for Upland Water-Quality Management. Journal of Environmental Management, 44, 83-95. MONTEITH, D.T., STODDARD, J.L., EVANS, C.D., DE WIT, H.A., FORSIUS, M., HOGASEN, T., WILANDER, A., SKJELKVALE, B.L., JEFFRIES, D.S., VUORENMAA, J., KELLER, B., KOPACEK, J. & VESELY, J. 2007. Dissolved organic carbon trends resulting from changes in atmospheric deposition chemistry. Nature, 450, 537-541. MOORE, T.R. 1987. A preliminary study of the effects of drainage and harvesting on water quality in an ombrotrophic bogs near Sept-Iles, Quebec. Water Resources Bulletin, 23, 785-791. MOORE, T.R., ROULET, N.T. & WADDINGTON, J.M. 1998. Uncertainty in predicting the effect of climatic change on the carbon cycling of Canadian peatlands. Climatic Change, 40, 229-245. MOORLAND WORKING GROUP. 1998. Good practice for grouse moor management. Scottish Natural Heritage, Battleby. NATURAL ENGLAND. 2010. England’s Peatlands - Carbon Storage and Greenhouse Gases. Natural England Report NE257. NEDWELL, D.B. & WATSON, A. 1995. CH4 production, oxidation and emission in UK ombrotrophic peat bog: Influence of SO4 from acid rain. Soil Biology and Biochemistry, 27, 893-903. NILSSON, M., SAGERFORS, J., BUFFAM, I., LAUDON, H., ERIKSSON, T., GRELLE, A., KLEMEDTSSON, L., WESLIEN, P. & LINDROTH, A. 2008. Contemporary carbon accumulation in a boreal oligotrophic minerogenic mire - a significant sink after accounting for all C-fluxes. Global Change Biology, 14, 2317-2332. NYKANEN, H., VASANDER, H., HUTTUNEN, J.T. & MARTIKAINEN, P.J. 2002. Effects of experimental nitrogen load on methane and nitrous oxide fluxes on ombrotrophic boreal peatland. Plant and Soil, 242, 147-155. PAAVILAINEN, E. & PAIVANEN, J. 1995. Peatland forestry: ecology and principles. Ecological studies, 111, Springer Verlag, Heidelberg. PAKEMAN, R., HULME, P., TORVELL, L. & FISHER, J. 2003. Rehabilitation of Degraded Dry Heather [Calluna vulgaris (L.) Hull]: Moorland by Controlled Sheep Grazing. Biological Conservation, 114, 389-400. PAWSON, R.R., LORD, D.R., EVANS, M.G. & ALLOTT, T.E.H. 2008. Fluvial organic carbon flux from an eroding peatland catchment, southern Pennines, UK. Hydrology and Earth System Sciences, 12, 625-634.
A review of current evidence on carbon fluxes and greenhouse gas emissions from UK peatlands
67
PENMAN, J., GYTARSKY, M., HIRAISHI, T., KRUG, T., KRUGER, D., PIPATTI, R., BUENDIA, L., MIWA, K., NGARA, T., TANABE, K. & WAGNER, F. 2003. Good Practice Guidance for Land Use, Land-Use Change and Forestry. The Intergovernmental Panel on Climate Change (IPCC), Japan. PERKINS, D.F. 1978. The distribution and transfer of energy and nutrients in Agrostis-Festuca grassland ecosystem. In: O.W. HEAL & D.F. PERKINS, eds. Production ecology of British Moors and Montane Grasslands. Ecological Studies. No. 27, Springer-Verlag, Berlin. PIETIKÄINEN, J., TURUNEN, J. & TOLONEN, K. 1999. The role of fire in the carbon dynamics of a mire, eastern Finland. Holocene, 9, 453-462. POWLSON, D. 2005. Climatology - Will soil amplify climate change? Nature, 433, 204-205. QUINN P.F., HEWETT, C.J.M. & DAYAWANSA, N.D.K. 2008. TOPCAT-NP: a minimum information requirement model for simulation of flow and nutrient transport from agricultural systems. Hydrological Processes, 22, 14, 2565-2580. RAGHOEBARSING, A.A., SMOLDERS, A.J.P., SCHMID, M.C., RIJPSTRA, W.I.C., WOLTERS-ARTS, M., DERKSEN, J., JETTEN, M.S.M., SCHOUTEN, S., DAMSTE, J.S.S., LAMERS, L.P.M., ROELOFS, J.G.M., DEN CAMP, H.J.M.O. & STROUS, M. 2005. Methanotrophic symbionts provide carbon for photosynthesis in peat bogs. Nature, 436, 1153-1156. RAMCHUNDER, S., BROWN, L.E. & HOLDEN, J. 2009. Environmental effects of drainage, drain-blocking and prescribed vegetation burning in UK upland peatlands. Progress in Physical Geography, 33, 49-79. RAWES, M. & HOBBS, R. 1979. Management of semi-natural blanket bog in the northern Pennines. Journal of Ecology, 67, 789-807. RoTAP. 2010. Review of Transboundary Air Pollution (RoTAP): Acidification, eutrophication and ground level ozone and heavy metals in the UK. Report to the Department for Environment, Food and Rural Affairs, Centre for Ecology and Hydrology, Edinburgh, UK. ROULET, N.T., LAFLEUR, P.M., RICHARD, P.J.H., MOORE, T.R., HUMPHREYS, E.R. & BUBIER, J. 2007. Contemporary carbon balance and late Holocene carbon accumulation in a northern peatland. Global Change Biology, 13, 397-411, doi: 10.1111/j.1365-2486.2006.01292.x. ROWSON, J.G., EVANS, M.G., WORRALL, F. & BONN, A. (In press a.) Carbon fluxes from restored peatlands - the carbon benefit of revegetation. Biogeochemistry. ROWSON, J.G., GIBSON, H.S., WORRALL, F., OSTLE, N., BURT, T.P. & ADAMSON, J.K. (In press b.) The complete carbon budget of a drained peat catchment. Soil Use & Management. RYDIN, H. & JEGLUM, J. 2006. The Biology of Peatlands. Oxford University Press, Oxford, 343 pp. SANGER, L.J., BILLETT, M.F. & CRESSER, M.S. 1994. The effects of acidity on carbon fluxes from ombrotrophic peat. Chemistry and Ecology, 8, 249-264.
A review of current evidence on carbon fluxes and greenhouse gas emissions from UK peatlands
68
SCOTTISH EXECUTIVE. 2007. ECOSSE - estimating carbon in organic soils, sequestration and emissions. Scottish Executive, Web only publication. http://www.scotland.gov.uk/Publications/2007/03/16170508/0 (check 13/07/2010) SHAW, S.C., WHEELER, B.D., KIRBY, P., PHILLIPSON, P. & EDMUNDS, R. 1996. Literature review of the historical effects of burning and grazing of blanket bog and upland wet heath. 172, English Nature, Peterborough. SHEPHERD, M.J. 2001. The effect of grazing on soil organic matter decomposition on Dartmoor. Unpublished PhD thesis, University of Exeter. SILVOLA, J. 1985. CO2 dependence of photosynthesis in certain forest and peat mosses and simulated photosynthesis at various actual and hypothetical CO2 concentrations. Lindberg, 11, 86-93. SILVOLA, J., SAARNIO, S., FOOT, J., SUNDH, I., GREENUP, A., HEIJMANS, M., EKBERG, A., MITCHELL, E. & VAN BREEMAN, N. 2003. Effects of elevated CO2 and N deposition on CH4 emissions from European mires. Global Biogeochemical Cycles, 17(2), 1068, doi: 10.1029/2002GB001886. SINSABAUGH, R.L. 2010. Phenol oxidase, peroxidase and organic matter dynamics of soil. Soil Biol and Biochem, 42, 391-404. SKJELKVÅLE, B.L., STODDARD, J., JEFFRIES, D., TØRSETH, K., HØGÅSEN, T., BOWMAN, J., MANNIO, J., MONTEITH, D.T., MOSELLO, R., ROGORA, M., RZYCHON, D., VESELY, J., WIETING, J., WILANDER, A. & WORSZTYNOWICZ, A. 2005. Regional scale evidence for improvements in surface water chemistry 1990-2001. Environmental Pollution, 137,165-176. SMART, S.M., ROBERTSON, J.C., SHIELD, E.J. & VAN DE POLL, H.M. 2003. Locating eutrophication effects across British vegetation between 1990 and 1998. Global Change Biology, 9, 1763-1774. SMITH, J.U., SMITH, P., WATTENBACH, M., ZAEHLE, S., HIEDERER, R., JONES, R.J.A., MONTANARELLA, L., ROUNSEVELL, M.D.A., REGINSTER, I. & EWERT, F. 2005. Projected changes in mineral soil carbon of European croplands and grasslands 1990-2080. Global Change Biology, 11, 2141-2152. SMITH, P., SMITH, J.U., WATTENBACH, M., MEYER, J., LINDNER, M., ZAEHLE, S., HIEDERER, R., JONES, R., MONTANARELLA, L., ROUNSEVELL, M., REGINSTER, I. & KANKAANPÄÄ, S. 2006. Projected changes in mineral soil carbon of European forests 1990-2100. Canadian Journal of Soil Science, 86, 159-169. SMITH, P., FANG, C., DAWSON, J.J.C. & MONCREIFF, J.B. 2008b. Impact of global warming on soil organic carbon. Advances in Agronomy, 97, 1-43. STEVENS, C.J., DISE, N.B., MOUNTFORD, J.O. & GOWING, D.J. 2004. Impact of nitrogen deposition on the species richness of grasslands. Science, 303, 1876-1879. STEWART, A.J.A. & LANCE, A.N. 1983. Moor-Draining - a Review of Impacts on Land-Use. Journal of Environmental Management, 17, 81-99. STEWART, A.J.A. & LANCE, A.N. 1991. Effects of Moor-Draining on the Hydrology and Vegetation of Northern Pennine Blanket Bog. Journal of Applied Ecology, 28, 1105-1117.
A review of current evidence on carbon fluxes and greenhouse gas emissions from UK peatlands
69
TALLIS, J.H. 1997. The pollen record of Empetrum nigrum in southern Pennine peats: implications for erosion and climate change. Journal of Ecology, 85, 455-465. TALLIS, J.H. 1998. Growth and degradation of British and Irish blanket mires. Environmental Review, 6, 81-122. TIPPING, E., WOOF, C. & RIGG, E. 1999. Climatic influences on the leaching of dissolved organic matter from upland UK moorland soils, investigated by a field manipulation experiment. Environment International, 25, 83-95. TOLONEN, K. & TURUNEN, J. 1996. Accumulation rates of carbon in mires in Finland and implications for climate change. The Holocene, 6, 171-178. TRANVIK, L.J. & JANSSON, M. 2002. Terrestrial export of organic carbon. Nature, 415, 861-862. TUITTILA, E-S., KOMULAINEN, V-M., VASANDER, H. & LAINE, J. 1999. Restored cutaway peatland as a sink for atmospheric CO2. Oecologia, 120, 563-574. TURETSKY, M.R., MANNING, S.W. & WIEDER, R.K. 2004. Dating recent peat deposits. Wetlands, 24; 324-356. UK BIODIVERSITY GROUP. 2008. http://ukbap-reporting.org.uk VILE, M.A., BRIDGHAM, S.D., WIEDER, R.K. & NOVAK, M. 2003. Atmospheric sulphur deposition alters pathways of gaseous carbon production in peatlands. Global Biogeochemical Cycles, 17, 1058, doi:10.1029/2002GB001966. WADDINGTON, J.M. & WARNER, K.D. 2001. Restoring the carbon sink function of cut-over peatlands. Écoscience, 8, 359-368. WADDINGTON, J.M. & DAY, S.M. 2007. Methane emissions from a peatland following restoration. Journal of Geophysical Research, 112, G03018, doi:10.1029/2007JG000400. WADDINGTON, J.M., WARNER, K.D. & KENNEDY, G.W. 2002. Cutover peatlands: A consistent source of CO2. Global Biogeochemical Cycles, 16, 1002, doi: 10.1029/2001GB001398. WADDINGTON, J.M., TOTH, K. & BOURBONNIERE, R. 2008. Dissolved organic carbon export from a cutover and restored peatland. Hydrological Processes, 22, 2215-2224. WADDINGTON, J.M., STRACK, M. & GREENWOOD, M.J. 2010. Towards restoring the net carbon sink function of degraded peatlands: Short-term response in CO2 exchange to ecosystem-scale restoration. Journal of Geophysical Research, 115, G01008, doi:10.1029/2009JG001090. WALLAGE, Z.E., HOLDEN, J. & MCDONALD, A.T. 2006. Drain blocking: An effective treatment for reducing dissolved organic carbon loss and water discolouration in a drained peatland. Science of the Total Environment, 367, 811-821. WARBURTON, J. 2003. Wind-splash erosion of bare peat on UK upland moorlands. Catena, 52, 191-207.
A review of current evidence on carbon fluxes and greenhouse gas emissions from UK peatlands
70
WARD, S.E., BARDGETT, R.D., MCNAMARA, N.P., ADAMSON, J.K. & OSTLE, N.J. 2007. Long-term consequences of grazing and burning on northern peatland carbon dynamics. Ecosystems, 10, 1069-1083. WATSON, A. & NEDWELL, D.B. 1998. Methane production and emission from peat: the influence of anions (sulphate, nitrate) from acid rain. Atmospheric Environment, 32, 3239-3245. WERRITY, A. 2002. Living with uncertainty: climate change, river flows and water resource management in Scotland. The Science of the Total Environment, 294, 29-40. WHEELER, B.D., SHAW, S. & TANNER, K. 2009. A Wetland Framework for Impact Assessment at Statutory Sites in England and Wales, Environment Agency, Bristol, 748 pp. WILSON, L., WILSON, J., HOLDEN, J., JOHNSTONE, I. & MORRIS, M. (In review.) Recovery of water tables in Welsh blanket bog after drain-blocking: discharge rates, timescales and the influence of local conditions. Journal of Hydrology. WORRALL, F. & BURT, T.P. 2004. Time series analysis of long term river DOC records. Hydrological Processes, 18, 893-911. WORRALL, F. & BURT, T.P. 2007. The flux of dissolved organic carbon from UK rivers. Global Biogeochemical Cycles, 21, art. no. GB1013. WORRALL, F., REED, M., WARBURTON, J. & BURT, T.P. 2003. Carbon budget for a British upland peat catchment. Science of the Total Environment, 312, 133-146. WORRALL, F., HARRIMAN, R., EVANS, C.D., WATTS, C.D., ADAMSON, J., NEAL, C., TIPPING, E., BURT, T., GRIEVE, I., MONTEITH, D., NADEN, P.S., NISBET, T., REYNOLDS, B. & STEVENS, P. 2004. Trends in dissolved organic carbon in UK rivers and lakes. Biogeochemistry, 70, 369-402. WORRALL, F., BURT, T.P & ADAMSON, J.K. 2005. Fluxes of dissolved carbon dioxide and inorganic carbon from an upland peat catchment: implications for soil respiration. Biogeochemistry, 73, 515-539. WORRALL, F., BURT, T.P. & ADAMSON, J.K. 2006a. The rate of and controls upon DOC loss in a peat catchment. Journal of Hydrology, 321, 311-325. WORRALL, F., BURT, T.P. & ADAMSON, J.K. 2006b. Trends in drought frequency - the fate of Northern Peatlands. Climatic Change, 76, 339-359. WORRALL, F., BURT, T.P. & ADAMSON, J.K. 2006c. Long-term changes in hydrological pathways in an upland peat catchment - recovery from severe drought? Journal of Hydrology, 321, 5-20. WORRALL, F., ARMSTRONG, A. & ADAMSON, J.K. 2007a. The effect of burning and sheep-grazing on water table depth and soil water quality in a blanket bog. Journal of Hydrology, 339, 1-14. WORRALL, F., ARMSTRONG, A. & HOLDEN, J. 2007b. Short-term impact of peat drain-blocking on water colour, dissolved organic carbon concentration, and water table depth. Journal of Hydrology, 337, 315-325.
A review of current evidence on carbon fluxes and greenhouse gas emissions from UK peatlands
71
WORRALL, F., GIBSON, H.S. & BURT, T.P. 2007c. Modelling the impact of drainage and drain-blocking on dissolved organic carbon release from peatlands. Journal of Hydrology, 338, 15-27. WORRALL, F., BURT, T.P., ADAMSON, J.K., REED, M., WARBURTON, J., ARMSTRONG, A. & EVANS, M.G. 2007d. Predicting the future carbon budget of an upland peat catchment. Climatic Change, 85, 1-2. WORRALL, F., BURT, T.P. & ADAMSON, J.K. 2007e. Change in runoff initiation probability over a severe drought - implications for peat stability. Journal of Hydrology, 345, 16-26. WORRALL, F., BURT, T.P., ROWSON, J.G., WARBURTON, J. & ADAMSON, J.K. 2009a. The multi-annual carbon budget of a peat-covered catchment. Science of the Total Environment, 407, 4084-4094. WORRALL, F., EVANS, M.G., BONN, A., REED, M.S., CHAPMAN, D. & HOLDEN, J. 2009b. Can carbon offsetting pay for upland ecological restoration? Science of the Total Environment, 408, 26-36. WORRALL, F., BELL, M.J. & BHOGAL, A. 2010. Assessing the probability of carbon and greenhouse gas benefit from the management of peat soils. Science of the Total Environment, 13, 2657-2666. WORRALL, F., CLAY, G.D. & BURT, T.P. The multi-annual nitrogen budget of a peat-covered catchment - changing from sink to source? Global Change Biology (in review). YALLOP, A.R. & CLUTTERBUCK, B. 2009. Land management as a factor controlling dissolved organic carbon release from upland peat soils 1: Spatial variation in DOC productivity. The Science of the Total Environment, 407, 12, 3803-3813. YALLOP, A.R., CLUTTERBUCK, B. & THACKER, J. 2010. Increases in humic dissolved organic carbon export from upland peat catchments: the role of temperature, declining sulphur deposition and changes in land management. Climate Research (in press). ZERVA, A. & MENCUCCINI, M. 2005. Short-term effects of clearfelling in soil CO2, CH4 and N2O fluxes in a Sitka spruce plantation. Soil Biology and Biochemistry, 37, 2025-2036.
A review of current evidence on carbon fluxes and greenhouse gas emissions from UK peatlands
72
Appendix 1
Afforestation ALM, J., SCHULMAN, L., WALDEN, J., NYKANEN, H., MARTIKAINEN, P.J. & SILVOLA, J. 1999. Carbon balance of a boreal bog during a year with an exceptionally dry summer. Ecology, 80(1), 161-174. ANDERSON, D.E. 2002. Carbon accumulation and C/N ratios of peat bogs in North-West Scotland. Scottish Geographical Journal, 118, 4, 323-341. ARMENTANO, T.V. & MENGES, E.S. 1986. Patterns of change in the carbon balance of organic soil-wetlands of the temperate zone. Journal of Ecology, 74, 755-774. BRAINARD, J., LOVETT, A. & BATEMAN, I. 2003. Social & Environmental Benefits of Forestry Phase 2. Carbon sequestration benefits of woodland. Report to Forestry Commission Edinburgh. BURT, T.P., DONOHOE, M.A. & VANN, A.R. 1983. The effect of forestry drainage operations on upland sediment yields: The results of a storm based study. Earth Surface Processes and Landforms, 8, 339-346. BYRNE, K.A. & FARRELL, E.P. 2005. The effect of afforestation on soil carbon dioxide emissions in blanket peatland in Ireland. Forestry, 78, 217-227. BYRNE, K.A. & MILNE, R. 2006. Carbon stocks and sequestration in plantation forests in the Republic of Ireland. Forestry, 79(4), 361-369. CANNELL, M.G.R. 1999. Growing Trees to Sequester Carbon in the UK: Answers to some common questions. Forestry, 72(3), 237-247. CANNELL, M.G.R., DEWAR, R.C. & PYATT, D.G. 1993. Conifer Plantations on Drained Peatlands in Britain: a Net Gain or Loss of Carbon? Forestry, 66(4), 353-369. DOMISCH, T., FINER, L., KARSISTO, M., LAIHO, R. & LAINE, J. 1998. Relocation of carbon from decaying litter in drained peat soils. Soil Biol. Biochem, 30, 12, 1529-1536. GORHAM, E. 1990. Northern peatlands: Role in the carbon cycles and probable responses to climatic warming. Ecological Applications, 1(2), 182-195. GRAY, I.M. & EDWARDS-JONES, G. 1999. A review of the quality of environmental impact assessments in the Scottish forest sector. Forestry, 72(1), 1-10. HARGREAVES, K.J., MILNE, R. & CANNELL, M.G.R. 2003. Carbon balance of afforested peatland in Scotland. Forestry, 76(3), 299-317. HOLDEN, J., SHOTBOLT, L., BONN, A., BURT, T.P., CHAPMAN, P.J., DOUGILL, A.J., FRASER, E.D.G., HUBACEK, K., IRVINE, B., KIRKBY, M.J., REED, M.S., PRELL, C., STAGL, S., STRINGER, L.C., TURNER, A. & WORRALL, F. 2007. Environmental change in moorland landscapes. Earth-Science Reviews, 82, 75-100. JANDL, R., LINDNER, M., VESTERDAHL, L., BAUWENS, B., BARITZ, R., HAGEDORN, F., JOHNSON, D.W., MINKKINEN, K. & BYRNE, K.A. 2007. How strongly can forest management influence soil carbon sequestration. Geoderma, 137, 253-268.
A review of current evidence on carbon fluxes and greenhouse gas emissions from UK peatlands
73
MAKIRANTA, P., LAIHO, R., FRITZE, H., HYTONEN, J., LAINE, J. & MINKKINEN, K. 2009. Indirect regulation of heterotrophic peat soil respiration by water level via microbial community structure and temperature sensitivity. Soil Biology and Biogeochemistry , doi: 10.1016/j.soilbio.2009.01.004. MINKKINEN, K., LAINE, J., SHURPALI, N.J., MAKIRANTA, P., ALM, J. & PENTTILA, T. 2007. Heterotrophic soil respiration in forestry drained peatlands. Boreal Environment Research, 12, 115-126. MINKKINEN, K., KORHONEN, R., SAVOLAINEN, I. & LAINE, J. 2002. Carbon balance and radiative forcing of Finnish peatlands 1900-2100 - the impact of forestry drainage. Global Change Biology, 8, 785-799. MOUNT, N.J., SMITH, G.H.S. & STOTT, T.A. 2005. An assessment of the impact of upland afforestation on lowland river reaches: the Afon Trannon, mid-Wales. Geomorphology, 64 (3-4), 255-269. NEAL, C., REYNOLDS, B., NEAL, M., PUGH, B., HILL, I. & WICKHAM, H. 2001. Long-term changes in the water quality of rainfall, cloud water and stream water for the moorland, forested and clearfelled catchments at Plynlimon, mid Wales. Hydrology and Earth System Science, 5, 459-476. REYNOLDS, B. 2007. Implications of changing from grazed or semi-natural vegetation to forestry for carbon stores and fluxes in upland organo-mineral soils in the UK. Hydrology and Earth System Science, 11(1), 61-76. TOLONEN, K. & TURUNEN, J. 1996. Accumulation rates of carbon in mires in Finland and implications for climate change. The Holocene, 6, 171-178. TOLONEN, K. & TURUNEN, J. 1996. Accumulation rates of carbon in mires in Finland and implications for climate change. Holocene, 6, 171-178. VOMPERSKY, S.E., SMAGINA, M.V., IVANOV, A.I. & GLUKHOVA, T.V. 1992. The effect of forest drainage on the balance of organic matter in forest mires. In: O.M. BRAGG, P.D. HULME, H.A.P. INGRAM, R.A. ROBERTSON, eds. Peatland Ecosystems and Man: An Impact Assessment. Department of Biological Sciences, University of Dundee, UK, 17-22. WARREN, C. 2000. Birds, bogs and forestry revisited: The significance of the Flow Country controversy. Scottish Geographical Journal, 116(4), 315-337.
A review of current evidence on carbon fluxes and greenhouse gas emissions from UK peatlands
74
Appendix 2 Managed burning BALL, M.E. 1974. Floristic changes on grasslands and heaths on the Isle of Rhum after a reduction or exclusion of grazing. Journal of Environmental Management, 2, 299-318. CLAY, G.D., WORRALL, F. & FRASER, E.D. Effects of managed burning upon Dissolved Organic Carbon (DOC) in soil water and runoff water following a managed burn of a UK blanket bog. Journal of Hydrology (2009), doi: 10.1016/j.jhydrol.2008.12.022. DAWSON, J.C. & SMITH, P. 2007. Carbon losses from soil and its consequences for landuse management. Science of the total environment, 382, 165-190. DIKICI, H. & YILMAZ, C.H. 2006. Peat fire effects of some properties of an Artificially Drained Peatland. Journal of Environmental Quality, 35, 866-870. FORREST, G.I. 1971. Structure and production of North Pennine blanket bog vegetation. Journal of Ecology, 59(2), 453-479. GARNETT, M.H., INESON, P. & STEVENSON, A.C. 2000. Effects of burning and grazing on carbon sequestration in a Pennine blanket bog, UK. Holocene, 10(6), 729-736. IMESON, A.C. 1971. Heather burning and soil erosion on North Yorkshire Moors. Journal of Applied Ecology, 8, 537-548. KAUPPI, P.E. & TOMPPO, E. 1993. Impact of forests on net national emissions of Carbon Dioxide in West Europe. Water, Air and Soil Pollution, 70, 187-196. LANCE, A.N. 1983. Performance of Sheep on Unburned and Serially Burned Blanket Bog in Western Ireland. Journal of Applied Ecology, 20(3), 767-775. LIMPENS, J., BERENDSE, F., BLODAU, C., CANADELL, J.G., FREEMAN, C., HOLDEN, J., ROULET, N., RYDIN, H. & SCHAEPMAN-STRUB, G. 2008. Peatlands and the carbon cycle: from local processes to global implications - a synthesis. Biogeosciences, 5, 1475-1491. MITCHELL, G. & MCDONALD, A.T. 1995. Catchment Characterization as a Tool for Upland Water Quality Management. Journal of Environmental Management, 44, 83-95. PICOZZI, N. 1968. Grouse Bags in Relation to Management and Geology of Heather Moors. Journal of Applied Ecology, 5(2), 483-488. REIN, G., COHEN, S. & SIMEONI, A. 2009. Carbon emissions from smouldering peat in shallow and strong fronts. Proceedings of the combustion institute (2009) doi: 10.1016/j.proci.2008.07.008. TALLIS, J.H. 1987. Fire and Flood at Holme Moss: Erosion processes in an upland blanket mire. The Journal of Ecology, 75(4), 1099-1129. TAN, Z., TIESZEN, L.L., ZHU, Z., LIU, S. & HOWARD, S.M. 2007. An estimate of carbon emissions from 2004 wildfires across Alaskan Yukon River Basin. Carbon Balance and Management, 2, 12.
A review of current evidence on carbon fluxes and greenhouse gas emissions from UK peatlands
75
TUCKER, G. 2003. Review of the impacts of heather and grassland burning in the uplands on soils, hydrology and biodiversity. English Nature, Research Reports 550. WARD, S.E., BARDGETT, R.D., MCNAMARA, N.P., ADAMSON, J.K. & OSTLE, N.J. 2007. Long-term Consequences of Grazing and Burning on Northern Peatland Carbon Dynamics. Ecosystems, 10, 1069-1083. WIEDER, R.K., SCOTT, K.D., VILE, M.A., KAMMINGA, K. & VITT, D.H. 2007. Burning Bogs and Changing Climate: Will Peatland Carbon Sinks become Sources? In: B. ROBROEK, G. SCHAEPMAN-STRUB, J. LIMPENS, F. BERENDSE & A. BREEUWER eds. Proceedings of the First International Symposium on Carbon in peatlands, 15-18 April 2007, Wageningen, The Netherlands. 141pp. Wageningen University, Wageningen, NL. WORRALL, F., ARMSTRONG, A. & ADAMSON, J.K. 2007. The effects of burning and sheep-grazing on water table depth and soil water quality in a upland peat. Journal of Hydrology, 339, 1-14.
A review of current evidence on carbon fluxes and greenhouse gas emissions from UK peatlands
76
Appendix 3 Deforestation BYRNE, K.A. & FARRELL, E.P. 2005. The effect of afforestation on soil carbon dioxide emissions in blanket peatland in Ireland. Forestry, 78, 217-227. GLATZEL, S., KALBITZ, K., DALVA, M. & MOORE, T. 2003. Dissolved organic matter properties and their relationship to carbon dioxide efflux from restored peat bogs. Geoderma, 113, 397-411. NEAL, C., REYNOLDS, B., NEAL, M., PUGH, B., HILL, I. & WICKHAM, H. 2001. Long-term changes in the water quality of rainfall, cloud water and stream water for the moorland, forested and clearfelled catchments at Plynlimon, mid Wales. Hydrology and Earth System Science, 5, 459-476. NEAL, C., REYNOLDS, B., WILKINSON, J., HILL, T., NEAL, M., HILL, S. & HARROW, M. 1998. The impacts of conifer harvesting on runoff water quality: a regional survey for Wales. Hydrology and Earth System Sciences, 2(2-3), 323-344. NIEMINEN, M. 2004. Export of dissolved organic carbon, nitrogen and phosphorus following clear-cutting of three Norway spruce forests growing on drained peatlands in southern Finland. Silva Fennica, 38(2), 123-132.
A review of current evidence on carbon fluxes and greenhouse gas emissions from UK peatlands
77
Appendix 4 Drainage ALM, J., SCHULMAN, L., WALDEN, J., NYKANEN, H., MARTIKAINEN, P.J. & SILVOLA, J. 1999. Carbon balance of a boreal bog during a year with an exceptionally dry summer. Ecology, 80(1), 161-174. BREEUWER, A., ROBROEK, B.J.M., LIMPENS, J., HEIJMANS, M.M.P.D., SCHOUTEN, M.G.C. & BERENDSE, F. 2008. Decrease summer water table depth affects peatland vegetation. Basic and Applied Ecology (2008), doi:10.1016/j.baae.2008.05.005, 1-10. BUBIER, J.L., BHATIA, G., MOORE, T.R., ROULET, N.T. & LAFLEUR, P.M. 2003. Spatial and Temporal Variability in Growing-Season Net Ecosystem Carbon Dioxide Exchange at a Large Peatland in Ontario, Canada. Ecosystems, 6, 353-367. BYRNE, K.A. & MILNE, R. 2006. Carbon stocks and sequestration in plantation forests in the Republic of Ireland. Forestry, 79(4), 361-369. CANNELL, M.G.R., DEWAR, R.C. & PYATT, D.G. 1993. Conifer Plantations on Drained Peatlands in Britain: a Net Gain or Loss of Carbon? Forestry, 66(4), 353-369. CLYMO, R.S. 1992. Productivity and decomposition of peatland ecosystems. In: O.M. BRAGG, P.D. HULME, H.A.P. INGRAM & R.A. ROBERTSON, eds. Peatland Ecosystems and Man: An Impact Assessment. Department of Biological Sciences, University of Dundee, UK, 3-15. CONLIN, M., TURETSKY, M., HARDEN, J. & MCGUIRE, D. 2007. Soil climate controls on C cycling in an Alaskan fen: responses to water table mediated by vegetation. In: B. ROBROEK, G. SCHAEPMAN-STRUB, J. LIMPENS, F. BERENDSE, & A. BREEUWER, eds. Proceedings of the First International Symposium on Carbon in peatlands, 15-18 April 2007, Wageningen, The Netherlands. 141pp. Wageningen University, Wageningen, NL. DAWSON, J.J.C., BILLETT, M.F., NEAL, C. & HILL, S. 2002. A comparison of particulate, dissolved and gaseous carbon in two contrasting upland streams in the UK. Journal of Hydrology, 257, 226-246. DIRKS, B.O.M., HENSEN, A. & GOUDRIAAN, J. 2000. Effect of drainage on CO2 exchange patterns in an intensively managed peat pasture. Climate Research, 14, 57-63. FREIBAUER, A., ROUNSEVELL, M.D.A., SMITH, P. & VERHAGEN, J. 2004. Carbon sequestration in the agricultural soils of Europe. Geoderma, 122, 1-23. FUNK, D.W., PULMAN, E.R., PETERSON, K.M., CRILL, P.M. & BILLINGS, W.D. 1994. Influence of water table on carbon dioxide, carbon monoxide and methane fluxes from taiga bog microcosms. Global Biogeochemical Cycles, 8, 271-278. GLENN, S., HEYES, A. & MOORE, T. 1993. Carbon dioxide and methane emissions from drained peatland soils, Southern Quebec. Global Biogeochemical Cycles, 7, 247-258. HENDRICKS, D.M.D., VAN HUISSTEDEN, J., DOLMAN, A.J. & VAN DER MOLEN, M.K. 2007. The full greenhouse gas balance of an abandoned peat meadow. Biogeosciences, 4, 411-424.
A review of current evidence on carbon fluxes and greenhouse gas emissions from UK peatlands
78
HOLDEN, J., CHAPMAN, P.J. & LABADZ, J.C. 2004. Artificial drainage of peatlands: hydrological and hydrochemical process and wetland restoration. Progress in Physical Geography, 28, 95-123. HOLDEN, J., SHOTBOLT, L., BONN, A., BURT, T.P., CHAPMAN, P.J., DOUGILL, A.J., FRASER, E.D.G., HUBACEK, K., IRVINE, B., KIRKBY, M.J., REED, M.S., PRELL, C., STAGL, S., STRINGER, L.C., TURNER, A. & WORRALL, F. 2007. Environmental change in moorland landscapes. Earth-Science Reviews, 82, 75-100. HOLDEN, J. 2005. Peatland hydrology and carbon release: why small scale process matters. Philosophical Transactions of the Royal Society A, 2891-2913. HUGHES, S., DOWRICK, D.J., FREEMAN, C. et al. 1999. Methane emissions from a gully mire in mid-Wales, UK under consecutive summer water table drawdown. Environmental Science and Technology, 33, 362-365. JAATINEN, K., LAIHO, R., MINKKINEN, K., PENNANEN, T., PENTTILA, T. & FRITZE, H. 2007. Microbial communities and soil respiration along a water-level gradient in a northern boreal fen. In: B. ROBROEK, G. SCHAEPMAN-STRUB, J. LIMPENS, F. BERENDSE & A. BREEUWER, eds. Proceedings of the First International Symposium on Carbon in peatlands, 15-18 April 2007, Wageningen, The Netherlands. 141pp. Wageningen University, Wageningen, NL. JAUHIAINEN, J., TAKAHAS, H., HEIKKINEN, J.E.P., MARTIKAINENZ, P.J. & VASANDERS, H. 2005. Carbon fluxes from a tropical peat swamp forest floor. Global Change Biology, 11, 1788-1797. JONES JR, J.B. & MULHOLLAND, P.J. 1998. Carbon Dioxide Variation in a Hardwood Forest Stream: An Integrative Measure of Whole Catchment Soil Respiration. Ecosystems, 1, 193-196. LAINE, A., WILSON, D., KIELY, G. et al. 2007. Methane flux dynamics in an Irish lowland blanket bog. Plant and Soil, 299, 181-193. LIMPENS, J., BERENDSE, F., BLODAU, C., CANADELL, J.G., FREEMAN, C., HOLDEN, J., ROULET, N., RYDIN, H. & SCHAEPMAN-STRUB, G. 2008. Peatlands and the carbon cycle: from local processes to global implications - a synthesis. Biogeosciences, 5, 1475-1491. LLOYD, C.R. 2006. Annual carbon balance of a managed wetland meadow in the Somerset Levels, UK. Agricultural and Forest Meteorology, 138, 1-4, 168-179. MAKIRANTA, P., LAIHO, R., FRITZE, H., HYTONEN, J., LAINE, J. & MINKKINEN, K. 2009. Indirect regulation of heterotrophic peat soil respiration by water level via microbial community structure and temperature sensitivity. Soil Biology and Biogeochemistry , doi: 10.1016/j.soilbio.2009.01.004. MCNEIL, P. & WADDINGTON, J.M. 2003. Moisture controls on Sphagnum growth and CO2 exchange on a cutover bog. Journal of applied ecology, 40, 354-367. MINKKINEN, K., KORHONEN, R., SAVOLAINEN, I. & LAINE, J. 2002. Carbon balance and radiative forcing of Finnish peatlands 1900-2100 - the impact of forestry drainage. Global Change Biology, 8, 785-799.
A review of current evidence on carbon fluxes and greenhouse gas emissions from UK peatlands
79
MACDONALD, J.A., FOWLER, D., HARGREAVES, K.J., SKIBA, U., LEITH, I.D. & MURRAY, M.B. 1998. Methane emission rates from a northern wetland; Response to temperature, water table and transport. Atmospheric Environment, 32(19), 3219-3227. MITCHELL, G. & MCDONALD, A.T. 1995. Catchment Characterization as a Tool for Upland Water Quality Management. Journal of Environmental Management, 44, 83-95. MOORE, P.D. 2002. The future if cool temperate bogs. Environmental Conservation, 29(1), 3-20. OECHEL, W.C., VOURLITIS, G.L., HASTINGS, S.J., et al. 1998. The effects of water table manipulation and elevated temperature on the net CO2 flux of wet sedge tundra ecosystems. Global Change Biology, 4, 77-90. ORR, H.G., WILBY, R.L., MCKENZIE HEDGER, M. & BROWN, I. 2008. Climate change in the uplands: a UK perspective on safeguarding regulatory ecosystem services. Climate Research, 37, 77-98. PARMENTIER, F.J.W., VAN DER MOLEN, M.K., DE JEU, R.A.M., HENDRICKS, D.M.D. & DOLMAN, A.J. 2008. CO2 fluxes and evaporation on a peatland in the Netherlands appear not affected by water table fluctuations. Agricultural and forest meterology (2008), doi:10.1016/j.agrformet.2008.11.007. ROULET, N.T., ASH, R., QUINTON, W. & MOORE, T.R. Methane flux from drained northern peatlands: effect of a persistent water table lowering on flux. Global Biogeochemical Cycles, 7, 749-769. ROULET, N.T., LAFLEUR, P.M., RICHARD, P.J.H., et al. 2007. Contemporary carbon balance and late Holocene carbon accumulation in a northern peatland. Global Change Biology, 13, 397-411. VOMPERSKY, S.E, SMAGINA, M.V., IVANOV, A.I. & GLUKHOVA, T.V. 1992. The effect of forest drainage on the balance of organic matter in forest mires. In: O.M. BRAGG, P.D. HULME, H.A.P. INGRAM & R.A. ROBERTSON, eds. Peatland Ecosystems and Man: An Impact Assessment. Department of Biological Sciences, University of Dundee, UK, 17-22. WADDINGTON, J., STRACK, M., TUITILLA, E.-S., WHITTINGTON, P., ST-ARNAUD, C., ROCHEFORT, L., BOURBONNIERE, R. & PRICE, J. 2007. The effects of water table draw-down on peatland hydrology, vegetation and carbon dynamics. In: B. ROBROEK, G. SCHAEPMAN-STRUB, J. LIMPENS, F. BERENDSE, & A. BREEUWER, eds. Proceedings of the First International Symposium on Carbon in peatlands, 15-18 April 2007, Wageningen, The Netherlands. 141pp. Wageningen University, Wageningen, NL.
A review of current evidence on carbon fluxes and greenhouse gas emissions from UK peatlands
80
Appendix 5 Drain-blocking ALM, J., SCHULMAN, L., WALDEN, J., NYKANEN, H., MARTIKAINEN, P.J. & SILVOLA, J. 1999. Carbon balance of a boreal bog during a year with an exceptionally dry summer. Ecology, 80(1), 161-174. BERGLUND, O., BERGLUND, K. & PERSSON, L. 2007. Effect of drainage depth on the emission of CO2 from cultivated organic soils, 133-138. In: T. OKRUSZKO, ed. Wetlands: Proceedings of the International Conference W3M wetlands: Modelling, Monitoring, Management, Wierzba, Poland. 22-25 September 2005. Routledge. BEST, E.P.H. & JACOBS, F.H.H. 1997. The influence of raised water table levels on carbon dioxide and methane production in ditch-dissected peat grasslands in the Netherlands. Ecological Engineering, 8, 129-144. BRIDGHAM, S.C., RICHARDSON, C.J. & MALTBY, E. et al. 1991. Cellulose decay in natural and disturbed peatlands in North Carolina. Journal of Environmental Quality, 20, 695-701. BUBIER, J.L., COSTELLO, A. & MOORE, T.R. et al. 1993. Microtopography and methane flux in boreal peatlands, Northern Ontario, Canada. Canadian Journal of Botany, 71, 1056-1063. CHOJINICKI, B.H., AUGUSTIN, J. & OLEJNIK, J. 2007. Impact of reflooding on greenhouse gas exchange of degraded fen peatlands. In: B. ROBROEK, G. SCHAEPMAN-STRUB, J. LIMPENS, F. BERENDSE. & A. BREEUWER, eds. Proceedings of the First International Symposium on Carbon in peatlands, 15-18 April 2007, Wageningen, The Netherlands. 141pp. Wageningen University, Wageningen, NL. CONLIN, M., TURETSKY, M., HARDEN, J. & MCGUIRE, D. 2007. Soil climate controls on C cycling in an Alaskan fen: responses to water table mediated by vegetation. In: B. ROBROEK, G. SCHAEPMAN-STRUB, J. LIMPENS, F. BERENDSE, & A. BREEUWER, eds. Proceedings of the First International Symposium on Carbon in peatlands, 15-18 April 2007, Wageningen, The Netherlands. 141pp. Wageningen University, Wageningen, NL. CHRISTENSEN, T.R. & COX, P. 1995. Response of methane emission from Arctic tundra to climatic change - results from a model simulation. Tellus Series B-47, 301-309. DAWSON, J.J.C., BILLETT, M.F., NEAL, C. & HILL, S. 2002. A comparison of particulate, dissolved and gaseous carbon in two contrasting upland streams in the UK. Journal of Hydrology, 257, 226-246. DIAMOND, J. & MIDDLETON, J. 2007. The effect of moisture on the decomposition processes in a peat-extracted bog in Southern Ontario, Canada. In: B. ROBROEK, G. SCHAEPMAN-STRUB, J. LIMPENS, F. BERENDSE, & A. BREEUWER, eds. Proceedings of the First International Symposium on Carbon in peatlands, 15-18 April 2007, Wageningen, The Netherlands. 141pp. Wageningen University, Wageningen, NL. GIBSON, H.S., WORRALL, F., BURT, T.P. & ADAMSON, J.K. DOC budgets of drained peat catchments. Hydrol Process. (submitted).
A review of current evidence on carbon fluxes and greenhouse gas emissions from UK peatlands
81
HENDRICKS, D.M.D., VAN HUISSTEDEN, J., DOLMAN, A.J. & VAN DER MOLEN, M.K. 2007. The full greenhouse gas balance of an abandoned peat meadow. Biogeosciences, 4, 411-424. HOLDEN, J., SHOTBOLT, L., BONN, A., BURT, T.P., CHAPMAN, P.J., DOUGILL, A.J., FRASER, E.D.G., HUBACEK, K., IRVINE, B., KIRKBY, M.J., REED, M.S., PRELL, C., STAGL, S., STRINGER, L.C., TURNER, A. & WORRALL, F. 2007. Environmental change in moorland landscapes. Earth-Science Reviews, 82, 75-100. HOLDEN, J. 2005. Peatland hydrology and carbon release: why small scale process matters. Philosophical Transactions of the Royal Society A, 2891-2913. JONES JR, J.B. & MULHOLLAND, P.J. 1998). Carbon Dioxide Variation in a Hardwood Forest Stream: An Integrative Measure of Whole Catchment Soil Respiration. Ecosystems, 1, 193-196. KOMULAINEN, V.M., TUITTILA, E.S., VASANDER, H. et al. 1999. Restoration of drained peatlands in southern Finland: initial effects on vegetation change and CO2 balance. Journal of Applied Ecology, 36, 634-648. LAFLEUR, P.M., MOORE, T.R., ROULET, N.T. et al. 2005. Ecosystem respiration in a cool temperate bog depends on peat temperature but not water table. Ecosystems, 8, 619-629. LLOYD, C.R. 2006. Annual carbon balance of a managed wetland meadow in the Somerset Levels, UK. Agricultural and Forest Meteorology, 138:1-4, 168-179. MACDONALD, J.A., FOWLER, D., HARGREAVES, K.J., SKIBA, U., LEITH, I.D. & MURRAY, M.B. 1998. Methane emission rates from a northern wetland: Response to temperature, water table and transport. Atmospheric Environment, 32: 19, 3219-3227. MCNEIL, P. & WADDINGTON, J.M. 2003. Moisture controls on Sphagnum growth and CO2 exchange on a cutover bog. Journal of applied ecology, 40, 354-367. MOORE, P.D. 2002. The future of cool temperate bogs. Environmental Conservation, 29:1, 3-20. NIEVEEN, J.P., CAMPBELL, D.I., SCHIPPER, L.A. et al. 2005. Carbon exchange of grazed pasture on a drained peat soil. Global Change Biology, 11, 607-618. ORR, H.G., WILBY, R.L., MCKENZIE HEDGER, M. & BROWN, I. 2008. Climate change in the uplands: a UK perspective on safeguarding regulatory ecosystem services. Climate Research, 37, 77-98. PARMENTIER, F.J.W., VAN DER MOLEN, M.K., DE JEU, R.A.M., HENDRICKS, D.M.D. & DOLMAN, A.J. 2008. CO2 fluxes and evaporation on a peatland in the Netherlands appear not affected by water table fluctuations. Agricultural and forest meteorology (2008), doi:10.1016/j.agrformet.2008.11.007. PETRONE, R.M., WADDINGTON, J.M. & PRICE, J.S. 2001. Ecosystem scale evapotranspiration and net CO2 exchange from a restored peatland. Hydrol. Proc. 15, 2839-2845. ROWSON, J.G., GIBSON, H.S., WORRALL, F., OSTLE, N., BURT, T.P. & ADAMSON, J.K. The complete carbon budget of a drained peat catchment. JGR-Biogeosciences (submitted).
A review of current evidence on carbon fluxes and greenhouse gas emissions from UK peatlands
82
SALANTAUS, T. 2007. Peatland restoration-induced changes in the DOC of recipient waters. In : B. ROBROEK, G. SCHAEPMAN-STRUB, J. LIMPENS, F. BERENDSE, & A. BREEUWER, eds. Proceedings of the First International Symposium on Carbon in peatlands, 15-18 April 2007, Wageningen, The Netherlands. 141pp. Wageningen University, Wageningen, NL. TUITTILA, E.S., KOMULAINEN, V.M., VASANDER, H. et al. 2000. Methane dynamics of a restored cut-away peatland. Global Change Biology, 6, 569-581. UPDEGRAFF, K., BRIDGHAM, S.D., PASTOR, J. et al. 2001. Response of CO2 and CH4
emissions from peatlands to warming and water table manipulation. Ecological Application, 11, 311-326. VAN DEN BOS, R. 2003. Restoration of former wetlands in the Netherlands: effect on the balance between CO2 and CH4 source. Netherlands journal of Geosciences 82(4), 325-332 . VASANDER, H., TUITTILA, E.S., LODE, E., LUNDIN, L., ILOMETS, M., SALLANTAUS, T., HEIKKILA, R., PITKANEN, M.L. & LAINE, J. 2003. Status and restoration of peatlands in northern Europe. Wetlands Ecology and Management, 11, 51-63. VEENEDNDAAL, E., HENDRICKS, D., KROON, P., SCHRIER, A., VAN HUISSTEDEN, K., HENSEN, A., DUIYZER, J., LEFFELAAR, P., BERENDSE, F. & DOLMAN, H. 2007. Carbon balance Greenhouse gas fluxes in intensive and extensive managed grasslands on peat. In: ROBROEK, B., SCHAEPMAN-STRUB, G., WORRALL, F., GIBSON, F.H. & BURT, T.P. 2007b. Modelling the impact of drainage and drain-blocking on dissolved organic carbon release from peatlands. Journal of Hydrology, 338, 15-27. WORRALL, F., ARMSTRONG, A. & HOLDEN, J. 2007. Short-term impact of peat drain-blocking on water colour, dissolved organic carbon concentration, and water table depth. Journal of Hydrology, 337, 315-325. WORRALL, F., REED, M., WARBURTON, J. & BURT, T. 2003. Carbon budget for a British upland peat catchment. The Science of the Total Environment, 312(1-3), 133-146. WORRALL, F., EVANS, M.G., BONN, A., REED, M., CHAPMAN, D. & HOLDEN, J. Can carbon offsetting pay for ecological restoration in uplands? J. Appl. Ecology (submitted).
A review of current evidence on carbon fluxes and greenhouse gas emissions from UK peatlands
83
Appendix 6 Grazing removal ANDERSON, P. & RADFORD, E. 1994. Changes in vegetation following reduction in grazing pressure on the National Trust’s Kinder Estate, Peak District, Derbyshire, England, Biological Conservation, 69, 55-63. CHARMAN, D.J. & SMITH, R.S. 1992. Forestry and blanket mires of Kielder forest, Northern England: Long term effects of vegetation. In: O.M. BRAGG, P.D. HULME, H.A.P. INGRAM, & R.A. ROBERTSON, eds. Peatland Ecosystems and Man: An Impact Assessment. Department of Biological Sciences, University of Dundee, UK, 226-230. DAWSON, J.J.C., BILLETT, M.F., NEAL, C. & HILL, S. 2002. A comparison of particulate, dissolved and gaseous carbon in two contrasting upland streams in the UK. Journal of Hydrology, 257, 226-246. GARNETT, M.H., INESON, P. & STEVENSON, A.C. 2000. Effects of burning and grazing on carbon sequestration in a Pennine blanket bog, UK. Holocene, 10(6), 729-736. KAUPPI, P.E. & TOMPPO, E. 1993. Impact of forests on net national emissions of Carbon Dioxide in West Europe. Water, Air and Soil Pollution, 70, 187-196. MACKAY, A.W. & TALLIS, J.H. 1995. Summit-type blanket mire erosion in the forest of Bowland, Lancashire, UK. Predisposing factors and implications for conservation. Biological Conservation, 76, 31-44. MEYLES, E.W., WILLIAMS, A.G., TERNAN, J.L., ANDERSON, J.M. & DOWD, J.F. 2006. The influence of grazing on vegetation, soil properties and stream discharge in a small Dartmoor catchment, Southwest England, UK. Earth Surface Processes and Landforms, 31, 622-631. NIEVEEN, J.P., CAMPBELL, D.I., SCHIPPER, L.A. & BLAIR, I.J. 2005. Carbon exchange of grazed pasture on a drained peat soil. Global Change Biology, 11, 607-618. ORR, H.G., WILBY, R.L., MCKENZIE HEDGER, M. & BROWN, I. 2008. Climate change in the uplands: a UK perspective on safeguarding regulatory ecosystem services. Climate Research, 37, 77-98. WARD, S.E., BARDGETT, R.D., MCNAMARA, N.P., ADAMSON, J.K. & OSTLE, N.J. 2007). Long-term Consequences of Grazing and Burning on Northern Peatland Carbon Dynamics. Ecosystems, 10, 1069-1083. WORRALL, F., ARMSTRONG, A. & ADAMSON, J.K. 2007. The effects of burning and sheep-grazing on water table depth and soil water quality in a upland peat. Journal of Hydrology, 339, 1-14.
A review of current evidence on carbon fluxes and greenhouse gas emissions from UK peatlands
84
Appendix 7 Revegetation ANDERSON, D.E. 2002. Carbon accumulation and C/N ratios of peat bogs in North-West Scotland. Scottish Geographical Journal, 118:4, 323-341. BIASI, C., LIND, S.E., PEKKARINEN, N.M., HUTTUNEN, J.T. & SHURPALI, N.J. 2008. Direct experimental evidence for the contribution of lime to CO2 release from managed peat soil. Soil Biology & Biochemistry, 40, 2660-2669. BORTOLUZZI, E., EPRON, D., SIEGENTHALER, A., GILBERT, D. & BUTTLER, A. 2006. Carbon balance of a European mountain bog at contrasting stages of regeneration. New Phytologist, 172, 708-718. EVANS, M., WARBURTON, J. & YANG, J. 2006. Eroding blanket peat catchments: Global and local implications of upland organic sediment budgets. Geomorphology, 79, 45-57. KELLER, J.K., BRIDGHAM, S.D., CHAPIN, C.T. & IVERSENA, C.M. 2005. Limited effects of six years of fertilization on carbon mineralization dynamics in a Minnesota fen. Soil Biology & Biochemistry, 37 (2005), 1197-1204. KIVIMAKI, S.K., YLI-PETAYS, M. & TUITTILA, E.S. 2008. Carbon sink function of sedge and sphagnum patches in a restored cut-away peatland: increased functional diversity leads to higher production. Journal of Applied Ecology, 45, 921-929. LIMPENS, J., BERENDSE, F., BLODAU, C., CANADELL, J.G., FREEMAN, C., HOLDEN, J., ROULET, N., RYDIN, H. & SCHAEPMAN-STRUB, G. 2008. Peatlands and the carbon cycle: from local processes to global implications - a synthesis. Biogeosciences, 5, 1475-1491. MACDONALD, J.A., FOWLER, D., HARGREAVES, K.J., SKIBA, U., LEITH, I.D. & MURRAY, M.B. 1998. Methane emission rates from a northern wetland: Response to temperature, water table and transport. Atmospheric Environment, 32:19, 3219-3227. MACKAY, A.W. & TALLIS, J.H. 1995. Summit-type blanket mire erosion in the forest of Bowland, Lancashire, UK: Predisposing factors and implications for conservation. Biological Conservation, 76, 31-44. MACKENZIE, S. 1992. The impact of catchment liming on blanket bogs, In: O.M. BRAGG, P.D. HULME, H.A.P. INGRAM, & R.A. ROBERTSON, eds. Peatland Ecosystems and Man: An Impact Assessment. Department of Biological Sciences, University of Dundee, UK, 31-37. MARINIER, M., GLATZEL, S. & MOORE, T.R. 2004. The role of cotton-grass (Eriophorum vaginatum) in the exchange of CO2 and CH4 at two restored peatlands, eastern Canada. Ecoscience, 11:2, 141-149. ORR, H.G., WILBY, R.L., MCKENZIE HEDGER, M. & BROWN, I. 2008. Climate change in the uplands: a UK perspective on safeguarding regulatory ecosystem services. Climate Research, 37, 77-98.
A review of current evidence on carbon fluxes and greenhouse gas emissions from UK peatlands
85
PETRONE, R.M., WADDINGTON, J.M. & PRICE, J.S. 2001. Ecosystem scale evapotranspiration and net CO2 exchange from a restored peatland. Hydrological processes, 15, 2839- 2845. TRINDER, C.J., ARTZ, R.E. & JOHNSON, D. 2008. Contribution of plant photosynthate to soil respiration and dissolved organic carbon in a naturally recolonising cutover peatland. Soil Biology & Biochemistry, 40 (2008), 1622-1628.
A review of current evidence on carbon fluxes and greenhouse gas emissions from UK peatlands
86
Appendix 8 Restoration of cutover peatland WADDINGTON, J.M. & WARNER, K.D. 2001. Restoring the carbon sink function of cut-over peatlands. Écoscience, 8, 359-368.