A Review of Governance and Anticorruption Indicators in East Asia and Pacific James H. Anderson* Senior Governance Specialist The World Bank Hanoi, Vietnam June 2009 [email protected]*This note has benefited from comments of Nick Manning and Luc Lecuit (peer reviewers) and Naazneen Barma, Nathaniel Heller, Steve Knack, Aart Kraay, Barbara Nunberg, and Deborah Perlman. The work has also benefitted from discussions with participants of the EAP-SAR workshop “Getting the GAC Going”, Bangkok, Thailand, May 5-9, 2008, and many informal discussions with colleagues including Catherine Anderson, Genevieve Boyreau, Kirida Bhaopichitr, Bert Hofman, Yasuhiko Matsuda, Shabih Ali Mohib, and Minh Van Nguyen. The compilation of sub-indicators from country-level PDF files was provided by Nick Berger. The findings, interpretations, and conclusions expressed in this paper are entirely those of the author. They do not necessarily represent the views of the World Bank, its Executive Directors, or the countries they represent. Public Disclosure Authorized Public Disclosure Authorized Public Disclosure Authorized Public Disclosure Authorized
*This note has benefited from comments of Nick Manning and Luc Lecuit (peer reviewers) and Naazneen Barma, Nathaniel Heller, Steve Knack, Aart Kraay, Barbara Nunberg, and Deborah Perlman. The work has also benefitted from discussions with participants of the EAP-SAR workshop “Getting the GAC Going”, Bangkok, Thailand, May 5-9, 2008, and many informal discussions with colleagues including Catherine Anderson, Genevieve Boyreau, Kirida Bhaopichitr, Bert Hofman, Yasuhiko Matsuda, Shabih Ali Mohib, and Minh Van Nguyen. The compilation of sub-indicators from country-level PDF files was provided by Nick Berger. The findings, interpretations, and conclusions expressed in this paper are entirely those of the author. They do not necessarily represent the views of the World Bank, its Executive Directors, or the countries they represent.
Pub
lic D
iscl
osur
e A
utho
rized
Pub
lic D
iscl
osur
e A
utho
rized
Pub
lic D
iscl
osur
e A
utho
rized
Pub
lic D
iscl
osur
e A
utho
rized
wb406484
Typewritten Text
66300
A Review of Governance and Anticorruption Indicators in East Asia and Pacific
1
Executive Summary The World Bank Group’s Governance and Anticorruption Strategy places a premium on monitoring as the key to accountability, calling for the use and development of disaggregated and actionable indicators “to inform the CPIA and to help track progress in specific reforms implemented by governments.” This note evaluates how well a large number of the most popular governance and anticorruption indicators serve these purposes in the East Asia and the Pacific region. The indicators are evaluated in terms of clarity, transparency, temporal and strategic relevance, and usefulness for constructive country dialogue. The note is, in part, a user’s guide for readers who may want to use these indicators. Expert Opinions Expert opinion indicators produced by risk rating agencies, such as the Economist
Intelligence Unit and the International Country Risk Guide are designed to provide investors with rough measures of risks. They are not designed with transparency and replicability in mind, and do not cleanly delineate exactly what they are measuring—as such, these indicators are not actionable. They change infrequently and have limited usefulness for assessing changes over time.
The expert opinion indicators produced by Freedom House and the World Bank’s CPIA more cleanly spell out how the assessments are made. The Freedom House assessments and procedures are publicly available, as are the CPIA assessments for IDA countries. Nevertheless, many of the assessments are unavoidably subjective. The procedures for vetting answers may lead to some circularity with other assessments.
The Open Budget Index and the Global Integrity Index go farther than any other expert opinion indicators in attempting to measure the policy and institutional side of governance. They focus on mostly objective indicators, use peer review processes to improve quality, and publish complete detail, including the peer reviewers’ comments. Despite these steps, some observers remain suspicious of these indicators, and confidence in their use for country dialogue varies considerably.
The PEFA indicators stand out for their emphasis on country-led processes. Although very valuable for dialogue, the small number of EAP countries that have published results makes them of little practical use for GAC monitoring.
Surveys of Firms and Households
The World Economic Forum’s annual Executive Opinion Survey, the largest global survey of firms, includes many questions related to governance and anticorruption. Sample sizes can be very small (76 for Indonesia, for example), and the samples themselves can be structured very differently from country to country. In addition, idiosyncrasies in method of administration and some practices used to alter the data,
A Review of Governance and Anticorruption Indicators in East Asia and Pacific
2
by throwing out outliers and presenting moving averages, limit the survey’s usefulness as an independent source for monitoring governance and anticorruption. The lack of public availability of raw data is also a concern. Nevertheless, for some countries and for some purposes, the data may be useful for illustrating key points for dialogue.
The World Bank’s Investment Climate Surveys also include many questions related to governance and anticorruption issues, have larger samples and the raw data is publicly available. The usefulness of the database for GAC purposes is limited, however, by the sometimes significant variation in questions across countries, by variations in sectors sampled, and by the age of the data. The summary statistics presented on the web can in some cases be misleading, since variations in questions are not clear and can have a significant impact on results. More recent efforts to improve harmonization of the questionnaires, and rolling out of the surveys in EAP, should improve their usefulness in the future.
The Transparency International Global Corruption Barometer is a large-scale cross-country survey of citizens, asking questions on both perceptions of, and experiences with, corruption. The country-level data are publicly available and may be useful for gauging actual citizen perceptions and experiences with corruption in certain sectors, especially those that citizens know best. The lack of publicly available raw data, and idiosyncrasies in method of data collections, limit its usefulness.
Aggregate Indicators
The Worldwide Governance Indicators essentially average together a large number of other governance indicators, mostly of the expert-opinion type described above. The fact that the mix of sub-indicators is different in different countries and different time periods limits their usefulness for making inferences about differences between countries, and is one factor that suggests they should not be used to examine changes in governance and anticorruption over time. They are a handy source for finding information about the myriad sub-indicators available and examining how some of those sub-indicators are changing, but the aggregates themselves should not be used for this purpose.
The Transparency International Corruption Perceptions Index also averages together the available sub-indicators, mostly expert opinion assessments, into a single index. This indicator has many of the same limitations as the WGIs. In addition, the methodology of anchoring scores to the previous year’s scores, and reusing previous year’s versions of survey results, makes them inappropriate for monitoring governance and anticorruption over time.
An Agenda for GAC Monitoring in EAP Most existing indicators were designed for specific purposes that are not necessarily in line with the need for monitoring of governance and anticorruption. Many are hobbled by limitations that limit their value for the East Asia and the Pacific region for identifying governance problems, for monitoring whether countries are successfully addressing
A Review of Governance and Anticorruption Indicators in East Asia and Pacific
3
governance challenges, and for our dialogue with our clients. Given the high profile that the institution has placed on the GAC agenda, the inability to say robustly how governance is changing in EAP suggests a serious disconnect. Some principles and options for bridging this chasm include: Consider a systematic effort to implement investment climate surveys and household
surveys across the entire region on a regular basis as is being done in some other regions. Such an approach can help answer questions about progress for the region as a whole, without relying on non-robust externally generated data. Plans are underway in 2009 to do just this.
As a region, East Asia and the Pacific includes some of the biggest and most dynamic countries in the world. While country-level indicators may be useful for some purposes, they may have little value for a large country with decentralized structures. Scaling up efforts to collect governance data through national statistics offices, in surveys large enough to capture the variation across provinces, as is currently being done in Vietnam, can help build capacity and demand for governance monitoring at the same time.
Much of the analysis in this note examines whether some popular governance and anticorruption indicators are measuring what many users believe they are measuring, but the question of whether they are measuring the right things remains. EAP needs to achieve a consensus about just what progress would look like. If the countries in EAP succeed in improving governance, how would we expect this improvement to manifest itself? A deliberate effort to answer this question should be the first step in the quest to improve governance monitoring in the East Asia and the Pacific region.
A Review of Governance and Anticorruption Indicators in East Asia and Pacific
4
A Review of Governance and Anticorruption Indicators in East Asia and Pacific
5
1. Why use indicators? The World Bank’s emphasis on governance and anticorruption has a long pedigree. At the 1996 Annual Meetings, World Bank president James Wolfensohn famously discussed the “cancer of corruption” and opened the door for the Bank to engage more actively on corruption issues. The next year, Helping Countries Combat Corruption – The Role of the World Bank provided strategic direction for such engagement.1 The World Bank quickly expanded its interventions to a broader focus on governance: The 1997 World Development Report was “devoted to the role and effectiveness of the state: what it should do, how it should do it, and how it can improve in a rapidly changing world.” In 2000, PREM produced Reforming Public Institutions and Strengthening Governance—A World Bank Strategy to further lay out an agenda for Bank interventions. Monitoring of progress, long recognized as essential, has only recently been elevated to a matter of World Bank policy. Although the World Bank gradually expanded its interventions in the areas of governance and anticorruption, it was not until 2006, with the adoption of the World Bank Group Governance and Anticorruption Strategy (GAC) that the importance of measurement became a matter of Bank policy. The GAC stresses this point:
Monitoring is key to accountability. Recognizing that IDA resources will continue to be allocated through the existing Country Policy and Institutional Assessment (CPIA) and Performance Based Allocation system, the Development Committee asked the Bank to further develop and use disaggregated and actionable indicators. Disaggregated and actionable indicators can serve two purposes—to inform the CPIA and to help track progress in specific reforms implemented by governments.
(World Bank, 2007) Measurement is needed if we are ever going to gauge success. The popular press, aided by analysis in some World Bank documents2, has continued to lament that progress is not
1 World Bank (1997a) laid out four pillars for the Bank’s work: (i) Preventing fraud and corruption within Bank-financed projects; (ii) Helping countries that request Bank support in their efforts to reduce corruption; (iii) Taking corruption more explicitly into account in country assistance strategies, country lending considerations, the policy dialogue, analytical work, and the choice and design of projects. (iv) Adding voice and support to international efforts to reduce corruption. The current WBG GAC Strategy’s focus on “GAC in Projects” and “Country-GACs” bear a close resemblance to the first two pillars of World Bank (1997a). 2 For example, Kaufmann, Kraay and Mastuzzi (KKM) 2006 state that there is no improvement in governance worldwide. Section 2 of the present note argues that such a conclusion is unwarranted. World Bank (2006) also reports a lack of improvement over time in the ICRG expert opinion indicator of corruption over the period from 1996 to 2006, noting that among 25 Bank borrowers with public sector reform programs, 19 had deterioration in their ICRG ratings for corruption. However, expert opinion indicators are not constrained to follow the same scale over time; moreover, this particular series had a major break in November 2001 suggestive of a realignment of scores. (Knack 2007). (IEG 2006 also cite
A Review of Governance and Anticorruption Indicators in East Asia and Pacific
6
being achieved and may not even be possible. An editorial in the Washington Post at the time of the adoption of the GAC Strategy in September 2006, for example, opined that the World Bank …
… has failed to provide a convincing explanation of how corruption can be reduced. The World Bank's evaluation department has found few measurable gains from anti-corruption programs over the past decade. Some experts conclude that targeting corruption is futile.
(Washington Post, 2006) Monitoring may be done for multiple purposes. Those interested in assessing the specific impacts of World Bank interventions, for example, would require detailed and narrowly defined indicators that would properly fit into the results chain. For example, projects introducing information technology in order to speed customs clearance times and reduce the incidence of bribery at customs, require indicators that track specifically those issues. Those interested in monitoring more broadly how well a country is progressing in reducing bureaucracy or reducing corruption would require a multitude of such indicators, or perhaps some broad summary measure. An indicator that suits one purpose may not suit another. Descriptive indicators also have value. For dialogue with some clients, particularly larger middle-income countries, the appetite may not be strong for normative evaluations of governance systems that lead implicitly or explicitly to rankings, or that suggest the country should be moving toward some ideal that may or may not be consistent with the country’s ideal. For such clients more descriptive indicators that simply outline how countries are similar or different can be more effective at advancing dialogue. Normative indicators continue to be in high demand. While descriptive indicators may be constructive for certain uses, discussion of many governance and corruption-related indicators inevitably lead to normative conclusions.3 Even large middle-income countries value indicators that place them in context and allow them to track progress toward an ideal.4 More generally, in the absence of evidence on how patterns of governance and levels of corruption are changing, perceptions such as those quoted above will inevitably continue. Being able to identify progress necessarily requires normative judgments on what progress means. The plethora of normative indicators of governance has grown largely in response to demand for those types of indicators.
the lack of improvement in the Worldwide Governance Indicators, which will also be dealt with in section 2 of this note.) 3 That is, with corruption there seems to clearly be one state of the world that is better than another—less is preferable to more, other things being equal. This stands in contrast to other topics, such as labor regulation, where it is not clear prima facie that less is better, as highlighted by the recent IEG evaluation of the Doing Business indicators. (World Bank Independent Evaluation Group, 2008). 4 For example, when referring to the EBRD-World Bank Business Environment and Enterprise Performance Survey in ECA, the former Prime Minister of Romania Monica Macovei said “I found the BEEPS findings extremely useful during my mandate focused on fighting corruption in Romania. The BEEPS reports are independent monitoring tools and they should not stay in a drawer or be only one day news. The BEEPS findings should be working instruments for those governments or NGOs which are serious and sincere about fighting corruption.” (Correspondence with the author.)
A Review of Governance and Anticorruption Indicators in East Asia and Pacific
7
Understanding the merits of existing indicators is a first step toward a larger program of monitoring of GAC. This paper will introduce and examine some popular indicators related to governance and anticorruption, emphasizing strengths and weaknesses of each and on this basis suggest whether and how those indicators might be used. In evaluating indicators of governance and anticorruption, it is useful to lay out the criteria of just what would make for a “good” indicator for the purposes of the World Bank governance and anticorruption strategy and monitoring:
1. Clarity. Is it clear what is being measured? Does it cleanly delineate policies and institutions or governance outcomes without conflating the two?
2. Transparency. Is the procedure relatively transparent and replicable? 3. Temporally relevant. Can the indicators be used to make comparisons over
time? 4. Strategically relevant. Can the indicators be used to make comparisons
across countries and across sectors? 5. Conducive to constructive dialogue. Are the indicators “actionable”? Do
the assessments suggest clear actions, and will following up on those actions results in improvements in the indicators in the future? Alternatively, are the indicators useful for arming reformers to push for change?
An indicator that does not satisfy all or even most of the criteria above may still be very useful. For example, an innovative indicator that shows changes over time within a country may still be useful for policy makers even if not for cross-country evaluation. Similarly, an indicator that is not useful for country dialogue may still be valuable for researchers. Nevertheless, this paper is predicated on the idea that a better understanding of how well an indicator fits with the above criteria will enable users to make better decisions in the selection of indicators for operational work, and this is the subject of the next section. An especially useful governance and anticorruption indicator cleanly delineates policies and institutions on the one hand, and the outcomes that we presume follow, on the other. The first helps us understand better what our clients are doing, and the second lets us know if those things are working. This note examines the governance and anticorruption indicators that are most widely used, and draws lessons from the analysis for EAP’s efforts to monitor GAC going forward. Section 2 will examine some of the most popular indicators of governance and anticorruption, and discuss their strengths and weaknesses. The focus of the analysis is on how well the indicators address the needs of monitoring governance and anticorruption. Section 3 concludes, arguing that while most of the indicators have some value and may be used opportunistically, all existing indicators fall short in some way. In order for the Bank to continually move forward on the GAC agenda in EAP, we will need to remain flexible enough to engage with clients on indicators for which they have significant confidence, and to actively encourage staff to innovate in the development of indicators for this purpose. In developing an improved program of GAC monitoring going forward, EAP will need to develop a consensus about the criteria for success on GAC.
A Review of Governance and Anticorruption Indicators in East Asia and Pacific
8
2. How do available indicators measure up? This section examines a selection of popular governance and anticorruption indicators for East Asia and the Pacific countries and discusses strengths and weaknesses along the criteria outlined in the introduction.
Expert Opinion Indicators
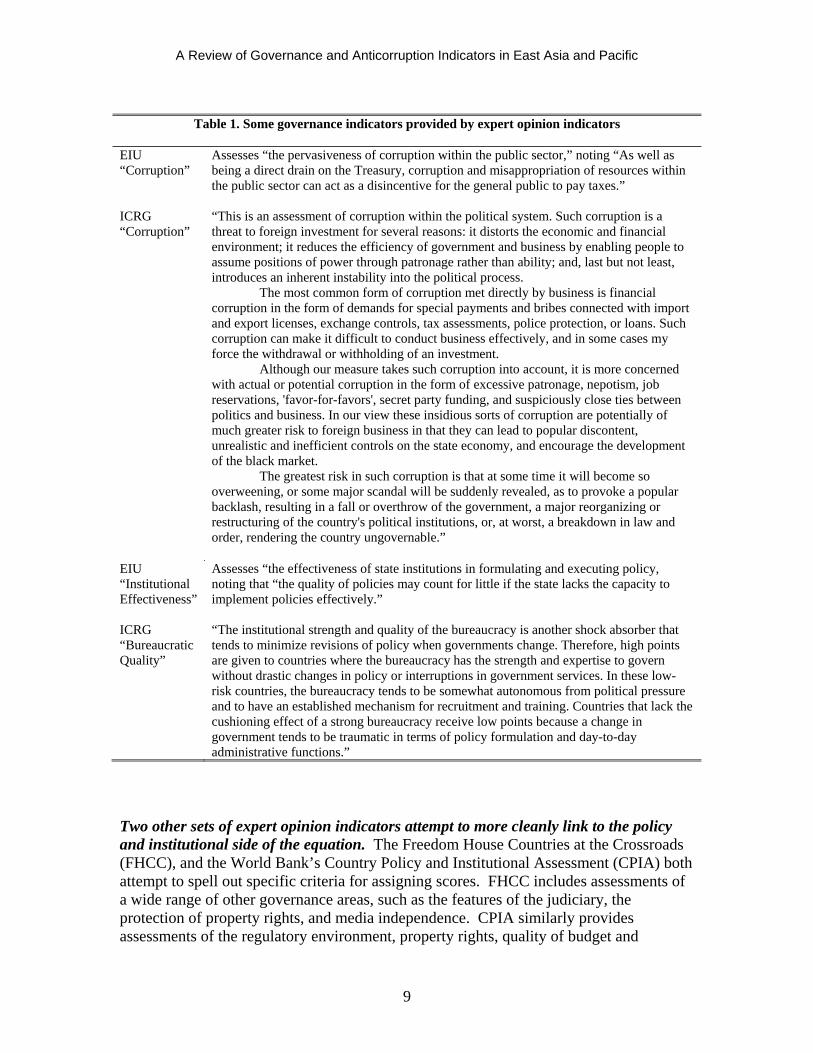
An expanding array of expert opinion indicators related to governance and anticorruption have become available in the past decades. Some, such as those compiled by the Economist Intelligence Unit (EIU) and by the International Country Risk Guide (ICRG), are designed to give international investors a sense of risks that they may face when investing in a country. Others, such as those presented by Freedom House, the Open Budget Initiative, and Global Integrity, are oriented toward pushing countries to make improvements on various aspects of governance and anticorruption. The World Bank’s own CPIA is used another purpose, that of ensuring that scarce IDA resources are provided on the most beneficial terms to decently governed countries. The Public Expenditure and Financial Accountability (PEFA) indictors have the added goal of supporting local capacity and initiative. The common denominator of these expert-opinion indicators is that they are essentially the opinions of small numbers of experts. Expert opinion indicators use varying definitions for their GAC-related indicators. Table 1 shows the definitions of measures of corruption and bureaucratic effectiveness used by two risk ratings agencies. While the EIU definition of corruption focuses on the outcome of (perceived) corruption, the ICRG definition’s emphasis on outcomes (corruption within the political system) has elements of the institutional environment (enabling people to assume positions of power through patronage rather than ability). Similarly, both EIU and ICRG focus on outcomes related to bureaucratic effectiveness, although the latter includes the institutional environment (established mechanisms for recruitment and training). Mixing outcomes with the policy and institutional environment may be acceptable for the purposes for which these organizations designed these indicators—advising clients about risks they may face in investment—but for the purposes of governance and anticorruption monitoring, these indicators have clear limitations. Transparency in the construction of expert opinion indicators varies. EIU and ICRG assessments are simply the judgments of their staff, no more and no less. The mechanisms by which they are constructed are as much a mystery to outsiders as the mechanisms by which the Bank’s CPIA are a mystery to those outside the Bank. This is not a criticism of these organizations—full transparency would undermine their business model—it is rather a recognition that for the purposes for which we use indicators in the World Bank, especially, for dialogue with clients, transparency is paramount.
A Review of Governance and Anticorruption Indicators in East Asia and Pacific
9
Table 1. Some governance indicators provided by expert opinion indicators
EIU “Corruption”
Assesses “the pervasiveness of corruption within the public sector,” noting “As well as being a direct drain on the Treasury, corruption and misappropriation of resources within the public sector can act as a disincentive for the general public to pay taxes.”
ICRG “Corruption”
“This is an assessment of corruption within the political system. Such corruption is a threat to foreign investment for several reasons: it distorts the economic and financial environment; it reduces the efficiency of government and business by enabling people to assume positions of power through patronage rather than ability; and, last but not least, introduces an inherent instability into the political process. The most common form of corruption met directly by business is financial corruption in the form of demands for special payments and bribes connected with import and export licenses, exchange controls, tax assessments, police protection, or loans. Such corruption can make it difficult to conduct business effectively, and in some cases my force the withdrawal or withholding of an investment. Although our measure takes such corruption into account, it is more concerned with actual or potential corruption in the form of excessive patronage, nepotism, job reservations, 'favor-for-favors', secret party funding, and suspiciously close ties between politics and business. In our view these insidious sorts of corruption are potentially of much greater risk to foreign business in that they can lead to popular discontent, unrealistic and inefficient controls on the state economy, and encourage the development of the black market. The greatest risk in such corruption is that at some time it will become so overweening, or some major scandal will be suddenly revealed, as to provoke a popular backlash, resulting in a fall or overthrow of the government, a major reorganizing or restructuring of the country's political institutions, or, at worst, a breakdown in law and order, rendering the country ungovernable.”
EIU “Institutional Effectiveness”
Assesses “the effectiveness of state institutions in formulating and executing policy, noting that “the quality of policies may count for little if the state lacks the capacity to implement policies effectively.”
ICRG “Bureaucratic Quality”
“The institutional strength and quality of the bureaucracy is another shock absorber that tends to minimize revisions of policy when governments change. Therefore, high points are given to countries where the bureaucracy has the strength and expertise to govern without drastic changes in policy or interruptions in government services. In these low-risk countries, the bureaucracy tends to be somewhat autonomous from political pressure and to have an established mechanism for recruitment and training. Countries that lack the cushioning effect of a strong bureaucracy receive low points because a change in government tends to be traumatic in terms of policy formulation and day-to-day administrative functions.”
Two other sets of expert opinion indicators attempt to more cleanly link to the policy and institutional side of the equation. The Freedom House Countries at the Crossroads (FHCC), and the World Bank’s Country Policy and Institutional Assessment (CPIA) both attempt to spell out specific criteria for assigning scores. FHCC includes assessments of a wide range of other governance areas, such as the features of the judiciary, the protection of property rights, and media independence. CPIA similarly provides assessments of the regulatory environment, property rights, quality of budget and
A Review of Governance and Anticorruption Indicators in East Asia and Pacific
10
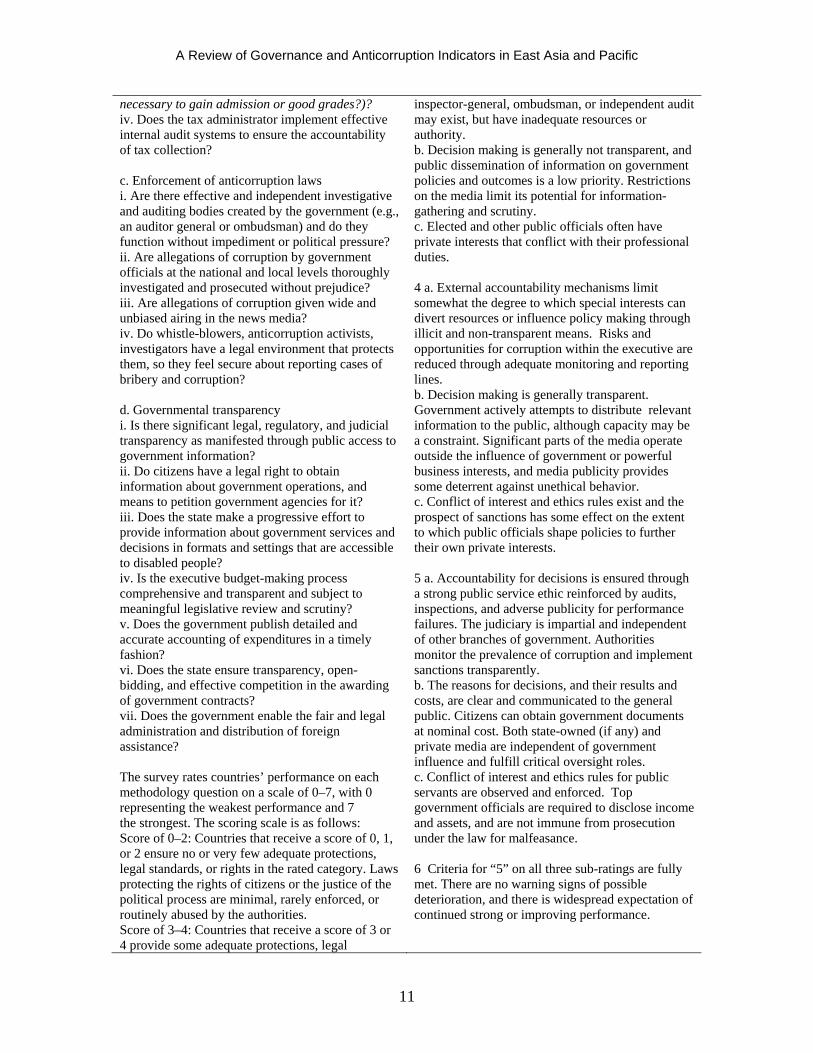
financial management. Table 2 provides definitions for indicators most closely related to corruption. The assessments focus mostly on the policy and institutional side of the equation, although some elements seem to also refer to the outcome side. For example, FHCC includes a criteria for whether corruption is controlled in higher education, and CPIA refers in several places to state capture, bribery, etc. Both FHCC and CPIA are somewhat more transparent than the indicators produced by risk rating agencies. For FHCC, the criteria and process are described in publicly available documents. Similarly, the processes by which the CPIA are constructed are known, at least within the Bank. For both FHCC and CPIA, however, transparency does not imply replicability. Ultimately, the scores involve placing a country on a scale and are unavoidably subjective. In the case of the CPIA, in particular, the teams generating the scores must distill many dimensions of the policy and institutional environment into a single number. The FHCC indicator more cleanly identifies exactly what is being rated, but nevertheless relies on subjective assessments.
Table 2. Criteria used by Freedom House and World Bank's CPIA Freedom House Countries at the Crossroads (Anticorruption and Transparency)
World Bank CPIA-16 (Transparency and Accountability)
Average of assessments for the criteria defined below. Each criteria is scored on a scale of 0 to 7 (defined further down). a. Environment to protect against corruption i. Is the government free from excessive bureaucratic regulations, registration requirements, and/or other controls that increase opportunities for corruption? ii. Does the state refrain from excessive involvement in the economy? iii. Does the state enforce the separation of public office from the personal interests of public officeholders? iv. Are there adequate financial disclosure procedures that prevent conflicts of interest among public officials (e.g., Are the assets declarations of public officials open to public and media scrutiny and verification?)? v. Does the state adequately protect against conflicts of interest in the private sector? b. Existence of laws, ethical standards, and boundaries between private and public sectors i. Does the state enforce an effective legislative or administrative process designed to promote integrity and to prevent, detect, and punish the corruption of public officials? ii. Does the state provide victims of corruption with adequate mechanisms to pursue their rights? iii. Does the state protect higher education from pervasive corruption and graft (e.g., Are bribes
Scale of 1 to 6, in half-point increments. The descriptions below define what constitutes a particular score: 1 a. There are no checks and balances on executive power. Public officials use their positions for personal gain and take bribes openly. Seats in the legislature and positions in the civil service are often bought and sold. b. Government decision-making is secretive. The public is prevented from participating in or learning about decisions and their implications. c. The state has been captured by narrow interests (economic, political, ethnic, and/or military). Administrative corruption is rampant. 2 a. There are only ineffective audits and other checks and balances on executive power. Public officials are not sanctioned for failures in service delivery or for receiving bribes. b. Decision making is not transparent, and government withholds information needed by the public and civil society organizations to judge its performance. The media are not independent of government or powerful business interests. c. Boundaries between the public and private sector are ill-defined, and conflicts of interest abound. Laws and policies are biased towards narrow private interests. Implementation of laws and policies is distorted by corruption, and resources budgeted for public services are diverted to private gain. 3 a. External accountability mechanisms such as
A Review of Governance and Anticorruption Indicators in East Asia and Pacific
11
necessary to gain admission or good grades?)? iv. Does the tax administrator implement effective internal audit systems to ensure the accountability of tax collection? c. Enforcement of anticorruption laws i. Are there effective and independent investigative and auditing bodies created by the government (e.g., an auditor general or ombudsman) and do they function without impediment or political pressure? ii. Are allegations of corruption by government officials at the national and local levels thoroughly investigated and prosecuted without prejudice? iii. Are allegations of corruption given wide and unbiased airing in the news media? iv. Do whistle-blowers, anticorruption activists, investigators have a legal environment that protects them, so they feel secure about reporting cases of bribery and corruption? d. Governmental transparency i. Is there significant legal, regulatory, and judicial transparency as manifested through public access to government information? ii. Do citizens have a legal right to obtain information about government operations, and means to petition government agencies for it? iii. Does the state make a progressive effort to provide information about government services and decisions in formats and settings that are accessible to disabled people? iv. Is the executive budget-making process comprehensive and transparent and subject to meaningful legislative review and scrutiny? v. Does the government publish detailed and accurate accounting of expenditures in a timely fashion? vi. Does the state ensure transparency, open-bidding, and effective competition in the awarding of government contracts? vii. Does the government enable the fair and legal administration and distribution of foreign assistance? The survey rates countries’ performance on each methodology question on a scale of 0–7, with 0 representing the weakest performance and 7 the strongest. The scoring scale is as follows: Score of 0–2: Countries that receive a score of 0, 1, or 2 ensure no or very few adequate protections, legal standards, or rights in the rated category. Laws protecting the rights of citizens or the justice of the political process are minimal, rarely enforced, or routinely abused by the authorities. Score of 3–4: Countries that receive a score of 3 or 4 provide some adequate protections, legal
inspector-general, ombudsman, or independent audit may exist, but have inadequate resources or authority. b. Decision making is generally not transparent, and public dissemination of information on government policies and outcomes is a low priority. Restrictions on the media limit its potential for information-gathering and scrutiny. c. Elected and other public officials often have private interests that conflict with their professional duties. 4 a. External accountability mechanisms limit somewhat the degree to which special interests can divert resources or influence policy making through illicit and non-transparent means. Risks and opportunities for corruption within the executive are reduced through adequate monitoring and reporting lines. b. Decision making is generally transparent. Government actively attempts to distribute relevant information to the public, although capacity may be a constraint. Significant parts of the media operate outside the influence of government or powerful business interests, and media publicity provides some deterrent against unethical behavior. c. Conflict of interest and ethics rules exist and the prospect of sanctions has some effect on the extent to which public officials shape policies to further their own private interests. 5 a. Accountability for decisions is ensured through a strong public service ethic reinforced by audits, inspections, and adverse publicity for performance failures. The judiciary is impartial and independent of other branches of government. Authorities monitor the prevalence of corruption and implement sanctions transparently. b. The reasons for decisions, and their results and costs, are clear and communicated to the general public. Citizens can obtain government documents at nominal cost. Both state-owned (if any) and private media are independent of government influence and fulfill critical oversight roles. c. Conflict of interest and ethics rules for public servants are observed and enforced. Top government officials are required to disclose income and assets, and are not immune from prosecution under the law for malfeasance. 6 Criteria for “5” on all three sub-ratings are fully met. There are no warning signs of possible deterioration, and there is widespread expectation of continued strong or improving performance.
A Review of Governance and Anticorruption Indicators in East Asia and Pacific
12
standards, or rights in the rated category. Legal protections are weak and enforcement of the law is inconsistent or corrupt. Score of 5: Countries that receive a score of 5 provide many adequate protections, legal standards or rights in the rated category. Rights and political standards are protected, but enforcement may be unreliable and some abuses may occur. A score of 5 is considered to be the basic standard of democratic performance. Score of 6–7: Countries that receive a score of 6 or 7 ensure all or nearly all adequate protections, legal standards, or rights in the rated category. Legal protections are strong and are enforced fairly. Citizens have access to legal redress when their rights are violated, and the political system functions smoothly. Note: Italics have been added to denote elements that more clearly point to corruption outcomes rather than the policy and institutional environment.
Expert opinion indicators tend to vary little over time, and the criteria for upgrades and downgrades are not always clear. Where they are clear, the reasons for the changes sometimes refer to other indicators, suggesting circularity in the indicators. For example, the narratives accompanying assessments by Freedom House often include references to the country’s ranking in the TI-CPI.5 Similarly, in the preparation of CPIA-16 scores, other indicators are consulted. This is done to limit grade inflation, but the implication is that CPIA scores are not wholly independent assessments, but are rather partially dependent on the received wisdom of other experts. Whether similar mechanics exist for Freedom House is not known, although the methodology described in Freedom House’s documentation suggests that a similar process goes on, whereby their local expert proposes scores and a central bodies vets the scores for “accuracy and fairness.”6 Two other expert opinion indicators have grown more prominent in recent years and both attempt to address some of the shortcomings associated with the other expert opinion indicators. Both the International Budget Project’s Open Budget Index (OBI) and Global Integrity’s Global Integrity Index (GII) are produced by international nongovernmental organizations in efforts to push governments toward greater accountability and transparency. Both attempt to be clear and objective in identifying criteria for the scores, i.e., they are designed to be highly actionable, and both incorporate peer review processes to enhance accuracy and raise credibility.
5 Of the four countries covered by the FHCC, two of the narratives referred to ranks in the TI-CPI. Another Freedom House publication, Nations in Transit justifies upgrades or downgrades by citing changes in the country’s ranking in the TI-CPI. 6 “Authors produced a first round of ratings by assigning scores on a scale of 0–7 for each of the eighty-three methodology questions, where 0 represents weakest performance and 7 represents strongest performance. The scores were then aggregated into eighteen subcategories and four main thematic areas. The regional advisers and Freedom House staff systematically reviewed all country ratings on a comparative basis to ensure accuracy and fairness. All final ratings decisions rest with Freedom House.” Freedom House (2007).
A Review of Governance and Anticorruption Indicators in East Asia and Pacific
13
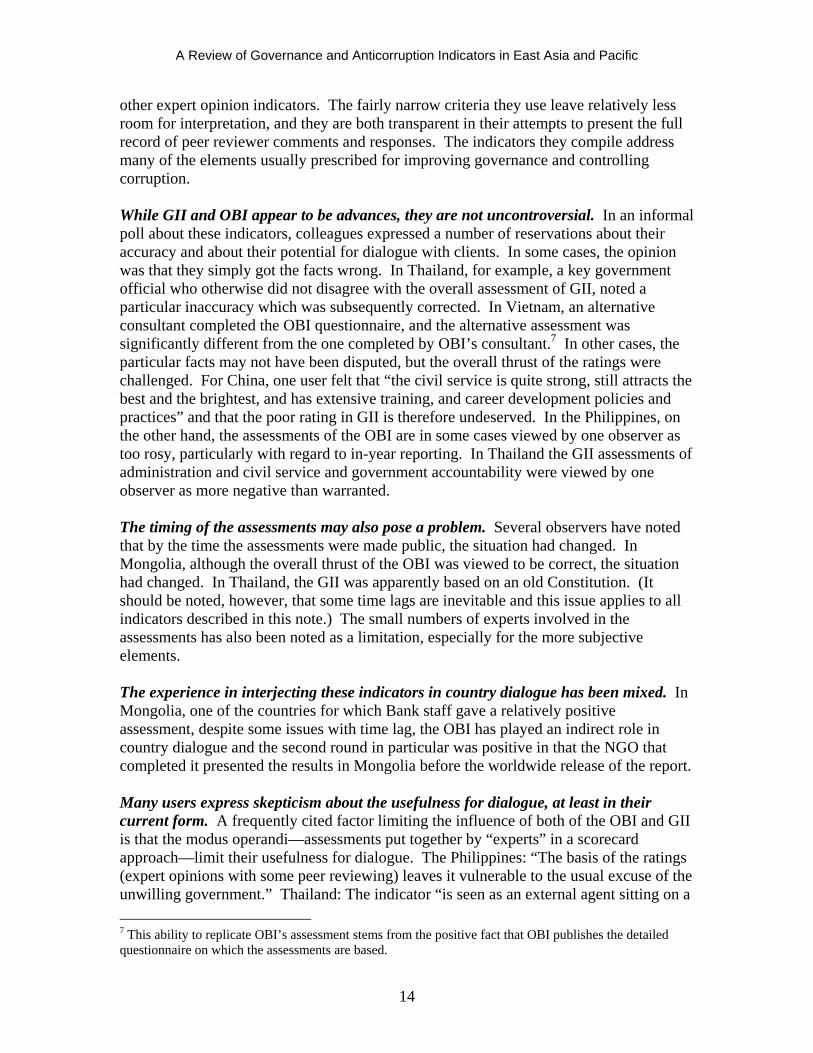
The Open Budget index provides measures of the policy and institutional side of governance. The OBI is founded on the idea that “access to information on government budgets and financial activities is essential to ensuring that governments are accountable to their citizens.” IBP works together with academics and civil society groups in 59 countries to create the index. A questionnaire containing 122 multiple choice questions assesses the public availability of seven key budget documents. The questionnaire is completed by one researcher, or group of researchers, in each country. The single completed questionnaire is then examined and refined by IBP staff, in discussions with the researchers who completed it, focusing on internal consistency and cross-checked against other publicly available information. Responses are meant to cover the period through September 2007, and any events taking place after that are excluded from the analysis. The most recent OBI was published in December 2008. The Global Integrity Index similarly places emphasis on the policy and institutional side of anticorruption, and to some extent governance more generally. The GII “assesses the existence and effectiveness of anti-corruption mechanisms that promote public integrity.” The index is based on more than 290 discrete indicators organized into six key categories: (i) civil society, public information, and media, (ii) elections, (iii) government accountability, (iv) administration and civil service, (v) oversight and regulations, and (vi) anticorruption and rule of law. GII emphasizes that it is “local and homegrown,” with most of the assessments generated by teams of researchers and journalists in the countries being assessed. The most recent iteration of GII, covering 55 countries and territories, was published on January 30, 2008, and is meant to cover the period from June 2006 to June 2007. Both OBI and GII use peer review processes. After IBP review, the questionnaire is submitted to two anonymous peer reviewers, chosen to be independent of both the government and the researchers. IBP then seeks to resolve any discrepancies between the peer reviewers and the researchers. In the case of GII, the assessments are prepared first by a lead researcher in the country and then blindly reviewed by additional in-country and external experts. In an effort to be transparent, all of the peer reviewer’s comments for both OBI and the GII are made publicly available. Despite the attempts to make criteria and assessments wholly objective, subjective assessments are unavoidable. The GII, for example, assesses “not only the existence of laws, regulations, and institutions designed to curb corruption but also their implementation, as well as the access that average citizens have to those mechanisms.” Whereas an objective criteria such as “In law, do citizens have a right of access to government information and basic government records?” may be expected to be roughly replicable, the subjective assessment of how well that law is implemented is unavoidably subjective. (Table 3) OBI criteria similarly require a subjective assessment of just how much information is made available. Both OBI and GII are advances over most earlier expert assessments in several respects. Although some of the criteria are unavoidably subjective, the efforts to make criteria that are objective, and therefore actionable and replicable, go farther than any
A Review of Governance and Anticorruption Indicators in East Asia and Pacific
14
other expert opinion indicators. The fairly narrow criteria they use leave relatively less room for interpretation, and they are both transparent in their attempts to present the full record of peer reviewer comments and responses. The indicators they compile address many of the elements usually prescribed for improving governance and controlling corruption. While GII and OBI appear to be advances, they are not uncontroversial. In an informal poll about these indicators, colleagues expressed a number of reservations about their accuracy and about their potential for dialogue with clients. In some cases, the opinion was that they simply got the facts wrong. In Thailand, for example, a key government official who otherwise did not disagree with the overall assessment of GII, noted a particular inaccuracy which was subsequently corrected. In Vietnam, an alternative consultant completed the OBI questionnaire, and the alternative assessment was significantly different from the one completed by OBI’s consultant.7 In other cases, the particular facts may not have been disputed, but the overall thrust of the ratings were challenged. For China, one user felt that “the civil service is quite strong, still attracts the best and the brightest, and has extensive training, and career development policies and practices” and that the poor rating in GII is therefore undeserved. In the Philippines, on the other hand, the assessments of the OBI are in some cases viewed by one observer as too rosy, particularly with regard to in-year reporting. In Thailand the GII assessments of administration and civil service and government accountability were viewed by one observer as more negative than warranted. The timing of the assessments may also pose a problem. Several observers have noted that by the time the assessments were made public, the situation had changed. In Mongolia, although the overall thrust of the OBI was viewed to be correct, the situation had changed. In Thailand, the GII was apparently based on an old Constitution. (It should be noted, however, that some time lags are inevitable and this issue applies to all indicators described in this note.) The small numbers of experts involved in the assessments has also been noted as a limitation, especially for the more subjective elements. The experience in interjecting these indicators in country dialogue has been mixed. In Mongolia, one of the countries for which Bank staff gave a relatively positive assessment, despite some issues with time lag, the OBI has played an indirect role in country dialogue and the second round in particular was positive in that the NGO that completed it presented the results in Mongolia before the worldwide release of the report. Many users express skepticism about the usefulness for dialogue, at least in their current form. A frequently cited factor limiting the influence of both of the OBI and GII is that the modus operandi—assessments put together by “experts” in a scorecard approach—limit their usefulness for dialogue. The Philippines: “The basis of the ratings (expert opinions with some peer reviewing) leaves it vulnerable to the usual excuse of the unwilling government.” Thailand: The indicator “is seen as an external agent sitting on a
7 This ability to replicate OBI’s assessment stems from the positive fact that OBI publishes the detailed questionnaire on which the assessments are based.
A Review of Governance and Anticorruption Indicators in East Asia and Pacific
15
high stool and releasing ‘results’ which are ‘pre-cooked’ based on perceptions, and waving a score card.”
Table 3. Sample Criteria used by Open Budget Index and Global Integrity Index Open Budget Index Global Integrity Index 14. Does the executive’s budget or any supporting budget documentation present the macroeconomic forecast upon which the budget projections are based? a. Yes, an extensive discussion of the macroeconomic forecast is presented, and key assumptions (such as inflation, real GDP growth, unemployment rate, and interest rates) are stated explicitly. b. Yes, the macroeconomic forecast is discussed and most of the key assumptions are stated explicitly, but some details are excluded. c. Yes, there is some discussion of the macroeconomic forecast(and/or the presentation of key assumptions), but it lacks important details. d. No, information related to the macroeconomic forecast is not presented. e. Not applicable/other (please comment)
12. Do citizens have a legal right of access to information? 12a. In law, citizens have a right of access to government information and basic government records. 12b. In law, citizens have a right of appeal if access to a basic government record is denied. 12c. In law, there is an established institutional mechanism through which citizens can request government records. … 13: Is the right of access to information effective? 13a: In practice, citizens receive responses to access to information requests within a reasonable time period. [responses of 100 75 50 25 0] Scale 100 Criteria: Records are available online, or records can be obtained within two weeks. Records are uniformly available; there are no delays for politically sensitive information. Legitimate exceptions are allowed for sensitive national security related information. Scale 50 Criteria: Records take around one to two months to obtain. Some additional delays may be experienced. Politically sensitive information may be withheld without sufficient justification. Scale 0 Criteria: Records take more than four months to acquire. In some cases, most records may be available sooner, but there may be persistent delays in obtaining politically sensitive records. National security exemptions may be abused to avoid disclosure of government information. …
From the perspective of some, the GII and OBI do have some potential for use in country dialogue. These views were generally accompanied by qualifiers suggesting that use for dialogue would be enhanced if the indicators were made more accurate, if the time lag issue could be ameliorated, and if presented to government counterparts upstream, rather than as a fait accompli with a worldwide press-release. The lack of upstream buy-in from governments does not seem to be merely a side-effect of the methodology, but an integral element. The authors of the OBI, for example, view it as a strength: “The research effort is intended to offer an independent, non-governmental view of the state of budget transparency in the countries studied. All of the researchers who
A Review of Governance and Anticorruption Indicators in East Asia and Pacific
16
completed the Open Budget Questionnaire are from academic or other non-governmental organizations.” (p. v). One expert-opinion indicator makes particular strides to develop country ownership. The Public Expenditure and Financial Accountability (PEFA) exercise, undertaken by the World Bank and other donors, supports “integrated and harmonized approaches to assessment and reform in the field of public expenditure, procurement and financial accountability.” The assessments, which draw on the HIPC expenditure tracking benchmarks and the IMF Fiscal Transparency Code, among others, provides letter grades for various aspects of public expenditure and financial accountability, prepared together with counterpart governments, following its emphasis on country-led reforms. Unfortunately, the emphasis on country ownership comes at a cost in terms of comparability across countries and over time. Only a small number of EAP countries, none of them large ones, have undertaken PEFA assessments and made the results public.8
Surveys
The World Economic Forum’s annual “Executive Opinion Survey” is probably the best known global survey of firms.9 The survey has included several governance-related questions, including, for example, questions about the perception of judicial independence and reliability of property rights, as well as questions on corruption. Table 4 shows questions on corruption from the WEF survey undertaken in early 2006.10 Moreover, many questions are repeated annually, permitting in some cases inferences about what is happening over time. This feature is extremely useful from the perspective of the Bank’s GAC work, but the degree of confidence we may have in relying on the WEF survey exclusively is limited by several factors. The sizes of the samples for the WEF survey can be small and vary considerably across countries. A positive feature of the presentation of the data in the annual WEF “Global Competitiveness Report” is that the description of their processes is clear and the annexes also present fairly detailed information about the samples of firms. Table 5 presents information on the sample sizes for countries in EAP, as well as three wealthy countries. While the sample sizes in some countries are adequate, for some countries the samples are very small—six of the nine EAP countries included in the sample have fewer than 100 firms in the sample, including some large countries. Although the documentation states that “sample sizes vary according to the size of the economy” (p. 87), this does not seem to be the case. Sweden and Spain have samples of 36 and 63 firms, respectively, while FYR Macedonia and Montenegro have samples of 104 and 72. Indonesia has
8 PEFA assessments are publicly available for Samoa, Timor-Leste, and Vanuatu. 9 The results of of the survey are presented in an annex to WEF (2006, 2007). 10 As reported in WEF 2006. Although the 2007 edition of the Global Competitiveness Report is more recent, the sector specific corruption questions were apparently dropped. Table 4 presents numbers from WEF 2006, while Table 5 and Table 6 present sample characteristics from WEF 2007.
A Review of Governance and Anticorruption Indicators in East Asia and Pacific
17
slightly fewer firms in the WEF survey than Mongolia, despite having some 80 times the population.11
Table 4. Corruption questions in World Economic Forum’s “Executive Opinion Survey” In your industry, how commonly would you estimate that firms make undocumented extra payments or bribes connected with getting favorable judicial decisions? (1=common, 7=never) In your industry, how commonly would you estimate that firms make undocumented extra payments or bribes connected with public contracts (investment projects)? (1=common, 7=never) In your industry, how commonly would you estimate that firms make undocumented extra payments or bribes connected with annual tax payments? (1=common, 7=never) In your industry, how commonly would you estimate that firms make undocumented extra payments or bribes connected with import and export permits? (1=common, 7=never) In your industry, how commonly would you estimate that firms make undocumented extra payments or bribes connected with connection to public utilities (e.g., telephone or electricity)?(1=common, 7=never) In your country, diversion of public funds to companies, individuals, or groups due to corruption? (1=is common, 7=never occurs) Do other firms’ illegal payments to influence government policies, laws, or regulations impose costs or otherwise negatively affect your firm? (1=yes, they have a significant negative impact, 7=no, they have no impact) Country Exports and
imports Public utilities
Tax collection
Public contracts
Judicial decisions
Diversion of public funds
Business costs of corruption
Cambodia 2.5 3.8 2.7 2.7 2.5 3.1 3.0China 4.4 4.7 4.5 3.8 4.1 3.3 3.8Indonesia 2.7 3.0 3.3 2.5 2.9 3.2 5.3Malaysia 5.3 5.7 5.9 4.8 5.7 5.0 5.2Mongolia 3.6 4.8 4.1 3.3 3.3 2.6 4.3Philippines 3.6 4.7 3.6 3.0 3.3 2.4 3.9Thailand 4.2 5.2 4.7 3.9 4.8 3.8 4.9Timor-Leste 3.7 3.7 4.4 3.8 3.7 2.7 3.6Vietnam 3.0 4.1 3.1 3.1 3.6 2.8 3.6 Japan 6.5 6.7 6.7 5.7 6.6 5.0 5.8Norway 6.6 6.7 6.7 6.3 6.7 6.3 6.6USA 5.4 5.7 5.6 5.0 5.5 5.0 5.3Source: World Economic Forum (2006) The samples of firms may differ considerably from country to country in terms of the size of firms being sampled. (Table 5.) While Thailand does not have any firms in the sample with fewer than 100 employees, nearly half of the sample in Indonesia is made up
11 It is not necessary, of course, for samples to be proportional or even correlated with population, but very small samples for very large countries can be problematic.
A Review of Governance and Anticorruption Indicators in East Asia and Pacific
18
of firms of this size. While 68 and 75 percent of the samples in Japan and the USA12 are large firms, none of the firms in Timor-Leste, and less than 20 percent of the firms in the Philippines and Indonesia, are this large.
Table 5. Size distribution of firms in WEF survey Country Sample
sizeSmall firms
(% of sample)Medium firms(% of sample)
Large firms(% of sample)
Unknown size
Cambodia 101 28 50 17 6China 375 26 45 29 0Indonesia 76 45 38 17 0Malaysia 75 29 36 26 9Mongolia 84 30 58 12 0Philippines 37 30 43 19 8Thailand 54 0 37 61 2Timor-Leste 31 77 10 0 13Vietnam 194 20 49 24 7 Japan 112 9 20 68 2Norway 37 27 46 28 0USA 609 5 19 75 0Source: WEF (2007) Notes: Small firms are those with 100 of fewer employees, Medium firms are those with between 101 and 1,000 employees, Large firms are those with more than 1,000 employees. There is also variation in the WEF samples in terms of the type of ownership of firms. (Table 6). While the majority of sampled firms in Cambodia are foreign owned, the same is true of less than 10% of firms in China, Malaysia, Thailand, Japan and the USA. More than half of the samples in EAP are private domestic firms, except in Cambodia and Vietnam. Publicly owned firms make up more than a quarter of the sample for some countries (China, Thailand, and Vietnam), but are wholly absent from the samples in other countries (Timor-Lest and the Philippines). The implications of differing samples can not be assessed with firm-level data since it is, unfortunately, not publicly available. The relevant corruption questions, presented in Table 4, are all scaled subjective ratings and are therefore bounded. As such, the impact of variations in sampling on country-level averages is probably not as severe as would be the case for averaging unbounded responses, such as level of sales. Nevertheless, without firm-level data one can not rule out the possibility that the variations in sampling are instituting systematic bias on the responses depicted in Table 4. For example, numerous studies suggest that small firms encounter bribery more frequently than larger firms—if that is also the case for the firms in the WEF survey, then countries with samples skewed toward larger firms might have corruption levels that are underestimated, compared to countries with samples skewed towards smaller firms.13
12 The sample sizes for the USA increased considerably between 2006 and 2007, expanding from 235 firms to 609 firms. The distribution of firms was not notably different. 13 If differences in the samples across countries merely reflected differences in the populations, this would not be a problem. However, this does not seem to be the case. Thailand must surely have some firms with
A Review of Governance and Anticorruption Indicators in East Asia and Pacific
19
Table 6. Ownership distribution of firms in WEF survey
Country Sample
size Private
(%) Public
(%) Foreign
(%) Mixed
(%) Unknown
(%) Cambodia 101 44 1 51 0 4 China 375 55 30 6 1 7 Indonesia 76 67 8 16 0 9 Malaysia 75 61 19 7 0 13 Mongolia 84 77 6 13 0 4 Philippines 37 65 0 27 3 5 Thailand 54 52 26 7 4 11 Timor-Leste 31 61 0 29 0 10 Vietnam 194 45 26 18 1 11 Japan 112 71 1 6 1 21 Norway 37 3 5 84 0 8 USA 609 72 9 6 0 12 Source: WEF 2007. The description of the survey methodology for the WEF survey suggests some idiosyncrasies that could raise concerns over the representativeness of samples and comparability across countries. The method of administration is not uniform, making use of face-to-face interviews, mail-in or telephone questionnaires, and an online version. It is not reported which versions were used in which countries. To choose the samples, the WEF contacts their network of affiliate institutions and provides a guidebook encouraging them “to target top management business executives, with a particular focus on surveying the most sizable employers in their respective countries.” (p.87) In addition to the samples collected by the partner institutes, “the Forum’s member and partner companies are invited to take part in the Survey.” (p. 87). These deviations from random sampling may or may not have an impact on the results, but in any event should be known and recognized by data users. The description that the authors provide of attempts to “clean” the dataset lead to concerns about the representativeness of the overall sample. Five criteria are listed for throwing out a questionnaire, several of which could lead to systematic biases. For example, a questionnaire will be thrown out if “the average score across the entire questionnaire departs from the country average score across all questionnaires by more than three standard deviations.” (WEF 2007, p. 92.) In other words, the criteria for identifying outliers is determined on a country-by-country basis. The implication of this is that for a country where most responses are very favorable, say Germany, the probability of a very negative questionnaire being thrown out will be relatively high and the probability of a very positive questionnaire being thrown out will be zero. At the other end of the scale, for a country with mostly unfavorable responses, say Zimbabwe, the probability of throwing out positive responses will be much higher than the probability of throwing out negative responses. There is no justification for throwing out fewer than 100 employees. Indeed, although Thailand appears to be an outlier, it looks as if the local team there took most seriously the instruction to survey “the most sizable employers”, as described in the text.
A Review of Governance and Anticorruption Indicators in East Asia and Pacific
20
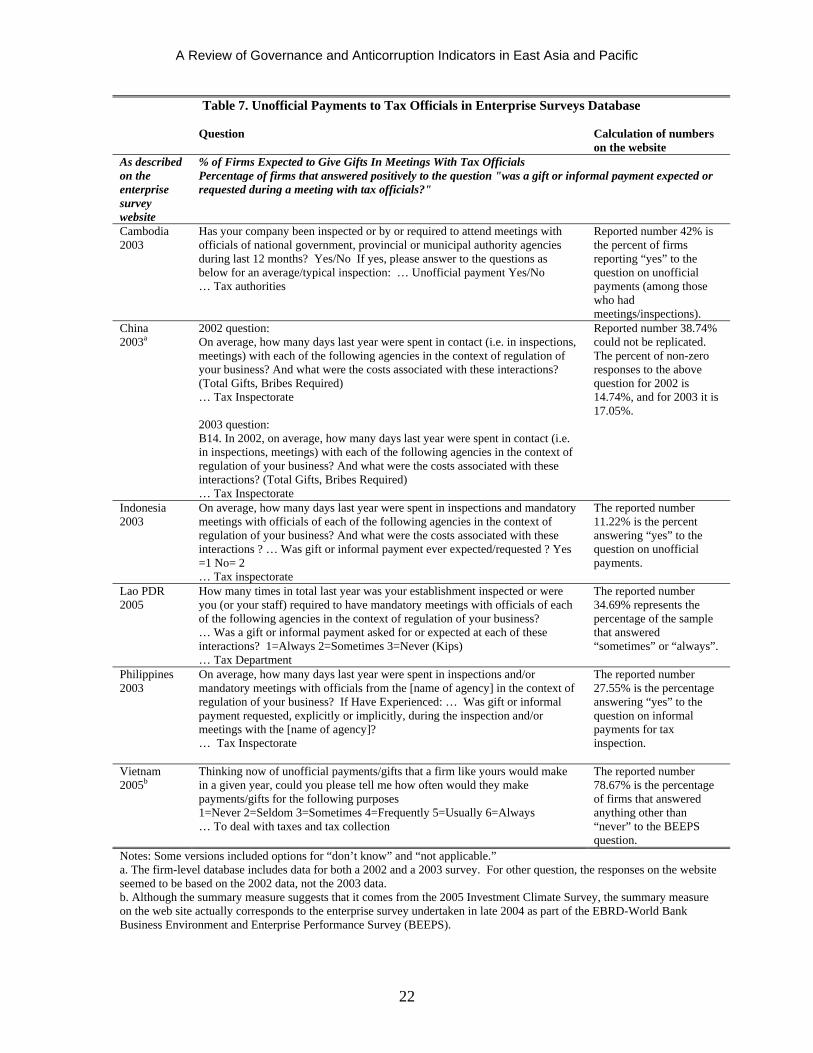
“outliers”, and a mechanism that determines outliers on a country-by-country basis in the manner described could lead to biases that make the good look better, and the bad look worse, than they really are. Recent changes in the WEF survey limit its usefulness for examining changes over time. Beginning with the most recent publication of the results of the survey, the WEF does not present that year’s response, but a moving average of the responses of two years. Although the WEF argues that this is justified on several grounds, it clearly limits the ability to examine changes over time. A second “innovation” beginning with the most recent publication is that most of the sector-specific corruption questions depicted in Table 4 were either not asked or not reported. Despite variations in sample and methodology across countries, the data from the WEF survey may still be useful for some purposes and for some countries, especially in cases where there is a complete absence of suitable alternatives. Some attention to the details of methodology and sampling, however, would be warranted. For example, the sample sizes in China and Vietnam may be sufficiently large to give confidence in the results, while the small samples for the Philippines and Thailand and others may suggest that it is better to refrain from using the data in a substantial way. The WEF makes information on the samples and methodology available in the Annexes so that users can reach informed decisions when deciding whether and how to use these indicators for a particular country.14 The World Bank’s Enterprise Surveys include a number of questions on governance and anticorruption. These surveys tend to have larger samples than the WEF survey, and include a varying assortment of questions about the business environment, interactions with the state, and corruption as well as questions on the financial results of the firm. Data are available both in summary form on the website15 and in firm-level datasets, also on the web. There are five summary statistics shown at the country-level on the website covering the overall frequency of bribery, the fraction of firms identifying corruption as a major problem, and the prevalence of bribery for obtaining operating licenses, for dealing with tax officials, and for securing government contracts. There are also many additional questions on other governance-related issues, particularly at the interface between state official and firms, such as dealing with licenses, inspections, labor regulations, etc. The country-level summary statistics, as presented on the website, may be misleading, at least within East Asia and the Pacific. The various investment climate surveys that produced the data for the web site were conducted between 2002 and 2005. During this period, the investment climate surveys tended to be somewhat idiosyncratic. Although questions were often similar, they were not identical and at times were very different. Table 7 provides the example of statistics on unofficial payments to tax officials. The actual questions that were asked on the survey were at times significantly different. This
14 Unfortunately, the World Bank’s library subscribes only to the hard copy of the annual Global Competitiveness Reports. 15 www.enterprisesurveys.org
A Review of Governance and Anticorruption Indicators in East Asia and Pacific
21
is particularly true for Vietnam. Although the website states that more than 78 percent of firms “answered positively to the question ‘was a gift or informal payment expected or requested during a meeting with tax officials?’”, the question from which the data for Vietnam were drawn actually asked: “Thinking now of unofficial payments/gifts that a firm like yours would make in a given year, could you please tell me how often would they make payments/gifts for the following purposes. 1=Never 2=Seldom 3=Sometimes 4=Frequently 5=Usually 6=Always” The website reports the percentage of firms that answered 2, 3, 4, 5, or 6. This question is actually taken from the EBRD-World Bank Business Environment and Enterprise Performance Survey (BEEPS), undertaken in Vietnam in late 2004. While the numbers for Vietnam, thus calculated, may be comparable to those of the other 33 countries (mostly in ECA) where the BEEPS was conducted, they are not comparable to the other countries in East Asia and the Pacific. In fact, an investment climate survey using the pattern of other countries in East Asia and the Pacific was done in Vietnam in 2005. Using the equivalent question on that survey would suggest that 48 percent of firms had encountered unofficial payments when dealing with taxes, very different from the 78 percent reported in the table of summary measures on the enterprise surveys web site.16 Although the summary measures presented on the enterprise surveys website should be treated with extreme caution, the firm-level data could still be very useful. Indeed, the same website makes all of the firm-level data available for replication and analysis, and this includes data from different years for the same country. A second important point with respect to the enterprise surveys is that most of the idiosyncrasies described above are no longer problems. Surveys undertaken in Latin America and the Caribbean, Africa since 2006, and Europe and Central Asia (currently underway), are harmonized to a greater degree. Encouraging, plans are underway to conduct similar surveys in East Asia and the Pacific in 2009. The TI-Global Corruption Barometer (TI-GCB) could be a useful tool for cross-country comparisons. The TI-GCB is a public opinion survey that assesses the general public’s perceptions and experience of corruption, carried out for Transparency International by Gallup International, as part of its Voice of the People Survey. The survey asks people about their opinions regarding which public sectors are the most corrupt, as well as other questions gauging the government’s success at fighting corruption. (Transparency International 2007.) In addition, the survey asks respondents simple factual questions such as “In the past 12 months, have you or anyone living in your household paid a bribe in any form to each of the following institution/organization? [electricity, gas, tax revenue, etc.]” With sample sizes of more than a thousand in most countries, the TI-GCB provides useful country snapshots of corruption as it impacts ordinary people. Unfortunately, only summary data is available for analysis and replication is therefore impossible.
16 Similarly, the reported proportion of firms that said corruption is a major or very severe problem for Vietnam is not comparable to those other EAP countries, since the data on the web reflect the BEEPS version of the question which goes on a 4-point scale, not the ICS version of the question which goes on a 5-point scale.
A Review of Governance and Anticorruption Indicators in East Asia and Pacific
22
Table 7. Unofficial Payments to Tax Officials in Enterprise Surveys Database Question Calculation of numbers
on the website As described on the enterprise survey website
% of Firms Expected to Give Gifts In Meetings With Tax Officials Percentage of firms that answered positively to the question "was a gift or informal payment expected or requested during a meeting with tax officials?"
Cambodia 2003
Has your company been inspected or by or required to attend meetings with officials of national government, provincial or municipal authority agencies during last 12 months? Yes/No If yes, please answer to the questions as below for an average/typical inspection: … Unofficial payment Yes/No … Tax authorities
Reported number 42% is the percent of firms reporting “yes” to the question on unofficial payments (among those who had meetings/inspections).
China 2003a
2002 question: On average, how many days last year were spent in contact (i.e. in inspections, meetings) with each of the following agencies in the context of regulation of your business? And what were the costs associated with these interactions? (Total Gifts, Bribes Required) … Tax Inspectorate 2003 question: B14. In 2002, on average, how many days last year were spent in contact (i.e. in inspections, meetings) with each of the following agencies in the context of regulation of your business? And what were the costs associated with these interactions? (Total Gifts, Bribes Required) … Tax Inspectorate
Reported number 38.74% could not be replicated. The percent of non-zero responses to the above question for 2002 is 14.74%, and for 2003 it is 17.05%.
Indonesia 2003
On average, how many days last year were spent in inspections and mandatory meetings with officials of each of the following agencies in the context of regulation of your business? And what were the costs associated with these interactions ? … Was gift or informal payment ever expected/requested ? Yes =1 No= 2 … Tax inspectorate
The reported number 11.22% is the percent answering “yes” to the question on unofficial payments.
Lao PDR 2005
How many times in total last year was your establishment inspected or were you (or your staff) required to have mandatory meetings with officials of each of the following agencies in the context of regulation of your business? … Was a gift or informal payment asked for or expected at each of these interactions? 1=Always 2=Sometimes 3=Never (Kips) … Tax Department
The reported number 34.69% represents the percentage of the sample that answered “sometimes” or “always”.
Philippines 2003
On average, how many days last year were spent in inspections and/or mandatory meetings with officials from the [name of agency] in the context of regulation of your business? If Have Experienced: … Was gift or informal payment requested, explicitly or implicitly, during the inspection and/or meetings with the [name of agency]? … Tax Inspectorate
The reported number 27.55% is the percentage answering “yes” to the question on informal payments for tax inspection.
Vietnam 2005b
Thinking now of unofficial payments/gifts that a firm like yours would make in a given year, could you please tell me how often would they make payments/gifts for the following purposes 1=Never 2=Seldom 3=Sometimes 4=Frequently 5=Usually 6=Always … To deal with taxes and tax collection
The reported number 78.67% is the percentage of firms that answered anything other than “never” to the BEEPS question.
Notes: Some versions included options for “don’t know” and “not applicable.” a. The firm-level database includes data for both a 2002 and a 2003 survey. For other question, the responses on the website seemed to be based on the 2002 data, not the 2003 data. b. Although the summary measure suggests that it comes from the 2005 Investment Climate Survey, the summary measure on the web site actually corresponds to the enterprise survey undertaken in late 2004 as part of the EBRD-World Bank Business Environment and Enterprise Performance Survey (BEEPS).
A Review of Governance and Anticorruption Indicators in East Asia and Pacific
23
Aggregates of other indicators
Aggregate indicators attempt to pull disparate data into a single index. Two popular17 aggregate indicators of governance and corruption are the Worldwide Governance Indicators (WGIs) made available by the World Bank, and the Corruption Perceptions Index produced by Transparency International (TI-CPI). Both are compilations of existing indicators, predicated on the assumption that the sub-indicators they aggregate are all imperfect measures of the same thing. Both are widely covered in the press and help direct attention of policy makers and the public alike to governance issues. The Transparency International Corruption Perceptions Index (TI-CPI) broke ground in the mid-1990s when researchers first sought to put together existing indicators of the perception of corruption into a comprehensive index covering a wide range of countries. Although originally intended as a research exercise, the compilation of a cross-country index of corruption coming out of a leading international NGO devoted to reducing corruption raised considerable attention, and the annual release of the TI-CPI continues to garner widespread press coverage. The documentation accompanying releases of the TI-CPI carefully explain that they measure corruption perceptions, not actual corruption, and provide examples of why the two may not be the same thing. The high-profile of the indicators, together with claims about the ability to measure over time and across countries, invariably leads to their interpretation in the popular press as official measures of levels of corruption.18 The Worldwide Governance Indicators (WGIs) have been produced by researchers at the World Bank since the late 1990s. Like the TI-CPI, the WGIs attempt to pull together available information from other sources, rather than produce new indicators, per se. Unlike the TI-CPI, the WGIs attempt to look more broadly at issues of governance, separated into six dimensions: (i) voice and accountability, (ii) political stability and absence of violence, (iii) government effectiveness, (iv) regulatory quality, (v) rule of law, and (vi) control of corruption. The WGIs also continue to be influential and help to draw attention to the issue of governance each year with their release. To keep this presentation manageable, and to be congruent with the TI-CPI, this note will focus on the indicators for control of corruption (WGI-CC).
17 As of June 2008, the abstract for KKM 2007 has been viewed on SSRN more than 39,000 times, and the paper downloaded more than 14,000 times. 18 Claims about suitability for measuring changes over time are conflicting. The press kit for Transparency International (2007) includes the candid, and correct, statement that “Year-to-year changes in a country's score can either result from a changed perception of a country's performance or from a change in the CPI’s sample and methodology. The only reliable way to compare a country’s score over time is to go back to individual survey sources, each of which can reflect a change in assessment.” However, the immediately preceding sentence in the documentation implies that the scores can be used to examine changes over time: “If comparisons with previous years are made, they should only be based on a country's score, not its rank, as outlined above.” In the longer document describing the methodology, Transparency International (2007, p.9) states: “This modification better assures that scores are consistent across time and better reveals whether countries have improved or deteriorated.”
A Review of Governance and Anticorruption Indicators in East Asia and Pacific
24
Aggregates are essentially averages of other indicators, including those discussed earlier in this note. The features of the aggregates are ultimately going to be driven by the quality and mix of the ingredients themselves, as well as the technology of mixing the sub-indicators. The method of combining the sub-indicators into the WGI-CC indicator is more-or-less as follows: (i) Canvass the world and collect country-level measures that are somehow related to corruption. These include things like the World Bank’s own CPIA-16, assessments of “corruption” by the Economist Intelligence Unit, and surveys of firms such as those of the World Economic Forum. (ii) Rescale these indicators in a sensible way so these can be averaged together. (iii) Examine how closely the indicators correlate with each other. Assume that those that are most highly correlated with others must be more correct than those that are less highly correlated. (iv) Average the indicators together, giving larger weights to indicators that are most highly correlated with others. Where data is not available for a country for a particular indicator, simply drop it and increase the other weights proportionally. (v) Rescale the resulting aggregates so that the mean is zero and the standard deviation is one. (vi) Use information on how many indicators were available for a country and how much they tend to agree with each other across countries to construct estimates of “margins of error.” For the TI-CPI, the steps are very similar, except that the sub-indicators get equal weights, and the scale is set to 1 through 10. In addition, the TI-CPI anchors the scores for one year to the previous year’s score and then applies a “beta transformation” to keep the scores from converging over time. TI-CPI also re-uses data from surveys that are up to three years old. For example, the WEF survey undertaken in early 2003 was used for the calculation of the TI-CPI scores for 2003, 2004, and 2005; the 2004 round of the survey was included in the 2004 and 2005 TI-CPI, etc.19 The WGI-CC and TI-CPI have both been subject to considerable analysis, often emphasizing their limitations. (Arndt and Oman 2006, Knack 2007). The producers of the WGI’s have published a paper “Answering the Critics” (Kaufmann, Kraay, and Mastruzzi, 2006) in response. Many of the issues, however, continue to be debated both within and outside the Bank (Arndt 2008). This section will examine some of the elements of this debate in the context of East Asia and the Pacific. At the heart of both WGI-CC and TI-CPI lies the assumption that the disparate measures of corruption by risk rating agencies, by experts at places like the World Bank, and through surveys of firms and households, are measuring the same thing.
The premise underlying this statistical approach should not be too controversial – each of the individual data sources we have provides an imperfect signal of some deep underlying notion of governance that is difficult to observe directly.
Kaufmann, Kraay and Mastruzzi (2006)
19 The WGIs also reuse scores, but only if more recent versions are not available. For example, scores from the 2002 round of the EBRD-World Bank Business Environment and Enterprise Performance Survey (BEEPS), which is only carried out every three years, were included in the WGIs in 2003, 2004, and 2005. Data from surveys that are done every year in every country are not re-used in the WGIs. For this and other reasons, the reusing of data does not pose as severe a problem for the WGIs.
A Review of Governance and Anticorruption Indicators in East Asia and Pacific
25
The various terms used by the sources ‘prevalence’, ‘commonness’, ‘frequency’, ‘likelihood’, ‘problematic’ and ‘severity’ are closely related. They all refer to some kind of extent of corruption. … The sources can be said to aim at measuring the same broad phenomenon.
Transparency International (2006)
Reviewing the definitions of “corruption” presented earlier, it seems evident that the definitions of corruption used by different sources vary considerably. Even when supplied by the same source, different aspects of corruption may be assessed differently. Indeed, much of the direction of research in the past ten years has been geared toward the idea that different forms of corruption can exist in different mixes and with different implications. World Bank (2000) and Hellman, Jones, and Kaufmann (2000) emphasized the differences between administrative corruption and state capture. Johnston (2006) examined four different “syndromes” of corruption, and both Spector (2005) and Campos and Pradhan (2007) emphasized the value of sector-specific anticorruption approaches. Different definitions of “corruption” in different indicators means different definitions of corruption in each country. The fact that all corruption is not equal would not be a problem if the TI-CPI and WGI-CC used the same mixes of sub-indicators in each country. A popular business environment indicator, the overall Doing Business ranking, is also essentially an aggregation of different things (starting a business, enforcing a contract, etc.), but they are applied in equal measure in each country. This is not the case for the TI-CPI and the WGI-CC. Since these measures attempt to take advantage of a wide range of existing indicators, and the existing indicators have very different country and temporal coverage, the result is that the matrix of data is mostly missing values. In EAP, the number of sources for WGI-CC range from as many as 17 (12 of which are expert opinion sources) for Indonesia, to as few as 2, both expert opinion sources, for some of the smaller islands.20 Creating a weighted average of numbers when some of the numbers are unknown leads to problems. The approach used by both WGI and TI-CPI is to simply drop the unknowns from analysis for any country where they are missing and then increase the weights of the others proportionally. The implication of this is that the definition of “corruption” in each country can be very different. Table 8 shows the values of the underlying indicators for WGI-CC for all EAP countries for 2006. The first thing to note about this table is that there are more cells empty than filled. The second thing to note is that the implicit definition of “corruption” may be very different from one country to the next. In five of the islands (Tonga, etc.) the WGI-CC indicator is a weighted average of the World Bank’s CPIA, the Asian Development Bank’s CPIA, and the expert assessment of Global Insight Business Conditions and Risk Indicators (WMO). For other islands, it is simply the weighted average of the World Bank’s and ADB’s CPIA. In Fiji, it is WMO, the World Bank’s CPIA, and the Transparency International Global
20 The abstract for the WGIs suggest that they are based on “hundreds of specific and disaggregated individual variables measuring various dimensions of governance, taken from 33 data sources provided by 30 different organizations”. (KKM 2007.)
A Review of Governance and Anticorruption Indicators in East Asia and Pacific
26
Corruption Barometer. As each of these underlying indicators is defined differently, the different combinations in different countries are similarly defined differently.
Table 8. Differing mixes of indicators in WGI-CC
asd2
006
bri2
006
ccr2
006
dri2
006
eiu2
006
frh2
006
gcb2
006
gcs2
006
gii2
006
gwp2
006
ifd2
006
mig
2006
pia2
006
prc2
006
prs2
006
qlm
2006
wcy
2006
wm
o200
6
Vietnam 0.5 0 0.37 0.45 0.25 0.38 0.38 0.71 0.64 0.2 0.4 0.25 0.42 0.1 0.25Indonesia 0.4 0.14 0.35 0.55 0 0.59 0.39 0.8 0.17 0.51 0.25 0.4 0.2 0.42 0.08 0.13 0.25Mongolia 0.5 0.41 0.42 0.51 0.25 0.3 0.33 0.5PNG 0.4 0.15 0 0.38 0.15 0.4 0.17 0.24 0.13Lao PDR 0.2 0.22 0.4 0 0.53 0.3 0.2 0.08 0.25Cambodia 0.3 0.35 0 0.32 0.28 0.44 0.15 0.3 0.08 0.25Tonga 0.2 0.2 0.25Kiribati 0.3 0.5 0.63Vanuatu 0.3 0.4 0.75Solomon Islands 0.4 0.4 0.5Samoa 0.7 0.6 0.5Philippines 0 0.5 0.66 0.25 0.62 0.38 0.6 0.19 0.58 0.15 -999 0.06 0.33 0.18 0.1 0.38Thailand 0.29 0.5 0.8 0 0.74 0.55 0.15 0.67 0.2 -999 0.2 0.25 0.26 0.19 0.63Malaysia 0.57 0.41 0.9 0.25 0.78 0.71 0.39 0.4 0.25 -999 0.38 0.42 0.38 0.49 0.63China 0.57 0.31 0.28 0 0.5 0.62 0.15 -999 0.37 0.25 0.14 0.22 0.38Timor-Leste 0.37 0.41 0.47 0.4 0.25Fiji 0.73 -999 0.38Micronesia 0.5 -999 Marshall Islands 0.3 -999 Myanmar 0.11 0 0.25 0.1 0.17 0.13Source: Compiled from individual country reports available in pdf format at http://info.worldbank.org/governance/wgi2007/ . Note: Entries of -999 indicate that the sub-indicator (the World Bank’s CPIA) was used in the calculations but is not made publicly available for that country. CPIA scores are publicly available for IDA countries, but not for others.
Another striking feature of Table 8 is the number of different implicit definitions of “corruption” across countries in the WGIs. Table 8 is sorted in such a way that one can easily see which indicators are available for which countries. The mix of indicators, and therefore the definition of “corruption”, for Vietnam is different from every other country in EAP. The same is true for nearly every other country in EAP. Excluding the islands, the eleven countries of EAP are assessed using ten different definitions of “corruption.” Only Thailand and Malaysia have scores that are produced using an identical set of underlying indicators. The varying mix of indicators is even more pronounced when examining countries in different regions, since some of the sub-indicators are region specific, and when examining smaller countries. As is clear from Figure 2, which presents the weights for the smallest21 country in each region, the implicit definition of “corruption” can be radically different from one country to another.
21 Micro-states were excluded. The figures shows the smallest country with population of near 1 million.
A Review of Governance and Anticorruption Indicators in East Asia and Pacific
27
Figure 1. Varying Definitions of “Corruption” in EAP (WGI-CC Weights)
0%
10%
20%
30%
40%
50%
60%
70%
80%
90%
100%
KH
M
CH
N
FJ
I
IDN
KIR
LA
O
MY
S
MH
L
FS
M
MN
G
MM
R
PN
G
PH
L
WS
M
SL
B
TH
A
TM
P
TO
N
VU
T
VN
M
WMO
WCY
QLM
PRS
PRC
PIA
MIG
LBO
IFD
GWP
GII
GCS
GCB
FRH
EIU
DRI
CCR
BRI
BPS
ASD
AFR
ADB
Figure 2. Varying Definitions of “Corruption” in Small Countries in Different Regions (WGI-CC Weights)
0%10%20%30%40%50%60%70%80%90%
100%
Bhutan
Djibouti
Estonia
Luxem
bourg
Swazila
nd
Timor-L
este
Trin. &
Tobag
o
WMO
WCY
QLM
PRS
PRC
PIA
MIG
LBO
IFD
GWP
GII
GCS
GCB
FRH
EIU
DRI
CCR
BRI
BPS
ASD
AFR
ADB
As this discussion makes clear, using the aggregates to make inferences about levels of corruption across countries leads to a conceptual difficulty: the definition of what is being measured is different in each country. Making inferences about changes over time is even more problematic for the same reason (among others, discussed below). The addition and subtraction of sources over time means that the definition of “corruption” is changing. This is illustrated in Figure 3 for Mongolia.
A Review of Governance and Anticorruption Indicators in East Asia and Pacific
28
Figure 3. Changing Definition of "Corruption" Over Time in Mongolia (WGI-CC Weights)
0%
10%
20%
30%
40%
50%
60%
70%
80%
90%
100%
1996 1998 2000 2002 2003 2004 2005 2006
wmo
wcy
qlm
prs
prc
pia
mig
lbo
ifd
gwp
gii
gcs
gcb
frh
eiu
dri
ccr
bri
bps
asd
afr
adb
A second, and more direct, reason that the WGIs should not be used to make inferences about changes over time is that they are rescaled each year to have a mean of zero and a standard deviation of unity. KKM maintain that they are comparable over time, despite this rescaling, and so some elaboration will be necessary. KKM (2006) write:
This evidence from our individual sources that world averages of governance are not changing much is crucial, because it allows us to interpret the relative changes in country scores on our aggregate indicators, or groups of countries' scores, as absolute changes. In particular, if world averages do not change, then it is appropriate for us to rescale our governance indicators to have the same mean in each period, and there is no difference between changes in countries' relative positions on our indicator, and their absolute changes. Kaufmann, Kraay, and Mastruzzi (2006)
The statement that “world averages of governance are not changing” is based on comparing the averages of select sub-indicators with global coverage, most recently for the three periods 1996, 2002, and 2006. For WGI-CC, KKM focus on five expert opinion indicators, and one survey, and show that three of the expert sources do not have appreciable change between 1996 and 2006, one shows significant improvement and one shows significant decline. The survey referred to in their analysis is the WEF survey, which was not available for 1996, but it is presented as having no change at all between 2002 and 2006. (KKM 2007, p. 36). This argument that governance is not improving has several problems. In comparing the average scores of the WEF survey over time, KKM have not restricted their analysis to countries that were included in the WEF survey in both periods. Between 2002 and 2006, the WEF survey expanded coverage considerably, adding 42 additional countries, and dropping only four. This would not make much difference if the additional countries were representative of the world, but they are not. From Angola to Zambia, they are mostly poor countries. If you restrict analysis to countries that were present in the survey
A Review of Governance and Anticorruption Indicators in East Asia and Pacific
29
in both 2002 and 2006, there is near certainty22 that there has been an improvement, even using KKM’s data which aggregates all corruption related scores on the WEF survey into a single number. Using the actual country-level responses from the WEF survey for specific types of corruption, the data show that for a consistent set of countries for the period 2002 to 2006, we can be 99.9% sure that there was improvement in corruption related to exports, 99.9% sure that there was improvement in corruption related to taxes, 99.9% sure that there was improvement in corruption related to courts, 99.9% sure that there was improvement in corruption related to utilities, and 99.9% sure that there was improvement in corruption related to procurement. The only global survey of firms, therefore, shows with near certainty that the global trend in corruption is in the right direction, showing improvement.23 What about the various expert sources? KKM 2007 report that one expert opinion source, DRI, shows significant improvement. KKM also report that the average score for both the EIU and WMO assessments of corruption show no significant changes, although, in fact, a pair-wise t-test shows an 80% probability of improvement by each measure.24 KKM report that the assessment of WMO does not show significant change between 2002 and 2006, however the modest worsening in the average actually is statistically significant.25 The large deterioration in the ICRG score ignores a well-known break in the data in late 2001 when ICRG apparently realigned scores (Knack 2007).26 Focusing on the period after this break, from 2002 to 2006, a pair-wise t-test of ICRG scores suggests an 80% chance that things had improved. In summary, most sources suggest improvement, not the reverse. What we have is the following: one expert opinion from a risk rating agency shows a significant improvement; three expert opinions show with 80% certainty that things had improved; one shows a significant worsening. The only global survey of firms shows with near certainty that there is improvement between 2002 and 2006 for nearly every aspect of corruption. These results do not support the statement that “the world average of governance is not
22 The t-statistic from a pair-wise t-test for an improvement between 2002 and 2006 is 4.48, indicating better than a 99.9% probability that there was improvement. 23 In addition, another large-scale survey of firms in the Europe and Central Asia region showed generalized reductions in corruption from 1999 to 2002 (Gray, Hellman, and Ryterman 2004) and again from 2002 to 2005 (Anderson and Gray 2006). 24 The t-statistics reported by KKM 2007 are apparently based on unpaired t-tests. The unpaired t-test essentially treats China in 1996 and China in 2006 as two different countries, drawn from an infinite universe of countries. The unpaired t-test does not take advantage of the fact that these are two observations on the same country. The pair-wise t-test, in contrast, matches observations on a single country and tests whether the average country’s score has changed. Using data pieced together by entering numbers from the WGI “Country Data Reports”, the t-statistic for the more appropriate pair-wise t-test of whether the change in score was non-zero, the t-statistic for DRI is 4.78 as opposed to 2.24 reported by KKM; for EIU it is 1.29 as opposed to 0.51; for PRS it is 11.47 as opposed to 7.10; for QLM it is 3.53 as opposed to 0.47; for WMO it is 1.32 as opposed to 1.08. 25 As discussed in the previous footnote. 26 KKM 2006 acknowledge this break in the ICRG series but take issue with the interpretation. For our purposes, the reason for the break in the series does not matter—the point is that there was a break in the series and data from before and after the break may not be comparable.
A Review of Governance and Anticorruption Indicators in East Asia and Pacific
30
changing.”27 The rescaling of the WGI-CC to have mean zero and standard deviation of unity28 renders them an inappropriate tool for examining changes over time. Data from EAP countries reinforce the concern about using the WGI-CC to make inferences about changes over time. As can be see for Mongolia in Figure 3, two additional sources were added between 1996 and 1998, and this corresponded with a deterioration in the WGI-CC score from about the 55th percentile of countries to about the 45th percentile. However, the only source that evaluated Mongolia in both periods, ICRG, gave identical ratings in those two periods. The decline in WGI scores clearly must have been due to (i) the addition of sources for Mongolia, (ii) changes in the mix of countries, or (iii) the rescaling to have mean zero and standard deviation of unity in each period, or some combination of these factors. In other words, the decline from the 55th to the 45th percentile for “control of corruption” is entirely an artifact of the methodology. Starting in 2005, the publication of data for CPIA scores for IDA countries makes it easier to see how movement in the aggregates relates to movement in the sub-indicators. Table 9 shows the number of sub-indicators showing improvement, worsening, or no change for each country in EAP. Most sub-indicators show no change, not surprisingly since many are expert opinion indicators. While for most countries the direction of the aggregate seems to go in the same direction as the balance of the sub-indicators, the cases of Cambodia and Mongolia stand out. In both cases, not a single sub-indicator matched the worsening showed in the aggregate.29 In Mongolia’s case, three sub-indicators showed improvement, while the aggregate showed a slight worsening. The change in the aggregate, however, is what garners attention: The PAD for one project in Mongolia cites Mongolia’s fall in relative position in the WGI-CC, among other evidence, of worsening corruption.30 A second feature that is apparent in Table 9 is that none of the changes in the aggregates are “significant,” and this would surely be part of the explanation of the anomalies described above. Indeed, according to the margins of error published along with the WGIs, not a single country in the world had a significant change in the level of corruption from 2005 to 2006. The published margins of error warrant greater discussion.
27 Even if all of the tests were inconclusive, the lack of evidence of a change is not the same thing as positive evidence of a lack of change. 28 KKM’s argument about the world level of governance not changing also does not address the rescaling of standard deviation to unity. 29 The same sort of anomaly appears in the “Voice and Accountability” indicator for Vietnam. From 2005 2006, four sub-indicators showed improvement, and none showed worsening, yet Vietnam worsened slightly in the aggregate WGI-VA. 30 “Mongolia’s ranking in the latest World Bank Governance Indicators (2008) has also fallen relative to other countries as compared to 2007 rankings.” (World Bank 2008, p. 11)
A Review of Governance and Anticorruption Indicators in East Asia and Pacific
31
Table 9. Changes in WGI-CC and Sub-indicators, 2005-2006 Number of sub-indicators showing … Country Change in WGI-CC Worsening No change Improvement Cambodia Worsening (not significant) 0 8 1 China Improvement (not significant) 4 6 3 Indonesia Improvement (not significant) 2 8 6 Malaysia Improvement (not significant) 2 6 5 Mongolia Worsening (not significant) 0 4 3 Philippines Worsening (not significant) 4 9 2 Thailand Worsening (not significant) 4 9 1 Timor-Leste Worsening (not significant) 1 1 1 Vietnam Improvement (not significant) 1 8 4 Notions of significance are based on the WGI “margins of error,” to be discussed elsewhere in this note. The “margins of error”, as published, do not square with the traditional interpretation of a margin of error. Motivating the complex approach to the aggregation methodology was the desire to “quantify the precision of the both individual sources of governance data as well as the aggregate governance indicators.” (Kaufmann, Kraay, and Zoido-Lobaton 1999) The “margins of error” published along with the WGIs have consistently been presented by the authors and some users as key strengths. In interpreting the margins of error, however, it is useful to consider exactly what that term traditionally means. A statistic such as the traditional confidence interval associated with a sample mean has a very specific interpretation: We may be interested, for example, in the proportion of firms that believe corruption is a problem. We estimate this proportion using observations from a sample survey of a subset of the population. Since we only have measurements for a sample, not for the whole population, we arrive at an estimate and then use information on the variance of responses and size of the sample to estimate the confidence interval for the true population mean. As elaborated earlier in this note, however, WGIs are based on different mixes of indicators in different countries and in different years. Rather that examining different observations on the same thing, as with the sample survey example above, the WGIs are based on different observations on different things. What the “margin of error” means in such a case is unclear. The aggregate indicators have been successful at raising the profile of corruption and other governance issues. The authors of both TI-CPI and the WGIs emphasize that their indicators are rough approximations, and for a researcher interested in a handy source of a wide mix of other indicators, both of these aggregates can be useful. The analysis in this section, echoing analysis of others cited earlier, suggests that certain features of the aggregates limit their usefulness for the specific purposes of interest in this paper. The varying mixes of sub-indicators across countries limit their usefulness for dialogue with policy makers about what specific problems the indicators suggest, and what should be done about them. Notwithstanding the question of whether the underlying indicators measure reality on the ground, or whether there is a lag before the underlying indicators reflect changes in the real situation, the changes in mix of indicators over time means that a country’s scores may change over time for a wide range of reasons that are unrelated to changes in the underlying indicators, much less to changes in the real situation in the
A Review of Governance and Anticorruption Indicators in East Asia and Pacific
32
country.31 Using aggregates in policy dialogue, therefore, poses the risks that positive actions by reformers would likely not be rewarded by improvements in the indicators.
3. How should governance and anticorruption indicators be used and developed in East Asia and the Pacific? Good measurement of governance and anticorruption is needed if we ever hope to be able to demonstrate results, or to be able to identify what works and why. Some sensible criteria for judging whether an indicator is useful for this purpose were elaborated, and a number of indicators were examined. Table 10 summarizes the strengths and weaknesses of various indicators for the particular purposes of dialogue and monitoring of governance and anticorruption. Many of the indicators, of course, were designed with somewhat different purposes in mind, such as providing rudimentary risk indicators for foreign investors or to provide a single indicator for use in research. The arbitrary, but informed, evaluations in Table 10 pertain only to the specific needs of the Bank. The analysis suggests several broad conclusions. First, many of the indicators are not sufficiently useful for the purposes of monitoring governance and anticorruption outcomes over time. This is particularly true of the big, and popular, aggregates. Focus on these aggregates is partly responsible for the mis-perception that there is no improvement and that improvement is not possible. Expert opinions of risk rating agencies tend to change infrequently and are not sufficiently transparent in construction for outsiders to rely on them for this purpose. Surveys could potentially play a role in monitoring, but the existing surveys in EAP are either too idiosyncratic, too geographically sparse, or undertaken too infrequently to systematically provide information on progress over time for the region. Second, for the purpose of providing strategic direction there is somewhat more information available: by highlighting countries where governance problems are most severe, or sectors within a country that are particularly challenged, or specific areas where a country’s policy and institutional package deviate from the standard policy prescriptions. Surveys, even if infrequent, may help identify sectors where firms and households report the most widespread corruption. Although the summary data provided on web sites can be misleading, careful analysis of the firm-level data can be useful. Several new sets of indicators, in particular the GII and OBI, are promising in that they are more highly “actionable” than any in existence before, and are also relatively transparent. For some countries, perceived inaccuracies, the lag between cut-off date and publication, and the lack of upstream presentation to government counterparts limit
31 Indeed, KKM (2008, p.23) make this point: “These examples underscore the importance of carefully examining the factors underlying changes in the aggregate governance indicators in particular countries. In order to facilitate this, on the WGI website users can retrieve the data from the individual indicators underlying our aggregate indicators and use this to examine trends in the underlying data as well as changes over time in the composition of data sources on which the estimates are based.”
A Review of Governance and Anticorruption Indicators in East Asia and Pacific
33
their usefulness as tools for country dialogue. For other countries, where counterparts may be more receptive, such indicators could be useful as tools for policy dialogue. For indicators on the policy and institutional side of governance, existing indicators have value. Although it may be tempting to consider picking out the best existing indicators and then leveraging resources by expanding country coverage or updating, the limitations of existing indicators described in this note suggest that such an approach could ultimately yield indicators that have the same limitations described in this note. For example, the lament that indicators such as GII and OBI do not reflect reforms that were undertaken more recently, is inevitable since such indicators must establish some sort of “cut-off” date in order to be workable. Yet, working with counterparts and teams from these institutions could yield results that motivate reform in some contexts. For indicators measuring governance outcomes, most existing cross country measures are flawed. An effort to systematically implement a large-scale set of surveys, similar to those done in the Europe and Central Asia region, through the BEEPS for firms and the LITS for households, is warranted.32 Although only available once every three years and subject to all of the normal reservations about surveys, and therefore not a panacea, such regular large-scale surveys would provide systematic data on progress or lack thereof, and areas of continued weakness. It is encouraging that a region-wide effort to roll out enterprise surveys is underway in 2009. An issue to consider in designing any effort to improve the governance indicators is how the exercise can be organized toward building local capacity, and local demand, for monitoring. With the exception of PEFA, every indicator discussed in this note is created, or at least led, by outsiders. Even surveys where the respondents are local firms or citizens, the organization of the survey effort and the presentation of the results are all done from outside. Expert opinion sources, even where teams include locals, are essentially organized and presented from the outside. One observer characterized the reaction to one of the better expert opinion indicators as “an external agent sitting on a high stool and releasing ‘results’ which are ‘pre-cooked’ based on perceptions, and waving a score card.” An alternative model is to integrate capacity-building and ownership of the indicators into their very design. In Vietnam, a “governance module” is being incorporated into the national bi-annual household survey. In addition to strengthening local capacity, this approach is introducing counterparts to the concept of governance monitoring. Important questions still need to be answered. This note has been written partially with the intention of providing users with the information they need to recognize which existing indicators are useful for certain purposes, which indicators fall short, and to 32 Since 1999, the ECA region has collaborated with the EBRD in the implementation of the BEEPS. Done triennially and covering 28 countries in ECA, the BEEPS has provided the most systematic evidence available of changes over time in levels of corruption as encountered by firms. (Although the BEEPS is known mostly for its questions on corruption, it is not a corruption survey, per se. In the 2005 round, only about 7 percent of the questions on the survey deal with corruption.) In 2006, the World Bank and EBRD cooperated on a household-level survey, known as the Life in Transition Survey (LITS), also covering every country in ECA (and Mongolia) asking some questions on service quality and corruption.
A Review of Governance and Anticorruption Indicators in East Asia and Pacific
34
know when innovation is necessary. Much of the analysis has focused fairly narrowly on whether the indicators are measuring what many users believe they are measuring. The bigger question of whether they are measuring the right things at all has not been addressed in this note. Before embarking on an ambitious program to improve monitoring, EAP needs to achieve a consensus about just what progress would look like. How are governance and anticorruption indicators being used? If a country succeeds at improving governance, how would we expect this improvement to manifest itself? Given the high level of importance that the World Bank has been placing on governance and anticorruption for more than a decade, the time is right for an effort to answer these questions and then develop appropriate indicators for tracking progress.
A Review of Governance and Anticorruption Indicators in East Asia and Pacific
35
References Anderson, James H. and Cheryl W. Gray. 2006. Anticorruption in Transition 3 – Who is
Succeeding … And Why? Washington, DC: World Bank. http://www.worldbank.org/eca/act3
Arndt, Christiane. 2008. “The Politics of Governance Ratings”. International Public Management Journal. Forthcoming.
Arndt, Christiane and Charles Oman. 2006. Uses and Abuses of Governance Indicators. OECD. Development Centre Study. Paris: OECD. http://www.governanceindicators.org/
Arndt, Christiane and Carmen Romero. 2008. “Some comments on the World Governance Indicators 2007 for the Central American Countries”. Washington D.C.: World Bank.
Campos, J. Edgardo and Sanjay Pradhan. 2007. The Many Faces of Corruption—Tracking Vulnerabilities at the Sector Level. Washington, D.C.: World Bank.
Economic Intelligence Unit. 2008. Risk assessments, by subscription only.
European Bank for Reconstruction and Development and the World Bank. 2005. Business Environment and Enterprise Performance Survey.
European Bank for Reconstruction and Development and the World Bank. 2006. Life in Transition Survey.
Freedom House. 2007. Countries at the Crossroads. http://www.freedomhouse.org
Global Integrity. 2007. Global Integrity Index. http://www.globalintegrity.org/
Gray, Cheryl W., Joel Hellman, and Randi Ryterman. 2004. Anticorruption in Transition 2: Corruption in Enterprise-State Interactions in Europe and Central Asia 1999-2002. Washington D.C.: World Bank.
Hellman, Joel, Geraint Jones, and Daniel Kaufmann. 2000. “Seize the State, Seize the Day—State Capture, Corruption, and Influence in Transition Economies.” World Bank Policy Research Working Paper 2444. Washington, D.C.: World Bank.
International Budget Project. 2006. Open Budget Initiative 2006. http://www.openbudgetindex.org/ .
Johnston, Michael. 2006. Syndromes of Corruption—Wealth, Power, and Democracy. Cambridge: Cambridge University Press.
A Review of Governance and Anticorruption Indicators in East Asia and Pacific
36
Kaufmann, Daniel, Aart Kraay, and Massimo Mastruzzi. 2006. “The Worldwide Governance Indicators Project: Answering the Critics”. September 2006. Available at http://info.worldbank.org/governance/wgi2007/
Kaufmann, Daniel, Aart Kraay, and Massimo Mastruzzi. 2007. “Governance Matters VI: Governance Indicators for 1996-2006” (July 2007). World Bank Policy Research Working Paper No. 4280. http://ssrn.com/abstract=999979
Kaufmann, Daniel, Aart Kraay, and Pablo Zoido. 1999. “Aggregating Governance Indicators” (October 1999). World Bank Policy Research Working Paper No. 2195. http://ssrn.com/abstract=188548 .
Ketelaar, Anne, Nick Manning and Edouard Turkisch. 2007. “Performance-based Arrangements for Senior Civil Servants OECD and other Country Experiences”. OECD Working Papers on Public Governance, 2007/5, OECD Publishing.
Knack, Stephen E. 2007. “Measuring Corruption: A Critique of Indicators in Eastern Europe and Central Asia.” Journal of Public Policy. 27:255-291.
Open Budget Initiative. 2006. “Open Budget Initiative 2006.” http://www.openbudgetindex.org/
PEFA Secretariat. 2006. “Public Financial Management Performance Measurement Framework.” June 2005, reprinted May 2006.
Political Risk Services. 2008. International Country Risk Guide. Available by subscription only at http://www.prsgroup.com .
Spector, Bertram I., ed. 2005. Fighting Corruption in Developing Countries: Strategies and Analysis. Bloomfield, Connecticut: Kumarian.
Svensson, Jakob. 2005. “Eight Questions about Corruption.” Journal of Economic Perspectives 19(3): 19–42.
Transparency International. 2007. “Persistent corruption in low-income countries requires global action.” Press release for the Transparency International 2007 Corruption Perceptions Index. September 26 2007. London and Berlin. http://www.transparency.org/
Transparency International. 2007. “The Methodology of the Corruption Perceptions Index 2007.” http://www.transparency.org/
Washington Post. 2006. “Mr. Wolfowitz and Corruption; The World Bank president needs space for his initiative.” Editorial. September 27, 2006.
World Bank. 1997a. Helping Countries Combat Corruption – The Role of the World Bank. Poverty Reduction and Economic Management (PREM) Network. September 1997.
A Review of Governance and Anticorruption Indicators in East Asia and Pacific
37
World Bank. 1997b. The State in a Changing World—World Development Report 1997. New York: Oxford University Press.
World Bank. 2000. Reforming Public Institutions and Strengthening Governance—A World Bank Strategy. The Public Sector Group, Poverty Reduction and Economic Management (PREM) Network. November 2000.
World Bank. 2006. Annual Review of Development Effectiveness 2006 – Getting Results. Washington DC: World Bank Independent Evaluation Group.
World Bank. 2007. Strengthening World Bank Group Engagement On Governance And Anticorruption. March 21, 2007.
World Bank. 2008a. Country Policy and Institutional Assessments. Available for IDA countries at http://www.worldbank.org/ida .
World Bank Independent Evaluation Group. 2008. Doing Business: An Independent Evaluation.
World Economic Forum. 2006. Global Competitiveness Report 2006-2007.
A Review of Governance and Anticorruption Indicators in East Asia and Pacific
38
Table 10. Summary of (Arbitrary but Informed) Assessments of Indicators for the purposes of World Bank GAC Monitoring
Indicator and suggested use
1. Clarity. Is it clear what is being measured? Does it cleanly delineate policies and institutions or governance outcomes without conflating the two?
2. Transparency. Is the procedure relatively transparent and replicable?
3. Temporally relevant. Can the indicators be used to make comparisons over time?
4. Strategically relevant. Can the indicators be used to make comparisons across countries?
5. Conducive to constructive dialogue. Are the indicators “actionable”? Do the assessments suggest clear actions, and will following up on those actions results in improvements in the indicators in the future?
Economist Intelligence Unit Example of a broad-brush assessment of perceptions of foreign experts
Low. Fairly broad definition of “corruption.”
Low. Expert assessment, no more no less.
Low to Medium. Useful only for knowing how foreign experts’ views are changing, not necessarily real changes.
Medium. Indicates what reputable foreign experts think.
Low. Only as an example of what foreign experts think
ICRG Example of a broad-brush assessment of perceptions of foreign experts
Low. Fairly broad definition of “corruption.”
Low. Expert assessment, no more no less.
Low to Medium. Useful only for knowing how foreign experts’ views are changing, not necessarily real changes.
Medium. Indicates what reputable foreign experts think.
Low. Only as an example of what foreign experts think
A Review of Governance and Anticorruption Indicators in East Asia and Pacific
39
Table 10. Summary of (Arbitrary but Informed) Assessments of Indicators for the purposes of World Bank GAC Monitoring Indicator and suggested use
1. Clarity. Is it clear what is being measured? Does it cleanly delineate policies and institutions or governance outcomes without conflating the two?
2. Transparency. Is the procedure relatively transparent and replicable?
3. Temporally relevant. Can the indicators be used to make comparisons over time?
4. Strategically relevant. Can the indicators be used to make comparisons across countries?
5. Conducive to constructive dialogue. Are the indicators “actionable”? Do the assessments suggest clear actions, and will following up on those actions results in improvements in the indicators in the future?
Freedom House Countries at the Crossroads Possible conversation-starter on how institutions look similar or different from other countries
Medium. Criteria are very clear, but in the aggregate one still ends up with perceptions of “corruption.”
Medium. Process is described in some detail, but ultimately comes down to expert assessment and is not replicable.
Medium. Somewhat detailed criteria make it potentially useful for examining changes over time, but limited since they are ultimately perceptions of “corruption.”
Medium. Indicates what reputable foreign experts think.
Low to Medium. An example of what foreign experts think, possibly limited by perception of an agenda by Freedom House.
World Bank CPIA Possible conversation-starter on how we view the strengths and weaknesses of a country’s system
Medium. Criteria are clear, but mix up policies and institutions with outcomes, and in the aggregate one still ends up with perceptions of “corruption.”
Medium. Process is transparent within the World Bank, but not externally and not replicable.
Medium. Somewhat detailed criteria make it potentially useful for examining changes over time, but limited since they are ultimately perceptions of “corruption.”
Medium. Indicates what reputable foreign experts think.
Medium to High. Puts us on the spot to explain the ratings.
A Review of Governance and Anticorruption Indicators in East Asia and Pacific
40
Table 10. Summary of (Arbitrary but Informed) Assessments of Indicators for the purposes of World Bank GAC Monitoring Indicator and suggested use
1. Clarity. Is it clear what is being measured? Does it cleanly delineate policies and institutions or governance outcomes without conflating the two?
2. Transparency. Is the procedure relatively transparent and replicable?
3. Temporally relevant. Can the indicators be used to make comparisons over time?
4. Strategically relevant. Can the indicators be used to make comparisons across countries?
5. Conducive to constructive dialogue. Are the indicators “actionable”? Do the assessments suggest clear actions, and will following up on those actions results in improvements in the indicators in the future?
Global Integrity Index Possible conversation-starter on how institutions look similar or different from other countries
High. Criteria are clear and relatively precise.
High. Process is described in detail and is, theory, replicable.
Medium. Very clear criteria emphasizing policies and institutions, but limited due to concerns about accuracy in some cases.
Medium. Very clear criteria emphasizing policies and institutions, but limited due to concerns about accuracy in some cases, and small numbers of experts
Medium to High. Highly actionable. Potentially useful if made more accurate and presented upstream to get country buy-in
Open Budget Index Possible conversation-starter on how institutions look similar or different from other countries
High. Criteria are clear and relatively precise.
High. Process is described in detail and is, theory, replicable.
Medium. Very clear criteria emphasizing policies and institutions, but limited due to concerns about accuracy in some cases.
Medium. Very clear criteria emphasizing policies and institutions, but limited due to concerns about accuracy in some cases, and small numbers of experts.
Medium to High. Highly actionable. Potentially useful if made more accurate and presented upstream to get country buy-in
A Review of Governance and Anticorruption Indicators in East Asia and Pacific
41
Table 10. Summary of (Arbitrary but Informed) Assessments of Indicators for the purposes of World Bank GAC Monitoring Indicator and suggested use
1. Clarity. Is it clear what is being measured? Does it cleanly delineate policies and institutions or governance outcomes without conflating the two?
2. Transparency. Is the procedure relatively transparent and replicable?
3. Temporally relevant. Can the indicators be used to make comparisons over time?
4. Strategically relevant. Can the indicators be used to make comparisons across countries?
5. Conducive to constructive dialogue. Are the indicators “actionable”? Do the assessments suggest clear actions, and will following up on those actions results in improvements in the indicators in the future?
PEFA Country dialogue on Public Financial Management priorities
High. Detailed criteria for an open and orderly PFM system are spelled out.
High. Open and inclusive process.
Low. Although potentially replicable over time, few countries have done so.
Medium. Comparisons across countries are possible, but limited coverage limits their usefulness for this purpose.
High. Clearly actionable. Country ownership ensured by inclusion in the process of developing the indicators.
World Economic Forum’s “Executive Opinion Survey” Possible conversation-starter on how institutions look similar or different from other countries
High. Survey questions pertain to specific aspects of corruption.
Medium-High. Survey procedures are described and should be replicable. Lack of raw data inhibits replicability.
Medium. Clear questions, limited by sample sizes and idiosyncrasies in sampling and administration. Lack of raw data inhibits ability to understand changes over time.
Medium. Clear questions, limited by sample sizes and idiosyncrasies in sampling and administration. Lack of raw data inhibits ability to examine differences across countries.
Medium. Simple presentation of what firms are saying. Limited by questions about sampling. Actionable only the broadest sense of identifying key sectors.
A Review of Governance and Anticorruption Indicators in East Asia and Pacific
42
Table 10. Summary of (Arbitrary but Informed) Assessments of Indicators for the purposes of World Bank GAC Monitoring Indicator and suggested use
1. Clarity. Is it clear what is being measured? Does it cleanly delineate policies and institutions or governance outcomes without conflating the two?
2. Transparency. Is the procedure relatively transparent and replicable?
3. Temporally relevant. Can the indicators be used to make comparisons over time?
4. Strategically relevant. Can the indicators be used to make comparisons across countries?
5. Conducive to constructive dialogue. Are the indicators “actionable”? Do the assessments suggest clear actions, and will following up on those actions results in improvements in the indicators in the future?
World Bank “Investment Climate Surveys” Conversation starter on how firms view, and experience, interactions with the state. Firm-level analysis to support analytical work.
High. Survey questions pertain to specific aspects of corruption.
High. Survey procedures are described and should be replicable.
Medium to High. Firm-level data could be used for intertemporal comparisons; limited by the lack of repeat surveys.
Medium. Firm-level data could be used for cross-country comparisons; limited by variations in questions and sampling.
Medium to High. Simple presentation of what firms are saying. Actionable only the broadest sense of identifying key sectors.
A Review of Governance and Anticorruption Indicators in East Asia and Pacific
43
Table 10. Summary of (Arbitrary but Informed) Assessments of Indicators for the purposes of World Bank GAC Monitoring Indicator and suggested use
1. Clarity. Is it clear what is being measured? Does it cleanly delineate policies and institutions or governance outcomes without conflating the two?
2. Transparency. Is the procedure relatively transparent and replicable?
3. Temporally relevant. Can the indicators be used to make comparisons over time?
4. Strategically relevant. Can the indicators be used to make comparisons across countries?
5. Conducive to constructive dialogue. Are the indicators “actionable”? Do the assessments suggest clear actions, and will following up on those actions results in improvements in the indicators in the future?
Transparency International’s “Global Corruption Barometer” Conversation starter on how citizens view, and experience, interactions with the state.
High. Survey questions pertain to specific aspects of corruption.
Medium-High. Survey procedures are described and should be replicable. Lack of raw data inhibits replicability.
High. Questions on corruption by households comparable over time. Lack of raw data inhibits ability to understand changes across time..
Medium to High. Questions on corruption by households comparable across countries. Lack of raw data inhibits ability to understand differences across countries.
Medium. Simple presentation of what citizens are saying. Limited by the perception of an agenda and confusion with the TI-CPI. Actionable only the broadest sense of identifying key sectors.
Worldwide Governance Indicators Summary measure of (mostly) foreign experts’ views, useful for research purposes.
Low. Mix of different indicators in different countries make it unclear what is being measured.
Low. Although procedures are described, the complex procedure and incomplete dataset of underlying indicators makes it impossible to replicate.
Low. Mix of different indicators in different time periods and other factors render this indicator not useful for making inferences about changes over time.
Low to Medium. Mostly an average of expert opinions.
Low to Medium. Not actionable. For some countries may be useful as a jumping off point for dialogue, but only with the strong caveat that indicators will not like show improvement even if reforms undertaken.
A Review of Governance and Anticorruption Indicators in East Asia and Pacific
44
Table 10. Summary of (Arbitrary but Informed) Assessments of Indicators for the purposes of World Bank GAC Monitoring Indicator and suggested use
1. Clarity. Is it clear what is being measured? Does it cleanly delineate policies and institutions or governance outcomes without conflating the two?
2. Transparency. Is the procedure relatively transparent and replicable?
3. Temporally relevant. Can the indicators be used to make comparisons over time?
4. Strategically relevant. Can the indicators be used to make comparisons across countries?
5. Conducive to constructive dialogue. Are the indicators “actionable”? Do the assessments suggest clear actions, and will following up on those actions results in improvements in the indicators in the future?
Transparency International’s “Corruption Perceptions Index” Summary measure of perceptions of corruption, useful for research purposes.
Low. Mix of different indicators in different countries make it unclear what is being measured.
Low. Although procedures are described, the complex procedure and incomplete dataset of underlying indicators makes it impossible to replicate.
Low. Mix of different indicators in different time periods and other factors render this indicator not useful for making inferences about changes over time
Low to Medium. Mostly an average of expert opinions, long time lags.
Low to Medium. Not actionable. For some countries may be useful as a jumping off point for dialogue, but only with the strong caveat that indicators will not like show improvement even if reforms undertaken.