A state-of-the-art study of the: Environmental information supplied to the actors of the Swedish pulp and paper industry and the tools used to provide it. Ola Svending Stora Enso Environment Chalmers University of Technology PO Box 9090 Environmental Systems Analysis SE-650 09 Karlstad SE-412 96 Göteborg SWEDEN SWEDEN June 2001 For CPM – Center for Environmental Assessment of Products and Material Systems Chalmers University of Technology Göteborg, Sweden 2001 CPM 2001:6
Transcript
A state-of-the-art study of the: Environmental information supplied to the actors of the Swedish pulp and paper industry and the
tools used to provide it. Ola Svending Stora Enso Environment Chalmers University of Technology PO Box 9090 Environmental Systems Analysis SE-650 09 Karlstad SE-412 96 Göteborg SWEDEN SWEDEN June 2001 For CPM – Center for Environmental Assessment of Products and Material Systems Chalmers University of Technology Göteborg, Sweden 2001 CPM 2001:6
5 Connections between actors ............................................................................................12 6 Environmental tools ..........................................................................................................13
6.1 Tools within the environmental management system.........................................13 6.1.1 Environmental aspects...............................................................................13 6.1.2 Environmental objectives and targets.......................................................14 6.1.3 Management’s review...............................................................................14
6.2 Economical follow-up...........................................................................................15 6.3 Environmental process control.............................................................................15 6.4 Environmental report............................................................................................15 6.5 Life Cycle Inventory/Assessment...........................................................................17 6.6 Environmental statement......................................................................................18 6.7 Environmental labels and declarations.................................................................18
6.7.1 Type I – the Nordic Swan..........................................................................19 6.7.2 Type I – the Good Environmental Choice.................................................21 6.7.3 Type II – the Nordic Forest Industry Federation’s environmental
product declaration...................................................................................23 6.7.4 Type III – the Swedish EDP system............................................................24
7 Summary of environmental tools .....................................................................................27 8 Interactions between the tools..........................................................................................28
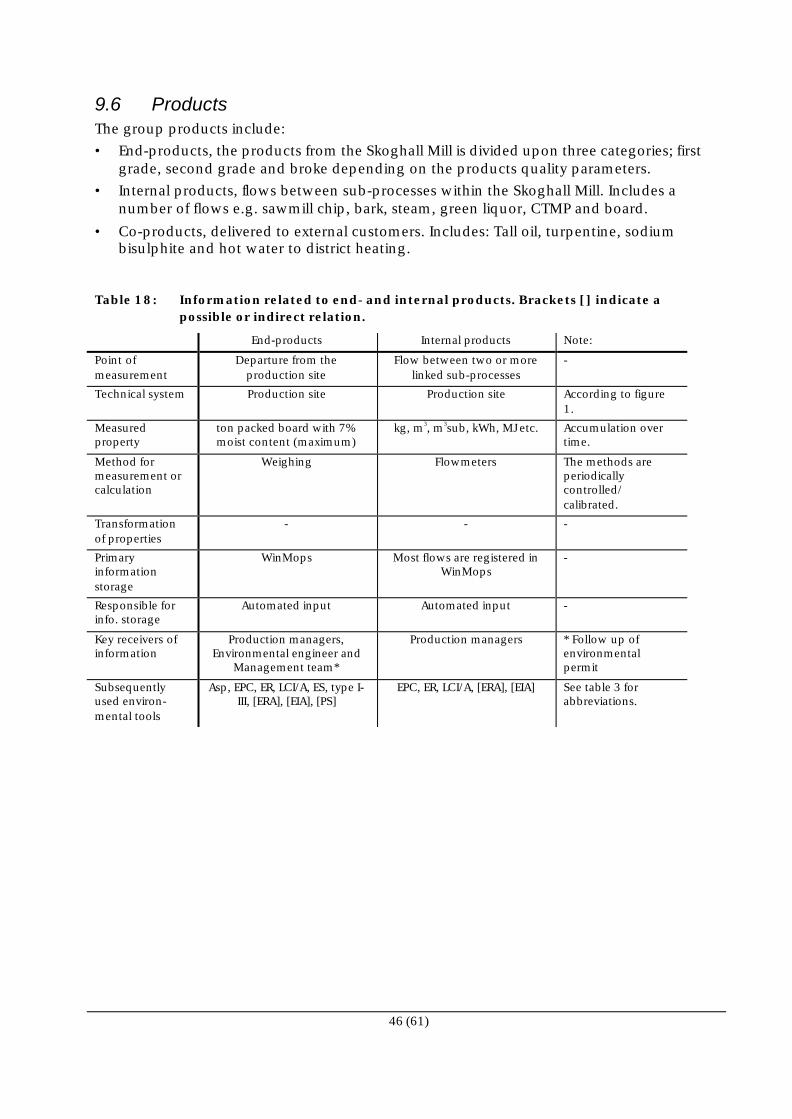
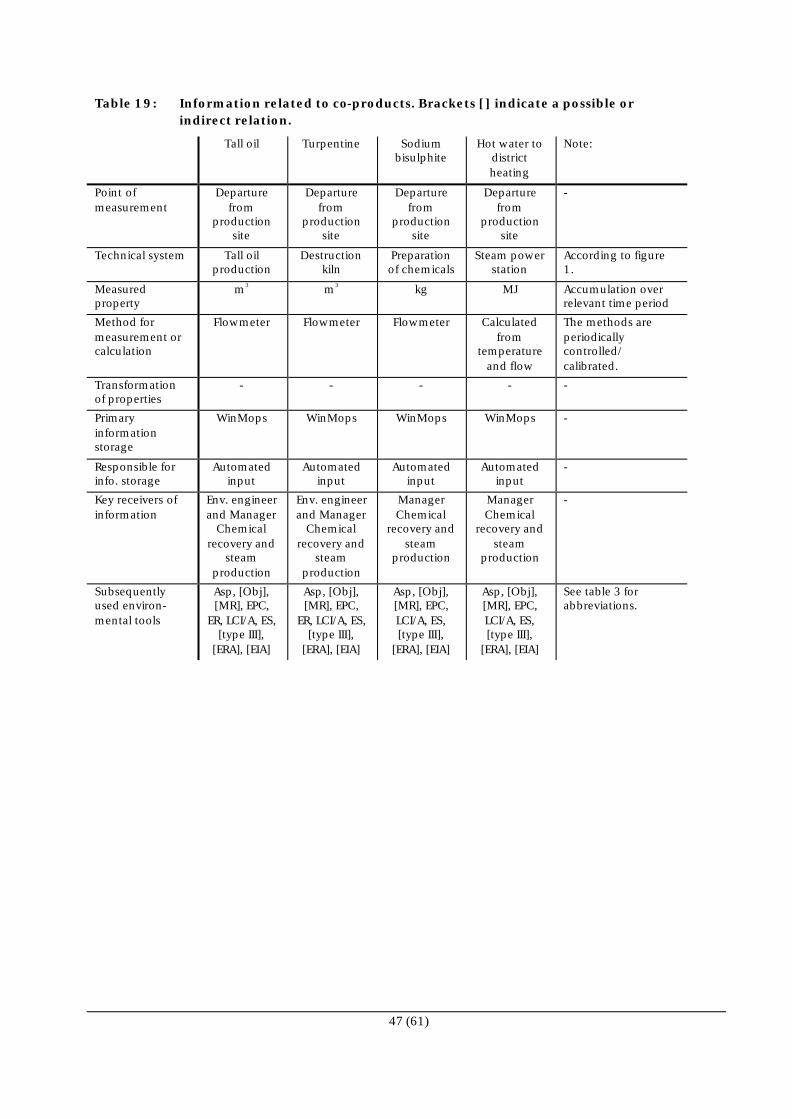
9 Flows of information in the organization..........................................................................30 9.1 Raw materials ........................................................................................................32 9.2 Energy carriers.......................................................................................................33 9.3 Emissions to air......................................................................................................35 9.4 Emissions to water.................................................................................................38 9.5 Solid waste.............................................................................................................42 9.6 Products.................................................................................................................46
10 Mapping of environmental tools on actors......................................................................48 11 Conclusions and need for further research.......................................................................49 12 Acknowledgment..............................................................................................................52 13 Glossary .............................................................................................................................52 14 References..........................................................................................................................53
14.1 External literature ..................................................................................................53 14.2 Company internal documents..............................................................................54
1 Background This report is a part of the state-of-art analysis of the licentiate project: “Allocation for site specific handling of environmental data”. The scope of this report is defined in the plan of the licentiate project from which the following two bullets describing the aim of this report are taken: 1. Map-out of today’s methods for environmentally related data acquisition,
documentation and handling within Stora Enso through document studies and interviews. How is the acquisition, documentation and handling of environmental data conducted in the mills today? Who collects which information and for what purposes? What does the information contain? Who is informed? How is it interpreted? What information is of retrospective character and what is of prospective character? What needs of improvement are there concerning the content, documentation and organization of the handling of environmental information?
2. What are the driving forces for change of today’s methodology? This question may be answered by an actor model, showing needs and demands from the different actors e.g. customers, suppliers, authorities etc.
The focus of this report is based on the Swedish pulp and paper industry in general and the Skoghall Mill in specific. The Skoghall Mill is a production site in the Stora Enso group producing paperboard used for packaging of liquid and dry food. The mill is integrated, i.e. it includes production of most of the pulp (unbleached and bleached sulfate kraft and CTMP) used at the two board machines. Some additional hardwood pulp is purchased. The liquid packaging board is the largest product segment and for that there are a few dominant customers, with whom the relationship is close.
2 (61)
2 Introduction Environmental data is the base for communication of the needed environmental information stipulated by an actor. The environmental data is commonly modified by an environmental tool to suite these needs. This report deals with the Swedish pulp and paper industry’s actors and their needs of environmental information. The environmental tools used to generate environmental information are also dealt with. The similarities between the actors and their needs of environmental information are then mapped out, and the interactions between the environmental tools. Non-stringent paths of environmental information or “double-work” are pointed out in order to enhance the efficiency of the site-specific handling of environmental data. A study of information flows within the production site’s organization is also included. Finally recommendations of methodological improvement and input to further research are presented. This report is concentrated on environmental data from the pulp and paper industry, since most of the environmental burdens from the use of a paper product normally occur during the pulp and paper production stages and not during the usage phase. Transparent, stringent and repeatable are terms that can be used to describe the minimum criteria for a method, e.g. for handling of environmental data or operating environmental tools (J. Bresky, 2000). The definition of a transparent method is:
A transparent method enables a practitioner to understand the intentions and procedures of the method.
The definition of a stringent method is:
A stringent method enables a practitioner to follow the intentions and procedures of the method without unintended methodological gaps or overlaps occur.
The definition of a repeatable method is:
A repeatable method is based on a transparent and stringent documentation. The method may then be repeated with a similar result, independently of when it is conducted or who
the practitioner is.
3 (61)
3 Methodology The intention of this report is to find out the current situation within Stora Enso and in particular the Skoghall Mill. The intention is achieved through literature studies (published material and company internal documents), interviews and personal knowledge from the author’s previous position at the Skoghall Mill as project leader for the implementation of ISO 14001 and EMAS. The perspective of the report is from the production site’s point of view, in it’s attempt to fulfill numerous demands on relevant environmental information from different actors. Especially in focus in this study is the Skoghall Mill production site. The process flowchart is schematically illustrated in the figure below.
Precip. Bark
sludge
Roundood chip
Fiber sludgePurified White liquor Wash liquor
wastewater
Sawmill chip
Green liquor
Black liquor Thick waste liquor
Odourus gases Hotgaser water
Unbleached sulfate kraft Black liquor soap
Turpentine
SO2
Tall oil
ClO2 CTMP
Bleached sulfate kraft
NaSO4
Na2SO3
Na 2 SO 3 Board
Coated board
Internal product flowsGenerated steam to Steam Documentation:power station
Board products
Coating,BM 7/8
Other activities
Bleaching
Oil boiler
BM 7/8
Steam power station
Digester EvaporationRecovery
boilers
Preparation of chemicals
Tall oil production
Waste water treatment
CTMP
Woodroom
Chip screenWhite liquor preparation
Bark boiler
Odour gas kiln
Figure 1: Schematic process flowchart of the Skoghall Mill.
4 (61)
4 Actors Some of the most important actors for the Swedish pulp and paper industry are presented below, together with what is perceived to be their specific needs of environmental information. An actor is in this study defined as:
Actors: Organization or group of individuals (internal or external) that have needs of environmental information on a product’s or on an operation's environmental performance.
Supplied environmental information is in this study defined as: Supplied environmental information: The environmental information given to an actor in
order to fulfill the actor’s presumed need of relevant information. The environmental information may be presented or modified using one or more suitable environmental tools.
The environmental tools are further described in chapter 6, where a definition also is available. All environmental information communicated must, independently of receiving actor, be credible. Credibility may, as further mentioned below, partly be achieved by third part verification/certification. More important however is that the procedure of assembling the environmental information is transparent, stringent and thereby repeatable.
4.1 Production site In this study a production site is considered as a pulp mill, paper mill or a converting plant. The production site is the basis for the point of view and the system in focus in this study, mainly since most of the environmental data is generated here. The production sites considered are commonly certified according to ISO 9001 and ISO 14001, which ensures experience in documentation and a structured ways of conducting the environmental work.
4.1.1 Supplied environmental information The production site supplies itself with a great deal of environmental information. One of the fundamental obligations connected to running a production site is to control that the environmental laws and permits are withheld. Most of the environmental laws are however not connected to the environmental data considered in this report. The environmental permits, however, set the environmental limits, within which the production site may operate and is therefore relevant for this study. The terms of the environmental permit are collected in the environmental control program (in Swedish “kontrollprogram för miljö”). The local authority stipulates the terms and the parameters with their limitations in the environmental control program. According to the environmental control program for the Skoghall Mill (1999) the following information shall be included in the environmental report: • Distribution of environmental responsibilities in the organization. • A process description of the production site for which the environmental permit is valid. • A process description of the waste water and air emission purification equipment, the
parameters to be reported with their limits, the point of measurement, the interval of the measurement (daily, weekly etc.) and the analysis methods to be used.
• A description of how the monitoring of the receiving water shall be conducted, which parameters to include, where to measure and at what time intervals.
• A description of how noise measurements are performed and the corresponding limits. • A description of the treatment of solid waste and the deposits owned by the Skoghall
Mill, including allowed volumes of waste deposited (type of waste and to which deposit).
5 (61)
The company’s response to the environmental control program is the environmental report, which is presented in the environmental tools chapter. The obedience of environmental laws is controlled by the authorities during the periodic inspection. The evaluation of environmental performance at the production site is essential to verify that the continual improvements committed to in ISO 14001 are fulfilled. The environmental performance is evaluated at the Skoghall Mill twice a year at the management’s review. The intentions of the evaluation are described in the internal document dok nr 1.8, and are to evaluate the environmental performance according to the mill’s environmental policy. Relevant to this study would be to: • Economize with raw materials and energy. No indicators are proposed for this evaluation. • Surpass the environmental laws and permits. The obedience to environmental laws is
controlled through special internal auditions. The environmental report is a response to the environmental permits. Both are commented in the management’s review.
• Achieve environmental improvements. This is conducted through a follow-up of the current environmental targets, e.g. decrease of the production site’s total NOX emission or total amount of solid waste to landfill.
To avoid sub-optimizations these indicators should be chosen using a life cycle perspective. However, this is not the current case at the Skoghall Mill. Bench-marking can be a part of the evaluation of environmental performance where one production site is compared with other production sites. Bench-marking is also used to compare different products, internally and externally. To be able to compare different production sites or products some demands are set on the environmental information: • It must be clear what is included in a parameter, e.g. does the emission of fossil CO2
include the emissions occurring in the lime kiln where calcium carbonate is converted to calcium oxide. The system boundaries must in other words be clearly defined and easily communicated.
• Whenever algorithms are used to e.g. determine emissions from combustion, it is essential that both parts use the same assumptions concerning e.g. carbon content of different bio-fuels. This implies that the entire pulp and paper industry ought to agree on a common method for environmental calculations, including common assumptions.
Benchmarking studies are not conducted frequently. One study involving the Skoghall Mill (coordinated from one of the production sites in the former Enso group) compared liquid packaging board products from different suppliers comprising the following parameters: • Raw materials: Softwood, hardwood and fresh water. • Energy: Electricity, fossil fuels and bio-fuels. • Emissions to air: Fossil CO2, renewable CO2, NOX (as NO2), SOX (as SO2), TRS (as S) and
particles. • Emissions to water: COD, N-tot, P-tot and AOX. • Solid waste to landfill. • Co-products: Turpentine, tall-oil and net electricity delivered to the grid. The production site also needs to control their processes from an environmental point of view. Undesired spill of chemicals, abnormally high wastewater flows etc. must be detected fast and easily for the right measures to be taken. There is also a need of information telling how the production unit, or some of it’s unit processes are run in relation to e.g. environmental laws and permits. The system for environmental process control at the Skoghall Mill is called WinMops and contains both on-line and historical information. The system is built up with a graphical interface illustrating the different parts of the processes at
6 (61)
the Skoghall Mill. The supplied the information varies depending on what is perceived to be relevant for each process step. However, the following parameters are commonly presented. • Raw material: Process chemicals, purchased pulp, lime etc. • Energy: Oil and purchased electricity. • Emissions to air: All monitored parameters to the atmosphere are presented. • Emissions to water: All monitored parameters, both to the receiving water and internal
flows are presented. • Products: Internal products e.g. wood chip, steam, pulp qualities and different liquors
(black, white, green etc.). External products e.g. board. The system is however generally lacking information on by-products, use of electricity at different process steps and solid waste. Process improvements is a more or less continuous work that is part of the ambitions of ISO 14001 (the continual improvements). To avoid sub-optimizations, the strategy for the process improvements should be based on using a life cycle perspective. Is it for example sound to decrease the emission of COD using electrical energy produced from coal power plants? To evaluate process improvements prospective environmental information is needed. The environmental aspects (evaluated at the Skoghall Mill according to dok nr. 7.1) are the basis for the process improvements, mainly channeled through set up of environmental targets and programs for achievement. The environmental aspects are however based on retrospective information. Process development should be separated from process improvement. Process development can e.g. be projects aiming to reconstruct or install new process equipment. Since the implementation of ISO 14001, the environmental consequences of all relevant process development should be considered. If the environmental consequence is predicted to be significant the consequence should be further investigated. The investigation is not quantitative, but considers if the process development results in increased or decreased use of raw materials, energy or emissions to air and water, generation of solid waste. This investigation should have a prospective view, considering the effects of a change, but since no quantification is involved this is not considered. The investigation should not be mixed with an Environmental Impact Assessment, further described below. Environmental concern during product development is taken by using a checklist helping the development engineer and the development group to consider the environmental consequences of a change in production. The procedure for the environmental product development is described in the company internal document dok nr 4.1. The aspects considered are: • The use of chemicals: Will any chemical products be exchanged, are the new chemical
products approved by the relevant product safety regulation (e.g. FDA and BgVV) and the local chemical group and how will the total amount of chemicals change (increase or decrease).
• Effects on water emissions: Change in wastewater flow and pollution in it. • Effects on air emissions. • Changes in energy consumption: The use of electricity and oil. • Changes in amount and type of solid waste: At the Skoghall Mill, at the customer’s
production plant and at the end consumer. One of the drivers of the needs of environmental information for the production site is to control the activities at the production site in a way that a positive environmental image is created. The environmental image is communicated externally through e.g. the
7 (61)
environmental statement, but also internally to promote the environmental work. Most commonly retrospective data is used.
4.2 Group level The group level is here considered as a company organizing more than one production site. In this report the Stora Enso group is in focus. Stora Enso is one of the world's leading forest product companies. Core businesses include magazine papers, newsprint, fine papers and packaging boards. The Skoghall Mill that is in focus in this report is part of Stora Enso’s Packaging Board division.
4.2.1 Supplied environmental information The possibility to evaluate the environmental performance for the group is essential to predict environmentally related investment needs at production sites and to create a positive environmental image. Both purposes are used to influence politicians and other decision makers in a way that benefits the group and/or the entire pulp and paper industry. In this evaluation both retrospective and prospective approaches are necessary to consider. Yearly inquiries are sent out to all the production sites within the group. From the inquiries Stora Enso’s environmental report is compiled, in which the following environmental parameters are presented: • Raw materials: Wood, purchased pulp, recovered paper, fillers and water. • Energy: Purchased and internally produced electricity, fossil fuels, peat, external bio-fuels
and purchased steam. • Emissions to air: Fossil CO2, renewable CO2, SOX (as SO2), NOX (as NO2). • Emissions to water: COD, AOX, Phosphorus, Nitrogen. • Solid waste to landfill and hazardous waste to destruction. • Products: Market pulp, pulp for internal use, paper, board, sawn timber, steam,
secondary heat and electricity. • Amount of money spent on environmental investments. The process of predicting needs of environmentally related investments is more complex than to be fully answered by the yearly inquiry. Each separate case is then investigated much more thoroughly, also preparing documents e.g. for the applications to the authorities.
4.3 Customers The customers of the Stora Enso group are mainly other companies, e.g. printing houses and packaging converters. Some products are also sold directly on the end-consumer market, e.g. copying and printing paper. The products from the Skoghall Mill are typically sold to packaging converters, e.g. Tetra Pak. Pulp and paper products have traditionally been in focus for environmental groups and most customers strive towards a more environmentally friendly image, and thereby also pushing the Stora Enso group in the same direction.
4.3.1 Supplied environmental information As a part of a professional customer’s EMS-work it is necessary to evaluate and set demands on their supplier’s environmental performance. A fast and easy way to do this is to demand that e.g. all printing paper must be labeled e.g. with the Nordic Swan eco-label. These eco-labels are intended to give sufficient information to end consumers for them to make their choices. For customers performing their own evaluation of environmental performance eco-labels do not give sufficient information. In these cases the relevant
8 (61)
information is asked directly from the supplier, or taken from an environmental declaration e.g. the EPD1. The Skoghall Mill has a market situation with a few dominating customers. The communication of environmental performance with these large customers is therefore close. Which parameters, system boundaries, for which product or group of products etc. to be communicated are specifically requested by each customer. A typical comprehensive request contains the following parameters for the LCI profile: • Raw materials: Softwood, purchased pulp and fresh water. • Chemicals: Coating chemicals and fillers. • Energy: Electricity (purchased minus sold), external fuels (oil, bio-fuels and other fuels),
total heat energy consumption and heat energy sold. • Emissions to air: Fossil CO2, NOX (as NO2), SOX (as SO2), TRS (as S) and particles. • Emissions to water: COD, BOD7, total N, total P and AOX. • Solid waste to landfill. • Products: Specification of studied product and the co-product tall oil. The request on product specific information is often complemented with questions on forest management, the use of genetically modified organisms (GMOs) etc. depending on what environmental issues are risen by e.g. end consumers or NGOs. Within product development some customers use life cycle data to compare similar suppliers and to influence the suppliers of taking the right measures (as perceived by the customer) to reduce the life cycle environmental impact of the end-product. In the Skoghall Mill case the same environmental information as presented above is used for this comparison.
4.4 Suppliers The suppliers to the pulp and paper industry include suppliers of wood, chemicals, fillers etc. The supplier are normally not considered as actors, since they are “up-stream” in the production chain, but in order to enhance the total environmental performance of the products it is important to learn more about each other’s processes. The tendency within Stora Enso is however that the suppliers should provide material only and less knowledge about how their products interact with the pulp- or paper production system. That knowledge should instead be found within the Stora Enso group. This intention may cause future problems with achieving relevant environmental information from the suppliers and thereby obstructing the intentions of ISO 14001 concerning communicating relevant requirements.
4.4.1 Supplied environmental information The suppliers need information on how their products influence the environmental performance for the pulp or paper product. This information is important for their product development and may be achieved by taking part of jointly performed LCI/A studies. Their participation in environmental projects may also be a way to distinguish their environmental image. Akzo Nobel Eka Chemicals has been a partner for LCI-studies together with Stora Enso, in which chemicals used for both pulp and paper production have been included with site specific data. These studies have served as mapping of environmental impacts, but also as development of methodology. Each study have resulted in a comprehensive list of
1 Type III Environmental Product Declaration, further presented in chapter 6.7.4.
9 (61)
environmental parameters, including the following categories; raw materials, chemicals, energy, emissions to air and water, solid waste, products and co-products.
4.5 Branch organizations Branch organization for the pulp and paper industry, e.g. the Swedish Forest Industries Federation coordinate information to students and others looking e.g. for a career possibility, facts on environment or energy issues. The branch organizations also inform and attempt to influence politicians, the public and other decision-makers. Environmental information that is comparable between production sites and companies and thereby possible to aggregate is therefore essential.
4.5.1 Supplied environmental information The branch organization collects environmental data from the pulp and paper industry in order to evaluate the environmental performance of the branch, to enable environmental benchmarking. The evaluation also serves as a base for the environmental image creation process for the pulp and paper industry. STFI1 was the administrator of the previous LCI-database, which has been abandoned among other reasons due to lack of transparent documentation and methodology. The old LCI-database for different pulp and paper grades is now being updated, using a completely new approach and methodology. Commissioner to the new LCI-database is SSVL2, an environmental association within the Swedish forest industries. The parameters included in the database will be: • Raw materials: Round wood, sawmill chip, recycled fibers, purchased pulp and water
(groundwater or surface water). • Chemicals and fillers: Each process chemical and filler presented separately. • Energy: Total use of thermal energy (purchased fossil fuels and purchased bio fuels) and
total use of electricity (purchased and internally generated). • Emissions to air: Fossil CO2, renewable CO2, CO, SO2, H2S, total S, NOX and particles. • Emissions to water: Waste water flow, COD, BOD, TOC, suspended solids, AOX,
Chlorate, ClO2, total P, total N, chelating agents and color. • Solid waste: Categories defined by the EWC-code. • Co-products: Tall oil, raw turpentine, electricity to the grid and steam or heat to district
heating. • Other: Packaging material. In a later stage the LCI-data will be extended to a “cradle-to-gate” perspective. The LCI-database is only one output of this methodology. After implementation the production sites can use the methodology to generate environmental declarations, environmental reports, etc.
4.6 Authorities The authorities that the Swedish pulp and paper industry face can be divided into a hierarchy with different levels of control. The ones studied in this report are: The national authority, (the Swedish environmental protection agency) has many missions. One of these is to collect environmental information from different industrial
1 Swedish Pulp and Paper Research Institute. 2 In Swedish: Svenska Skogsindustriernas Vatten- och Luftvårdlaboratorium.
10 (61)
branches, e.g. the pulp and paper industry. The information is then used to follow up and set new relevant national environmental quality objectives. The European authorities, e.g. the European environment agency support environmental investigations like the CORINAIR-system, which maps air emissions from the European countries. The parameters requested are pollutants contributing to acidification, eutrophication and climate change, heavy metals and POPs persistent organic pollutants (D. Koch, 1999). The purpose of CORINAIR-system is to survey the European air emissions and predict their development. The local authorities (in Swedish “länsstyrelserna”) are assigned by the government to control industrial operations with regards to waste management, health protection and energy supply. The local authorities also stimulate recycling and a sustainable development. The local authorities manage environmental permits for larger industrial activities.
4.6.1 Supplied environmental information The local authorities need information that shows that the production site follows the stipulated environmental laws and permits. That content of the information is regulated in the environmental control program and reported from the production site in the environmental report. The European authorities’ inquires are normally channeled through the national authority. Their mission is to monitor the environmental performance of industrial activities and thereby predict the development of the future environment situation. The local authorities main mission in the environmental field is to control that a company manages to run it’s business within the environmental laws and permits. The permits are controlled by the company’s self declaration; the environmental report. The local authority may inspect the compliance of environmental laws and permits during announced and unannounced visits to the production site. National and European authorities may request information from the production site in form of surveys. An example of such a survey is the “forest industry’s report on emissions, waste and energy for 1999” (translated into English) included in the environmental report. One part of the survey is intended for the CORINAIR-system (indicated further below). The survey comprises: • Energy:
• Energy carriers use at different process stages, presented as TJ bio fuel, sludge, oil, coal, liquefied petroleum gas (LPG) and natural gas per year.
• Thermal energy supplied by external source, presented as TJ per year. • Thermal energy delivered to external user, presented as TJ per year. • Energy used for internal transports, presented as TJ oil per year. • Electricity used at the production site, presented as GWh electricity from the grid,
internally generated and delivered to other companies per year. • Emissions to air:
• Sulfur emissions from different process stages, presented as kg S per year, per ton pulp and per ton end product.
• NOX emissions from different process stages, presented as kg NO2 per year, per ton pulp, per MJ energy (lower heat value) and per ton end product.
• Emissions to water: • Amount of waste water and clean cooling water etc. presented as m3 per year, per
operating day, per ton pulp and per ton end product. • CODCr, BOD7, total P, total N, suspended solids (SÄGF/A and SÄ70), AOX and Chlorate,
presented as kg per year, per operating day, per ton pulp and per ton end product.
11 (61)
• Solid waste: • Common waste: Inert construction and demolition waste, organic construction and
demolition waste, ashes/slag, bio sludge, chemical sludge, fiber sludge and other waste. Each parameter is presented in ton wet weight per year, with its dry content (in %) and final destination (e.g. land filling or energy extraction).
• Branch specific waste: Wood room and wood yard waste, screening waste, lime sludge, lime, green liquor sludge, slag from recovery boiler, sludge from recycled fiber, deinking sludge, coating slip and other waste. Each parameter is presented in ton wet weight per year, with its dry content (in %) and final destination (e.g. land filling or energy extraction).
• Production: Different grades of unbleached and bleached pulp, recycled fibers and paper grades.
• Intended for the CORINAIR-system: Air emissions from different energy and combustion units including the following parameters. • NMVOC, CH4, CO, CO2, N2O, NH3, Pentachlorphenol, Hexachlorbensen, Arsenic,
Cadmium, Chrome, Mercury, Nickel, Lead, Selenium, Zinc and PAH presented as kg per GJ and per year. For emissions not measured, emission factors for different fuels are given.
4.7 Non-governmental organizations NGOs (e.g. Greenpeace, the Swedish Society for Nature Conservation and different consumer’s right organizations) are sometimes considered opposite party to the industry and perhaps that should be their role. However, their opinions often have great impact on the public and they are therefore an important group of actors. The NGOs primary intention is to spread information on and attention to the safeguard of their particular field of interest. This can be achieved by physical actions or by collecting and spreading relevant information on e.g. the internet. Remarkable is that communication between the Skoghall Mill and the NGOs is limited to the Environmental statement.
4.7.1 Supplied environmental information Since no environmental information is supplied by the production site directly to the NGOs, the NGOs have to rely on public information or investigations/analysis initialized by themselves. Some NGOs have taken the role to enlighten the public and decision makers of doubtfully run businesses. Disobedience of environmental laws and permits or involvement in matters not (yet) surrounded by laws and permits, e.g. the use of GMO, may be pointed out publicly.
12 (61)
5 Connections between actors The section above presents the actors of the Swedish pulp and paper industry. The figure below visualizes the connections between the identified actors and examples of transferred environmental information.
Customers
Group level
Businessorganizations
SuppliersPRODUCTION SITEPRODUCTION SITE
NGOsLobbying
Environmental statement
Strategic LCA projects
Info. for group environmental statement
Input todatabases
Lobbying
Environmental reportInput to
databasesBench-marking
Group environmental statement
Authorities
Inquiries for local LCAs
Public information, e.g.environmental report
Group environmentalstatement
Environmentalstatement
Figure 2: Connections between the actors and examples of transferred environmental information.
The figure above indicates that the production site needs to supply numerous actors with their presumed needs of environmental information. Some information, e.g. the one presented in the environmental statement is verified by third party according to the EMAS regulation (EMAS, 1993). For other information, e.g. environmental declarations the intended receiving actor could also request verification of the information. In both cases the methods used to generate the communicated environmental information needs to be documented to support data quality examining.
13 (61)
6 Environmental tools Environmental information is communicated between actors through environmental tools. An environmental tool is in this report defined as:
An environmental tool is used to modify the environmental data to enable communication in a way that suites the affected actor.
The different environmental tools commonly used e.g. in the Swedish pulp and paper industry are described below. Each tool is presented with its relation to the production site. Specially in focus here are the environmental parameters, functional unit, system boundaries (in time and space), degree of aggregation of the output, retro- or prospective view, procedure for allocation or system expansion, reason for using the tool and practitioner. The tools presented below are important parts of the concepts; life cycle thinking, design for environment (DfE), cleaner technology, industrial ecology and total quality and environmental management (TQEM) which are in turn used for reaching environmentally, socially and economically sustainable development (SETAC, 1997). The reason for choosing this focus is that it might be possible to find interactions between the different tools and thereby use them more efficiently.
6.1 Tools within the environmental management system Today most environmental management systems are certified by ISO 14001, which sets a minimum level of what should be included in the system. Some demands set in ISO 14001needs tools to transform environmental data into useful information; identification of environmental aspects, setting and follow-up of environmental objectives and targets, communication and management’s review. Communication of environmental performance for products or the entire production site is included below in environmental report, environmental statement, environmental labels and declarations, and to some extent also life cycle inventory/assessment.
6.1.1 Environmental aspects The identification of environmental aspects and the determination of which ones may have an significant impact on the environment (below called significant environmental aspects) is an important base for several other parts of a company’s EMS work. The environmental aspects are e.g. be the base for which environmental targets should be set with the possibly related investment needs or which environmental information should be communicated. Therefore it is important to use a method to identify the environmental aspects that the organization has confidence in. Ideally the method for identifying and evaluating the environmental aspects should be based on a life cycle perspective to fulfill the intentions of ISO 14001 concerning the production site taking into account all the environmental impacts it can control over, including formalizing demands on suppliers. The life cycle perspective is complemented with evaluations of potential local environmental impacts, e.g. risks associated with incidents, noise and impacts on the local receiving water. The incident evaluation is for example normally conducted using Environmental Risk Assessment. At the Skoghall Mill, this practically means a cradle-to-gate view, due to the nature of the products (short lived products, with the dominating environmental loads occurring during the production phase). The method must be repeatable independently of who conducts the identification and when. However the method must also be dynamic enough to handle variations in how environmental aspects may vary over time, e.g. due to new scientific discoveries. The procedure of identifying environmental aspects is repeated on a yearly basis or whenever called for after reconstruction etc, using retrospective data. The environmental aspects are typically first identified for the whole production site (cradle-to-gate view) and
14 (61)
then each relevant production step’s contribution to the environmental aspects is identified. At the Skoghall Mill the environmental aspects include: Raw-materials and chemicals: • Raw-material (purchased pulp, roundwood, sawmill chip, water, process chemicals,
supply material and packaging material) Energy: • Energy use (fossil fuels, electricity, bio-fuels, steam and hot water) Emissions: • Emissions to air (fossil CO2, NOX, SOX, H2S, Cl and ClO2, particles, VOC, smell and noise) • Process emissions to the receiving water via waste water treatment (COD and BOD7, pH-
changing, AOX and chlorate, nutritive substance (N and P), suspended solids and metals) • Untreated emissions to the receiving water Waste: • Solid waste (solid waste and hazardous waste) Other: • Transports and contractors (internal transports, external transports and contractors) • Process-independent factors (closed operations, water from fire extinction, fiber
embankments and leach water from landfills) • Operations influencing the Skoghall Mill’s environmental situation (Akzo Nobel, Noviant,
Tetra Pak and other enterprises within the industrial park) • Influence on the landscape • Products (delivered board, co-products and hot water to district heating)
6.1.2 Environmental objectives and targets To set environmental objectives and targets, the production site’s significant environmental aspects should be considered. It would of cause be unnecessary to set a target to reduce an emission that is not considered to be significant. Additionally parameters like; distance from the environmental target set by authority, potential of improvement and financial possibilities should be taken into account. The possibility to influence a target is not limited to the production site. Hence, a life cycle approach is needed covering at least the cradle-to-gate stages, though the actual measures to achieve a target are normally set on the activities controlled by the production site. Traditionally retrospective data is used to follow-up the environmental targets. Prospective data may also be used in calculations to predict the possibility to e.g. reduce an emission. The prospective data then includes marginal data and system expansions. The targets are normally measured per ton product to be insensible to production variations, but other functional units may also be used (e.g. production related to a specific process unit).
6.1.3 Management’s review The management’s review is a process in which the production site’s top management evaluates the EMS’s performance. The performance is evaluated by emission or consumption trends over time of key parameters (e.g. emission of fossil CO2, or use of virgin fiber – per ton product or total during a time period) and prediction of the fulfillment of the current environmental targets. For the trends over time the system boundaries are often limited to the production site, using retrospective data. The system boundaries, retro- or prospective view, functional unit etc. for the prediction of the environmental targets depends on the formulation of the target. The review is typically performed once or twice a year.
15 (61)
6.2 Economical follow-up The Skoghall Mill has a company internal system for economical budget follow-up (Mäsk efterkalkyler, januari – december 1999). The system present variable costs on a monthly basis for different internal products and groups of end-products. The data is presented in an accumulated manner, why the January to December issue serves as a presentation for the whole year. “Mäsk” presents the consumption of materials (e.g. raw-materials and supply chemicals) and energy (e.g. steam and electricity), their price per unit (e.g. SEK per kg) and the cost for the actual flow. This economical information may serve as input in different environmental calculations, in which a quantitative assessment of the inflows is needed. Remarkable is however the fact that the information on e.g. production volumes is not in accordance with the figures reported to the authorities in the environmental report. This intentional deviation is a result of using different moist contents of the pulps and boards in order to fulfill different actors’ need of different information.
6.3 Environmental process control The environmental process control ensures that the processes are run in a way that the environmental permits are complied with and that accidental overflows etc. are detected and limited. The Skoghall Mill uses as process monitoring system called WinMops, in which environmental parameters are a part of the information. The system gives online (and statistic) information on consumption and emissions like; conductivity in several different water outlets, COD in waste water from different process steps and to the receiving water, NOX, SOX and H2S in the combustion gases from the energy production units and the lime kiln etc. WinMops contains both purely monitored data and calculations thereof, using several monitored data e.g. a monitored concentration and its relevant measured flow.
6.4 Environmental report The environmental report is a mandatory self-declaration called for by the local authorities to be used in their work of surveying that the environmental laws and permits are lived up to. The report is a retrospective summary of the previous time period, usually the previous year or half-year. The system boundaries include the production site in question for the environmental permit only. No life cycle perspective is considered, and no multi-output allocation is performed on the parameters in the environmental report. All flows (energy, material, emission etc.) are cut-off at the system boundaries. The presented information in the environmental report is not aggregated (each parameter is presented separately instead of aggregated to e.g. impact categories). However, the information is aggregated in the sense that it is not product specific, nor divided upon separate process phases. The environmental report is typically issued twice a year, one full version for the previous year’s activity and a half year complement. The functional unit is typically total production during one or a half year. The environmental report is primarily aimed at the local authorities, but is also distributed within the organization as a source of environmental information. The environmental report of the Skoghall Mill 1999 contains e.g. the following information: Chemicals: • The use of process chemicals is presented aggregated in classes, e.g. hydrophobic
agents, fillers, disperse agents, coatings, retention agents, optical brightening agents, chelating agents, water purification agents (AVR and polymers), oil additives, lubricants and hydraulic oil.
• Installed, refilled and collected freons (CFC, HCFC and HFC) from e.g. refrigerators and air-conditioners.
16 (61)
Energy: • Energy consumption for different process steps (e.g. recovery boiler and lime kiln) and
for different fuels (e.g. bio fuels, oil and electricity). Also the yearly energy consumption for internal transports is presented1.
Emissions:
• Emission to air of SOX
2 (expressed as S), NOX (expressed as NO2), ClO2 (expressed as active Chlorine) and particles from different specific sources, diffuse emissions and the total emission. The data is presented both as monthly and yearly averages. The unit is typically ton per time period.
• Emissions to water of suspended solids, BOD, COD, conductivity, N-tot, P-tot, AOX and Chlorate from different sources and the total emission. The data is presented both as monthly (or weekly) and yearly averages. The unit is typically ton per time period (conductivity is measured in mS/m). Also the flow of waste water, cooling water (both measured in m3) and it’s pH-value (dimensionless) is presented in a similar way.
• A single sample analysis of metal concentration in the wastewater emitted to the receiving water. The analyzed substances were Cadmium, Copper, Nickel, Chrome, Lead, Zinc, Aluminum and Mercury. A similar analysis of DTPA is also presented.
• Emissions to air from energy production as part of the EU’s CORINAIR-system; NMVOC, CH4, CO, CO2, N2O, NH3, Pentachlorophonol, Hexachlorobenzene, Arsenic, Cadmium, Chrome, Mercury, Nickel, Lead, Selenium, Zinc and PAH.
• Histograms showing the development of; flow of wastewater, emission to water (suspended solids, COD, BOD7, AOX, N-tot and P-tot), and emission to air (Sulfur and NOX). The data is presented both per day and/or per ton product. The time horizon for some of the histograms begins in 1980.
Waste: • The different kinds of general wastes (inert demolition waste, organic demolition waste,
ashes/slag, bio sludge, chemical sludge, fiber sludge and other waste), branch specific wastes (wood room waste, screen room waste, lime sludge, green liquor sludge, particles from recovery boiler, waste from recycled fiber, de-inking sludge, coating waste and other waste) and hazardous waste. Each final destiny (reuse, material recycling, energy recovery, deposition, to receiving water or destruction) is also defined. The data is presented in ton wet weight with the corresponding DS (in %).
Others: • Periodical inspection stipulated by the local authority as an independent verification of
the measurements normally performed internally at the mill. • Production related parameters, such as yearly production of different pulp qualities (i.e.
unbleached sulfate kraft, bleached sulfate kraft and CTMP) and the total sold production. • Monthly measurements of groundwater level at waste deposit to predict the risk of
landslide. • Weekly measurements of process water at the intake position. The parameters reported
include; pH-value, conductivity (mS/m), cleanness (mg KMnO4/liter), temperature (°C) and color (mg/liter).
The environment and product safety group is responsible for assembling the Skoghall Mill’s environmental report.
1 Included in separate survey for the Swedish Environmental Protection Agency. 2 Includes emissions of H2S.
17 (61)
6.5 Life Cycle Inventory/Assessment Life Cycle Inventory/Assessment (LCI/LCA) is an intermediate tool that together with other tools are used to produce environmental profiles for specific products that may be communicated to customers. The tool is intermediate in the sense that it is not directly used in communication without further processing. The LCIs conducted at the Skoghall Mill have had a retrospective view, being based on the previous year’s environmental performance. LCIs may also be used in product development using a retrospective perspective in order to predict the following years’ environmental performance or prospective data to make more traditional predictions of changes. The output of a LCI performed on the Skoghall Mill’s products commonly contains the following parameters: • Input;
• softwood, 100% DS • hardwood, 100% DS • purchased pulp, 90% DS • coating chemicals and fillers • fresh water • electricity, net use • external fuels; oil, bio-fuels and other
fuels • Heat energy, total consumption • Heat energy, sold • Co-products;
• Turpentine • Tall oil
• Emissions to air; • CO2 from fossil fuels • NOX as NO2 • SOX as SO2 • TRS as S • Particles
Other studies may present the results for other parameters or environmental impact categories, e.g. Acidification potential and Global Warming Potential. The output of the LCI/A is an aggregation of data in the sense that it is usually not possible distinguish separate process phases (within the internal process or at suppliers’ processes). Internally, LCI/A output is not aggregated at all, showing the environmental performance for each unit operation. The LCI/LCAs conducted typically have a cradle-to-gate approach, excluding the phases that the customers are influencing. There are two major reasons for this approach. Firstly, for paper products and other short life products the environmental life cycle burden is concentrated to the production phase. Secondly, the modeling of the user and end-of life phases may require uncertain assumptions. Gate-to-gate studies are also used to help in internal improvements. Normally a retrospective view is used with data from e.g. the previous year’s production. The functional unit for the LCI/LCA studies depends on the goal of the study, but is normally expressed as 1 ton of pulp, paper or board with a specific dry substance. In more comprehensive studies the functional unit may be expressed as the function of e.g. a packaging or 1 liter of milk. Traditionally 100% of the environmental impacts are allocated to the studied product (the main product) and none to the co-products, e.g. turpentine. LCI/LCA may be conducted periodically (typically annually) to supply a customer with updated environmental profiles, or whenever requested as a part in other more comprehensive LCI/LCA-studies. The environmental department at the production site performs the LCI/LCA studies, possibly with support from group wide resources.
18 (61)
6.6 Environmental statement EMAS (1993) stipulates that the environmental statement should include amongst others: • A description of the company’s operations at the site in question. • A qualitative evaluation of all essential environmental aspects affected by the company’s
operations. • A quantitative summary of emissions of environmentally hazardous substances,
generation of waste, consumption of raw materials, energy and water, generation of noise and other essential applicable environmental aspects.
• A description of other factors concerning the environmental work. • A presentation of how the company’s environmental policy, environmental goal and
program, and environmental management system has been implemented. Exactly which parameters should be included is however not stipulated. The intention is instead to describe the production site’s significant environmental aspects with the relevant indicators. The environmental statement is a yearly presentation of a company’s activities at a specific site during the previous year. The site is considered as one unit operation and no considerations are taken to environmental aspects up-stream and down-stream. EMAS (1993) does not state which functional unit should be used. Typically though the output data is presented per year or per ton “average product”, allowing no allocation. However, sometimes other companies are situated within the production site’s physical area, having an effect on energy production, waste water treatment etc. In these cases a decrease in the total production is normally done, i.e. reducing the total amount of steam produced correspondingly to the amount used by the external company. The reduction affects all steam generating activities equally, i.e. no marginal steam is considered. The output of the environmental data in the environmental statement is a list of relevant parameters, aggregated to the production site, i.e. no conclusions can be drawn on separate process steps. The environmental statement may have several target groups, e.g. customers, visitors and people living in the neighborhood. The environmental department normally assembles the statement with help from an external designer.
6.7 Environmental labels and declarations Today no environmental labels or environmental declarations are used for the Skoghall Mill’s products. Environmental labels and declarations may be divided in three types: • Type I – Third part certified, excluding environmental label, e.g. the Nordic Swan and the
EU-flower. Standardized in ISO 140241. • Type II – Self-declared environmental claims. Standardized in ISO 140212. • Type III – Third part certified, including environmental declarations, e.g. EPD (the
Swedish Environmental Product Declarations) and EDPS (the Canadian Environmental Profile Data Sheet). Standardized in ISO TR 140253.
All three types of labels are used in the Swedish pulp and paper industry, but the type I label is probably most common today. The type I eco-label is addressed to end-consumers and other customers who needs to make a quick choice between two or more products fulfilling the same function. The reason for a company to apply for an eco-label may be:
1 ISO 14024: Environmental Labels and Declarations – Type I Environmental Labelling. 2 ISO 14021: Environmental Labels and Declarations – Self-declared Environmental Claims (Type II
Environmental Labelling). 3 ISO TR 14025: Environmental Labels and Declarations – Type III Environmental Declarations.
19 (61)
• Some customers use environmental labels as criteria for environmental responsibility when purchasing raw- and supply materials. These customers therefor demand eco-labeled products.
• Demand from customer to enable the labeling of their products. • Internal desires to market the products as environmentally friendly to end consumers
sensible to this kind of labels.
6.7.1 Type I – the Nordic Swan The Nordic Swan eco-label exist for a variety of products. Important to the pulp and paper industry are e.g. the Nordic Swan for Packaging paper and the Nordic Swan for Printing paper. The parameters for the two labels are presented separately below. According to the Nordic Ecolabelling of Packaging paper, 1999 the criteria for achieving the Nordic Swan for packaging paper are: Raw-materials: • At least than 20% of the fiber raw material (roundwood) must origin from certified
forestry, e.g. FSC. This demand does not apply to products produced from 100% recycled fibers, 100% sawmill chip or combinations thereof.
Chemicals: • There are five separate demands on the chemicals used in production of pulp and paper
for packaging paper: • Active components in chemicals used for to fight the growth of undesired
microorganisms in water circulation system, must not be bio-accumulative. • Surface-active agents may not contain nonylphenoletoxylates. • Surface-active agents used for de-inking of recycled paper used in amounts not
exceeding 100 g/ton pulp (90% dry content) must be degradable according to OECD 302 A-C. Other surface-active agents used for de-inking must be degradable according to OECD 301 A-F.
• Chlorine gas must not be used for bleaching of pulp. • The total concentration of Lead, Cadmium, Mercury and Chrome in the packaging
paper must not exceed 100 ppm. The content of Cadmium may in addition not exceed 75 ppm.
• In addition a list of all production chemicals used for the production of pulp and paper is required.
Energy: • The emissions of fossil CO2 originating from internally and externally produced energy
(steam) and externally purchased and internally produced electricity must not exceed 700 kg/ton paper or board.
• The total energy consumption of the site must also be reported. Emissions: • The emissions to air and water included are; Sulfur to air, NOX to air, COD to water,
Phosphor to water and AOX to water. The amount of emissions of these parameters are put into algorithms that also take in account; the pulp mixture, amount of fillers/coating and the kappa number. For each emission factor there is a result of the algorithm that may not exceed a stipulated amount, and the sum of all emission parameters may also not exceed another amount.
20 (61)
Waste: • Both pulp suppliers and the paper producer must have an implemented waste
separation plan. • The energy content of deposited waste may not exceed 2 GJ/ton paper or board. Others: • Measures of the paper’ function are introduced as “function index”. These indexes are
adjusted to suit different types of paper and board; Liner, Fluting, Bag paper, Kraft and Board.
• All applicable environmental laws and permits must be fulfilled. If the production site is certified according to ISO 14001, this demand is considered to be fulfilled.
The demands for achieving the Nordic Swan for printing paper are (according to the Nordic Ecolabelling of Printing paper, 1999). Raw materials: • At least 15% of in-going pulps must be based on wood from certified forestry (e.g. FSC),
or at least 50% of the fiber raw material must come from recycled paper or saw mill chip. Chemicals: • There are also some demands on the chemicals used in production of pulp and paper for
printing paper: • Alkylphenol ethoxylates and other alkylphenol derivates may not be used in cleaning
chemicals, de-inking chemicals, foaming inhibitors, dispersants or coatings. • The total amount of residual monomers classified as environmentally harmful or
harmful to health may not be present in coatings, retention aids, strengtheners, water repellents or chemicals present in water treatment in a higher concentration than 100 ppm (in the supply chemical). This requirement does not include acrylamide for which the limit is 750 ppm.
• Surface-active agents used for de-inking of recycled paper used in amounts not exceeding 100 g/ton pulp (90% dry content) must be degradable according to OECD 302 A-C. Other surface-active agents used for de-inking must be degradable according to OECD 301 A-F.
• At least 95% of the in-going components in foam inhibitors must be readily biodegradable according to OECD 301 A-F or inherently biodegradable according to OECD 302 A-C. Foam inhibitors used for chemical recycling are excluded from this requirement.
• The use of pulp bleached with chlorine gas is not permitted. • Pulp producers using more than 1 kg EDTA/DTPA per ton of pulp must provide an
account of the amount of EDTA/DTPA used and discharged to the receiving water. • Active components in chemicals used for to fight the growth of undesired
microorganisms in water circulation system, must not be bio-accumulative. • A list of all production chemicals used for the production of pulp and paper is also
required. Energy: • The energy use is accounted for in another algorithm taking into consideration
parameters such as consumption of electricity and fuel for the pulp and paper processes. Also the total energy consumption for the production site must be documented, e.g. by means of copies of invoices, or meter readings.
21 (61)
Emissions: • A similar algorithm as the one used for the Nordic Ecolabelling for Packaging paper is
used for emissions of COD, Phosphorus, Sulfur, NOX and AOX. Additionally the AOX emission for each in-going pulp may not exceed 0,40 kg/ton pulp.
• The emissions of CO2 from internal combustion of fossil fuels may not exceed a certain level for different process steps; production of mechanical pulp, recycled pulp (DIP), chemical pulp and finally the paper production.
Waste: • All waste must be sorted at the production site and the various waste fractions must be
recycled or processed in an appropriate manner. • Combustible wood-containing waste may not deposited.
Figure 3: The Nordic Swan eco-label.
The Nordic Swan eco-label focuses on emissions and resource uses at the paper production site (gate-to-gate), with exceptions for forestry, pulp- and energy production. The label claims to cover a life cycle approach, though only for a few parameters e.g. demands on certified wood from sustainable forestry. Most flows are cut off at the production site’s gate, setting only demands on the quantitative flow and some specific issues (like chlorine gas bleaching). The in-going parameters for the Nordic Swan eco-label are expressed per ton of paper. The label has a retrospective view, and presents an aggregated binary output (label or no label). The criteria for the eco-label are updated whenever necessary or at least every five years, resulting in a new version of the criteria document. The criteria for the eco-label request a contact person to be announced. The contact person normally works at the environmental department and is responsible for assembling the environmental information.
6.7.2 Type I – the Good Environmental Choice The Good Environmental Choice (in Swedish ‘Bra Miljöval’) eco-label for printing paper exist in two ranks, Rank A and Rank B. The criteria for achieving the label for printing paper are according to the Swedish Society for Nature Conservation (1997): Raw materials: • The fiber raw material may no be delivered by suppliers who fell trees in forests that
ought to be protected to ensure bio-diversity or to be conserved to save essential natural areas. The criteria for Rank A is 80% FSC-certified fiber and/or recycled fiber, and for Rank B; 30%.
Chemicals: • A list of all supply and help chemicals and their amounts used for the paper production
must be presented. Also the types of pulps used must be presented. The paper may not contain more than 2% (w/w) organic substances that are not classified as readily or inherently degradable.
• The paper may not contain more than 1% pigments. The pigments may neither be acutely toxic to fish, daphnia and alga (more than 100 mg/l).
• Optical brightening agents must be proven to be biologically readily degradable.
22 (61)
• Only a few slime control agents are allowed for use and a number of chemicals are not allowed to be used, e.g. Chlorine-containing bleaching agents and EDTA.
Energy: • The total use of fossil fuels for each in-going pulp quality may not exceed 0,2 MWh/ton
pulp (Rank A) and 0,6 MWh/ton pulp (Rank B). Of the total amount of purchased electricity (pulp and paper production) must 60% (Rank A) be labeled with Good Environmental Choice. Rank B demands 30%.
• The production of pulp must also fulfill the net energy balance presented in the table below.
Table 1: For the eco-label Good Environmental Choice the following energy values must be fulfilled for the pulp production.
Rank A (MWh/ton pulp) Rank B (MWh/ton pulp)
Total Electricity Total Electricity
Bleached sulfate pulp -0,1 0,0 0,2 0,2
Unbleached sulfate pulp -0,1 0,0 0,2 0,2
Sulfite pulp -0,1 0,0 0,2 0,2
CTMP 1,0 1,6 1,5 2,0
TMP 1,0 1,6 1,5 2,0
Recycled pulp 0,3 0,4 0,6 0,6
Groundwood pulp 1,5 1,6 2,0 2,0
Emissions: • The levels of emissions to air and water differ for Rank A and B, but the parameters are:
Sulfur (to air), NOX (to air), COD (to water) and Phosphors (to water). Waste: • The amount of waste and the types of waste that occur must be presented. Others: • All national laws and regulations concerning environment and working-environment
must be fulfilled. • Rank A demands that the production site has a certified environmental management
system (according to EMAS and/or ISO 14001). • The possibility of recycling of the printing paper must be verified by a paper mill using
recycled paper as a raw material.
Figure 4: The Good Environmental Choice eco-label.
Like the Nordic Swan, the in-going parameters for the Good Environmental Choice eco-label are expressed per ton of paper. The label has also a retrospective view, and presents an aggregated binary output (label or no label). The label focuses on the paper production phase of the life cycle perspective, includeing forestry, pulp- and energy production. The amount of flows in and out from the production site are considered and certain criteria are set on them, but not in a life cycle perspective.
23 (61)
The criteria for the eco-label are updated whenever necessary, resulting in a new version of the criteria document. The data for the eco-label are commonly put together by the environmental department at the production site.
6.7.3 Type II – the Nordic Forest Industry Federation’s environmental product declaration
The Finnish, Norwegian and Swedish pulp and paper associations have created a draft manual for environmental product declarations. The self-declaration is based on ISO 14021 and should not be confused with the Swedish EPD-system described in section 6.7.4. The claims are intended for communication of environmental performance of pulp and paper products. The environmental parameters suggested to be communicated are described in the Nordic Forest Industry Federation (2000): • Product composition (total sum: 100%, bone dry weight-%)
• Sulfate pulp (__% of product content, of which __% produced at site) • Sulfite pulp (__% of product content, of which __% produced at site) • Mechanical pulp (__% of product content, of which __% produced at site) • Recovered pulp (__% of product content, of which __% produced at site) • Other fibers (__% of product content) • Pigments and fillers (__% of product content) • Binders, e.g. starch and latex (__% of product content)
• Primary fiber source(s) including fiber sources produced at the site and pulp procurement (total sum: 100%) • Roundwood (__%) • Saw mill chips (__%) • Others (__%)
• Total electricity (grid and co-generated) used for production of both pulp and paper (kWh/ton final product)
• Emissions to water from pulp and paper production • Process waste water (m3/ton final product), excluding cooling water • COD (kg/ton final product) • AOX (kg/ton final product) • Nitrogen, total (kg/ton final product) • Phosphorous (kg/ton final product)
• Emissions to air from pulp and paper production and from the generation of purchased electricity • Sulfur, total (kg/ton final product) • NOX (kg/ton final product) • Fossil CO2 (kg/ton final product)
• Solid waste to landfill (kg/ton final product) • Weighted average transport distance for wood and/or pulp and/or recovered paper to
the production site including the transports of pulp produced at the site or procured. • Wood (km/ton final product) • Pulp (km/ton final product) • Recovered paper (km/ton final product)
24 (61)
• Average transport mode of wood and/or pulp and/or recovered paper to the production site including the transports of pulp produced at the site or procured. This piece of information is optional. • Boat/floating (__%) • Train (__%) • Truck (__%)
6.7.4 Type III – the Swedish EDP system The framework for the Swedish EPD (Environmental Product Declaration) system is the Requirements for environmental product declarations (also referred to as MSR 1999:1), which is based on ISO 140201 and ISO/TR 14025. The MSR 1999:1 also refers to ISO 14040-432 for conduction of the LCA, which the declaration builds upon. The framework is described more in detail for each declared product group in a PSR (Product Specific Requirements). The PSR defines parameters, system boundaries, allocation rules etc. that should be used for the specific product group in order to make the information comparable. The PSR for pulp, paper and board is for the time being a proposal, but the proposed mandatory parameters for presentation are: • Renewable resources;
• without energy content • with energy content
• Non-renewable resources; • without energy content • with energy content
• Total energy consumption • Pollutant emissions should be aggregated in terms of potential environmental impacts to
the following impact categories: • Global warming potential for a 100 year period • Stratospheric ozone depletion • Acidification • Creation of ground-level ozone • Eutrophication
Other mandatory parameters are; emissions of toxic substances and generation of waste. The additional parameters include e.g. parameters on: • Fiber use, e.g. efficiency (ADMT3 fiber/product unit) • Fiber type, e.g. % roundwood of total fiber weight • Raw fiber source, e.g. from land certified by FSC (% of total fiber weight) • Energy use, e.g. hydroelectric source (% of total) • Water use, e.g. process water (m3/product unit)
1 ISO 14020: Environmental Labels and Declarations – General Principles. 2 ISO 14040-43: Life Cycle Assessment – LCA. 3 ADMT = Air Dry Metric Ton.
25 (61)
Figure 5: The EPD logotype.
The functional unit is 1 ton of manufactured product, with 90% solid dry content. Rules for allocation and system boundaries, i.e. what should be included and not, are defined in the PSR for pulp, paper and board. For multiple outputs allocation based on financial relations is suggested, unless the allocation problem may be avoided by dividing the process into further unit operations. The EPD-declaration is not a traditional eco-label illustrated with a bird or a flower, but a list of relevant environmental parameters based on a life cycle assessment. The declaration is aimed to professional customers who need information to e.g. compare competing suppliers on a more detailed level. The EPD-declaration is an alternative to traditional eco-labeling for products sold business-to-business. The EPD-system also helps a company to learn more about their products’ environmental impacts during the lifecycle (cradle-to-gate). An EDP-declaration is valid for three years, but should be updated as the conditions for the declaration (environmental performance of production site etc.) change. The EPD-declaration has a retrospective view, being based on environmental data typically from a previous year. Since the information in a EDP-declaration is an aggregation of data including different suppliers, the time period may be extended to more than a single year. Since no EPD-declaration for pulp, paper and board products not yet exist, nobody has yet been assigned at the production site to prepare the environmental data needed. However, most probable is that the same group that prepares the type I label information will be responsible for compiling this information as well.
6.8 Environmental Risk Assessment At the Skoghall Mill Environmental Risk Assessment (ERA) is used as an internal tool to predict risks associated with handling of chemicals etc. The results of an ERA may be used as input to the production site’s environmental management system, in which actions may be taken to reduce the risk. Routines or instructions may be implemented to decrease the possibility of an incident, or the consequence thereof. Differing from other environmental tools, the ERA deals with risks associated with handling (loading, storing, using and unloading) of chemicals, fuel oils, lubricants etc. at the production site. The way ERA is used at the Skoghall Mill, it is not a quantitative method and nor is any functional unit used. The ERA is typically performed to enable internal improvements. The risk is defined as the possibility of an incident multiplied by the environmental consequence of that incident.
Example: The possibility that a leakage from a chemical container reaches the receiving water is estimated to 3 (the scale spans from 1, low to 5, high).
The consequence of the leakage on the receiving water is assessed to be 4 (same scale as above), resulting in the risk 12 (3 × 4).
Both retro- and prospective approaches are possible in ERA, depending of the intentions of the study. The output of an ERA is typically a list presenting activities and processes with their associated estimations of possibility, consequence and risk. The most imminent risks from the list are then highlighted. The ERA may both be conducted internally by e.g. the environmental department at the production site or with external help from consultants. Sometimes a simplified form of ERA is conducted periodically by the production unit to
26 (61)
determine how environmental incidents may be prevented. The routines for using ERA at the Skoghall Mill are described in the company internal document 7.6.
6.9 Environmental Impact Assessment The environmental impact assessment, abbreviated EIA, is mandatory in the planning of any new or extended operations comprised by the authorities’ permits by the Swedish environmental code. EIA normally investigates the local impacts on nature and human health caused by a planned change of operation. The investigation is used in negotiations with authorities as a base for discussions of changes in environmental impacts due to (normally) increased production. The use of prospective data reflecting the consequences of a change is preferred. The included parameters and system boundaries vary to enable the prediction of the relevant environmental impact. Unlike LCA and other tools, EIA focuses on changes in processes. The EIA is commonly performed by the environmental and/or strategic functions within the production site in cooperation with the group’s environmental function.
6.10 Product safety Product safety deals with the content of hazardous substances in the products produced at the mill. Product safety is particularly common for products used for packaging of food to ensure the customers that the product is safe to use concerning effects on human health. The output of Product safety may be divided into two categories; periodically issued self-certifications of the product’s purity, and replies on customers’ inquires. The self-certifications are commonly statements that a certain product fulfills the purity requirements of the relevant product safety regulation (e.g. FDA and BgVV). The inquires in the later category may vary widely depending on the latest research results, recent unveiling in media, or just speculations. The content of hazardous substances may either be measured by a relevant analytic method and/or by investigating the contents of the raw-materials used in the production. The output is based on retrospective information, though the certificates commonly are valid for a time period ahead in time. The Product safety work is commonly performed at the production site by the production site’s local chemical group, with feasible support from group level.
27 (61)
7 Summary of environmental tools The environmental tools presented in the previous chapter are summarized in the table below.
Table 2: Summary of the environmental tools and some of the properties used. X indicates a strong interaction and (X) a possible or weaker interaction.
Envi
ronm
enta
l asp
ects
Envi
ronm
enta
l ob
ject
ives
and
targ
ets
Man
agem
ent’
s re
view
Envi
ronm
enta
l pr
oces
s co
ntro
l
Envi
ronm
enta
l rep
ort
Life
Cyc
le In
vent
ory/
As
sess
men
t
Envi
ronm
enta
l st
atem
ent
Envi
ronm
enta
l lab
els,
ty
pe I
Envi
ronm
enta
l de
clar
atio
ns, t
ype
II
Envi
ronm
enta
l de
clar
atio
ns, t
ype
III
Envi
ronm
enta
l Ris
k
Asse
ssm
ent
Envi
ronm
enta
l Im
pact
As
sess
men
t
Prod
uct s
afet
y
Functional unit: Per ton product - X X - - X (X) X X X - - (X)
Per year X (X) (X) - X - X - - - - - -
Other functional unit - (X) - X - (X) - - - - - - -
System boundary: Gate-to-gate X X X X X (X) X X X - X X (X)
Cradle-to-gate (X) (X) (X) - - X - (X) (X) X - (X) X
Unit process distinction, X X X X - X (X) (X) X X (X) - -
allocation, or - - - - - (X) - (X) X X - - -
system expansion - (X) (X) - - (X) - - - - - - -
Degree of aggregation of output:
Binary (yes or no) - (X) - - - - - X - - - - (X)
Selected parameters X X X X X X X - X X X X X
Inventory list - - - - - (X) - - - - - - -
Studied environmental effect:
Emissions and use of resources
X X X X X X X X X X (X) - (X)
Effect on nature (e.g. acidification)
(X) (X) (X) - - X (X) - - X (X) (X) (X)
Impact on safeguard subjects (e.g. bio-diversity)
- - - - (X) (X) - - - - - X -
The environmental information generated by the tools presented in the table above could be categorized into product related or process related. The ambition expressed in Stora Enso’s environmental and social responsibility policy (Stora Enso Environmental Statement 2000) to use a life cycle concept to guide environmental activities and minimize the products’ impact on the environment is in reality difficult to comply with. To fulfill this ambition the system boundaries used in some environmental tools (e.g. environmental aspects and
28 (61)
environmental objectives and targets) should be extended from today’s focus on the production site.
8 Interactions between the tools A method to structure the investigation of interactions between environmental tools is presented in Baumann & Cowell, 1998. The method suggests five basic relationships between tools: • Consecutive (Cs) – The results of one or more tool(s) are further processed in a second
tool to generate the intended output. E.g. the results of a LCI study are used for environmental communication in a type III environmental declaration.
• Complementary (Cm) – Two or more tools use the same basis for comparison, but give different types of results because they investigate different dimensions. E.g. the results of a LCI/LCA and an Environmental Risk Assessment may be used parallel to get a more complete picture of the environmental situation.
• Competing (Cp) – Two or more tools use the same basis for comparison and investigate the same dimension, but give different results due to different assumptions in the scope. E.g. the results of a prospective, change oriented LCA may differ from the results of a retrospective LCA reflecting the situation of historical data.
• Encompassing (En) – The result of one or more tools form an integral part of the result of another tool. E.g. the results of a life cycle inventory assessment may be further processed in a life cycle impact assessment. The results of the LCI may however also be used separately.
• Overlapping (Ov) – Two tools give the same result because their methodologies are similar. E.g. two different type I environmental labels may be applicable for a product, though they use slightly different criteria. The reason for the co-existence of two similar environmental labels may be market demands.
The figure below illustrates the interactions between the environmental tools used at the Skoghall Mill using the methodology presented above. The color codes indicates what functions at the mill operate each tool.
ENVIRONMENTAL DATA
Env. processcontrol
Env. labelingtype I
Env. statement
LCI/A
Env. report
Economicalfollow-up
Management’sreview Env. targets
Env. aspects
Env. declarationtype II + III
Env. declarationtype II + III
Env. riskassessment
Env. impactassessment Product safety
Otherinput
Otherinput
Otherinput
Otherinput
Operator legend:n = Management groupn = Environment and product
safety departmentn = Economy departmentn = IT departmentn = Currently not used
at the Skoghall Mill
Cp
En
CmCm
Cs Cs CsCs
Cs
Cs
Cs
Cs
En
En
Cs En
Cs
En
Cs
Figure 6: The interactions between the environmental tools mapped using the Baumann & Cowell approach.
29 (61)
The figure above indicates that Product safety and Environmental impact assessment are tools used separately from the other tools. Most other tools use environmental data that to a large extent origin from the WinMops system, but how that environmental data is used may vary for each tool. The box called “environmental data” in the figure above can be described as a database in which most of the production site’s relevant environmental and process surveillance data is gathered and from which data for a specific time interval may be taken. Due to the many needs to communicate environmental information (see figure 2), the structure of the database should enable documentation of what the data represents, how it was derived etc. A common structure for such documentation could also enable direct transfer of information between production site and e.g. group level. The Skoghall Mill’s system is called WinMops and is delivered by Kvaerner. The assembling of data in WinMops is further described in the figure below.
ENVIRONMENTAL DATAENVIRONMENTAL DATA
Transformed parameter from one ormore inputs, commonly aggregated over time,
e.g. kg fossil CO2/year
Automatic monitoring,e.g. generated steam [MJ/h]
Calculation coefficients, e.g. emission factors for fossil CO2
[kg CO2/MJ] calculated from theconsumption of fossil fuels
Manual monitoring, e.g.fuel consumption [m3/h]
Figure 7: The data in WinMops can be assembled from automatic monitoring, input of lab analysis, or calculations from other properties. The figure illustrates one example.
The environmental database receives information from automatic monitoring (e.g. wastewater flow meters, conductivity meters and pH-meters), manual monitoring (e.g. laboratory analysis of COD and AOX) and manual input of calculation properties (e.g. a fuel’s net energy content and CO2 emission factor). Different practitioners of environmental tools can then use the parameter generated from the environmental database. It is then essential to simplify the control of each parameter with respect to which technical system it represents, what is the frequency of the measurement, how are incorrect measurements dealt with etc. The practitioner can then determine if the parameter meets the level of data quality required by the intended actor.
30 (61)
9 Flows of information in the organization The environmentally related information within the pulp, paper or board organization is divided into the categories; raw materials, chemicals, energy, emissions to air, emissions to water and solid waste. The information flows are followed from the point of sampling or measurement, through compilation of reports to users of the information and their expectations on the information. The figure below illustrates how the flows of environmental information may flow through an organization. In this example the development manager assembles information from two separate departments to report to the site manager. The information can also be proceeded to other actors.
Other actors
Environmentaldata
”Black box”
Actor
Managementgroup
Economydepartment
Environmentaldepartment
Environmentallaboratory
Example of content in ”black box”
Flows of e.g.emissions
Flows of e.g.chemicals
Figure 8: Schematic example of environmental information flows within an organization.
The figure above is only a schematic illustration of the environmental information flows within the organization. For each environmental information category (raw materials, energy carriers etc.) a table presents the specific information flows. Figure 9 illustrates the structure for the tables in chapter 9.
31 (61)
Point ofmeasure-
ment*
Trans-formation of
properties
Informationstorage:
Responsiblefor storage:
Primary informationstorage
Subsequent useof information
Receiver ofinformation:
Used in tool:Technical system
Productionsite EDB
*Also includes Measured property and Method for measurement or calculation
Point ofmeasure-
ment*
Figure 9: Structure of the subsequent tables presenting the environmental information flows within the organization.
The subsequently used environmental tools refer to those described in chapter 6. The environmental tools are abbreviated as follows:
Table 3: Abbreviations of environmental tools used in the following sub-sections.
Environmental tool Abbreviation
Environmental aspects Asp
Environmental objectives and targets Obj
Management’s review MR
Environmental process control EPC
Environmental report ER
Life Cycle Inventory/Assessment LCI/A
Environmental statement ES
Environmental labels, type I type I
Environmental declarations, type II type II
Environmental declarations, type III type III
Environmental Risk Assessment ERA
Environmental Impact Assessment EIA
Product safety PS
32 (61)
9.1 Raw materials The raw materials included are; roundwood, sawmill chip, purchased pulp and process chemicals.
Table 4: Information related to raw material. Brackets [] indicate a possible or indirect relation.
Roundwood Sawmill chip Purchased pulp
Process chemicals
Note:
Point of measurement
At delivery At delivery At delivery At delivery -
Technical system Wood room Chip screen BM 7/8 Production site
According to figure 1.
Measured property
ton or m3sub ton or m3sub ton90, each pulp quality is measured separately
ton goods, each
chemical is measured separately
Each delivery is measured separately and accumulated over time.
Method for measurement or calculation
Handicraft by independent organization
Handicraft by independent organization
Supplier’s specification discounted
from budget by
Purchasing department.
Supplier’s specification discounted
from budget by
Purchasing department.
The methods are periodically controlled/ calibrated.
Transformation of properties
- - - Can be transformed into ton dry substance
-
Primary information storage/report
“Råvaru-deklaration, Skoghalls
Bruk”
“Råvaru-deklaration, Skoghalls
Bruk”
”MÄSK efterkalyler”
”MÄSK efterkalyler”
-
Responsible for info. storage
Stora Enso Skog, wood
supplier
Stora Enso Skog, wood
supplier
Economy department
Economy department
-
Key receivers of information
Manager Pulp
production, Env. engineer
Manager Pulp
production, Env. engineer
Managers Board
production, Env.
engineers
Managers Board
production, Env.
engineers
-
Subsequently used environ-mental tools
Asp, [Obj], [MR], LCI/A, ES, type I-III, [ERA], [EIA]
Asp, [Obj], [MR], LCI/A, ES, type I-III, [ERA], [EIA]
Asp, (Obj), [MR], EPC, LCI/A, ES, type I-III,
[ERA], [EIA], [PS]
Asp, [Obj], [MR], EPC, LCI/A, ES, type I-III,
[ERA], [EIA], [PS]
See table 3 for abbreviations.
33 (61)
9.2 Energy carriers The energy carriers included are: • Electricity; externally purchased and internally generated • Fuel oil; e.g. “Eo5” and “Ultra” • Fuel for internal transports; include diesel used to operate vehicles (trucks, loaders, cars
etc.), but also to stationary diesel generators etc. within and close to the production site. • Internal bio fuels; include black liquor, bark and other renewable fuels generated
internally at the production site. • External bio fuels; include bark and other renewable fuels purchased specifically to
generate energy.
Table 5: Information related to electricity. Brackets [] indicate a possible or indirect relation.
Electricity, externally purchased
Electricity, internally generated
Note:
Point of measurement
At delivery Generated at TG 8 and 9 -
Technical system Steam power station Steam power station According to figure 1.
Measured property
kWh kWh Both flows are accumulated over time.
Method for measurement or calculation
Flowmeter Flowmeter -
Transformation of properties
1 kWh = 3,6 MJ
1 kWh = 3,6 MJ
-
Primary information storage
WinMops WinMops -
Responsible for info. storage
Automated input Automated input -
Key receivers of information
Manager Chemical recovery and steam production
Manager Chemical recovery and steam production
-
Subsequently used environ-mental tools
Asp, [Obj], [MR], EPC, LCI/A, ES, type I-III, [ERA], [EIA]
Asp, [Obj], [MR], EPC, LCI/A, ES, type I-III, [ERA], [EIA]
See table 3 for abbreviations.
34 (61)
Table 6: Information related of fuels. Brackets [] indicate a possible or indirect relation.
Fuel oil Fuel for internal
transports
Internal bio fuels
External bio fuels
Note:
Point of measurement
At delivery to mill/cistern
At delivery to mill/cistern
After combustion
After combustion
-
Technical system Steam power station and
lime kiln
Production site
Steam power station
Steam power station
According to figure 1.
Measured property
m3 (each delivery is measured separately)
m3 (each delivery is measured separately)
MJ generated energy
MJ generated energy
Accumulation over time.
Method for measurement or calculation
Supplier’s specification
Supplier’s specification discounted
from budget.
The generated steam is
measured
The generated steam is
measured
The methods are periodically controlled/ calibrated.
Transformation of properties
Ultra: 38,7 GJ/m3, Eo5: 38,6 GJ/m3 (lower heat
values)
Diesel: 35,7 GJ/m3 (lower heat value)
Difficult to estimate
volume due to variable dry content
Difficult to estimate
volume due to variable dry content
Each boiler’s efficiency must be considered. Lower heat values taken from Energifakta.
Primary information storage
“Energiåret Skoghalls
Bruk”
As per invoice
“Energiåret Skoghalls
Bruk”
“Energiåret Skoghalls
Bruk”
-
Responsible for info. storage
Energy department
Purchasing department
Energy department
Energy department
-
Key receivers of information
Manager Chemical
recovery and steam
production
Production Managers
Manager Chemical
recovery and steam
production
Manager Chemical
recovery and steam
production
-
Subsequently used environ-mental tools
Asp, [Obj], [MR], EPC, LCI/A, ES, type I-III,
[ERA], [EIA]
Asp, [Obj], [MR], [LCI/A],
[ERA], [EIA]
Asp, [Obj], [MR], EPC, LCI/A, ES, type I-III,
[ERA], [EIA]
Asp, [Obj], [MR], EPC, LCI/A, ES, type I-III,
[ERA], [EIA]
See table 3 for abbreviations.
35 (61)
9.3 Emissions to air The emissions to air include fossil CO2, renewable CO2, NOX, SOX, H2S, Cl2 and ClO2, particles, smell and noise.
Table 7: Information related to air emissions 1(3). Brackets [] indicate a possible or indirect relation.
Fossil CO2 Renewable CO2 NOX Note:
Point of measurement
- - After combustion and purification
Described in “Kontrollprogram miljö, Skoghalls Bruk”
Technical system Steam power station and lime
kiln
Steam power station
Steam power station and lime
kiln
According to figure 1.
Measured property
ton ton mg/Nm3 Accumulation over time.
Method for measurement or calculation
Calculated from consumption of
fossil fuels
Calculated from consumption of
fossil fuels
UV-measure-ment (RADAS 1 G)
The methods are periodically controlled/ calibrated.
Transformation of properties
Ultra: 74 kg CO2/GJ, Eo5: 77 kg CO2/GJ and diesel:
73,5 kg CO2/GJ
Black liquor: 126 kg CO2/GJ, bark: 125 kg CO2/GJ,
waste wood: 125 kg CO2/GJ and sludge: 110 kg
CO2/GJ
Calculates as NO2. Transformed with
respect to the relevant flow
CO2 emission factors taken from Stora Enso’s environmental statement.
Primary information storage
Calculated for Stora Enso’s
environmental statement
Calculated for Stora Enso’s
environmental statement
WinMops -
Responsible for info. storage
Environmental engineer
Env. engineer Automated input -
Key receivers of information
Environmental engineer
Environmental engineer
Environmental engineer and Management
team*
* Follow up of environmental permit
Subsequently used environ-mental tools
Asp, [Obj], [MR], ER, LCI/A, ES, type
II and III, [ERA], [EIA]
Asp, [Obj], [MR], ER, LCI/A, ES, [ERA], [EIA]
Asp, [Obj], [MR], EPC, ER, LCI/A, ES,
type I-III, [ERA], [EIA]
See table 3 for abbreviations.
36 (61)
Table 8: Information related to air emissions 2(3). Brackets [] indicate a possible or indirect relation.
SOX H2S Cl2 and ClO2 Note:
Point of measurement
After combustion and purification
After combustion and purification
After purification Described in “Kontrollprogram miljö, Skoghalls Bruk”
Technical system Steam power station, chemical preparation and
lime kiln
Steam power station, tall oil
prod. and lime kiln
Bleaching plant According to figure 1.
Measured property
mg/Nm3 mg/Nm3 mg active chlorine/Nm3
Accumulation over time.
Method for measurement or calculation
IR-measure-ment (URAS 3 G)
UV-fluorescence measure-ment
(Thermo E. mod 45 A)
Sigrist cellulose du maroc
The methods are periodically controlled/ calibrated.
Transformation of properties
Calculates as SO2. Transformed with
respect to the relevant flow
Transformed with respect to the relevant flow
Transformed with respect to the relevant flow
-
Primary information storage
WinMops WinMops WinMops -
Responsible for info. storage
Automated input Automated input Automated input -
Key receivers of information
Environmental engineer and Management
team*
Environmental engineer and Management
team*
Environmental engineer and Management
team*
* Follow up of environmental permit
Subsequently used environ-mental tools
Asp, [Obj], [MR], EPC, ER, LCI/A, ES,
type I-III, [ERA], [EIA]
Asp, [Obj], [MR], EPC, ER, [LCI/A],
[ERA], [EIA]
Asp, [Obj], [MR], EPC, ER, [LCI/A],
[ERA], [EIA]
See table 3 for abbreviations.
37 (61)
Table 9: Information related to air emissions and noise 3(3). Brackets [] indicate a possible or indirect relation.
Particles Smell Noise Note:
Point of measurement
Steam power station and lime
kiln*
No measuring performed
Pre-defined locations about 1
km from the production site
* Described in “Kontrollprogram miljö, Skoghalls Bruk”
Technical system Steam power station and lime
kiln
Production site Production site According to figure 1.
Measured property
mg/Nm3 - dB (A) Accumulation over time.
Method for measurement or calculation
Manual outtake of samples
Registration of complaints
According to Swedish EPA’s instructions.
The methods are periodically controlled/ calibrated.
Transformation of properties
Transformed with respect to the relevant flow
Transformed with respect to the relevant flow
Transformed with respect to the relevant flow
-
Primary information storage
WinMops Registration in EMS Registration in EMS -
Responsible for info. storage
Manager Process laboratory
Env. engineer Safety engineer -
Key receivers of information
Environmental engineer and Management
team*
Environmental engineer
Environmental engineer and Management
team*
* Follow up of environmental permit
Subsequently used environ-mental tools
Asp, [Obj], [MR], EPC, ER, LCI/A, ES, type III, [ERA], [EIA]
Asp, [Obj], [MR], ER, ES, [ERA], [EIA]
Asp, [Obj], [MR], ER, ES, [ERA], [EIA]
See table 3 for abbreviations.
38 (61)
9.4 Emissions to water The parameters used to monitor emissions to water are both measured on-line and in the Swedac accredited process laboratory. Wastewater samples are taken from many different flows within the processes and the flows reaching the receiving water. Some of the parameters below are therefore measured/analyzed several times.
Table 10: Information related to laboratory measured water emissions 1(2). Brackets [] indicate a possible or indirect relation.
COD-Cr BOD Suspended solids Note:
Point of measurement
Multiple points At emission points to receiving water
and before and after aerated
lagoon
Multiple points Described in “Kontrollprogram miljö, Skoghalls Bruk”
Technical system Production site Production site Production site According to figure 1.
Measured property
mg O2/l mg O2/l mg/l Accumulation over time.
Method for measurement or calculation
Internal lab: Lange LCK 114/814
External lab: SS 028143
Internal lab: SS-EN 872
The methods are periodically controlled/ calibrated.
Transformation of properties
Transformed with respect to the relevant flow
Transformed with respect to the relevant flow
Transformed with respect to the relevant flow
-
Primary information storage
WinMops WinMops WinMops Manual input
Responsible for info. storage
Manager Process laboratory
Manager Process laboratory
Manager Process laboratory
-
Key receivers of information
Environmental engineer and Management
team*
Environmental engineer and Management
team*
Environmental engineer and Management
team*
* Follow up of environmental permit
Subsequently used environ-mental tools
Asp, [Obj], [MR], EPC, ER, LCI/A, ES,
type I-III, [ERA], [EIA]
Asp, [Obj], [MR], EPC, ER, LCI/A, ES, type III, [ERA], [EIA]
Asp, [Obj], [MR], EPC, ER, LCI/A, ES, type III, [ERA], [EIA]
See table 3 for abbreviations.
39 (61)
Table 11: Information related to laboratory measured water emissions 2(2). Brackets [] indicate a possible or indirect relation.
AOX Chlorate Phosphorus Nitrogen Note:
Point of measurement
At emission points to receiving water and before and
after aerated lagoon
At emission points to receiving water and before and
after aerated lagoon
At emission points to receiving
water
At emission points to receiving
water
Described in “Kontrollprogram miljö, Skoghalls Bruk”
Technical system Origins from bleaching activities
Origins from bleaching activities
Production site
Production site
According to figure 1.
Measured property
mg/l mg/l mg P/l mg N/l Accumulation over time.
Method for measurement or calculation
Internal lab: SS 028104-1
Internal lab: SCAN-Fourth
proposal
Internal lab: Lange LCK
349
Internal lab: Lange LCK
238
The methods are periodically controlled/ calibrated.
Transformation of properties
Transformed with respect
to the relevant flow
Transformed with respect
to the relevant flow
Transformed with respect
to the relevant flow
Transformed with respect
to the relevant flow
-
Primary information storage
WinMops WinMops WinMops WinMops -
Responsible for info. storage
Manager Process
laboratory
Manager Process
laboratory
Manager Process
laboratory
Manager Process
laboratory
-
Key receivers of information
Env. engineer and
Management team*
Env. engineer and
Management team*
Env. engineer and
Management team*
Env. engineer and
Management team*
* Follow up of environmental permit
Subsequently used environ-mental tools
Asp, [Obj], [MR], EPC,
ER, LCI/A, ES, type II-III,
[ERA], [EIA]
Asp, [Obj], [MR], EPC,
ER, LCI/A, ES, type III,
[ERA], [EIA]
Asp, [Obj], [MR], EPC,
ER, LCI/A, ES, type I-III,
[ERA], [EIA]
Asp, [Obj], [MR], EPC,
ER, LCI/A, ES, type II-III,
[ERA], [EIA]
See table 3 for abbreviations.
40 (61)
Table 12: Information related to on-line and/or laboratory measured water emissions. Brackets [] indicate a possible or indirect relation.
Waste water flow Conductivity pH Note:
Point of measurement
Multiple points Multiple points Multiple points -
Technical system According to figure 1.
Measured property
m3/hour* mS/m - * Accumulation over time.
Method for measurement or calculation
On-line: Parshall channel and
magnetic flowmeters
On-line: Conductivity
meter Internal lab: SS-EN
27888-1
On-line: pH meter Internal lab: SS
028122-2
The methods are periodically controlled/ calibrated.
Transformation of properties
Accumulated over time
- - Transformed with respect to relevant flow
Primary information storage
WinMops WinMops WinMops -
Responsible for info. storage
Automated input Automated input/ Manager Process
laboratory
Automated input/ Manager Process
laboratory
-
Key receivers of information
Environmental engineer
Environmental engineer
Environmental engineer
-
Subsequently used environ-mental tools
Asp, [Obj], [MR], EPC, ER, [LCI/A],
ES, type II-III, [EIA]
[Asp], [Obj], [MR], EPC, [ERA], [EIA]
Asp, [Obj], [MR], EPC, ER, [ERA],
[EIA]
See table 3 for abbreviations.
41 (61)
Table 13: Information related to status of receiving water. Brackets [] indicate a possible or indirect relation.
O2 level in receiving water
COD-Mn in receiving water
Color in receiving water
Note:
Point of measurement
Receiving water Receiving water Receiving water Samples are taken from multiple locations in the receiving water.
Technical system - - - Natural system affected by production site.
Measured property
mg O2/l mg O2/l mg/l -
Method for measurement or calculation
External accredited lab
External accredited lab
External accredited lab
-
Transformation of properties
- - - -
Primary information storage
Report from external
organization
Report from external
organization
Report from external
organization
-
Responsible for info. storage
Environmental engineer
Environmental engineer
Environmental engineer
-
Key receivers of information
Environmental engineer and
Management team
Environmental engineer and
Management team
Environmental engineer and
Management team
-
Subsequently used environ-mental tools
[Asp], [Obj], [MR], ER, [ERA], [EIA]
[Asp], [Obj], [MR], ER, [ERA], [EIA]
[Asp], [Obj], [MR], ER, [ERA], [EIA]
See table 3 for abbreviations.
42 (61)
9.5 Solid waste All solid waste from the Skoghall Mill is weighed when transported out from the mill’s premises. The weight, kind of waste, it’s origin and it’s destination (landfill, external incineration etc.) is feed into a database, from which statistics may be taken. Responsible for this “scales-computer” and its primary report at the Skoghall Mill is the Construction and Transportation department. The parameters used to characterize “the kind” of solid waste are taken from the European Waste Catalogue and may be abbreviated using the EWC-code presented within parenthesis. The solid waste is commonly divided upon branch specific and non-specific waste. The relevant branch specific wastes are: Bark (03 03 01), lime sludge, green liquor sludge (03 03 02), fiber and paper sludge (03 03 06) and other branch specific waste (03 03 99).
Table 14: Information related to branch specific solid waste 1(2). Brackets [] indicate a possible or indirect relation.
Bark (03 03 01)
Lime sludge Green liquor sludge
(03 03 02)
Note:
Point of measurement
Departure from production site
Departure from production site
Departure from production site
-
Technical system Wood room and Chip screen
White liquor preparation
White liquor preparation
According to figure 1.
Measured property
kg kg kg Wet weight
Method for measurement or calculation
Scales Scales Scales Automatic registration in “Scales-computer”
Transformation of properties
50% dry substance 80% dry substance 40% dry substance Aggregation over relevant time period
See table 3 for abbreviations. * Aggregated to “Solid waste”.
43 (61)
Table 15: Information related to branch specific solid waste 2(2). Brackets [] indicate a possible or indirect relation.
Fiber and paper sludge (03 03 06)
Other branch specific waste (03 03 99)
Note:
Point of measurement
Departure from production site
Departure from production site
-
Technical system Production site Production site According to figure 1.
Measured property
kg kg Wet weight
Method for measurement or calculation
Scales Scales Automatic registration in “Scales-computer”
Transformation of properties
33% dry substance - Aggregation over relevant time period
Primary information storage
“Scales-computer” “Scales-computer” -
Responsible for info. storage
Transportation department Transportation department -
Key receivers of information
Environmental engineer and Management team*
Environmental engineer and Management team*
* Follow up of environmental permit
Subsequently used environ-mental tools
Asp, [Obj], [MR], ER, LCI/A, ES**, type I-III**, [ERA], [EIA]
Asp, [Obj], [MR], ER, LCI/A, ES**, type I-III**, [ERA], [EIA]
See table 3 for abbreviations. ** Aggregated to “Solid waste”.
44 (61)
The non-specific waste parameters are: Mixed construction and demolition waste (17 07 01), ashes/slag (10 01 01), chemical sludge (19 08 04), hazardous waste (may be further divided into sub-categories) and other non-specific waste.
Table 16: Information related to non-specific solid waste 1(2). Brackets [] indicate a possible or indirect relation.
Mixed construction and demolition waste
(17 07 01)
Ashes/slag (10 01 01)
Chemical sludge (19 08 04)
Note:
Point of measurement
Departure from production site
Departure from production site
Departure from production site
-
Technical system Production site Steam power station
Wastewater treatment plant
According to figure 1.
Measured property
kg kg kg Wet weight
Method for measurement or calculation
Scales Scales Scales Automatic registration in “Scales-computer”
Transformation of properties
- 65% dry substance 33% dry substance Aggregation over relevant time period
See table 3 for abbreviations. ** Aggregated to “Solid waste”.
45 (61)
Table 17: Information related to branch specific solid waste 2(2). Brackets [] indicate a possible or indirect relation.
Hazardous waste Other non-specific waste Note:
Point of measurement
Departure from production site
Departure from production site
-
Technical system Production site Production site According to figure 1.
Measured property
kg, m3, pieces etc. kg Wet weight
Method for measurement or calculation
Scales Scales Automatic registration in “Scales-computer”
Transformation of properties
- - Aggregation over relevant time period
Primary information storage
“Scales-computer” “Scales-computer” -
Responsible for info. storage
Transportation department Transportation department -
Key receivers of information
Environmental engineer and Management team*
Environmental engineer and Management team*
* Follow up of environmental permit
Subsequently used environ-mental tools
Asp, [Obj], [MR], ER, LCI/A, ES, type I, [ERA], [EIA]
Asp, [Obj], [MR], ER, LCI/A, ES**, type I-III**, [ERA], [EIA]
See table 3 for abbreviations. ** Aggregated to “Solid waste”.
These parameters may then be aggregated to suit different actors’ need of information. These aggregates comprise: • Method of waste treatment (recycling, material reuse, energy extraction, internal land
filling, external land filling, to receiving water and destruction). These aggregates are used e.g. in the production sites environmental management system and in the environmental statement.
• Total amount of solid waste. • Total amount of solid waste to landfill.
46 (61)
9.6 Products The group products include: • End-products, the products from the Skoghall Mill is divided upon three categories; first
grade, second grade and broke depending on the products quality parameters. • Internal products, flows between sub-processes within the Skoghall Mill. Includes a
number of flows e.g. sawmill chip, bark, steam, green liquor, CTMP and board. • Co-products, delivered to external customers. Includes: Tall oil, turpentine, sodium
bisulphite and hot water to district heating.
Table 18: Information related to end- and internal products. Brackets [] indicate a possible or indirect relation.
End-products Internal products Note:
Point of measurement
Departure from the production site
Flow between two or more linked sub-processes
-
Technical system Production site Production site According to figure 1.
Measured property
ton packed board with 7% moist content (maximum)
kg, m3, m3sub, kWh, MJ etc. Accumulation over time.
Method for measurement or calculation
Weighing Flowmeters The methods are periodically controlled/ calibrated.
Transformation of properties
- - -
Primary information storage
WinMops Most flows are registered in WinMops
-
Responsible for info. storage
Automated input Automated input -
Key receivers of information
Production managers, Environmental engineer and
Management team*
Production managers * Follow up of environmental permit
Subsequently used environ-mental tools
Asp, EPC, ER, LCI/A, ES, type I-III, [ERA], [EIA], [PS]
EPC, ER, LCI/A, [ERA], [EIA] See table 3 for abbreviations.
47 (61)
Table 19: Information related to co-products. Brackets [] indicate a possible or indirect relation.
Tall oil Turpentine Sodium bisulphite
Hot water to district heating
Note:
Point of measurement
Departure from
production site
Departure from
production site
Departure from
production site
Departure from
production site
-
Technical system Tall oil production
Destruction kiln
Preparation of chemicals
Steam power station
According to figure 1.
Measured property
m3 m3 kg MJ Accumulation over relevant time period
Method for measurement or calculation
Flowmeter Flowmeter Flowmeter Calculated from
temperature and flow
The methods are periodically controlled/ calibrated.
Transformation of properties
- - - - -
Primary information storage
WinMops WinMops WinMops WinMops -
Responsible for info. storage
Automated input
Automated input
Automated input
Automated input
-
Key receivers of information
Env. engineer and Manager
Chemical recovery and
steam production
Env. engineer and Manager
Chemical recovery and
steam production
Manager Chemical
recovery and steam
production
Manager Chemical
recovery and steam
production
-
Subsequently used environ-mental tools
Asp, [Obj], [MR], EPC,
ER, LCI/A, ES, [type III],
[ERA], [EIA]
Asp, [Obj], [MR], EPC,
ER, LCI/A, ES, [type III],
[ERA], [EIA]
Asp, [Obj], [MR], EPC, LCI/A, ES, [type III],
[ERA], [EIA]
Asp, [Obj], [MR], EPC, LCI/A, ES, [type III],
[ERA], [EIA]
See table 3 for abbreviations.
48 (61)
10 Mapping of environmental tools on actors In the previous chapters the environmental tools used at the Skoghall Mill to generate relevant environmental information and the actors to whom the information is intended, have been presented. By adding the interactions between tools and the connections between actors on each other, it is possible to detect possible points of improvement in the handling of environmental information.
SuppliersGroup level
NGOs
Authorities
Customers PRODUCTION SITE
ENVIRONMENTAL DATA
Env. processcontrol
Env. labellingtype I
Env. statement
Env. reportEconomicalfollow-up
Env. targets Management’sreview
Env. aspectsEnv. declaration
type II + III
Env. riskassessment
Env. impactassessment
Product safety
Branch organizations
LCI/A
Group environmentalstatement
Environmental databasefor product groups
Particapation inLCA studies
???
Figure 10: Mapping of environmental tools on the actors seen from the Skoghall Mill’s perspective.
The figure also points out additional flows of information not handled by the tools used within the production site, e.g. delivery of data to branch organizations’ databases. All tools generating product specific environmental information, but also the identification of “Environmental aspects” uses “Economical follow-up” and “Environmental process control” as intermediary sources for data. Common to these tools is the need to make a model distinguishing several process steps within the production site. To be able to use these sources (“Economical follow-up” and “Environmental process control”) efficiently, there is a need for better documentation of the included processes and the energy and material flows connecting them. Some of these environmental tools are also analyzed with respect to flows of environmental information within the production site’s organization and the interface to external actors. This analysis is done using Beer’s Viable System Model (VSM), described by Flood and Carson (1993). These tools are: Economical follow-up, Environmental process control, LCI/A, Environmental aspects and Environmental report. The VSM methodology and results of these analyses are presented in Appendix A. Conclusions from the VSM analyses comprise that most sets of data are used in different contexts and are thus slightly modified to suite the new conditions. Examples of such modifications are increased level of detail on origin or destination of a flow, or recalculation to another functional unit. The environmental engineer is responsible to compile and communicate the Environmental report. To minimize the risk of multiple messages other environmental communication formats use information from the Environmental report.
49 (61)
11 Conclusions and need for further research The conclusions from this report are mainly drawn from chapters 5, 7, 8 and 10. Some interpretations of the results are already presented in those chapters. This chapter seeks to summarize those interpretations and conclude the report. The amount of environmental information handled by the production site is comprehensive and quite a few positions are engaged in forming the information and using it in various environmental tools. The risk of double work is minimized through a tradition of split responsibilities, but the risk is not eliminated. Part of the environmental information is manually or automatically feed into the production site’s process control system (e.g. WinMops). Internally, anyone interested is then able to reach the information. Other systems for handling of environmental information include the economy system (MÄSK) and the “scales computer” which registers information on solid waste. The difficulty, however, is to understand what the information represent, i.e. which technical system has been measured, what assumptions have been made for transformation of the information etc. By contacting “the right people” this metadata could be made available, but today this metadata is not documented in a transparent and easily available format. A transparent format for documentation of environmental information and it’s metadata would contribute enhance the credibility of the information and person independent reproducibility of the information, e.g. for updating of the annual environmental statement. The ambition to achieve credible and repeatable environmental information for both internal and external use is implemented in the Swedish forest industry through a project coordinated by CPM1. The aim of that project is to develop a methodology for handling of the forest industry’s environmental data. The methodology is based on two approaches developed by CPM: SPINE2 (strongly connected to the developing ISO 14 048 standard) and PHASETS3. SPINE and PHASETS are described in Carlson et al (1995) and Carlson and Pålsson (1999) respectively. Within Stora Enso the aim of the project is to integrate the methodology in the production sites’ environmental management systems and thereby securing the flow of environmental information from the production sites and the group to the actors. A methodology integrated in the production site’s environmental management system (ISO 14 001) to efficiently enable verifiable environmental communication. For each actor’s need of environmental information, a separate model for calculation is needed. Each such model must also be documented in accordance to ISO 14048 to secure the chain of repeatability and credability.
1 Competence center in Environmental Assessment of Product and Material System, hosted by Chalmers University of Technology 2 Sustainable Product Information Network for the Environment 3 PHASEs in the design of a model of a Technical System
50 (61)
Group-wideEnvironmental
Database
Documentation of processes and flows(ISO 14 048)
Modeling & calculations, e.g. LCA(ISO 14 040-43 and 14 048)
EnvironmentalManagement System
(ISO 14 001)
Communication
Product specificenvironmental information
(ISO 14 020-25)
Process specificenvironmental information,
e.g. Environmental report
Figure 11: Schematic model for building up repeatable and credible environmental communication based on international standards. All procedures for communicating environmental information are integrated in the environmental management system.
Most Swedish pulp and paper mills have both quality and environmental management systems certified according to ISO 9001 and 14001 respectively. The Skoghall Mill, like other production sites, has an integrated environmental and quality management system. As the ISO 9001 and 14001 standards are revised and become more adapted to each other, the integration of the two systems will probably be even more common. The management system includes routines and documentation for the relevant environmental tools presented above, although some supplements are needed. The approach illustrated in figure 11 should also be integrated in the environmental management system in order to make the environmental communication more efficient. Such integration should include routines on: • How to document the relevant processes and flows and how to keep the documentation
updated. • How to construct models that generate environmental information for different
applications. • How to communicate such information. • How to transfer the relevant information from a production site to a group-wide
environmental database. An integrated handling of environmental information may also benefit from the environmental management system’s auditing to generate third party verified information. The details of how this should be conducted is still to determine. The life cycle approach has enabled the environmental work to become more holistic than it used to be. It also facilitates the comparison between two or more products, given that the information given for these products is generated using the same system boundaries, cut-off rules, allocation rules, etc. The pulp and paper industry must however continue to exchange relevant environmental information with both suppliers and customers to learn more about each other’s processes. This may be considered as an expanded process optimization.
51 (61)
Today’s knowledge: Target:
Supplier →Pulp and
paper industry
→ Customer Supplier ↔Pulp and
paper industry
↔ Customer
Figure 12: The “knowledge-chain” must be expanded and integrated to better take
advantage of the life cycle approach.
Today retrospective data is used in environmental calculations to a large extent, also for applications that aims to predict the environmental performance after changes in the product or the production chain. Such predictions call for prospective data, taking marginal effects and system expansions into account. A prospective approach for change oriented issues (e.g. product and process development) should therefore be introduced. A methodology for handling of environmental data must due to the various arts of environmental tools be very flexible, enabling the use of different system boundaries, functional units, retro- or prospective data, etc.
Customer II
Process step 4Process step 2Process step 1
Supplier C
Supplier B
Supplier A Customer IConverter I
Process step 5Process step 3
Original system (production site)
Expanded system
Figure 13: Illustration of how different environmental tools require different system boundaries. The original system suits the environmental report, whereas the expanded system suits environmental declarations, e.g. the EPD.
52 (61)
12 Acknowledgment Great thanks! To Anne-Marie Tillman, Environmental Systems Analysis at Chalmers University of Technology, Göteborg, Sweden for structure and input! To my employer Stora Enso Environment for funding this research project. To those who have contributed with material and/or answers to my questions.
13 Glossary • ADMT = Air Dry Metric Ton. • AOX = Adsorbable Organic halogens, commonly expressed as kg AOX. • BOD5 or 7 = Biological Oxygen Demand, commonly measured during five or seven day
(indicated by the index) expressed as kg O2. • BgVV = Das Bundesinstitut für gesundheitlichen Verbraucherschutz und Veterinärmedizin
(further described on www.bgvv.de) • COD = Chemical Oxygen Demand, expressed as kg O2. • CTMP = Chemo-Thermo Mechanical Pulp. • DS = Dry Substance. • EMS = Environmental Management System, instructions and routines for a production
site’s environmental work, often certified according to ISO 14001. • EWC = European Waste Catalogue. • FDA = U.S. Food and Drug Administration (further described on www.fda.gov) • FSC = Forestry Stewardship Council, certification criteria for forestry operations. • FU = Functional unit. Term used in the LCA community for the reference flow from a
studied system, or a sub-system. • m3sub = cubic meter solid under bark. • NMVOC = Non-Methane Volatile Organic Compounds. • NOX = Nitrogen oxides (NO and NO2), commonly expressed as kg NO2. • TMP = Thermo Mechanical Pulp. • TRS = Total reduced sulfurs (e.g. H2S), commonly expressed as kg S. • PAH = Poly-Aromatic Hydrocarbons. • POPs = Persistent Organic Pollutants. • SOX = Sulfuric gases (SO2, SO3 and H2S), commonly expressed as kg S or SO2. • Total N = total emissions of Nitrogen containing compounds, commonly expressed as kg
N. • Total P = total emissions of Phosphorus containing compounds, commonly expressed as
kg P.
53 (61)
14 References
14.1 External literature • H. Baumann and S. J. Cowell (1998). An evaluative framework for environmental
management approaches. Business, Strategy and Environment, January 1998. • Carlson R., Löfgren G., Steen B. (1995). SPINE, A Relation Database Structure for Life Cycle
Assessment. Göteborg. IVL-REPORT. September 1995. • Carlson R., Pålsson A-C. (1999). A Procedural Approach to the Design of a Model of a
Technical System. Submitted to Journal of Cleaner Production December 1999. • EMAS (1993). The European Union council regulation 1836/93. Allowing voluntary
participation by organisations in a community eco-management and audit scheme. Official Journal of the European Communities, June 1993.
• ISO 14001 (1996). Environmental management systems – Specification with guidance for use. Svensk Standard SS-EN ISO 14001, 1996.
• R.L. Flood and E.R. Carson (1993). Dealing with complexity: an introduction to the theory and application of systems science. Plenum Press, New York. 1993.
• D. Koch (1999). Air emissions. Annual topic update 1998. European Environment Agency. Topic report No 12/1999.
• Nordic Ecolabelling of Packaging paper (1999). Ecolabelling of Packaging paper. Criteria document 10 December 1998 – 9 December 2002, Version 1.3. Nordic Ecolabelling December 1999.
• Nordic Ecolabelling of Printing paper (1999). Ecolabelling of Printing paper. Criteria document 3 December 1999 – 31 January 2004, Version 2.0. Nordic Ecolabelling December 1999.
• The Nordic Forest Industry Federation (2000). Pulp and paper industry manual for preparation of an environmental product declaration. Swedish Forest Industries Federation, Stockholm, May 2000.
• M. Ritter (1998). CORINAIR 1994 Inventory. European Environment Agency, Copenhagen, 1998.
• SETAC-Europe Working Group on Conceptually Related Programms (1997). Life Cycle Assessment and Conceptually Related Programmes. Report for SETAC-Europe, Brussels.
• Stora Enso Environmental Statement 2000. Available at: http://www.storaenso.com/files/environmental_report_2000.pdf
• The Swedish Society for Nature Conservation (1997). Miljökriterier för papper (~ Environmental criteria for paper). The Swedish Society for Nature Conservation, Göteborg, 1998.
• The Swedish Environmental Management Council (1999:1). Requirements for environmental product declarations, EPD. An application of ISO TR 14025 type III environmental declarations. MSR 1999:1, Swedish Environmental Management Council, November 1999.
• The Swedish Environmental Management Council (1999:2). Proposal for product specific requirements for pulp, paper and board. Swedish Environmental Management Council, August 1999.
54 (61)
14.2 Company internal documents The following company internal documents are not public and they are in Swedish only. • Dok nr 1.8, Företagsledningens genomgång • Dok nr 4.1, Produktutveckling • Dok nr 7.1, Miljöpåverkande faktorer • Dok nr 7.2, Miljöpåverkande faktorer • Dok nr 7.3, Underlag för miljömål • Dok nr 7.6, Miljöriskanalyser • Energiåret 1999, Skoghalls Bruk • Kontrollprogram Miljö, Stora Enso Skoghalls Bruk • Miljörapport, Stora Enso Skoghalls Bruk, 1999 • Mäsk efterkalkyler, januari – december 1999 • Råvarudeklaration, Skoghallsverken 1999, Anskaffat för Skoghalls räkning
55 (61)
Appendix A: Beer’s VSM Beer’s Viable System Model is used to map out the organizational connections occurring when an environmental tool is used at the Skoghall Mill. The model consists of five functional elements connected through information and control networks: • System 1: Implementation
Any missions that the organization is expected to conduct are carried out in System 1. A-D are subsidiaries that each have relations with the surrounding environment. The subsidiaries interact with each other and have their own local management (1A-1D).
• System 2: Co-operation The assignment of System 2 is to enable the work in System 1 to proceed smoothly.
• System 3: Control Controls three information systems: the vertical axis (part of the joint management system), information from System 2, and the direct audit channel (3*) to operational subsidiaries A-D. System 3 interprets policies based on information from System 2, 3* and external information from System 4. Plans are forwarded, the implementation of policies is controlled and resources are distributed to System 1. System 3 controls System 1’s achievements and reports to Systems 4 and 5.
• System 4: Development System 4 operates as a filter of information. Instructions from the strategic function System 5 are forwarded to the accomplishing Systems 1-3 and information is forwarded in the opposite direction for strategic decision making. System 4 also communicates any information with the surroundings that is necessary for the organization to stay vital.
• System 5: Policy System 5 is responsible for the organization’s direction, through balancing of internal and external demands. Policies are formulated here based on information from System 4.
Systems 1-3 are autonomic accomplishing systems and Systems 4-5 have strategic functions.
56 (61)
5.
2.
3.
4.
A. 1A.
1B.
1C.
1D.
B.
C.
D.
Audit channel(3*)
Environ-ment
1-5 Beer’s system 1-5A-D Subsidiaries1A-1D Local management
Information flowsMaterial flows
• Sensor/effector
1-5 Beer’s system 1-5A-D Subsidiaries1A-1D Local management
Information flowsMaterial flows
• Sensor/effector
Figure A1: Beer’s Viable System Model (VSM) according to Flood and Carson (1993).
57 (61)
A.1 Beer’s VSM on Economical follow-up at the Skoghall Mill
1A.
1B.
3.Economyassistant
4.ManagerEconomy
5.Millmanagementteam
Internal needsto monitor
production costs
2.Economyassistant
A.
Audit channel(3*)
B.
Table explaining VSM-system 1 for Economical follow-up
Environment Subsidiary Beer’s system 1
Purchased wood, pulp chemicals etc.
Production site Manager Purchasing
Consumption of chemicals etc. and production of internal products at the departments
Production departments Production Managers
58 (61)
A.2 Beer’s VSM on Environmental process control at the Skoghall Mill
1A.
1B.
3.WinMopsuser group
4.CoordinatorWinMops
5.Millmanagementteam
Internal needsto monitor
environmentallyrelated flows
2.CoordinatorWinMops
A.
Audit channel(3*)
B.
Table explaining VSM-system 1 for Environmental process control
Environment Subsidiary Beer’s system 1
Laboratory analyses of emissions to water
Production site Manager Process laboratory
Emissions to air Production site Automatic monitoring equipment
Flows of internal products, purchased chemicals etc.
Each production department Automatic monitoring equipment
59 (61)
A.3 Beer’s VSM on LCI/A at the Skoghall Mill
1A.
1B.
3. ManagerDevelopment
4. Marketdepartment
5.Millmanagementteam
Customer’sdemand forLCI/A data
2. Developmentengineer,Environment
A.
Audit channel(3*)
B.
Table explaining VSM-system 1 for LCI/A
Environment Subsidiary Beer’s system 1
Emissions to air and water and production volumes
Production site Environmental report
Internal products Production site Environmental process control
Information from suppliers of wood, pulp chemicals etc.
Production site Purchasing department
Internal flows of steam and electricity
Steam power station Manager Chemical recovery and steam production
Waste flows and fuel consumption
Internal transports Manager Construction and Transportation
60 (61)
A.4 Beer’s VSM on identification of Environmental aspects at the Skoghall Mill
1A.
1B.
3. Develop-mentengineer,Environment
4. CoordinatorManagement system
5. Millmanagementteam
Need toidentify env.impacts (ISO
14 001)
2. Developmentengineer,Environment
A.
Audit channel(3*)
B.
Table explaining VSM-system 1 for identification of Environmental aspects
Environment Subsidiary Beer’s system 1
Internal products Production site Environmental process control
Production site’s impact on the environment
Production site Mill manager
Departments’ contribution to impact
Producing departments Environmental engineer
Internal flows of steam and electricity
Steam power station Manager Chemical recovery and steam production
Waste flows and fuel consumption
Internal transports Manager Construction and Transportation
61 (61)
A.5 Beer’s VSM on Environmental report at the Skoghall Mill
1A.
1B.
3.Environ-mental engineer
4. Environ-mentalengineer
5. Manager Development
Authority’srequst
formulatedin the ”Control
program”
2. Environ-mentalengineer
A.
Audit channel(3*)
B.
Table explaining VSM-system 1 for Environmental report
Environment Subsidiary Beer’s system 1
Production volumes of pulp and board
Pulp and board departments Production managers
Consumption of chemicals, purchased pulp etc.
Production site Manager Purchasing
Emissions to air and water Production site Environmental engineer
Emissions of metals and nutrients Production site External laboratory
Handling of Freons Production site Maintenance personal
Solid waste to landfill and hazardous waste
Production site Manager Construction and Transportation
Monitoring of receiving water Lake Vänern External laboratory