A STUDY OF COMPETITION IN THE U.S. FREIGHT RAILROAD INDUSTRY AND ANALYSIS OF PROPOSALS THAT MIGHT ENHANCE COMPETITION Revised Final Report Laurits R. Christensen Associates, Inc. Madison, WI November 2009 Executive Summary of Revised Final Report Prepared for The Surface Transportation Board Washington, DC
Transcript
A STUDY OF COMPETITION IN THE U.S. FREIGHT RAILROAD INDUSTRY AND
ANALYSIS OF PROPOSALS THAT MIGHT ENHANCE COMPETITION
Revised Final Report
Laurits R. Christensen Associates, Inc. Madison, WI
November 2009
Executive Summary of Revised Final Report
Prepared for The Surface Transportation Board
Washington, DC
Preface to Revised Final Report In November 2008, Christensen Associates issued A Study of Competition in the U.S. Freight Railroad Industry and Analysis of Proposals that Might Enhance Competition. We believed our analysis was based on revenue information from the unmasked Customer Waybill Sample (CWS). However, it has since been discovered that we were provided with a mixture of masked and unmasked CWS revenue data for years 2001-2006, with the effect that masked revenues were used in portions of our analysis. Additionally, the Surface Transportation Board revised CWS data from 1990-1999 that were used to develop data on long-term trends in shipment volumes, revenue, and characteristics. Consequently, the Surface Transportation Board has retained Christensen Associates to revise the original report with the corrected CWS revenue information as well as to update the results with 2007 and 2008 information that has become available since the original report was released.
Using unmasked revenues has generally minor effects on the econometric pricing analysis presented in Chapters 11-15. The corrected analysis shows generally similar responsiveness of revenue per ton-mile to cost-related shipment characteristics and market structure factors as the originally published study. Since unmasked revenues are lower overall than masked revenues, distributions of the revenue-to-variable cost ratio (R/VC) for shipment tonnage and ton-miles reported in Chapter 11 shifted downward, with markedly lower shares above 300 percent R/VC and higher shares below 100 percent R/VC.
Some of the price indexes presented in Chapter 8 also relied on CWS revenues. Using unmasked revenues in the computation of these indexes does not result in any significant changes to our analysis presented in Chapter 8.
In the process of revising the analysis, we also made corrections to Chapter 10 where we originally used nominal values rather than real (constant 2000 dollar) values for revenue per ton mile, average total cost, average variable cost, and average fixed cost. The use of nominal values resulted in an understatement of these values for 1987-1999 and an overstatement of these values for 2001-2006, which have been corrected in this release with the use of real values. However, our crucial finding in Chapter 10—that the recent increase in revenue per ton-mile appears to be the result of cost increases and not due to the increased exercise of market power—remains unchanged.
Preface
In addition to the affected chapters, there are some changes in chapters where references are made to the affected chapters. Specifically, the sections of the Executive Summary, and Chapters 18, 22, and 23 that refer to the results of the affected chapters have been revised.
This revision corrects the original report through the period 2006. An update to the study using the newly available 2007 and 2008 data is forthcoming as a separate document.
Report Contents
ACKNOWLEDGEMENTS
ABBREVIATIONS
EXECUTIVE SUMMARY
VOLUME 1: DESCRIPTION OF THE U.S. FREIGHT RAILROAD INDUSTRY
ABBREVIATIONS
LIST OF FIGURES
LIST OF TABLES
CHAPTER 1 INTRODUCTION AND OVERVIEW OF VOLUME 1
CHAPTER 2 OVERVIEW OF THE U.S. RAILROAD INDUSTRY
CHAPTER 3 ECONOMIC CHARACTERISTICS OF NETWORK INDUSTRIES WITH COMPARISONS TO THE RAILROAD INDUSTRY
CHAPTER 4 REVIEW OF ECONOMIC STUDIES OF RAILROAD PRICING, COSTS, PRODUCTIVITY, AND INDUSTRY STRUCTURE
CHAPTER 5 THE CURRENT CONCERNS ABOUT THE PERFORMANCE OF THE U.S. FREIGHT INDUSTRY
REFERENCES
VOLUME 2: ANALYSIS OF COMPETITION, CAPACITY, AND SERVICE QUALITY
ABBREVIATIONS
LIST OF FIGURES
LIST OF TABLES
CHAPTER 6 INTRODUCTION AND OVERVIEW OF VOLUME 2
CHAPTER 7 DATA AND METHODOLOGY
CHAPTER 8 OVERVIEW OF INDUSTRY PERFORMANCE
CHAPTER 9 RAILROAD COSTS AND TECHNOLOGY
CHAPTER 10 AN OVERVIEW OF COSTS AND REVENUE
CHAPTER 11 RAILROAD PRICING BEHAVIOR
CHAPTER 12 ANALYSIS OF COMPETITION: COAL
CHAPTER 13 ANALYSIS OF COMPETITION: CORN AND WHEAT
CHAPTER 14 ANALYSIS OF COMPETITION: CHEMICALS
CHAPTER 15 ANALYSIS OF COMPETITION: INTERMODAL SHIPMENTS
CHAPTER 16 ANALYSIS OF RAILROAD CAPACITY
CHAPTER 17 SERVICE QUALITY
CHAPTER 18 CONCLUSIONS ON THE STATE OF COMPETITION IN THE U.S. FREIGHT RAILROAD INDUSTRY REFERENCES
VOLUME 3: POLICY ANALYSIS AND FUTURE DIRECTIONS FOR RESEARCH
ABBREVIATIONS
LIST OF FIGURES
LIST OF TABLES
CHAPTER 19 INTRODUCTION AND OVERVIEW OF VOLUME 3
CHAPTER 20 HISTORICAL AND CURRENT RAILROAD LEGISLATION AND REGULATION
CHAPTER 21 DESCRIPTION OF RECENT RAILROAD INDUSTRY POLICY PROPOSALS
CHAPTER 22 ECONOMIC ANALYSIS OF PROPOSED POLICY CHANGES
CHAPTER 23 CONCLUSIONS AND FUTURE DIRECTIONS REFERENCES
Acknowledgements The primary authors of this report are Kelly Eakin, Mark Meitzen, Thomas Bozzo, and Philip Schoech. These authors received insightful guidance from senior members of the Christensen Associates Railroad Study Team, Joseph Swanson of Jos. Swanson & Co. and Northwestern University (project manager), and Douglas Caves and Laurits Christensen (both of Christensen Associates). We also received valuable contributions from the other senior members of our study team, Wesley Wilson of the University of Oregon (who was also largely responsible for Chapter 4) and John Hudson of Northwestern University.
Dave Armstrong was the lead data analyst for the project. Rita Sweeney was the primary editor of this report and Teresa Sholts was the production manager. Key contributions to chapters of this study were made by Casey Schuster (Chapters 20 and 21) and Michael Welsh (Chapter 2). Jane Hosking served as our head librarian. The following Christensen Associates personnel also contributed to this project: Carl Degen, Tammy Droessler, Marlies Hilbrink, Michelle Lindauer, Emilie Rivers, and Brad Wagner.
We received valuable insights and contributions from the members of our Advisory Panel, who are listed in the Appendix to Chapter 5.
In addition, we would like to thank the following individuals for assistance in obtaining data used in this study: Nick Marathon of the U.S. Department of Agriculture; Craig Rocky, John Gray, Clyde Crimmel, and Frank Hardesty of the Association of American Railroads; Steve Brown of the U.S. Government Accountability Office; John Larkin of Stifel Nicolaus; William Greene of Morgan Stanley; Francetta Willett of the U.S. Bureau of Labor Statistics; Mac Frampton and Paul Aguiar of the U.S. Surface Transportation Board; Douglas Benson of the Upper Great Plains Transportation Institute; and Dennis Weisman of Kansas State University.
We also want to thank all the stakeholders who participated in our study in one way or another, providing valuable information, institutional knowledge, and insights.
William Brennan of the STB Office of Economics served as the STB project manager and our liaison with the STB. He was always prompt and helpful in his responses to our inquiries. He managed the project in a manner completely consistent with the stated goal of this project—an independent assessment of the U.S. freight railroad industry.
Inevitably, we have inadvertently forgotten to include someone on this list. We apologize for the oversight and offer our sincere gratitude.
ABBREVIATIONS
ABBREVIATIONS 3-R Act Regional Rail Reorganization Act of 1973 4-R Act Railroad Revitalization and Regulatory Reform Act
of 1976 AAR Association of American Railroads AFC Average Fixed Cost ATC Average Total Cost AVC Average Variable Cost BEA Bureau of Economic Analysis BLS Bureau of Labor Statistics the Board Surface Transportation Board BNSF Burlington Northern Santa Fe CAPM Capital Asset Pricing Model CBO Congressional Budget Office CCO Common Carrier Obligation CFR or C.F.R. Code of Federal Regulations CMP Constrained Market Pricing CN Canadian National the Commission Interstate Commerce Commission CP Canadian Pacific CSX CSX Corporation CWS Carload Waybill Sample DCF Discounted Cash Flow DOJ Department of Justice DOT Department of Transportation FCC Federal Communications Commission FDC Fully Distributed Costing (methodology) FTC Federal Trade Commission GAO Government Accountability Office GDP Gross Domestic Product ICC Interstate Commerce Commission (also referred to
as “the Commission”) ICCTA ICC Termination Act of 1995 KCS Kansas City Southern MC Marginal Cost
ABBREVIATIONS
MFP Multi-Factor Productivity NS Norfolk Southern PAF Productivity Adjustment Factor PPI Producer Price Index R/VC Revenue to Variable Cost ratio R-1 Form R-1 data from Class I railroads’ Annual
Reports filed with the STB RCAF Rail Cost Adjustment Factor RCAF-A Adjusted RCAF RCAF-U Unadjusted RCAF RPM Railroad Performance Measures RPTM Revenue per Ton-Mile SAC Stand-Alone Cost (methodology) SARR Stand-Alone Railroad (analysis) SPLC Standard Point Location Code STB Surface Transportation Board STCC Standard Transportation Commodity Code TFP Total Factor Productivity TTX TTX Company UP Union Pacific URCS Uniform Rail Costing System USC or U.S.C. United States Code USO Universal Service Obligation USDA U.S. Department of Agriculture
INTRODUCTION ........................................................................................................... ES-1 The 2006 GAO Report ................................................................................... ES-1 The Current Study .......................................................................................... ES-3 Organization of this Executive Summary........................................................ ES-4
ES1 CURRENT STATE OF COMPETITION IN U.S. FREIGHT RAILROAD INDUSTRY ................ ES-6 Characteristics of U.S. Freight Railroad Traffic .............................................. ES-6 Structure of U.S. Freight Railroad Industry..................................................... ES-8 Assessment of Shipper Captivity.................................................................. ES-10 R/VC Data Issues......................................................................................... ES-11 R/VC and Market Structure Factors ............................................................. ES-12 Evaluating “Captivity” and Market Structure Factors .................................... ES-14 Trends in Rates ............................................................................................ ES-15 Trends in Input Prices and Productivity ........................................................ ES-16 Trends in Economic Costs............................................................................ ES-18 Economies of Density and Differential Pricing by Commodity ...................... ES-22 Financial Viability.......................................................................................... ES-26
ES2 CURRENT AND NEAR-FUTURE CAPACITY CONSTRAINTS ........................................ ES-27 ES3 CAPACITY INVESTMENT...................................................................................... ES-30 ES4 IMPACT OF CAPACITY CONSTRAINTS ON COMPETITION.......................................... ES-32
Stakeholder Feedback on Causes of Capacity Constraints.......................... ES-32 Assessment of the Impact of Capacity Constraints ...................................... ES-33
ES5 SERVICE QUALITY ISSUES .................................................................................. ES-34 Stakeholder Feedback on Service Quality.................................................... ES-34 Train Speed as an Indicator of Service Quality ............................................ ES-35 Variability in Average Speed by Train Type.................................................. ES-37
ES6 IMPLICATIONS FOR PROPOSED POLICY CHANGES ................................................. ES-38 ES7 CONCLUSIONS AND FUTURE RESEARCH DIRECTIONS............................................ ES-42
Captivity and Effective Competition.............................................................. ES-43 Service Quality ............................................................................................. ES-43 Capacity ....................................................................................................... ES-43 Cost Shifting ................................................................................................. ES-43 Fuel Surcharges ........................................................................................... ES-44 Issues Related to Class II and Class III Railroads........................................ ES-44 Critical Evaluation of Rail Demand Growth Projections................................ ES-44 Reduction in Railroad Network Access ........................................................ ES-44
Executive Summary
ii
LIST OF FIGURES
FIGURE ES-1 CLASS I PROPORTIONS OF U.S. RAILROAD MILES OF TRACK OWNED AND OPERATED 1987-2006.................................................................................... ES-9
FIGURE ES-2 CLASS I RATIO OF NET TON-MILES TO TOTAL TRACK MILES 1987-2006........ ES-10 FIGURE ES-3 R/VC AVERAGES BY ORIGIN COUNTY FOR WHEAT SHIPMENTS
2001-2006 CARLOAD WAYBILL SAMPLE ................................................................ ES-13 FIGURE ES-4 COUNTY-LEVEL EFFECTS OF MARKET STRUCTURE VARIABLES IN
WHEAT PRICING MODELS ON REAL REVENUE PER TON-MILE ................................. ES0-14 FIGURE ES-5 INDUSTRY-WIDE INDEXES CONSTRUCTED FROM CARLOAD WAYBILL
SAMPLE 1987 = 100............................................................................................ ES-15 FIGURE ES-6 RCAF-A, 1989-2008............................................................................... ES-16 FIGURE ES-7 MFP GROWTH DIFFERENTIAL: RAILROAD INDUSTRY V. PRIVATE BUSINESS
SECTOR.............................................................................................................. ES-18 FIGURE ES-8 CLASS I AVERAGE TOTAL COST, AVERAGE VARIABLE COST, AND AVERAGE
FIXED COST (YEAR 2000 DOLLARS) ...................................................................... ES-19 FIGURE ES-9 CLASS I INDUSTRY MARKUP RATIOS ........................................................... ES-20 FIGURE ES-10 CLASS I INDUSTRY RATIO OF AVERAGE RPTM TO AVERAGE TOTAL COST.... ES-21 FIGURE ES-11 RAILROAD INDUSTRY LERNER MARKUP INDEX............................................ ES-22 FIGURE ES-12 EARNINGS PER SHARE 1997-2006 ........................................................... ES-27 FIGURE ES-13 CAPITAL SPENDING/REVENUE 1997-2006 ................................................ ES-31 FIGURE ES-14 CHANGES IN AVERAGE SPEED BY RAILROAD AND TRAIN TYPE,
1999-2005......................................................................................................... ES-36 FIGURE ES-15 STYLIZED REPRESENTATION OF RAILROAD INTERCHANGE AND
TABLE ES-1 TON-MILES OF FREIGHT BY MODE.................................................................. ES-7 TABLE ES-2 RAIL SHIPMENTS BY COMMODITY GROUPING, 2007 ......................................... ES-7 TABLE ES-3 PERCENT OF TONS AND TON-MILES BY R/VC CATEGORY
2000-2001 V. 2005-2006 CARLOAD WAYBILL SAMPLE DATA.................................. ES-11 TABLE ES-4 CORRELATIONS OF ORIGIN COUNTY* R/VC WITH REVENUE PER TON-MILE
AND MARKET STRUCTURE FACTORS, 2001-2006 DATA, SELECTED COMMODITIES .... ES-12 TABLE ES-5 GROWTH IN RCAF-U COMPONENTS AVERAGE ANNUAL GROWTH IN PRICES,
1994Q1-2008Q2 ............................................................................................... ES-17 TABLE ES-6 MEDIAN ESTIMATED ADJUSTED MARGINAL COSTS AND LERNER
MARKUP INDEXES ................................................................................................ ES-23 TABLE ES-7 VARIABILITY IN AVERAGE TRAIN SPEED BY RAILROAD AND TRAIN TYPE ............ ES-38 TABLE ES-8 LIKELY ECONOMIC EFFECTS OF VARIOUS OPEN-ASSESS PROPOSALS ............. ES-39
Executive Summary ES-1
EXECUTIVE SUMMARY
A Study of Competition in the U.S. Freight Railroad Industry and Analysis of Proposals
that Might Enhance Competition
INTRODUCTION This report presents the findings of an independent study of the
competitive state of the U.S. freight railroad industry performed by the study team assembled by Christensen Associates and commissioned by the U.S. Surface Transportation Board (STB). In conducting this study, the Christensen Associates study team has received cooperation from the STB and numerous railroad industry stakeholders including railroads, various shipper group organizations, numerous individual shippers, government organizations, academics, and other stakeholders. The study team also assembled an Advisory Panel with representatives from a broad cross-section of industries, groups, and stakeholders. While valuable insights and assistance were obtained by the study team from these various groups, no individual, government agency, railroad, shipper, or any other industry stakeholder has influenced the findings of this study. The findings presented and conclusions reached in this report are the professional judgments and opinions of the Christensen Associates railroad study team.
The U.S. freight railroad industry has undergone a remarkable transformation since 1980 when Congress passed The Staggers Rail Act. In the decades preceding the passage of this seminal act, railroads suffered traffic losses that led to widespread insolvencies. The deregulation of the railroad industry ushered in increased market flexibility, competitive and differential rates for rail service, and a climate open to innovation. In the years following the passage of The Staggers Act, the railroad industry experienced dramatic reductions in costs and increased productivity, which yielded higher returns for carriers and lower inflation-adjusted rates for shippers. Thus both railroads and their customers benefited from regulatory reform.
The 2006 GAO Report Despite the benefits of deregulation, including improved financial
performance of railroads and constant dollar rate declines, the railroad industry’s stakeholders continue to be concerned over competition, captivity, rates, service performance, and financial viability. Largely due to Congressional concern over the appropriate balancing of railroad and
Executive Summary ES-2
shipper interests, and the continued viability and ability of the railroad industry to fulfill demands for its services, the U.S. Government Accountability Office (GAO) has issued several reports on the freight railroad industry since the passage of the Staggers Act:
Policymakers continue to believe that the federal government should provide a viable process to protect shippers against unreasonably high rates, as well as address competition issues, while still balancing the interests of both railroads and shippers. Over the past 10 years, significant consolidation has taken place in the freight railroad industry, while railroads—particularly Class I railroads—have seen their productivity and financial health improve. Railroad officials worry that any attempt to increase economic regulation will reduce carriers’ ability to earn sufficient revenues and limit future infrastructure investment. At the same time, a number of academic and government studies are predicting a significant increase in the demand for freight rail over the next 10 to 15 years.1
The 2006 GAO report noted that, after a long-term downward trend in railroad rates since passage of the Staggers Act, increases began to occur in the early 2000s:
Between 1985 and 2000, rail rates generally declined, but then increased slightly from 2001 through 2004. Although rates have declined since 1985, they have not done so uniformly, and rates for some commodities are significantly higher than rates for others. Several factors could have contributed to recent rate increases, including broad changes in the domestic and world economy, the emergence of a capacity constrained environment in which demand exceeds supply, and consolidation in the 1990s in the industry leading to changes in competition. Other costs, such as fuel surcharges, have also shifted to shippers, …2
1 Government Accountability Office, Freight Railroads: Industry Health Has Improved, but Concerns about Competition and Capacity Should Be Addressed, GAO-07-94, October 6, 2006, pp. 1-2. 2 Government Accountability Office, Freight Railroads: Industry Health Has Improved, but Concerns about Competition and Capacity Should Be Addressed, GAO-07-94, October 6, 2006, p. 3.
Executive Summary ES-3
The question posed by the GAO was whether the observed pattern in railroad rates was the reflection of economic market forces or “a possible abuse of market power:”
Some concerns about competition and captivity in the industry remain because traffic is concentrated in fewer railroads. It is difficult to determine precisely how many shippers are captive because available proxy measures can overstate or understate captivity. In addition, STB does not accurately collect railroad revenue data. Nevertheless, our analysis of available measures indicates that the extent of captivity appears to be dropping, but the percentage of industry traffic traveling at rates substantially over the statutory threshold for rate relief has increased. For example, the amount of traffic traveling at rates over 300 percent of the railroad’s variable cost increased from 4 percent in 1985 to 6 percent in 2004. Furthermore, some areas with access to one Class I railroad have higher percentages of traffic traveling at rates that exceed the statutory threshold for rate relief. These findings may reflect reasonable economic practices by the railroads in an environment of excess demand, or they may indicate a possible abuse of market power.3
The Current Study Based on these observations and concerns, the GAO recommended
that the STB conduct a rigorous analysis of the state of U.S. railroad competition:
We are recommending that STB conduct a rigorous analysis of the state of competition nationwide and, where appropriate, consider the range of actions available to address problems associated with the potential abuse of market power.4
3 Government Accountability Office, Freight Railroads: Industry Health Has Improved, but Concerns about Competition and Capacity Should Be Addressed, GAO-07-94, October 6, 2006, p. 3. 4 Government Accountability Office, Freight Railroads: Industry Health Has Improved, but Concerns about Competition and Capacity Should Be Addressed, GAO-07-94, October 6, 2006, pp. 3-4.
Executive Summary ES-4
In response to the GAO’s call for further study, the STB released an RFP for an analysis of the current state of competition in the U.S. railroad industry. A contract was subsequently awarded to the team assembled by Christensen Associates. As part of this study, we were directed to consider actions to address problems associated with the exercise of market power in the railroad industry.
Prior to initiating quantitative research, we conducted a qualitative research phase of our project. This qualitative phase primarily consisted of obtaining input from a broad spectrum of railroad industry stakeholders. The purpose of our qualitative research was to obtain railroad industry stakeholders’ input on the important issues facing the industry—e.g., competition, rates, capacity, service quality—and to ensure, to the extent possible,5 that these perspectives were considered in our study. We conducted our qualitative research in a manner that provided open access to any stakeholder who desired to provide input to us. We accomplished this through two approaches for soliciting input. First, we initiated contact with stakeholders in various targeted groups and conducted interviews in person and also over the phone. In addition to initiating contact with stakeholders, we established a website (www.lrca.com/railroadstudy) to provide a means by which any interested party could reach us. We obtained extensive stakeholder input that greatly assisted in the focus of our research efforts and also indicated areas where further investigation is warranted.
Our report is organized in three volumes: Volume 1 presents a description of the U.S. freight railroad industry. Volume 2 contains our quantitative analysis of industry competition, capacity, and service quality. Volume 3 presents our analysis of policy changes that others have proposed for the railroad industry.
Organization of this Executive Summary In our approach to analyzing the competitive state of the U.S.
freight railroad industry, we identified five fundamental questions. This Executive Summary reports the key findings of our study in relation to these questions:
• What is the current state of competition in the U.S. railroad industry?
• What are the current and near future capacity constraints in the U.S. railroad industry?
• How do competition and regulation in the railroad industry impact capacity investment?
5 Some of the issues raised by stakeholders were outside the scope of our study, while data limitations prevented us from thoroughly examining a few issues.
Executive Summary ES-5
• How do capacity constraints impact competition?
• How do competition, capacity constraints, and other factors influence the quality of service?
In focusing on these questions, our study also sheds light on whether the current situation reflects reasonable economic practices by the railroads. Addressing these questions also provides important input into our economic analysis of recent proposals for railroad industry policy changes. Our study finds that:
• Class I railroads’ rates (real revenue per ton-mile) were substantially above short-run marginal cost in 2006.
• Economies of density and fixed costs require railroad pricing above short-run marginal cost to achieve revenue sufficiency.
• For most years in the 1987 to 2006 period of our study, the Class I railroad industry does not appear to be earning above normal profit.
• The increase in railroad rates experienced in recent years is the result of declining productivity growth and increased costs rather than the increased exercise of market power.
• Railroads use differential pricing to recover their total costs.
• Different commodity groups face different markups of railroad rates over marginal costs.
• Within commodity groups, shippers with no or very limited transportation options tend to pay higher rates than shippers with the same shipment characteristics who enjoy more or better transportation alternatives.
• The ratio of revenue to URCS variable cost (R/VC) is weakly correlated with market structure factors that affect shipper “captivity,” and is not a reliable indicator of market dominance.
• Capacity “tightness” is primarily due to congestion at terminals or other specific network locations. Terminal congestion in the 2003-2005 period was linked to service performance declines during that time period.
• Current market circumstances imply that providing significant rate relief to certain groups of shippers will likely result in rate increases for other shippers or threaten railroad financial viability.
• Incremental policies such as reciprocal switching and terminal agreements have a greater likelihood of resolving shipper
Executive Summary ES-6
concerns via competitive response, and have a lower risk of leading to adverse changes in industry structure, costs, and operations.
• Some shippers will not benefit from efforts to enhance railroad competition, implying the necessity of continued regulatory oversight.
While the GAO posed the question of whether recent performance of the U.S. freight railroad industry is indicative of “a possible abuse of market power,” our analysis provides evidence on whether there has been a change in the exercise of market power by U.S. railroads. By definition, the setting of price above marginal cost is what economists consider to be an exercise of market power, but exercise does not imply abuse. To address the question of whether there has been an “abuse of market power” would require judgments as to the fairness of the distribution of value between the railroads and the shippers, and on the distribution of the overhead cost collection among the shippers. These judgments are policy questions and not resolvable through economic analysis alone. Instead, we have answered the economic questions of the extent to which recent railroad pricing behavior reflects changing cost conditions, and the extent to which it represents an increase in the overall exercise of market power. Furthermore, our analysis sheds light on how recent railroad pricing behavior has shifted the burden of overhead cost collection among the different sets of shippers.
ES1 CURRENT STATE OF COMPETITION IN U.S. FREIGHT RAILROAD INDUSTRY
Characteristics of U.S. Freight Railroad Traffic Since 1980, railroads have been gaining an increasing share of
U.S. freight shipments (see Table ES-1). According to data complied by the U.S. Department of Transportation, railroads accounted for about 27 percent of the ton-miles of U.S. freight moved in 1980. By 2005, the share of ton-miles attributed to railroads increased to about 38 percent.6
6 National Transportation Statistics 2008, U.S. Department of Transportation, Research and Innovative Technology Administration, Bureau of Transportation Statistics.
In terms of tons originated, coal represents, by far, the largest proportion of railroad shipments. Chemicals, farm products, nonmetallic minerals, and miscellaneous mixed shipments are also relatively large categories in terms of tons originated. Examining the proportions of railroad gross
7 National Transportation Statistics 2008, U.S. Department of Transportation, Research and Innovative Technology Administration, Bureau of Transportation Statistics. 8 Class I Railroad Statistics, Association of American Railroads, July 17, 2008.
Executive Summary ES-8
revenues by commodity group, coal is still the largest category but, reflecting its low-value, bulk commodity status, does not stand out as much from the other commodity groups in terms of revenue as it does in terms of tonnage. The miscellaneous mixed shipments category, which consists primarily of intermodal shipments, represented only 6.4 percent of 2007 tons originated but accounted for 14.4 percent of railroad revenues.9 This is a reflection of the high value of intermodal railroad services. Other categories that represent relatively large proportions of railroad revenues include chemicals, farm products, food, and motor vehicle equipment. While railroads play a key role in overall U.S. freight shipments, shippers of certain commodities are especially reliant on rail transportation. For example, the Association of American Railroads (AAR) reports that 70 percent of domestically produced automobiles,10 70 percent of coal delivered to power plants,11 and about 35 percent of the U.S. grain harvest all move by rail.12
Structure of U.S. Freight Railroad Industry Consolidations in the railroad industry have reduced the number of
Class I railroads from about forty around the time of the passage of the Staggers Act to the current seven.13 While the number of Class I railroads has declined, the total number of railroads has increased from about 490 in the mid-1980s to the current 559.14 The number of Class I railroad employees declined from over 450,000 in 1980 to 167,000 in 2007.15 Non-Class I employment has declined in proportion to Class I employment reductions so that the percent of industry employment by non-Class I railroads has remained at approximately ten percent.
Regional and shortline railroads own and/or operate an increasing proportion of the nation’s railroad infrastructure. Overall, both total miles of road owned and miles of road operated by all U.S. railroads have fallen between 1987 and 2006. However, both measures have fallen more sharply for Class I railroads than for all railroads in the U.S. Between 9 Class I Railroad Statistics, Association of American Railroads, July 17, 2008. 10 “The Economic Impact of America’s Freight Railroads,” Association of American Railroads, August 2008, p. 2. The percentage reported here does not include imported automobiles transported by railroad from ports on both coasts. 11 “Railroads and Coal,” Association of American Railroads, July 2008, p. 3. 12 “Railroads and Grain,” Association of American Railroads, July 2008, p. 5. 13 “The Effects of Rail Mergers on the Number of Class I Railroads and Shipper Captivity,” Association of American Railroads, August 2008, p. 1. 14 “Railroad Ten-Year Trends,” American Association of Railroads, Vol. 7, p. 10; and “Class I Railroad Statistics, 2007,” Association of American Railroads. 15 “Class I Railroad Statistics, 2007,” Association of American Railroads; “Railroad Ten-Year Trends,” Association of American Railroads, Vol. 7, p. 10.
Executive Summary ES-9
1987 and 2006, miles of track operated declined by 18.9 percent for Class I railroads versus a decline of 5.9 percent for all U.S. railroads. Similarly, miles of track owned declined by 26.8 percent for Class I railroads versus a decline of 20.9 percent for all U.S. railroads over this period.16 The proportions of total industry miles owned and miles operated by Class I railroads have fallen from over 80 percent of the industry totals in the 1980s to about 77 percent (owned) and 70 percent (operated) today, as the number of smaller railroads has increased significantly over this period. As Figure ES-1 shows, the decline has recently been greater for the Class I proportion of miles operated, reflecting spinoffs in the operation of Class I-owned trackage to other railroad classes.
FIGURE ES-1 CLASS I PROPORTIONS OF U.S. RAILROAD MILES OF TRACK OWNED AND OPERATED
1987-2006
60.0%
65.0%
70.0%
75.0%
80.0%
85.0%
1987
1989
1991
1993
1995
1997
1999
2001
2003
2005
% Operated % Owned
While total Class I miles of track have declined, usage of that track has intensified as Class I revenue ton-miles have grown continuously over the study time period. Between 1987 and 1999, Class I net ton-miles grew by 51.5 percent, compared to a 19.9 percent decline in total track miles. Between 1999 and 2006, Class I net ton-miles grew by 23.1 percent, compared to a 1.7 percent decline in total track miles.17
The increasingly intensive use of Class I track miles is illustrated in Figure ES-2, which charts the Class I ratio of net ton-miles to total track 16 “Railroad Ten-Year Trends,” American Association of Railroads, Vol. 24, p. 10; “Class I Railroad Statistics, 2007,” Association of American Railroads; and “Railroad Ten-Year Trends,” American Association of Railroads, Vol. 7, p. 10. The reported values do not include data for Canadian railroads with U.S. operations. 17 Net ton-mile data are from R-1 Annual Reports, Schedule 755, Line 114, Column B.
Executive Summary ES-10
miles. This increasingly intensive use of railroad networks results in lower per-unit costs—a reflection of economies of density.
FIGURE ES-2 CLASS I RATIO OF NET TON-MILES TO TOTAL TRACK MILES
1987-2006
0.500.700.901.101.301.501.701.902.102.302.50
1987
1988
1989
1990
1991
1992
1993
1994
1995
1996
1997
1998
1999
2000
2001
2002
2003
2004
2005
2006
Assessment of Shipper Captivity The analysis of shipper captivity in the 2006 GAO report includes
the computation of shares of shipments generating revenues in excess of 180 percent and 300 percent of URCS variable cost, and discussion of changes in those shares over time. GAO presented its analysis in the context of the statutory role played by the 180 percent revenue/variable cost (R/VC) threshold in triggering rate reviews, and the limited availability of data to properly measure or serve as proxies for shipper captivity:
Nevertheless, our analysis of available measures indicates that the extent of captivity appears to be dropping, but the percentage of industry traffic traveling at rates substantially over the statutory threshold for rate relief has increased. For example, the amount of traffic traveling at rates over 300 percent of the railroad’s variable cost increased from 4 percent in 1985 to 6 percent in 2004. Furthermore, some areas with access to one Class I railroad have higher percentages of traffic traveling at rates that exceed the statutory threshold for rate relief.18
18 Government Accountability Office, Freight Railroads: Industry Health Has Improved, but Concerns about Competition and Capacity Should Be Addressed, GAO-07-94, October 6, 2006, p. 3.
Executive Summary ES-11
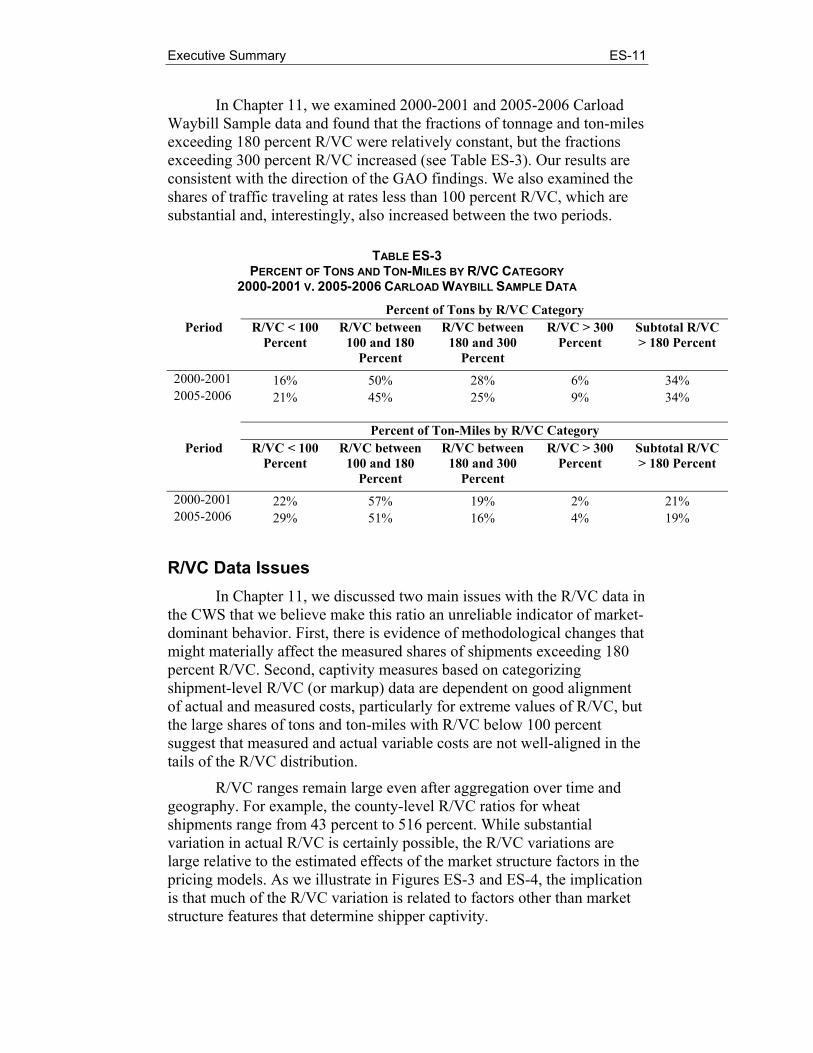
In Chapter 11, we examined 2000-2001 and 2005-2006 Carload Waybill Sample data and found that the fractions of tonnage and ton-miles exceeding 180 percent R/VC were relatively constant, but the fractions exceeding 300 percent R/VC increased (see Table ES-3). Our results are consistent with the direction of the GAO findings. We also examined the shares of traffic traveling at rates less than 100 percent R/VC, which are substantial and, interestingly, also increased between the two periods.
TABLE ES-3 PERCENT OF TONS AND TON-MILES BY R/VC CATEGORY
2000-2001 V. 2005-2006 CARLOAD WAYBILL SAMPLE DATA
Percent of Tons by R/VC Category Period R/VC < 100
Percent R/VC between
100 and 180 Percent
R/VC between 180 and 300
Percent
R/VC > 300 Percent
Subtotal R/VC > 180 Percent
2000-2001 16% 50% 28% 6% 34% 2005-2006 21% 45% 25% 9% 34% Percent of Ton-Miles by R/VC Category
R/VC Data Issues In Chapter 11, we discussed two main issues with the R/VC data in
the CWS that we believe make this ratio an unreliable indicator of market-dominant behavior. First, there is evidence of methodological changes that might materially affect the measured shares of shipments exceeding 180 percent R/VC. Second, captivity measures based on categorizing shipment-level R/VC (or markup) data are dependent on good alignment of actual and measured costs, particularly for extreme values of R/VC, but the large shares of tons and ton-miles with R/VC below 100 percent suggest that measured and actual variable costs are not well-aligned in the tails of the R/VC distribution.
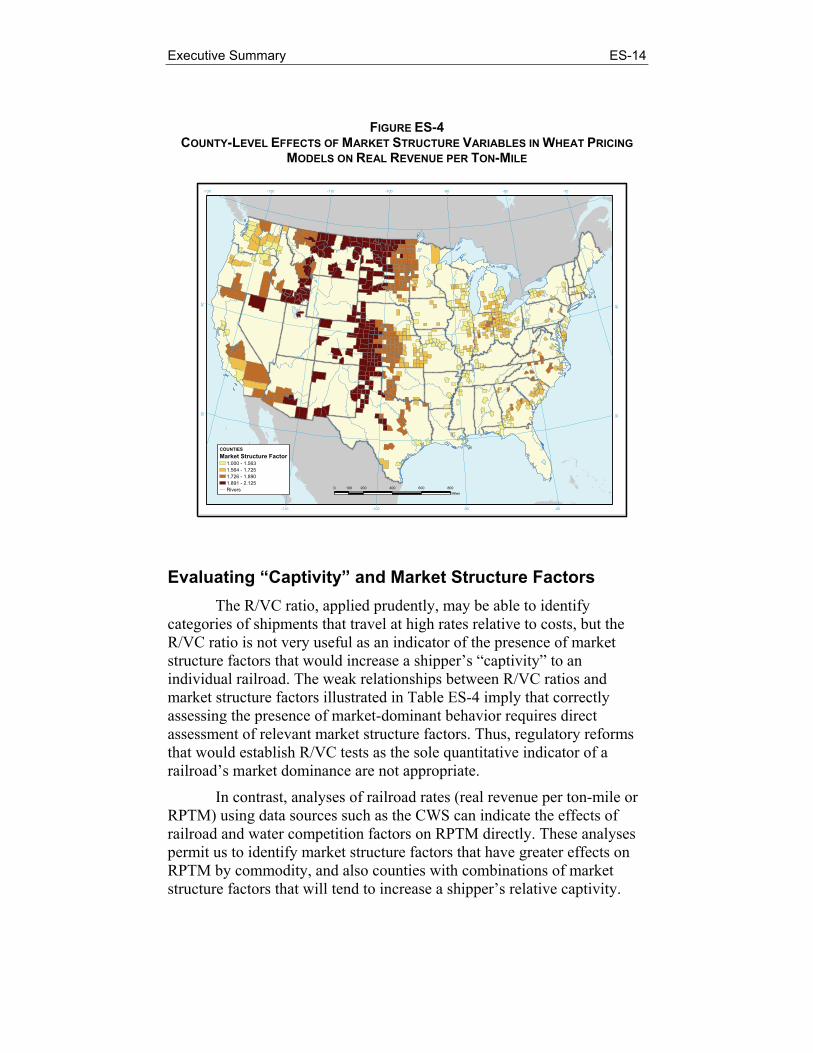
R/VC ranges remain large even after aggregation over time and geography. For example, the county-level R/VC ratios for wheat shipments range from 43 percent to 516 percent. While substantial variation in actual R/VC is certainly possible, the R/VC variations are large relative to the estimated effects of the market structure factors in the pricing models. As we illustrate in Figures ES-3 and ES-4, the implication is that much of the R/VC variation is related to factors other than market structure features that determine shipper captivity.
Executive Summary ES-12
R/VC and Market Structure Factors From an economic perspective, “relative captivity” arises for
shippers whose next best alternatives do not effectively constrain railroad rates. The effects of captivity may be continuous and have no definite relationship to markup thresholds. For instance, a shipper may pay a rail rate under the 180 percent R/VC threshold and nevertheless experience a degree of “captivity” relative to other shippers with similar cost characteristics because other shippers have better access to intramodal or intermodal competition that results in lower rail rates. Conceptually, more appropriate measures of captivity should focus on the effects of the transportation market structure on rail rates—and, by extension, markups—rather than on markups as indicators, per se, of market-dominant behavior. In this regard, the GAO was justified in examining additional measures using information on market structure, such as rates and R/VC in areas without Class I railroad competition.19
Furthermore, the R/VC ratio does not appear to perform well as a proxy for conceptually more appropriate market structure measures. We find that R/VC is weakly related to measures of railroad and water competition. Table ES-4 shows correlations between county-level R/VC ratios and market structure factors for selected commodities.
TABLE ES-4 CORRELATIONS OF ORIGIN COUNTY* R/VC WITH REVENUE PER TON-MILE AND MARKET STRUCTURE FACTORS, 2001-2006 DATA, SELECTED COMMODITIES
As reported in Chapter 12, our coal pricing models find evidence of strong competitive effects from railroad competition at the destination counties, but the correlation between county-level R/VC and our measure of destination competition is only -0.13.
19 Government Accountability Office, Freight Railroads: Industry Health Has Improved, but Concerns about Competition and Capacity Should Be Addressed, GAO-07-94, October 6, 2006, p. 36.
Executive Summary ES-13
Using wheat as an example, the correlation between R/VC and the distance to water at origin in Table ES-4 is 0.21. Comparing Figures ES-3 and ES-4 reveals the relatively weak correlation. Figure ES-3 shows relatively high R/VC ratios in some areas implicated in wheat shippers’ “captivity” complaints—notably, the far northern Plains—but not in other areas well-removed from water alternatives such as western Kansas. Figure ES-3 also shows high R/VC ratios in Pacific Northwest counties and other areas that would be expected to have better modal alternatives. The pricing models for wheat imply a strong effect of distance from the origin county to water transportation on wheat rates; that effect dominates the market structure effect as seen in Figure ES-4. These results are typical of the weak relationships between R/VC and market structure measures observed for other commodities.
FIGURE ES-3 R/VC AVERAGES BY ORIGIN COUNTY FOR WHEAT SHIPMENTS
Evaluating “Captivity” and Market Structure Factors The R/VC ratio, applied prudently, may be able to identify
categories of shipments that travel at high rates relative to costs, but the R/VC ratio is not very useful as an indicator of the presence of market structure factors that would increase a shipper’s “captivity” to an individual railroad. The weak relationships between R/VC ratios and market structure factors illustrated in Table ES-4 imply that correctly assessing the presence of market-dominant behavior requires direct assessment of relevant market structure factors. Thus, regulatory reforms that would establish R/VC tests as the sole quantitative indicator of a railroad’s market dominance are not appropriate.
In contrast, analyses of railroad rates (real revenue per ton-mile or RPTM) using data sources such as the CWS can indicate the effects of railroad and water competition factors on RPTM directly. These analyses permit us to identify market structure factors that have greater effects on RPTM by commodity, and also counties with combinations of market structure factors that will tend to increase a shipper’s relative captivity.
Executive Summary ES-15
Trends in Rates While overall railroad prices were fairly stable-to-declining for a
long period of time in the post-Staggers Act period, rates have increased substantially in the last few years. Figure ES-5 shows industry-wide rate indexes for the period 1987 through 2006. In addition to the industry-wide index constructed by the GAO, and the U.S. Bureau of Labor Statistics’ Producer Price Index, we constructed two rate indexes from information contained in the Carload Waybill Sample. As described in Chapter 8, these two indexes are designed to address some of the conceptual weaknesses that have previously been attributed to the GAO index and the Producer Price Index. Because the GAO noted that there had been a substantial increase in miscellaneous charges in recent years, which may reflect fuel surcharge billings, we constructed one index based on freight revenues reported in the Carload Waybill Sample (“Freight Rate”), and a second index based on total revenue (including miscellaneous charges – “Freight/Misc”). The indexes that we constructed showed very little overall price change between 1987 and 2004, but these rate indexes showed increases exceeding seven percent per year (in nominal dollars) in 2005 and 2006. The four reported rate indexes represent overall trends for the railroad industry, but do not reflect significant differences that exist among the rates paid by different commodities. Chapter 8 (among several other chapters in Volume 2) provides more detail on rate changes by commodity.
FIGURE ES-5 INDUSTRY-WIDE INDEXES CONSTRUCTED FROM CARLOAD WAYBILL SAMPLE
Trends in Input Prices and Productivity As illustrated in Figure ES-5 above, since the early 2000s, rates
generally began to go up, creating questions about the exercise of market power in the increasingly concentrated railroad industry.20 Much of the observed increase in rail rates can be explained by examining railroad industry input prices and productivity growth.
The STB’s rail cost adjustment factor, unadjusted for productivity gains (RCAF-U) represents trends in railroad input prices. It is based on the All-Inclusive Index for Class I railroads, maintained by the Association of American Railroads (AAR). The All-Inclusive Index measures price changes for the major components of the railroad industry’s operating expenses—labor, fuel, materials and supplies, equipment rents, depreciation, interest, and other expenses. The second element of the STB’s RCAF methodology is the productivity adjustment factor (PAF), which represents trends in output per unit of input. The final element of this methodology is the productivity-adjusted rail cost adjustment factor (RCAF-A), which is obtained by dividing the RCAF-U by the PAF. By construction, RCAF-A measures trends in the railroad industry’s unit costs, as it represents the difference between input price growth and productivity growth.
Figure ES-6 shows the quarterly RCAF-A from the Quarter 1 of 1989 through the Quarter 2 of 2008.
20 For example, see Government Accountability Office, Freight Railroads Industry Health Has Improved, but Concerns about Competition and Capacity Should Be Addressed, GAO-07-94, October 6, 2006, pp. 11-15.
Executive Summary ES-17
The RCAF-A series illustrates the net impact of input price increases and productivity increases on the railroad industry’s unit costs. As detailed in Chapter 8, in recent years railroad input price growth has generally increased across most categories (not only fuel) and, at the same time, industry productivity growth has slowed. Thus, overall railroad unit costs, measured by RCAF-A have gone up in recent years after reaching a minimum in Quarter 3 of 2002.
Table ES-5 provides details on the sources of railroad input price growth. It shows the average annual rates of nominal input price growth for labor, fuel, materials and services, equipment rents, depreciation, interest, and other expenses between Quarter 1 of 1994 (the first instance RCAF-U component detail was available) and Quarter 2 of 2008. This table also shows the average annual rates of input price growth for two sub-periods, Quarter 1 of 1994 to Quarter 3 of 2002 (when RCAF-A reached a minimum) and Quarter 3 of 2002 to Quarter 2 of 2008. The table illustrates that the increase in fuel costs has been much greater in the second sub-period. However, with the exception of interest (which has only a cost weight of 2.7 percent in the 2008 RCAF-U), all other railroad input prices grew faster in the second sub-period than in the first sub-period.
The productivity trends in the STB’s PAF measure generally follow railroad industry productivity trends measured by the U.S. Bureau of Labor Statistics (BLS). The BLS maintains a multifactor productivity (MFP) index for the railroad industry, which extends back to 1959 (PAF is available only back to 1989). The MFP index for railroads shows that while productivity increased during the pre-Staggers era, there was a substantial increase in railroad productivity growth during the 1980s and into the 1990s. Beginning in the 1990s, the rate of productivity growth began to decrease (i.e., productivity growth was less rapid) ,to the point where productivity growth between 2003 and 2006 was below that achieved during the pre-Staggers era. Figure ES-7 shows the average
Executive Summary ES-18
differential between railroad productivity growth and the productivity growth in the private business sector of the U.S. economy by decade. Railroad productivity growth was much more rapid than the productivity growth in the U.S. private business sector up until 2000, but since 2000 the railroad industry and the U.S. private business sector have had very similar rates of productivity growth.
FIGURE ES-7 MFP GROWTH DIFFERENTIAL: RAILROAD INDUSTRY V. PRIVATE BUSINESS SECTOR
0.0%
0.5%
1.0%
1.5%
2.0%
2.5%
3.0%
3.5%
4.0%
4.5%
5.0%
1960-1970 1970-1980 1980-1990 1990-2000 2000-2006
Both the STB and BLS measures of the railroad industry’s productivity confirm a slowdown in industry productivity growth in this decade. One effect of this slowing productivity growth is a diminished ability of railroads to absorb increases in their input prices in recent years.
Trends in Economic Costs Figure ES-8 provides information in constant dollars on Class I
annual average total cost of shipping a ton-mile (ATC), as well as its components, average variable cost (AVC) and average fixed cost (AFC), based on R-1 data. With the exception of 1991, ATC and AVC declined over the 1987-1996 period. ATC and AVC increased slightly between 1997 and 2000, and then decreased slightly between 2001 and 2003. ATC then increased in 2004 and 2005, but declined in 2006. Figure ES-8 shows that the 2006 ATC value is well below its 1987 level. AVC increased slightly over the 2004-2006 period. AFC decreased slightly through 1994, trended upward during the 1995-1997 period, and then gradually declined through 2003. More recently, AFC increased substantially in 2004 and 2005, as is consistent with the explanation of major road enhancements occurring over that period.21
21 AFC decreased in 2006 to approximately its 2004 level..
Executive Summary ES-19
FIGURE ES-8 CLASS I AVERAGE TOTAL COST, AVERAGE VARIABLE COST, AND
ATC AVC AFC Figure ES-9 presents three different markup ratios for the Class I
railroad industry. The top series shows the ratio of the average revenue per ton-mile to marginal cost (RPTM/MC). This ratio reflects the extent to which market power is being exercised in the railroad industry. By definition, the setting of price above marginal cost is the exercise of market power, but exercise does not imply abuse. The industry gained market power (i.e., increasing RPTM/MC ratio) primarily during the periods of marginal cost decreases, while it ceded some of that market power during the periods of marginal cost increases. The industry-wide RPTM/MC ratio peaked at 217 percent in 1994 and has ranged in recent years between 150 and 170 percent.
The second series in Figure ES-9 displays the revenue per ton-mile to average variable cost ratio (RPTM/AVC). This ratio is conceptually equivalent to the revenue to variable cost ratio (R/VC) that is a threshold measure of market dominance in captive shipper rate cases. The RPTM/AVC ratio has gradually increased from 117 percent to 137 percent over the twenty-year study period. Interestingly, we note that the industry-wide RPTM/AVC measure remains well below the 180 percent R/VC threshold used by the STB in captive shipper rate cases. We further note that the RPTM/AVC ratio does not track very well with the market power indicator of RPTM/MC. This lack of correspondence may be indicative of the weakness of the R/VC measure as an indicator of market power abuse.22
The third series in Figure ES-9 shows the revenue per ton-mile to average total cost ratio (RPTM/ATC). This graph conveys the information about revenue sufficiency for the overall industry. Values of the RPTM/ATC ratio greater than or equal to 100 percent indicate that revenues are greater than or equal to total costs, while values less than 100 percent imply that revenues are insufficient to cover total costs. The graph, based on R-1 data, shows that the industry has remained close to being revenue adequate for most years in our study, but more often than not it has fallen short.
22 We are not suggesting that the aggregate average rate to the aggregate average variable cost ratio presented in Figure ES-9 is the appropriate R/VC measure for rate cases. The R/VC measure used in rate cases is market-, shipper-, railroad-, and route-specific. We further note that the R/VC measure is based on the Uniform Rail Costing System (URCS), while our RPTM/AVC ratio is based on R-1 data.
Executive Summary ES-21
Figure ES-10 changes the vertical scale to focus on the RPTM/ATC ratio for the Class I railroad industry. As noted above, this ratio is a measure of industry revenue sufficiency (indicated by RPTM/ATC = 100 percent). It can be seen that the industry has flirted with revenue sufficiency for a number of years, but has only achieved or surpassed it a few times in the mid-1990s and in 2006 (1993 = 100.0%, 1994 = 101.7%, 1996 = 100.0%, 2006 =104.1%).23 Furthermore, the 2006 value of RPTM/ATC was preceded by a sizeable drop in 2004, which was the RPTM/ATC ratio’s lowest point since 1991.
FIGURE ES-10 CLASS I INDUSTRY RATIO OF AVERAGE RPTM TO AVERAGE TOTAL COST
75%
80%
85%
90%
95%
100%
105%
110%
1987
1988
1989
1990
1991
1992
1993
1994
1995
1996
1997
1998
1999
2000
2001
2002
2003
2004
2005
2006
RPTM/ATC
Figure ES-11 displays the Lerner Markup Index (LMI) for the Class I railroad industry.24 It shows that between 1987 and 1994, pricing power steadily increased. However, the industry was still below revenue sufficiency during most of this period until 1994 (see Figure ES-10). Thus, 23 We note that the measures of costs that we develop from the R-1 data do not include any current assets, such as cash. Furthermore, our calculations are based on some variables defined for the econometric analysis undertaken in Chapter 9 and may not conform to a conventional financial analysis. Thus, the ratio of revenue to cost presented in Figure ES-10 is revealing, but should not be viewed as the definitive indicator of revenue sufficiency. Also, as reported in Chapter 10, when the railroads are examined individually, we find that BNSF and NS each had thirteen of twenty years where the R-1 reported revenues matched or exceeded costs, UP had eight of twenty years with revenues greater than or equal to costs, and CSX had only three revenue-sufficient years in the time frame of our analysis.
24 The Lerner Markup Index is defined as the ratio of the difference between price and marginal cost to the price, which in this case is equal to (RPTM − MC) / RPTM. As discussed in Chapter 10, the Lerner Markup Index is a measure of market power. The Lerner Markup Index is also known as the Lerner Index or the Lerner Market Power Index, and it is sometimes abbreviated as LMI in this report and elsewhere in the literature.
Executive Summary ES-22
the rapidly-increasing LMI does not indicate that market power has been exercised by railroads with resulting excess profits, but rather indicates a movement toward revenue sufficiency. As detailed in Chapter 10, from 1995 to 1999, the LMI generally decreased with increasing marginal costs. Between 2000 and 2003, there was some recovery of the industry’s pricing power, largely resulting from declining marginal costs as documented in Chapter 10. Again, however, viewing these results in the context of revenue sufficiency, this run-up in the LMI does not correspond to railroads achieving excessive levels of profit. Since 2003, the LMI has declined back to its 1999 level as percentage increases in marginal cost have outpaced percentage increases in price.
FIGURE ES-11 RAILROAD INDUSTRY LERNER MARKUP INDEX
Economies of Density and Differential Pricing by Commodity
Economies of density arise when the average cost of serving customers decreases as the volume of business increases over a network. When economies of density are present, marginal cost pricing does not produce enough revenue to cover a firm’s total cost, and alternative pricing or funding mechanisms must be found. Differential pricing (i.e., charging different price markups over marginal costs to different customers or customer classes) is recognized in the economic literature as a pricing method that might be used to achieve revenue sufficiency in the presence of economies of density.
As is the case with other network industries, the railroad industry engages in differential pricing, where different customer groups face different levels of price markups over marginal costs. Since the passage of the Staggers Act, freight rail transportation rates have been largely
Executive Summary ES-23
deregulated, as discussed in Chapter 20, with the Surface Transportation Board providing a regulatory backstop for captive shippers. As the quotation below illustrates, differential pricing is acknowledged by policy as a method by which railroads achieve revenue adequacy, with the STB determining whether the degree of differential pricing is reasonable if a rate is challenged.
When there is a challenge to the reasonableness of a rail rate charged for captive traffic, [the STB’s] regulatory task is to determine whether the degree of differential pricing--i.e., the amount by which the revenues derived from the traffic at issue exceed the long-run marginal cost (LRMC) of handling the traffic—is reasonable.25
Table ES-6 shows the median values of estimated adjusted marginal costs and Lerner Markup Indexes by commodity for the 2001-2003 and 2004-2006 periods.
TABLE ES-6 MEDIAN ESTIMATED ADJUSTED MARGINAL COSTS AND LERNER MARKUP INDEXES
25 Rate Guidelines—Non-Coal Proceedings, Ex Parte No. 347 (Sub-No. 2) (STB served December 31, 1996), p. 4.
Executive Summary ES-24
The marginal cost and markup estimates presented in Table ES-6 provide an indication of whether recent rate increases have been mainly cost-driven or markup-driven. With respect to marginal costs, it shows that despite the industry-wide increase in marginal costs in 2004-2006 (see Chapter 10), different patterns appear across the listed commodities. Some shippers apparently were able to avoid, to some extent, the “generic”26 increases in costs by adopting lower-cost shipment characteristics. For example, we observe that average car loadings and length of haul increased materially for coal shipments between the 2001-2003 and 2004-2006 periods, partly due to the increasing share of Powder River Basin coal in total coal shipments. These cost-saving changes in shipment characteristics for coal helped to offset the generic increase in marginal cost per ton-mile in the latter period. Thus, the estimated adjusted marginal costs for coal declined slightly between the two periods; the adjusted marginal cost would have been higher in the latter period without the cost-reducing changes in coal shipment characteristics. However, the data presented in Table ES-6 do not reflect any adjustment costs that coal shippers (or other shippers for that matter) may have incurred in adopting lower-cost shipment characteristics. In contrast, shipments of nonmetallic minerals and primary metal products did not exhibit substantial cost-saving changes in their tons per car and length-of-haul characteristics between the two periods; with little offset from shipment-characteristic changes, the estimated marginal costs for these two commodity groups increased in the latter period.
We believe that our negative LMI estimates for intermodal shipments are anomalies resulting from data limitations for intermodal shipment characteristics in the CWS dataset. Intermodal shipments have some low-cost characteristics that are not included in the CWS dataset and therefore cannot be incorporated in our estimated pricing models and adjusted marginal cost calculations. Intermodal shipments are billed and recorded as single-carload shipments, but tend to travel long distances as a unit, thereby avoiding substantial switching and classification costs typical of non-intermodal, single-carload shipments. Additional data on intermodal shipments, including service characteristics, would produce more accurate estimates of the actual markups for intermodal shipments. Since intermodal shipments represent a large share of the railroad industry’s revenues, improved data collection on these shipments is highly desirable. We expect that with better information on intermodal shipments’ actual costs our pricing models would yield positive estimated markups for intermodal shipments, but still relatively low markups compared to other commodities.
The estimated LMIs are declining from 2001-2003 to 2004-2006 for 12 of the 16 commodity groups. Three of the LMI increases are for 26 We use the term “generic” to refer to industry-wide increases across commodities.
Executive Summary ES-25
grains that already had high estimated markups. It should be noted that the relatively constant or declining LMIs for commodities other than grains and coal do not reflect constant shipment characteristics. In our qualitative research phase, we heard from shippers (particularly coal shippers) who noted that long-term, low-priced rail contracts had expired in this time frame and were replaced by higher-priced contracts or tariff rates.27 Such changes increase incentives for shippers to form shipments with lower-cost characteristics to partly offset the less favorable terms. We observe material shifts to lower-cost characteristics for various commodities in the CWS data, suggesting that shippers as a whole have some ability to substitute less costly shipment characteristics. However, shippers who are unable to adjust their shipping practices towards lower-cost characteristics may face substantial rate increases in periods of increasing industry costs.
From our analysis of particular commodity groups, we find generally expected effects on rail rates from increasing railroad competition at the origin and from increasing the distance from the origin to the nearest available water transportation. That is, rates generally tend to be lower given increased competition from other railroads or from increased proximity to water transportation alternatives at the origin, and higher for shippers with more limited railroad and water options at the origin. However, the existence of competitive responses is double-edged. Such responses illustrate the extent to which shippers who lack railroad or intermodal alternatives are at least relatively “captive” and pay higher rates (which may or may not exceed quantitative markup thresholds for market-dominance tests) for shipments with the same cost characteristics as those of more favorably situated shippers. Furthermore, in situations where other modes of transportation, such as water (and not potential railroad competition), provide the effective constraint on rail rates, policies to enhance railroad competition will not benefit captive shippers.
The result that shippers with fewer transportation alternatives pay higher rates is not unexpected in light of our findings from the industry-wide variable cost model of Chapter 9 and the constrained market-dominance model of Chapter 11. Railroads’ economies of density imply that they must implement positive markups over marginal cost per ton-mile, on average, in order to cover their total variable and “quasi-fixed” costs. Employing such local market power as is available is one means by which railroads achieve “revenue adequacy.”
From Chapters 11 through 15, our results with respect to a single railroad serving the origin county indicate that rail rates are commonly higher than they would be in the presence of even very limited railroad competition. Railroads appear to exercise some degree of local market
27 Long-term contracts may contribute to the stickiness of rates to the extent that they do not allow for the immediate pass-through of railroad cost increases to shippers.
Executive Summary ES-26
power where possible, but are tempered by the prospect that large markups may elicit regulatory attention if not direct intervention. That is, monopoly railroads may effectively cede some market power to avoid regulatory scrutiny.
Financial Viability By nearly all measures, the performance of the railroad industry
has improved dramatically since the passage of the Staggers Act. The 2006 GAO report notes that “[t]here is widespread consensus that the freight rail industry had benefited from the Staggers Rail Act,” and that “[f]reight railroads’ improved financial health is illustrated by a general increase in return on investment since 1980, ...”28
The results of our econometric analysis of the railroad industry’s revenue sufficiency are generally consistent with the benchmarking of railroad financial performance we performed in Chapter 8. We examined the railroad industry’s earnings relative to the STB’s determination of the industry’s cost of equity and also relative to the earnings of benchmark industries. Regarding the comparison to the STB’s determination of the cost of equity, we note that there was controversy surrounding the CAPM methodology recently adopted by the STB for determining a railroad’s cost of equity.29 Recognizing this controversy, a comparison of return on shareholders’ equity for railroads to the STB’s CAPM measure of the cost of equity for railroads, shows returns in excess of the cost of equity from 2000 through 2005 (with variation by individual railroad). However, using the STB’s previous DCF method shows that railroads did not earn their cost of capital over the period of analysis (1997 to 2005). Given the methodological controversies and the divergence of these results, our assessment is that it is difficult to draw conclusions about whether the railroad industry has generated excessive profits, particularly when earlier observations using either the DCF or the CAPM methodology had shown the opposite result.
Although the railroad industry’s earnings have increased in recent years, they do not appear to be excessive from a financial market perspective. Among the financial metrics we examined, one commonly cited financial measure is earnings per share (EPS). We found that over our analysis period, 1997 to 2006, there were many similarities among the
28 Government Accountability Office, Freight Railroads Industry Health Has Improved, but Concerns about Competition and Capacity Should Be Addressed, GAO-07-94, October 6, 2006, p. 9. We provide a more complete discussion of the railroad industry’s financial performance in Chapter 8. 29 For example, see Petition of the Association of American Railroads to Institute a Rulemaking Proceeding to Adopt a Replacement Cost Methodology to Determine Railroad Revenue Adequacy, May 1, 2008.
Executive Summary ES-27
financial performances of the railroad industry, the electric utilities industry, and the S&P 500 composite. Figure ES-12 shows that, in the last few years, the upward trend in the railroad industry’s EPS is somewhat greater than the trend shown for the S&P 500 composite.30
ES2 CURRENT AND NEAR-FUTURE CAPACITY CONSTRAINTS A railroad’s capacity can be generally thought of as anything that
affects a railroad’s ability to transport shipments (in a given amount of time) over its network. Thus, capacity is analogous to the factors affecting throughput in a communications or data network. From a physical inputs perspective, factors that affect a railroad’s ability to transport shipments generally depend on the amount of capital (e.g., way and structures, railcars, locomotives, and signaling systems) and labor of various skill levels employed by the railroad. The amount of effective capacity available to provide services from a given quantity of production inputs (i.e., productivity) will be affected by factors such as technological innovations (often embodied in capital), work rules and other regulations, railroad operating practices, and learning by doing. The railroad’s ability to adjust capacity depends on its ability to adjust these various types of capital and labor inputs as well as other attributes, with some more easily adjusted than others.
A very important influence on a railroad’s capacity is the existence of congestion at points in its network. In fact, while other measures of capacity along a given route may indicate sufficient capacity to meet 30 The electric utilities and railroad industries showed very similar EPS growth between 1997 and 2004.
Executive Summary ES-28
demand, congestion at terminals, ports, highly congested urban areas, or other specific network locations is often a binding constraint on the utilization of route or network capacity.31 Moreover, congestion at these localized points often affects network-wide performance. This is similar to the effects of blocking or congestion in other types of networks. For example, congestion at specific points in communications and data networks caused by capacity limits in switches or routers creates a restriction in network throughput despite the virtually unlimited capacity of fiber optic cable.
In Chapter 16 we conclude that, from numerous perspectives, there currently do not appear to be global or network-wide rail capacity constraints. Rather, as often occurs in network industries, congestion at various points or corridors in railroad networks appears to be the major culprit in capacity-related performance issues over the last ten years.32 From a network-wide perspective, as discussed above, Class I total track mileage has stabilized over the last ten years, and the usage of track has become more intense as ton-miles per mile of track has grown continuously. Other studies have found that rail corridors are generally not constrained and our econometric results indicate that, in the aggregate, excess way and structures capacity exists. However, while such results can eliminate potential reasons for network congestion, congestion at terminals or other specific network locations is often a binding constraint on the utilization of route capacity or network-wide capacity. For example, we found increases in terminal congestion (with each Class I railroad having specific terminals that were particularly affected) in the 2003-2005 period were linked to service performance issues during that time period.
In September of 2007, Cambridge Systematics published a study sponsored by the Association of American Railroads on railroad infrastructure needs.33 This study shows few current problems with available freight railroad infrastructure capacity as 88 percent of corridor mileage is below capacity, and less than one percent is above capacity. Our Class I industry variable cost function results from Chapter 9 (and also reported in Chapter 16) show that the industry as a whole still has an excess amount of way and structures capital. These results are consistent with the conclusion reached by a number of economic researchers that the railroad industry still has a considerable amount of overall excess
31 James McClellan, “Railroad Capacity Issues,” in Research to Enhance Rail Network Performance, Transportation Research Board, 2007, p. 32. 32 The investigation of railroad network congestion is limited, to some extent, by data availability. As we indicate below, Burton has developed a promising approach to evaluate the need for additional investment at particular network locations. 33 Cambridge Systematics, National Rail Freight Infrastructure Capacity and Investment Study, prepared for the Association of American Railroads, September 2007.
Executive Summary ES-29
capacity,34 and the Cambridge Systematics study that concludes there presently is more than adequate capacity on most railroad network corridors. It is important to note, however, that these studies do not imply or conclude that there are no localized capacity shortages or choke points on individual segments of a railroad’s network.
The result that railroads do not suffer from an overall capacity shortage (despite localized constraints) is not surprising given the “lumpiness” of most railroad capital investments. As noted in Chapter 3, network industries, including the railroad industry, often are capital-intensive and need to make capital investments in large increments. Furthermore, once these investments are made the capital is either costly to remove or its resale value is small. For these reasons, the amount of capital being used at any one time will not necessarily be at its optimal level, resulting in either an excess or shortage of capacity.
Regarding congestion at localized points in railroad networks, we examined the terminal dwell time data in the Railroad Performance Measures (RPM) dataset.35 The RPM data indicate that, while each railroad has a somewhat unique pattern, one similarity that stands out is a general increase in terminal dwell times in the 2003-2004 period, followed by a decline in dwell times in 2005. The general increase in terminal dwell times during the mid-2000s indicates greater congestion at particular points in the railroad networks. Moreover, individual terminals differed considerably in the variability of their dwell times, suggesting that those terminals with the longest dwell times and largest variability might be affected by capacity constraints. Other descriptive measures indicate that the late 1990s and early 2000s witnessed declines in the railcar fleet, offset by greater railcar capacity, and increases in locomotive units and horsepower.
A recent study by the Rand Corporation noted that, in order to determine capacity needs at particular points of the network, much more
34 For example, see Ann F. Friedlaender, Ernst R. Berndt, Judy Shaw-Er Wang Chiang, Mark Showalter, and Christopher A. Vellturo, “Rail Costs and Capital Adjustments in a Quasi-Regulated Environment,” Journal of Transport Economics and Policy, May 1993, pp. 131-152; and John D. Bitzan and Theodore Keeler, “Economies of Density and Regulatory Change in the U.S. Railroad Freight Industry,” Journal of Law and Economics, February 2007, pp. 157-179.
35 Association of American Railroads, at http://www.railroadpm.org/Definitions.aspx: Terminal Dwell is the average time a car resides at the specified terminal location expressed in hours. The measurement begins with a customer release, received interchange, or train arrival event and ends with a customer placement (actual or constructive), delivered or offered in interchange, or train departure event. Cars that move through a terminal on a run-through train are excluded, as are stored, bad ordered, and maintenance of way cars.
Chapter 16 notes some limitations of the RPM terminal dwell time data.
Executive Summary ES-30
detailed information on the network is required than what is currently publicly available.36 Burton developed a promising approach to evaluate the need for and cost of additional railroad capacity at particular points of the railroad network.37 His approach is based on a statistical analysis of railroad traffic levels on particular route segments and the characteristics of those route segments. Using a cross-section of route segments, he developed an econometric model that can be used to predict the available capacity on different network segments based on observed traffic data.
Regarding future capacity constraints, we concluded that recent increases in railroad capital spending, combined with a relatively weak economy, indicate that any capacity tightness that may have existed at the beginning of this decade has likely loosened in recent years. Thus, with the caveat that congestion issues are likely to continue to exist at localized points and cause service performance issues, near-term system wide railroad capacity constraints are not likely to be a major issue. Regarding the longer-term forecasts of capacity constraints, we concluded that forecasting capacity needs thirty years into the future (as is done in the Cambridge Systematics study) is difficult, at best, and is very sensitive to projections of future economic activity. Thus, it is our assessment that one must treat these forecasts of future capacity needs as tentative, at best, particularly given the current economic climate the U.S.
ES3 CAPACITY INVESTMENT As discussed above, our analysis of railroad capacity indicates that
while there is currently no systematic shortage of capacity in the railroad industry, there is evidence of localized capacity problems at various points in the rail network. Although the Cambridge Systematics study concluded that infrastructure investment of $148 billion (in 2007 dollars) would be needed to keep pace with projected economic growth in the United States along with the U.S. Department of Transportation’s forecasts for railroad transportation demand, this study also showed that there currently are very few capacity problems in the rail network. Furthermore, this study’s projected infrastructure investment requirement was based on a thirty-year forecast of railroad transportation demand. Over the thirty-year forecast period, if actual demand for freight railroad transportation matches the forecast, and if there are no additions to railroad capacity during the intervening time period, 30 percent of rail corridor mileage will be above capacity, while only 44 percent will be below capacity. Forecasting rail capacity needs thirty years into the future is, at best, a difficult project, and 36 Brian A. Weatherford, Henry H. Willis, and David S. Ortiz, Infrastructure, Safety, and Environment: A Review of Capacity and Performance Data, Rand Corporation, 2008, p. xii. 37 Mark l. Burton, “Measuring the Cost of Incremental Railroad Capacity: A GIS Approach,” http://www.njrati.org/files/research/papers/adobe/TPUG-01.pdf.
Executive Summary ES-31
the conclusions of the Cambridge Systematics study are sensitive to the economic projections that drive freight commodity flow forecasts, future decisions about plant locations, availability of other transportation modes, and changes in business operations.
Our analysis in Chapter 10 also indicates that in the aggregate the value of investments in railroad infrastructure is less than the current price of those investments. Thus, while investment opportunities on certain nodes or links may pass an economic benefit-cost test, there do not appear to be strong economic incentives for the railroad industry to make global or extensive infrastructure investments at this time. Our analysis in Chapter 8 also indicates that the railroad industry’s capital spending has remained a near-constant share of its revenue. This is similar to the pattern in the electric utilities industry, which is an industry similar to railroads in terms of infrastructure needs.
In Chapter 8, we compare the railroad industry’s capital spending patterns to the benchmark industries we examined.38 With the exceptions of 2002 and 2006, the railroad industry had the highest shares of its revenues devoted to capital spending. Figure ES-13 presents data on the capital spending to revenue ratios for the railroad and the electric utilities industries. This figure shows that the gap between the railroad and electric utilities industries considerably narrowed over time.
While railroad investment has increased in both real and nominal terms in recent years,39 there has been no increase in the railroad 38 The benchmark industries are electric utilities, freight transportation, food processing, and chemicals.
39 See Chapter 16.
Executive Summary ES-32
industry’s capital spending to revenue ratio induced by higher profits. One perspective is that, after a period of unusual activity, financial metrics reflect that the railroad industry is settling into a rate of capital expenditures that allows for maintenance and slow, steady growth.40
Railroad infrastructure may provide some public benefits that could potentially be addressed through targeted incentives. Investment in railroad infrastructure may provide an attractive transportation alternative to some shippers who currently rely on truck transportation for their shipping needs. Moving more truck transportation to rail would relieve highway congestion and reduce pollution. But these benefits will not influence a railroad’s investment decisions, which are driven solely by the railroad’s private return on investment. Public benefits do not factor into the railroad industry’s investment decisions.
ES4 IMPACT OF CAPACITY CONSTRAINTS ON COMPETITION
Stakeholder Feedback on Causes of Capacity Constraints As we report in Chapter 5, a generally held opinion among the
stakeholders who provided input to us is that the rail industry has gone from excess capacity to “tighter” capacity in the last few years. Other widely held opinions are that rail capacity investment is lagging demand growth (aside from cyclical or seasonal factors), and that railroads are using rate increases to ration scarce capacity and prioritize traffic on their networks. However, opinions differ regarding why capacity has tightened and the effects of this tightening.
• Some stakeholders are of the opinion that the lag in capacity growth is intentional and used by the railroads so they can raise rates—i.e., it is another aspect of the railroads’ exercise of market power. In this regard, some are of the opinion that railroads have been “sitting on their hands” regarding capacity investment until the last few years.
• A contrasting opinion is that lags in capacity additions are not the result of the exercise of market power, but these lags are viewed as normal for an industry when faced with making investment decisions of such magnitude. Individuals expressing this view observed that the industry has recently made a significant transition to tighter capacity after years of excess capacity where cost cutting and capacity reductions were the primary focus.
40John G. Larkin and Daniel S. Taylor, Railroads: Striving to Drive Improved Return on Invested Capital, Legg Mason Wood Walker, Inc., Summer 2004, p. 24.
Executive Summary ES-33
• Also adding to the investment lag, in some cases, is the involvement with the public sector—e.g., obtaining permits and/or funding.
Assessment of the Impact of Capacity Constraints As noted in Chapter 3, network industries, including the railroad
industry, often are capital-intensive and need to make capital investments in large increments. Furthermore, once these investments are made the capital is either costly to remove or its resale value is small. For these reasons, the amount of capital utilization at any one time will not necessarily be at its optimal level, resulting in either an excess or shortage of capacity.
In Chapter 16 we conclude that congestion at various points or corridors in railroad networks appears to be the major culprit in capacity-related performance issues over the last ten years, and not system-wide lack of capacity. This phenomenon is common in network industries as, for example, in communications networks congestion at network nodes constrains throughput despite almost limitless fiber optic capacity throughout the network. Also, as discussed below, in our stakeholder interviews it was expressed that tight capacity is often related to location-specific constraints in rail networks or in the wider transportation network that are beyond the control of railroads (e.g., ports, highways). Furthermore, our econometric evidence indicates that the price of capital is currently greater than capital’s value of marginal product, which implies that the railroad industry is not withholding cost-effective investment.
A concern expressed by several of the shippers we interviewed, and also raised in the GAO report,41 was that recent capacity constraints may have allowed or caused an increase in the market power of the railroads. Our analysis of the markup of rates over marginal costs, as reflected in the Lerner Markup Index, shows no major changes in the overall Lerner Markup Index since the late 1990s. At the commodity-specific level, we see little in the way of systematic changes in markups by commodity. Between the 2001-2003 and the 2004-2006 periods, we observe moderate increases in the Lerner Markup Index for barley, corn, wheat, and coal, while the LMI declines for aggregate farm products and the eleven other commodity groups in our analysis. Thus, we conclude that recent capacity constraints did not increase the overall exercise of market power by railroads, but coincided with some redistribution of relative markups across commodities.
41 Government Accountability Office, Freight Railroads: Industry Health Has Improved, but Concerns about Competition and Capacity Should Be Addressed, GAO-07-94, October 6, 2006, p. 3.
Executive Summary ES-34
ES5 SERVICE QUALITY ISSUES
Stakeholder Feedback on Service Quality As we report in Chapter 5, a number of shippers we interviewed
expressed the theme that service quality has deteriorated as rates have increased. (A caveat to this perception is that service has improved somewhat over the last few years when compared to 2004-2005). Many shippers stated that service variability is the most important issue and causes them the most problems. Much of the problem with service variability was attributed by these shippers to reductions in rail competition. Moreover, many shippers stated that new contracts rarely include any performance standards or penalties for not meeting standards, so there is an increasing lack of railroad accountability.
Part of the service quality issue was seen as an outcome of deteriorating communications between railroads and shippers. This communication problem appears to have several dimensions:
• Many shippers said that railroads were increasingly adopting a “take it or leave it” attitude.
• The greater use of internet-based communications versus direct access to railroad personnel.
• Inability of railroad bureaucracies to respond to changing conditions.
Two aspects of service quality brought up in our stakeholder interviews were additional costs placed on shippers because of service quality problems, and sources of service quality problems. The additional cost factors, which shippers claimed they incur as a result of railroad service quality problems, include:
• The need to hold additional inventories because of uncertain/variable deliveries. In this regard, some shippers said that consistency of service is more important than speed.
• The need to have larger fleets of railcars to ensure adequate deliveries.
• The need to dedicate shipper personnel to the monitoring of railroad performance.
• Congestion in ports caused by additional lead time used as a hedge against service variance.
Regarding the sources of service quality problems, the following were mentioned as possible causes or contributing factors:
Executive Summary ES-35
• Tight capacity and the “fragility” of the railroad network. Shippers expressed the opinion that with the railroad network operating at close to its capacity, it does not take much to upset the fluidity of the railroad network.
• Tight capacity is often related to location-specific constraints or “choke points” in rail networks.
• Rail service problems can also be related to congestion points in the wider transportation network—ports, terminals, highways—that are beyond the railroads’ control.
• Shipper-caused problems—e.g., slow unloading.
• Railroad management structures that impede the ability to improve service or solve problems despite good intentions. In this regard, we heard that railroads are good at serving “cookie cutter” business but have trouble when conditions deviate from the norm. We also heard that because railroads tend to be very large and dispersed businesses, it can be difficult for a railroad to ensure that decisions made at one level/location are actually carried out at lower levels or distant locations.
• Market-dominant firms can be less concerned with providing good service.
• One shipper stated that one reason rail service has deteriorated is because railroads are forcing routing protocols on shippers under the guise of operating efficiency, but these forced routes offer no better (or even worse) transit times than previously allowed routes.
Train Speed as an Indicator of Service Quality As discussed in Chapter 17, average train speed is a proxy for
service quality, and changes in average speed represent changes in performance and service quality. The Railroad Performance Measures (RPM) data allow us to calculate average train speeds across a railroad’s network but do not allow for route-specific or corridor-specific analysis, nor do the RPM data allow an evaluation of on-time performance or variability of performance from a shipper’s perspective.42 The average train speeds calculated from RPM data provide a crude, aggregate proxy for the railroad service performance received by shippers. Our Advisory Panel noted that railroads as well as many shippers record and keep data 42Association of American Railroads, at http://www.railroadpm.org/Definitions.aspx:
Train Speed measures the line-haul movement between terminals. The average speed is calculated by dividing train-miles by total hours operated, excluding yard and local trains, passenger trains, maintenance of way trains, and terminal time.
Executive Summary ES-36
on service metrics such as cycle times. While such information is likely confidential, it was suggested that the STB may need to require the reporting of this type of data—possibly by route or by commodity—to better identify and rectify service quality issues.43
Comparisons of changes in average speed across train types provide an indication of changes in service quality across customers of these train types.44 Figure ES-14 present changes in average speed by train type between January 1999 and September 2005 for each of the Class I railroads.45 Changes in service quality across shipper classes would be suggested if particular train types have changes in average speeds that are markedly different than the changes in average speeds of other train types. For example, in our stakeholder interviews, the opinion was expressed that high-margin services such as intermodal receive preferential service to the determinant of other commodity groups. Therefore, although it is admittedly at a very aggregate level, if we observe the average speed for intermodal increasing relative to the average speed of other train types, this would be evidence supporting the opinion voiced by theses stakeholders.
FIGURE ES-14 CHANGES IN AVERAGE SPEED BY RAILROAD AND TRAIN TYPE, 1999-2005
-5.0%
-4.0%
-3.0%
-2.0%
-1.0%
0.0%
1.0%
2.0%
3.0%
4.0%
5.0%
BNSF CN CP CSX KCS NS UP
All Inter modal Manifest Multi level Coal Unit Grain Unit
From Figure ES-14, there does not appear to be any strong bias toward intermodal, as its average speed declined for all railroads except 43 The STB’s Rail Energy Transportation Advisory Committee has formed a Performance Measure Subcommittee to investigate performance reporting.
44 Comparisons across railroads are not necessarily meaningful. 45 As we discuss in Chapters 16 and 17, definitional changes in RPM data implemented in October 2005 make comparisons of data before and after these changes problematic. Therefore, our analysis of RPM data is conducted for two separate periods.
Executive Summary ES-37
NS over the 1999-2005 period, and its speed worsened relative to the overall average for all the railroads.46 In fact, the change in intermodal’s speed was below the change in average speed of coal units and manifest for most railroads over this time period. Therefore, there does not appear to be any systematic bias in favor of intermodal shipments over this time period.
Variability in Average Speed by Train Type Not only do average speeds have implications for service quality,
but variability in speed is also important. In fact, one of the major complaints we heard from shippers regarding service quality was that variability in railroad performance was a larger problem than the absolute level of performance. Shippers found unpredictable service performance to be more costly and problematic to deal with than service that resulted in longer but predictable delivery performance.
The variability in average train speed by railroad and train type (and, presumably, the resulting variability in delivery performance to shippers) is measured by the coefficient of variation (CV), which is the ratio of the standard deviation of train speed to average train speed. Table ES-7 presents CVs of train speed by railroad and train type stated as a percent of average speed.47 For each railroad, examining CVs across train types reveals that the lowest CV in most cases is for intermodal, especially during the 1999 to September 2005 period. Grain units and coal units typically have the highest CVs. Thus, the implication is that even though its average speed generally declined over this period, intermodal typically received the most predictable service. On the other hand, coal units and grain units received the least predictable service.
46 This may be due, in part, to major construction projects noted elsewhere in this study. 47 Again, comparisons across railroads are not necessarily meaningful.
Executive Summary ES-38
TABLE ES-7 VARIABILITY IN AVERAGE TRAIN SPEED BY RAILROAD AND TRAIN TYPE
ES6 IMPLICATIONS FOR PROPOSED POLICY CHANGES The economic context in which we assessed the various recent
proposals for policy changes in the railroad industry is that there have been periods of both increasing and declining exercise of market power over the last twenty years. During that time frame, it does not appear that excess net revenues were generated in periods when the exercise of market power increased, as the railroad industry was attempting to achieve revenue sufficiency. Only in the most recent year of our analysis does industry revenue noticeably exceed industry cost, using our R-1 based measure. Furthermore, the recent increases in revenue per ton-mile appear to be largely the result of increases in fixed and marginal costs—related to increases in the railroad industry’s input prices and diminishing productivity growth—and not due to an increased exercise of market power. While recognizing that differential pricing and the exercise of local market power is necessary to achieve financial viability, in both our qualitative and quantitative research, we did find concerns about shipper captivity and railroad performance.
The 2006 GAO report discussed four open access proposals (three of which have been included in recently proposed legislation) to address competitive concerns: reciprocal switching agreements, requiring the quotation of bottleneck rates, terminal agreements, and trackage rights
Executive Summary ES-39
agreements. We examined these proposals in Chapter 22. Table ES-8 recreates our summary of the likely economic effects of these open-access proposals. The assumption made for each of these proposals is that, although these types of open-access arrangements would be mandated to some degree, the terms of access are allowed to be determined through voluntary negotiations between railroads, with STB oversight of the process. To the extent that the terms of access are set according to some legislative or regulatory formula that differs from the outcome of voluntary negotiations, the economic effects of these open-access proposals become less predictable.
TABLE ES-8 LIKELY ECONOMIC EFFECTS OF VARIOUS OPEN-ASSESS PROPOSALS
Most likely Least likely Most likely Somewhat likely
Shipper Gains Most likely Least likely Most likely Somewhat likely
Our assessment that, overall, the railroad industry is pricing at levels generating earnings that maintain or slightly exceed those necessary to ensure financial viability implies that there is little room to provide significant “rate relief” to certain groups of shippers without requiring increases in rates for other shippers or threatening the railroads’ financial viability. Thus, distributional effects among shipper groups, as well as between shippers and railroads, are primary considerations of proposed policy changes. While economic analysis may be able to quantify benefits and costs to specific stakeholders given more precise policy proposals, the cost/benefit balance is ultimately to be struck by policymakers.
Executive Summary ES-40
Given the current structure and performance of the railroad industry, we find that certain “open-access” proposals, such as reciprocal switching and terminal agreements, are more likely to create favorable economic benefit/cost conditions than more sweeping access reforms. Some policy initiatives such as requirements to offer bottleneck rates or trackage rights over any route segment, may not be workable due to coordination issues, or may not be effective because the economics of the proposed policy change (e.g., loss of length-of-haul economies, and/or vertical economies) are unlikely to produce the anticipated degree of competitive response.
For example, Figure ES-15 illustrates the stylized fact that length-of-haul economies are diminished as interchange between two railroads (assumed for the purpose of this illustration to be equally efficient) occurs further from an endpoint of a movement; the adverse effect on costs is maximized when the interchange occurs at the mid-point of the end-to-end movement. The magnitudes of the effects shown in Figure ES-15 are consistent with the length-of-haul effects on revenue per ton-mile estimated in our pricing models and, by implication, the length-of-haul effects on marginal costs. As we discuss in Chapter 22, reciprocal switching agreements, which occur a limited distance from an endpoint—indicated by the shaded areas in Figure ES-15—will result in higher costs per ton-mile on the short “bottleneck” segment relative to an end-to-end movement, but there will be relatively little loss of efficiency for the longer-haul segment. Thus, because they have lower risks of adverse cost consequences, we believe that “incremental” policies such as reciprocal switching and terminal agreements have a greater likelihood of resolving shipper concerns via competitive response, without leading to material adverse changes to railroad costs and efficiency.
Executive Summary ES-41
FIGURE ES-15 STYLIZED REPRESENTATION OF RAILROAD INTERCHANGE AND
LENGTH-OF-HAUL ECONOMIES
Nevertheless, we can identify certain proposals we believe would result in economic harm for both shippers and railroads, such as the implementation of cost standards in the STB’s rate review process that are based on economically discredited methodologies, and a strictly quantitative assessment of market dominance based solely on the R/VC ratio. Regarding the assessment of market dominance using R/VC alone, the weak relationships between R/VC ratios and market structure factors imply that correctly assessing the presence of market-dominant behavior requires direct assessment of relevant market structure factors as in the current regulatory scheme. Thus, regulatory changes that would establish R/VC tests as the sole quantitative indicator of a railroad’s market dominance would not be appropriate.
We also recognize that policies to introduce greater competition in the railroad industry will not necessarily benefit all shippers. Some shippers are truly captive because of factors such as geographic location and/or low shipper density. Therefore, effective regulatory oversight will still be important regardless of any efforts to induce greater competitive responses in the railroad industry. Improvements in the STB’s oversight and processes, such as the recent efforts to improve its simplified methods, are important. Also, as discussed in Chapter 22, to the extent the threat or possibility of final offer arbitration promotes parties to negotiate and reach voluntary agreements or resolve disputes, as suggested by a number of stakeholders we interviewed, it would improve the functioning of private
markets without imposing additional regulatory burdens. However, if matters are not resolved between parties and matters do go to arbitration, there are real concerns whether the process will produce outcomes consistent with competitive market outcomes, particularly if arbitrators are not experienced in the complexities of railroad economics. Additionally, factors such as improved reporting of service quality data in industry service metrics and shipment-level CWS data can lead to a better understanding of railroad performance and shipper behavior.
In order to succeed, any of the policy reform proposals must address important implementation details. Based on the experiences of the railroad industry and other industries with legislated access policies, the most challenging and time-consuming aspects of implementing policy changes is working out the details of access terms and pricing, and doing so in a way that enhances, not diminishes, economic efficiency. Not only can the terms of access have an effect on the degree to which open access occurs, but it can have important effects on incumbents’ investment behaviors. None of the current policy proposals address these details and, therefore, the risks entailed in implementing these policies as written carry the very real possibility of unintended and economically harmful outcomes.
ES7 CONCLUSIONS AND FUTURE RESEARCH DIRECTIONS This report presents the findings of an independent study of the
competitive state of the U.S. freight railroad industry performed by the study team assembled by Christensen Associates and commissioned by the U.S. Surface Transportation Board (STB). Over the course of this 14-month study, the Christensen Associates study team has received cooperation from the STB and numerous railroad industry stakeholders including railroads, various shipper group organizations, numerous individual shippers, government organizations, academics, and other stakeholders. While valuable insights and assistance were obtained by the study team through this process, no individual, government agency, railroad, shipper, or any other industry stakeholder has exerted any influence on the findings of this study. The findings presented and conclusions reached in this report represent the professional judgments and opinions of the Christensen Associates railroad study team.
In addition to the research the Christensen Associates study team performed in the course of our year-long study and our conclusions from that research, we believe there are a number of areas where future research efforts would improve the understanding of the U.S. freight railroad industry. A number of these potential research issues came up during the course of our stakeholder interview process but were outside the scope of the current study. In the case of some issues, the current lack of adequate data prevents a thorough empirical examination. We see other areas as a
Executive Summary ES-43
natural extension of the research we have performed for this study. The topical list below is in no particular order of importance, nor is it meant to be an exhaustive list of pertinent topics in the railroad industry that merit further investigation.
Captivity and Effective Competition The weak relationships we found between R/VC ratios and market
structure factors imply that correctly assessing the presence of market-dominant behavior requires direct assessment of relevant market structure factors. A better empirical understanding of the economic dimensions of rail shipper captivity is critical, particularly in light of proposed regulatory reforms that would establish R/VC tests as the sole quantitative indicator of a railroad’s market dominance.
Service Quality To evaluate many of the shippers’ service quality concerns at more
than aggregate or anecdotal levels, data that capture service performance metrics at a disaggregate level are necessary. As we noted, one member of our Advisor Panel indicated to us that railroads as well as many shippers record and keep data on service metrics such as cycle times. While such information is likely confidential, it was suggested that the STB may need to require the reporting of this type of data—possibly by route or by commodity—to better identify and rectify service quality issues. As one step in this direction, perhaps the reporting of complaint statistics on the STB website could be expanded (without breaching confidentiality).
Capacity Another area that would benefit from a more disaggregate analysis
is railroad capacity, particularly given our conclusion that capacity “tightness” issues have most likely been due to localized congestion and constraints, and not because of a system-wide lack of capacity. Also, more disaggregated RPM-type data on railroad performance would be helpful to better investigate capacity issues as well as service quality concerns. Another aspect of railroad capacity that was brought up in our stakeholder interview process is whether railroad equipment markets operate efficiently, supplying the appropriate amount of equipment.
Cost Shifting A number of stakeholders indicated to us that there has been a
significant amount of “cost shifting” in recent years, whereby costs or investments that were previously undertaken by railroads are now the burden of shippers. Examples of cost shifting to shippers include increases in investments in track and storage facilities, loading and unloading
Executive Summary ES-44
facilities, car ownership and maintenance, and accessorial charges. We have been able to examine some of these issues—for example, the increase in third-party car ownership and our empirical results that indicate rates are generally lower across a number of commodity groups when shipper-owned cars are used. However, many of the cost-shifting issues appear to require additional data to enable a thorough empirical investigation. To the extent such issues are critical to shippers, the STB may consider requesting that appropriate data be made available to investigate these cost-shifting concerns.
Fuel Surcharges Although the STB has recently begun to collect data on fuel
surcharges, these data have not been collected long enough at this point in time to perform a reasonable analysis. For example, the effectiveness of the new STB rules on fuel surcharges has yet to be fully evaluated.
Issues Related to Class II and Class III Railroads As discussed in Chapter 5, some smaller railroads expressed a
number of concerns, including the relationship between smaller and Class I railroads with respect to Class I’s “cherry-picking” traffic, and Class I’s offering non-competitive rates. In addition, because many smaller railroads have had to undertake significantly greater investments (proportionately speaking) than Class I railroads, the question is whether shortline networks are underfunded.
Critical Evaluation of Rail Demand Growth Projections There are a number of studies that project a widening gap between
the demand for rail services and railroad capacity. These demand projections provide a basis for projecting investment needs and support for the importance of continued railroad earnings growth. Because of the important implications of these demand projections, there needs to be a critical evaluation of these projections and future rail capacity needs.
Reduction in Railroad Network Access A concern expressed to us by a number of agricultural shippers
was the reduction in railroad network access points. As discussed in Chapter 5, potential research questions here include the extent of reduced access, whether it has resulted in railroad efficiency gains and overall benefits to shippers, and whether it has shifted costs to other modes of transportation (such as increased highway maintenance costs).
Executive Summary ES-45
EXECUTIVE SUMMARY REFERENCES Association of American Railroads, “Class I Railroad Statistics,” July 17, 2008.
Association of American Railroads, “The Economic Impact of America’s Freight Railroads,” August 2008.
Association of American Railroads, “The Effects of Rail Mergers on the Number of Class I Railroads and Shipper Captivity,” August 2008.
Association of American Railroads, “Petition of the Association of American Railroads to Institute a Rulemaking Proceeding to Adopt a Replacement Cost Methodology to Determine Railroad Revenue Adequacy,” Motion filed with the STB, May 1, 2008.
Association of American Railroads, Railroad Performance Measures covering the 1987 through 2006 time frame, found at http://www.railroadpm.org/.
Association of American Railroads, “Railroad Ten-Year Trends: 1980-1989,” Vol. 7.
Association of American Railroads, “Railroad Ten-Year Trends: 1990-1999,” Vol. 17.
Association of American Railroads, “Railroad Ten-Year Trends: 1997-2006,” Vol. 24.
Association of American Railroads, “Railroads and Coal,” July 2008.
Association of American Railroads, “Railroads and Grain,” July 2008.
John D. Bitzan and Theodore Keeler, “Economies of Density and Regulatory Change in the U.S. Railroad Freight Industry,” Journal of Law and Economics, February 2007, pp. 157-179.
Mark L. Burton, “Measuring the Cost of Incremental Railroad Capacity: A GIS Approach,” at http://www.njrati.org/files/research/papers/adobe/TPUG-01.pdf.
Cambridge Systematics, National Rail Freight Infrastructure Capacity and Investment Study, prepared for the Association of American Railroads, September 2007.
Ann F. Friedlaender, Ernst R. Berndt, Judy S. W. Chiang, Mark Showalter, and Christopher A. Vellturo, “Rail Costs and Capital Adjustments in a Quasi-Regulated Environment,” Journal of Transport Economics and Policy, 27(2), May 1993, pp. 131-152.
Executive Summary ES-46
Government Accountability Office, Freight Railroads: Industry Health Has Improved, but Concerns about Competition and Capacity Should Be Addressed, GAO-07-94, October 6, 2006.
John G. Larkin and Daniel S. Taylor, Railroads: Striving to Drive Improved Return on Invested Capital, (Baltimore, MD: Legg Mason Wood Walker, Inc.), 2004.
James McClellan, “Railroad Capacity Issues,” in Research to Enhance Rail Network Performance, Transportation Research Board, 2007.
Surface Transportation Board, Class I Railroad Annual Report (Form R-1), Reports filed by all Class I railroads, 1987 through 2006.
Surface Transportation Board, Uniform Rail Costing System, described at http://www.stb.dot.gov/stb/industry/urcs.html.
STB Rate Guidelines–Non-Coal Proceedings, Ex Parte No. 347 (Sub No. 2) (STB served December 31, 1996).
U.S. Department of Transportation, “National Transportation Statistics,” 2008.
Brian A. Weatherford, Henry H. Willis, and David S. Ortiz, Infrastructure, Safety, and Environment: A Review of Capacity and Performance Data, Rand Corporation, 2008.